Article

Surface Deformation Monitoring and Subsidence Risk Zonation Along the Middle Route of the South-to-North Water Diversion Project Coupling Time-Series InSAR with AHP-FCE


1
School of Geographic Science and Tourism, Nanyang Normal University, Nanyang 473000, China
2
Engineering Research Center of Environmental Laser Remote Sensing Technology and Application of Henan Province, Nanyang Normal University, Nanyang 473061, China
3
Collaborative Innovation Center of Intelligent Explosion-Proof Equipment of Henan Province, Nanyang Normal University, Nanyang 473061, China
4
State Key Laboratory of Information Engineering in Surveying, Mapping and Remote Sensing, Wuhan University, Wuhan 430079, China
5
Henan International Joint Laboratory of Watershed Ecological Security in the Water Source Area of the Middle Route of South-to-North Water Diversion Project, College of South to North Diversion, Nanyang Normal University, Nanyang 473061, China
6
College of Water Resource and Modern Agriculture, Nanyang Normal University, Nanyang 473061, China
7
Department of Botany and Plant Sciences, University of California, Riverside, CA 92521, USA
*
Author to whom correspondence should be addressed.
Remote Sens. 2026, 18(16), 2766; https://doi.org/10.3390/rs18162766
Submission received: 1 July 2026 / Revised: 10 August 2026 / Accepted: 14 August 2026 / Published: 16 August 2026

Highlights

What are the main findings?
  • A connectivity-aware multiscale down-sampling phase unwrapping strategy is proposed to overcome phase segmentation along the water canal, reducing the root-mean-square error of retrieved deformation velocity to 5.7 mm/y.
  • An AHP-FCE assessment model integrating radar kinematic characteristics with multi-source environmental factors is constructed to achieve quantitative land subsidence risk zonation, successfully identifying 114.6 km of very-high-risk zones.
What are the implications of the main findings?
  • Sensitivity analysis and multiscale evaluation support the stability of the risk assessment framework under weight perturbations, providing a practical spatial mapping approach for ultra-long linear infrastructure.
  • The findings bridge the technical gap between macroscopic geodetic monitoring and quantitative infrastructure hazard risk assessment, providing critical decision data for the digital twin construction and safe operation and maintenance of water diversion projects.

Abstract

The Middle Route of the South-to-North Water Diversion Project (SNWD-MR) serves as a strategic infrastructure critical to safeguarding water security in Northern China. Traversing complex geographical units, the project is perpetually exposed to long-term risks of land subsidence. Conventional Interferometric Synthetic Aperture Radar (InSAR) monitoring is hampered by waterbody isolation, causing spatial discontinuities in the retrieved deformation fields; furthermore, relying solely on deformation metrics fails to comprehensively quantify multidimensional risks. To address these issues, this study proposes an integrated assessment framework that couples time-series InSAR observations with the Analytic Hierarchy Process-Fuzzy Comprehensive Evaluation (AHP-FCE) model. To specifically mitigate the challenge of waterbody isolation, we developed a connectivity-aware multiscale down-sampling phase unwrapping strategy. By exploiting cross-canal bridges to construct a spatial connection network, a highly accurate, spatiotemporally continuous deformation field across the entire alignment was successfully reconstructed. Using the derived deformation field as the core dynamic indicator, an AHP-FCE model integrating hydrogeological features and human perturbations was constructed. A complementary evaluation process comprising sensitivity analysis and an internal physical consistency assessment was subsequently implemented. The results demonstrate that (1) the proposed algorithm effectively resolves the spatial discontinuity issue of the cross-canal deformation fields, reducing the deformation-velocity RMSE from 7.9 to 5.7 mm/y, corresponding to an approximately 27.8% reduction in RMSE relative to the traditional Minimum Cost Flow (MCF) method; (2) land subsidence along the alignment exhibits prominent spatial heterogeneity, with the northern Henan and southern Hebei sections identified as very-high-risk zones; and (3) InSAR deformation magnitude and the groundwater elevation indicator emerge as the most influential factors in the modeled risk distribution. Overall, this study expands conventional deformation monitoring into a systematic, quantitative risk assessment framework, thereby providing scientific insights and theoretical support for the early warning of geo-hazards and the smart operation and maintenance of large-scale water diversion projects.

1. Introduction

Spanning a total length of 1432 km, the Middle Route of the South-to-North Water Diversion (SNWD-MR) project serves as a strategic infrastructure essential for safeguarding water security in northern China [1]. As a cross-regional linear engineering project, it traverses highly complex geological environments. Specifically, the route intersects multiple intricate geological units, including the Huang-Huai-Hai Plain, which are characterized by the widespread distribution of expansive soils, collapsible loess, and deep Quaternary unconsolidated sedimentary layers [2,3,4,5,6,7]. Furthermore, the North China Plain has long suffered from groundwater overexploitation, with localized areas experiencing the superimposed impacts of intensive mining and urban development activities [4,5,6,7,8]. Driven by the compounding effects of these intrinsic environmental constraints and extrinsic dynamic variables, land subsidence has emerged as the primary geohazard inducing structural damage to canal and auxiliary facilities along the route [8,9,10,11,12,13,14,15,16,17,18,19,20]. Consequently, the large-scale, high-precision early identification of deformation anomalies and the comprehensive assessment of subsidence risks are of paramount importance.
Regarding deformation monitoring, time-series InSAR (TS-InSAR) technology is widely employed for large-scale surface deformation observations owing to its extensive coverage and high precision [21,22,23,24,25,26,27,28,29]. In recent years, this technology has been progressively applied to monitor subsidence along the South-to-North Water Diversion (SNWD) project and its surrounding areas [2,8,9,10,11,12,13,14,15,16,17,18,19,20]. However, when applying conventional InSAR techniques to long-distance water diversion infrastructure, several technical challenges persist. Due to variations in surface cover along the route, radar signals are highly susceptible to decorrelation, leading to the spatial separation of coherent targets [2,3,13,14,21,30,31,32,33]. This isolation of phase unwrapping units induced by water barriers often causes reference point inconsistencies or error accumulation when conventional phase unwrapping methods are applied across the canal, ultimately hindering the retrieval of spatially continuous deformation fields [28,29,34,35,36,37].
Phase unwrapping research has progressed from network-flow formulations such as the minimum-cost-flow method [34] to coherence-optimized time-series processing [35] and, more recently, deep-learning approaches that fuse phase-gradient information or predict phase discontinuities [36,37]. Nevertheless, persistent water barriers can partition coherent pixels into disconnected components, preventing reliable propagation of a common phase reference across the canal. This limitation motivates the connectivity-aware multiscale strategy developed in this study.
Furthermore, although the deformation rate is a crucial metric for risk assessment, a single indicator is insufficient to comprehensively capture the complex conditions driving geological risks [38,39,40,41,42,43,44,45,46,47]. Similar subsidence velocities can exert vastly different actual impacts on engineering structures depending on the depth to bedrock, groundwater elevations, and anthropogenic activities. Therefore, conducting a comprehensive risk assessment necessitates integrating InSAR deformation with multi-source environmental factors. In recent years, Multi-Criteria Decision-Making (MCDM) models, typified by the Analytic Hierarchy Process (AHP), have been increasingly introduced into evaluation studies within the fields of hydraulic engineering and environmental geology [40,41,42,43,44,45,46,47]. However, current risk assessments for the SNWD project predominantly rely on static geological and environmental indicators. Studies that incorporate dynamic InSAR deformation results as a core evaluation factor—coupled with methods like AHP to conduct comprehensive assessments at the scale of long-distance engineering projects—remain relatively scarce [42,45,46,47].
Driven by these considerations, this study proposes a comprehensive assessment framework that integrates deformation inversion with multi-source factor evaluation. First, to overcome the phase unwrapping challenges posed by water bodies, a connectivity-aware, multiscale down-sampling phase unwrapping strategy is introduced to acquire spatially continuous deformation fields across the canal. Second, utilizing these InSAR-derived deformation results as core dynamic evaluation factors, we construct a comprehensive subsidence risk assessment model based on the Analytic Hierarchy Process and Fuzzy Comprehensive Evaluation (AHP-FCE). Furthermore, to evaluate the stability, uncertainty, and physical coherence of the proposed model, we conduct weight perturbation tests, sensitivity analysis, Monte Carlo simulations, cross-method comparisons, and deformation-distribution analysis. This research aims to provide a quantitative methodological reference for the monitoring of surface deformation and the spatial risk assessment of long-distance water diversion infrastructure.

2. Materials and Methods

2.1. Study Area

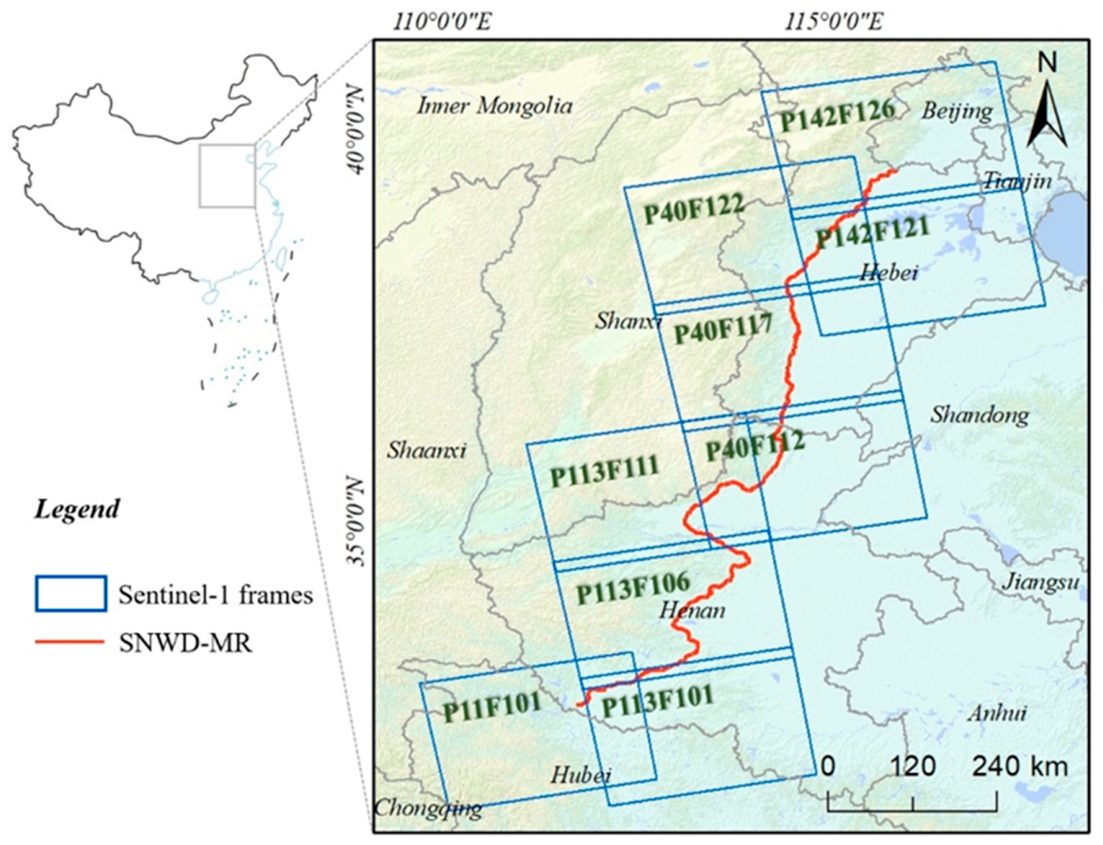
The study area primarily focuses on the corridor along the main canal of the SNWD-MR (Figure 1). The route exhibits a descending elevation gradient from south to north, gradually transitioning into the North China Plain. The geological environments and engineering conditions along the canal are characterized by profound spatial heterogeneity. Specifically, the Nanyang segment faces acute challenges related to expansive soils [2,3]. In contrast, the North China Plain segment is predominantly impacted by regional land subsidence triggered by groundwater overexploitation [4,5,6,7,8,19,20]. Furthermore, localized areas along the route, including Jiaozuo, Xinxiang, Pingdingshan, and Handan, are significantly affected by the compounding impacts of intense mining activities, urban expansion, and infrastructure construction [10,12,13,18,19,20].

2.2. Data Source

In this study, a comprehensive database was constructed, integrating radar remote sensing, hydrogeological, geo-environmental, anthropogenic, and meteorological data. The core datasets consist of ascending Sentinel-1 Synthetic Aperture Radar (SAR) imagery acquired in Interferometric Wide-swath (IW) mode from 2017 to 2023, encompassing a total of 1773 scenes distributed across 9 frames (Table 1).
The digital elevation model used in this study was the Shuttle Radar Topography Mission (SRTM) DEM, with a nominal spatial resolution of 30 m. The DEM was used for topographic-phase removal during the interferometric processing.
External validation was performed using Global Navigation Satellite System (GNSS) observations from the BeiDou Ground-Based Augmentation System. The GNSS records covered the period from January 2020 to December 2022, whereas the Sentinel-1 InSAR observations extended from January 2017 to December 2023.
The auxiliary datasets encompass the corresponding hydrogeological conditions, geo-environmental settings, human activities, and meteorological records used in the risk assessment. For the mining-related factor, mine locations were extracted as point features from the mineral resource maps and used as the source data for constructing a continuous mine-site-density raster. Details of the evaluation indicators and their data sources are provided in Table 2:

2.3. Connectivity-Aware Multiscale Down-Sampling InSAR Phase Unwrapping Strategy

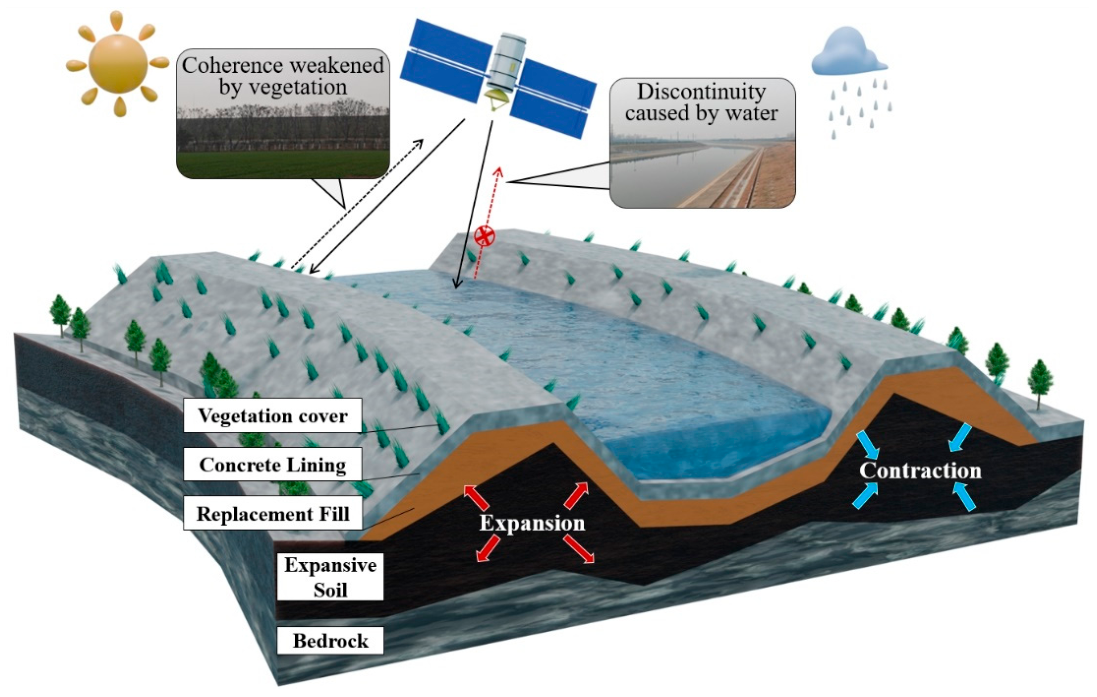
Applying InSAR technology for deformation monitoring along the SNWD-MR encounters two major challenges (as illustrated in Figure 2). First, severe decorrelation is induced by slope vegetation. The complex land cover along the route degrades the coherence of radar echoes, posing a significant challenge to accurate deformation inversion [21]. To address this, this study adopts an improved Small Baseline Subset (SBAS) approach [35]. Instead of relying on traditional spatiotemporal baseline criteria, all possible interferometric pairs were ranked in descending order according to their mean coherence calculated over all valid pixels within each SAR frame. The top 2% were retained to ensure the overall coherence quality of the interferometric network. Second, the water barrier across the canal leads to phase unwrapping discontinuities. Specifically, for the SNWD-MR, the 50 m wide canal, characterized by stable water flow patterns, results in decorrelation over the water surface, thereby disrupting the spatial integration paths required for phase unwrapping [21,36,37]. Consequently, conventional methods are highly susceptible to reference point inconsistencies between the two canal banks and spatial discontinuities, which severely degrades the inversion accuracy of the cross-canal deformation fields.
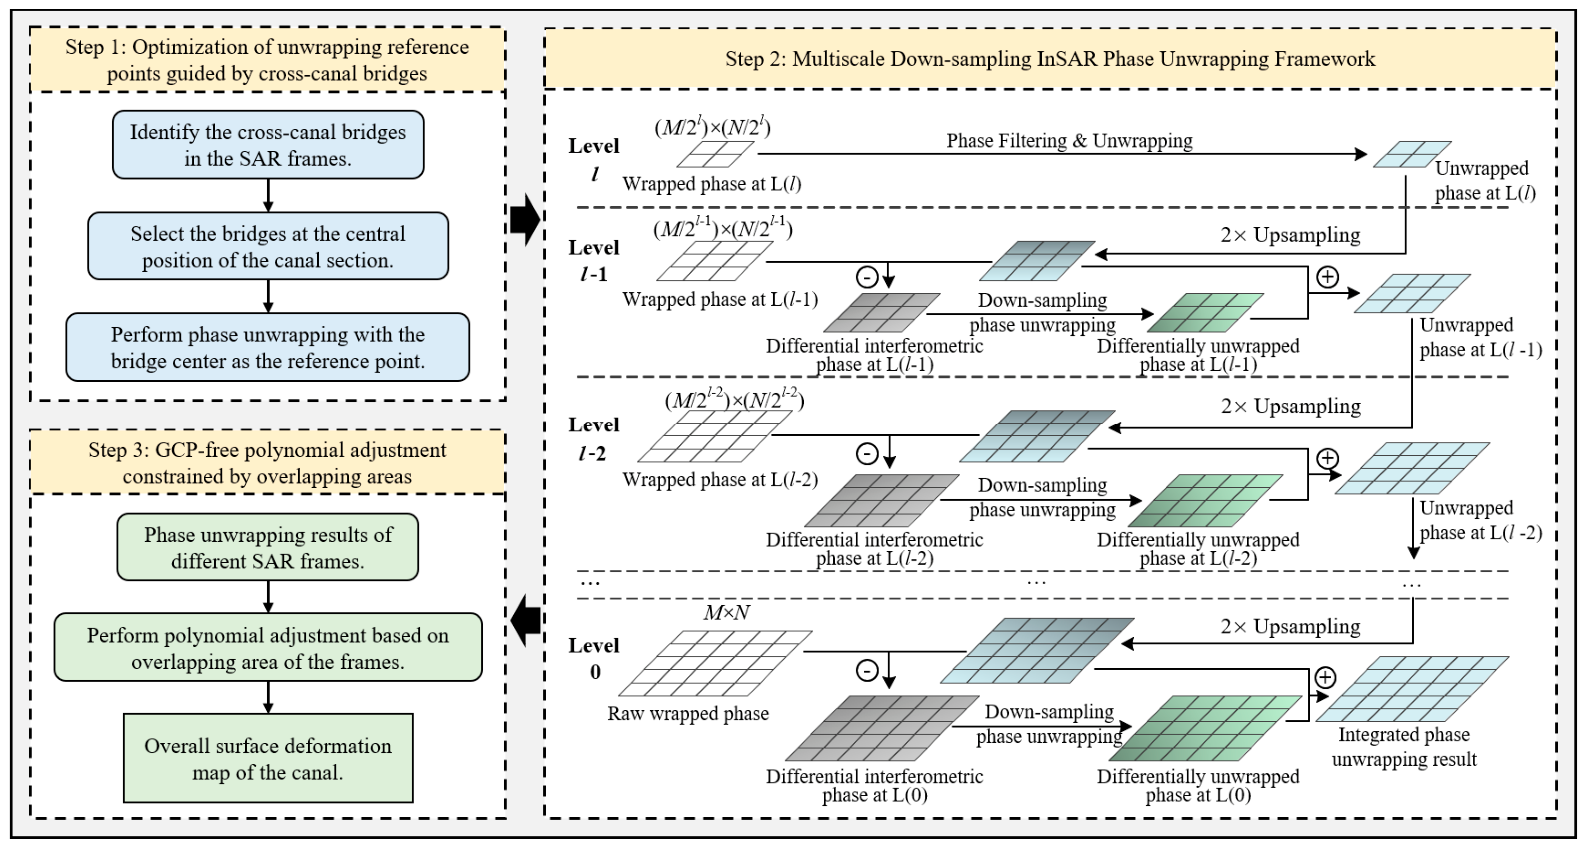
To overcome this challenge, this study proposes a connectivity-aware, multiscale down-sampling InSAR phase unwrapping strategy. The conceptual framework is illustrated in Figure 3, with the specific procedures detailed as follows:
Step 1: optimization of unwrapping reference points guided by cross-canal bridges.
Recognizing the critical role of reference points in phase unwrapping, cross-canal bridges were used to establish spatial connections between the two canal banks. As physical structures connecting both banks, these bridges generally exhibit stable deformation characteristics and high radar coherence [31,32,33]. Through visual interpretation of high-resolution optical imagery, a total of nine cross-canal bridges were identified within the nine Sentinel-1 SAR frames. Candidate bridges were required to connect both canal banks, exhibit bridge-area coherence greater than 0.7, and show stable deformation without evident localized anomalies. For each SAR frame, the geometrical midpoint of the canal segment within the frame was determined, and the qualified bridge closest to this midpoint along the canal was selected as the unwrapping reference. The geographic coordinates and corresponding SAR range and azimuth coordinates of the selected reference bridges are provided in Table 3. All nine SAR frames contained a qualified bridge; therefore, no alternative reference procedure was required in this study. The subsequent multiscale phase-unwrapping procedure is described in Step 2.
Step 2: multiscale down-sampling InSAR phase unwrapping framework.
To resolve the width disparity between the cross-canal bridges and the canal itself, this study introduces the concept of down-sampling phase unwrapping, employing a multi-level, progressive down-sampling method guided by multilooking factors to govern the phase unwrapping process. Specifically, the algorithm initiates the unwrapping at a low-resolution level, utilizing the unwrapped phases of the cross-canal bridges as spatial constraints to guarantee a unified unwrapping reference. Subsequently, the unwrapped results from the previous level are progressively propagated to the subsequent finer levels, serving as constraints to guide the phase unwrapping at higher resolutions. This progressive constraint and propagation strategy effectively mitigates the accumulation of unwrapping errors, ensuring the robustness and accuracy of the results. Finally, the high-precision phase unwrapping details are fully restored at the original full-resolution scale (Level 0, with a 40 m grid size), facilitating the precise inversion of deformation information.
For pyramid level k, the multilooking factor is 2 k and the corresponding grid spacing is therefore Δk = 40 × 2 k m in both range and azimuth; Level 0 represents the original 40 m grid, Level 1 an 80 m grid, and Level 2 a 160 m grid.
Assuming the phase of an interferogram is ϕ , with range and azimuth sampling numbers of M and N , respectively, the phase ϕ is processed through l levels. In this process, the original interferogram phase ϕ is defined as Level 0 with a multi-look number of 1. For level k   ( 0 k l ) , the multi-look number is set to 2 k , thereby forming a total of l + 1 levels. The range sampling number m and azimuth sampling number n at the highest level, denoted as ϕ l , are M / 2 l and N / 2 l , respectively.
ϕ   l = ( ϕ   l i , j ) n × m
Then, the interferometric phase ϕ l is unwrapped into φ l ,
φ   l = ( φ   l i , j ) n × m
Afterwards, a bilinear interpolation algorithm is applied to perform a two-fold oversampling on φ l i , j , resulting in [ φ 2 i 1 , 2 j 1 l 1 φ 2 i 1 , 2 j l 1 φ 2 i , 2 j 1 l 1 φ 2 i , 2 j l 1 ] . Applying the same processing to all elements in φ l yields the phase matrix φ l 1 ,
φ   l 1 = [ φ 1 , 1   l 1 φ 1 , 2   l 1 φ 2 , 1   l 1 φ 2 , 2   l 1 φ 1 , 2 m 1   l 1 φ 1 , 2 m   l 1 φ 2 , 2 m 1   l 1 φ 2 , 2 m   l 1 φ 2 n 1 , 1   l 1 φ 2 n 1 , 2   l 1 φ 2 n , 1   l 1 φ 2 n , 2   l 1 φ 2 n 1 , 2 m 1   l 1 φ 2 n 1 , 2 m   l 1 φ 2 n , 2 m 1   l 1 φ 2 n , 2 m   l 1 ]
The phase matrix has a range sampling number of 2 m and an azimuth sampling number of 2 n , and its scale is consistent with the phase matrix ϕ l 1 at level l 1 . The matrix ϕ l 1 contains the topographic error phase at level l 1 , which can be affected by factors such as the accuracy and low resolution of the external digital elevation model (DEM), leading to phase gradients exceeding 2 π and introducing unwrapping errors.
In contrast, φ l 1 is the unwrapped phase containing topographic errors, obtained by applying bilinear interpolation to the phase matrix φ l from the previous level. Its ability to represent phase details is weaker than that of ϕ l 1 . However, if we perform a differencing operation between ϕ l 1 and φ l 1 , as shown in the following equation, the resulting phase component Δ l 1 ϕ exhibits reduced topographic phase gradients, thereby avoiding unwrapping errors caused by phase gaps. Here, 2 π denotes the modulo-2 π operator.
Δ   l 1 ϕ = ( Δ   l 1 ϕ i , j ) 2 n × 2 m = ( ϕ   l 1 i , j φ   l 1 i , j 2 π ) 2 n × 2 m
Subsequently, Δ l 1 ϕ undergoes filtering and unwrapping to obtain the unwrapped phase matrix Δ l 1 φ . By summing φ l 1 and Δ l 1 φ , the final unwrapped phase result at level l 1 , denoted as φ l 1 , is achieved. This indirect phase unwrapping approach effectively mitigates unwrapping errors caused by phase gaps that would occur in direct unwrapping processes.
φ   l 1 = φ   l 1 + Δ   l 1 φ                                                                                   = (     l 1 φ i , j ) 2 n × 2 m + ( Δ   l 1 φ i , j   ) 2 n × 2 m                   = (     l 1 φ i , j ) 2 n × 2 m
This process is iteratively applied to the interferometric phase at level k ( 0 k < l ) , denoted as ϕ k = ( ϕ k i , j ) ( l k + 1 ) n × ( l k + 1 ) m , until the unwrapping of the interferometric phase at level 0 is completed. The final result represents the unwrapped solution for the original interferometric phase ϕ .
Step 3: GCP-free polynomial adjustment constrained by overlapping areas.
To eliminate systematic errors introduced into the initial unwrapping values by inter-frame reference discrepancies, this study performs a ground control point (GCP)-free polynomial adjustment leveraging the overlapping regions of adjacent image frames. This technique successfully establishes a unified unwrapping reference datum across the entire domain, thereby ensuring the spatiotemporal consistency of the canal deformation field. Ultimately, the spatially continuous deformation velocity field derived from this multiscale phase unwrapping serves as the most direct dynamic indicator of potential geohazards within the system and is directly integrated into the subsequent safety risk assessment model.
For the GNSS validation, the comparison was restricted to the common observation period from January 2020 to December 2022. The three-dimensional GNSS displacement vectors were first projected onto the Sentinel-1 line-of-sight (LOS) direction to ensure comparability with the InSAR measurements [22,23,24,25,26,27,28,29]. Using the GNSS station coordinates, InSAR displacement values from all raster images within the common period were extracted using the Extract Multi Values to Points tool in ArcGIS 10.8. The value of the colocated raster cell was used directly, without neighborhood averaging. Stations without valid InSAR observations were excluded, leaving 128 valid paired stations, and no additional post hoc outlier exclusion was applied. Deformation rates for both datasets were then calculated over the same period. The validation statistics included the mean bias, mean absolute error (MAE), root mean square error (RMSE), Pearson correlation coefficient, and the two-sided 95% confidence interval (CI) of the mean residual. The residual was defined as the InSAR deformation rate minus the GNSS deformation rate.

2.4. Construction of the AHP-FCE-Based Subsidence Risk Assessment Model

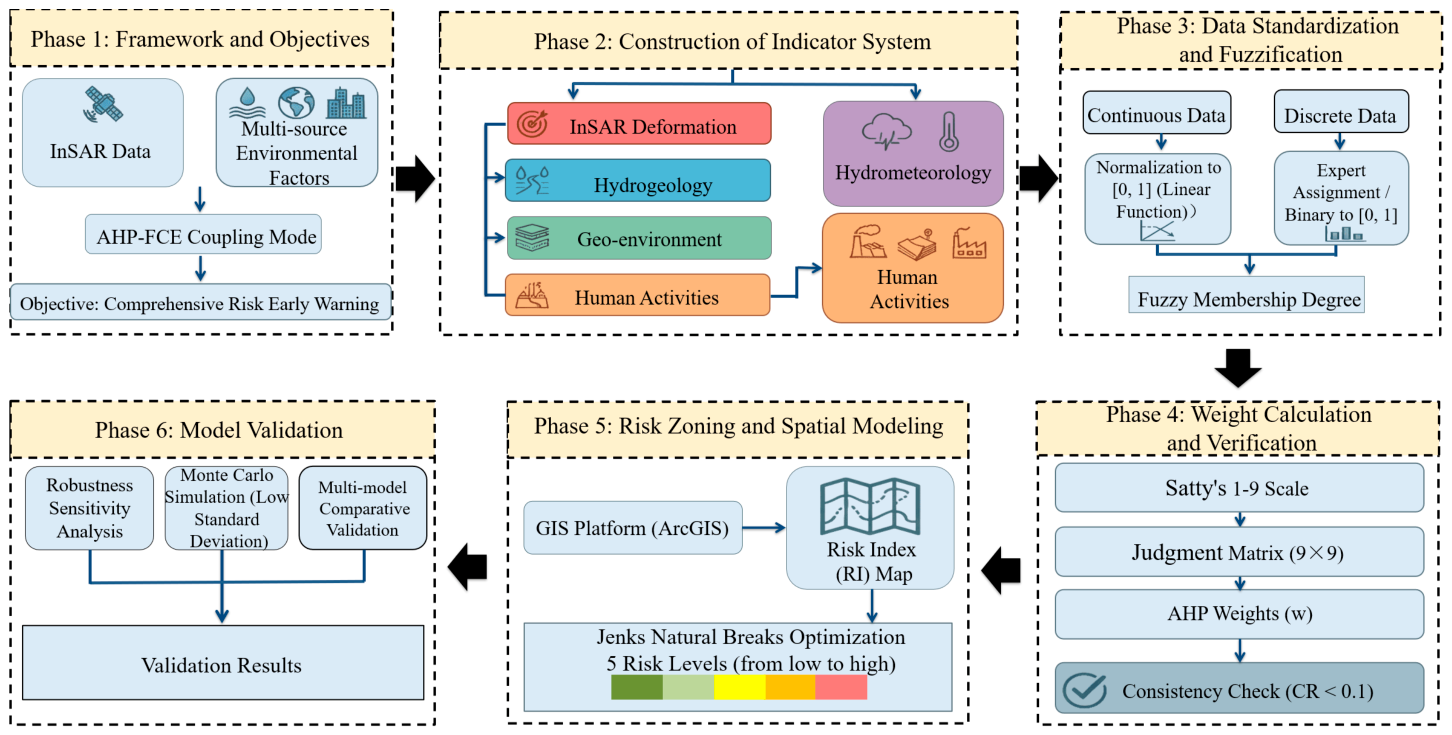
To integrate the dynamic deformation with the specific environmental context of the SNWD-MR project, this study developed a multi-criteria risk assessment framework based on AHP-FCE (Figure 4). Through spatial semantic mapping, this framework achieves a deep integration of intrinsic environmental baselines, engineering characteristics, and anthropogenic disturbances. The overall workflow encompasses the following sequential steps: construction of the evaluation indicator system, data standardization, AHP weighting and consistency testing, FCE-based spatial zonation, stability and uncertainty analyses, cross-method comparison, and internal physical consistency assessment. These procedures are detailed as follows:

2.4.1. Evaluation Indicator System and Weight Allocation

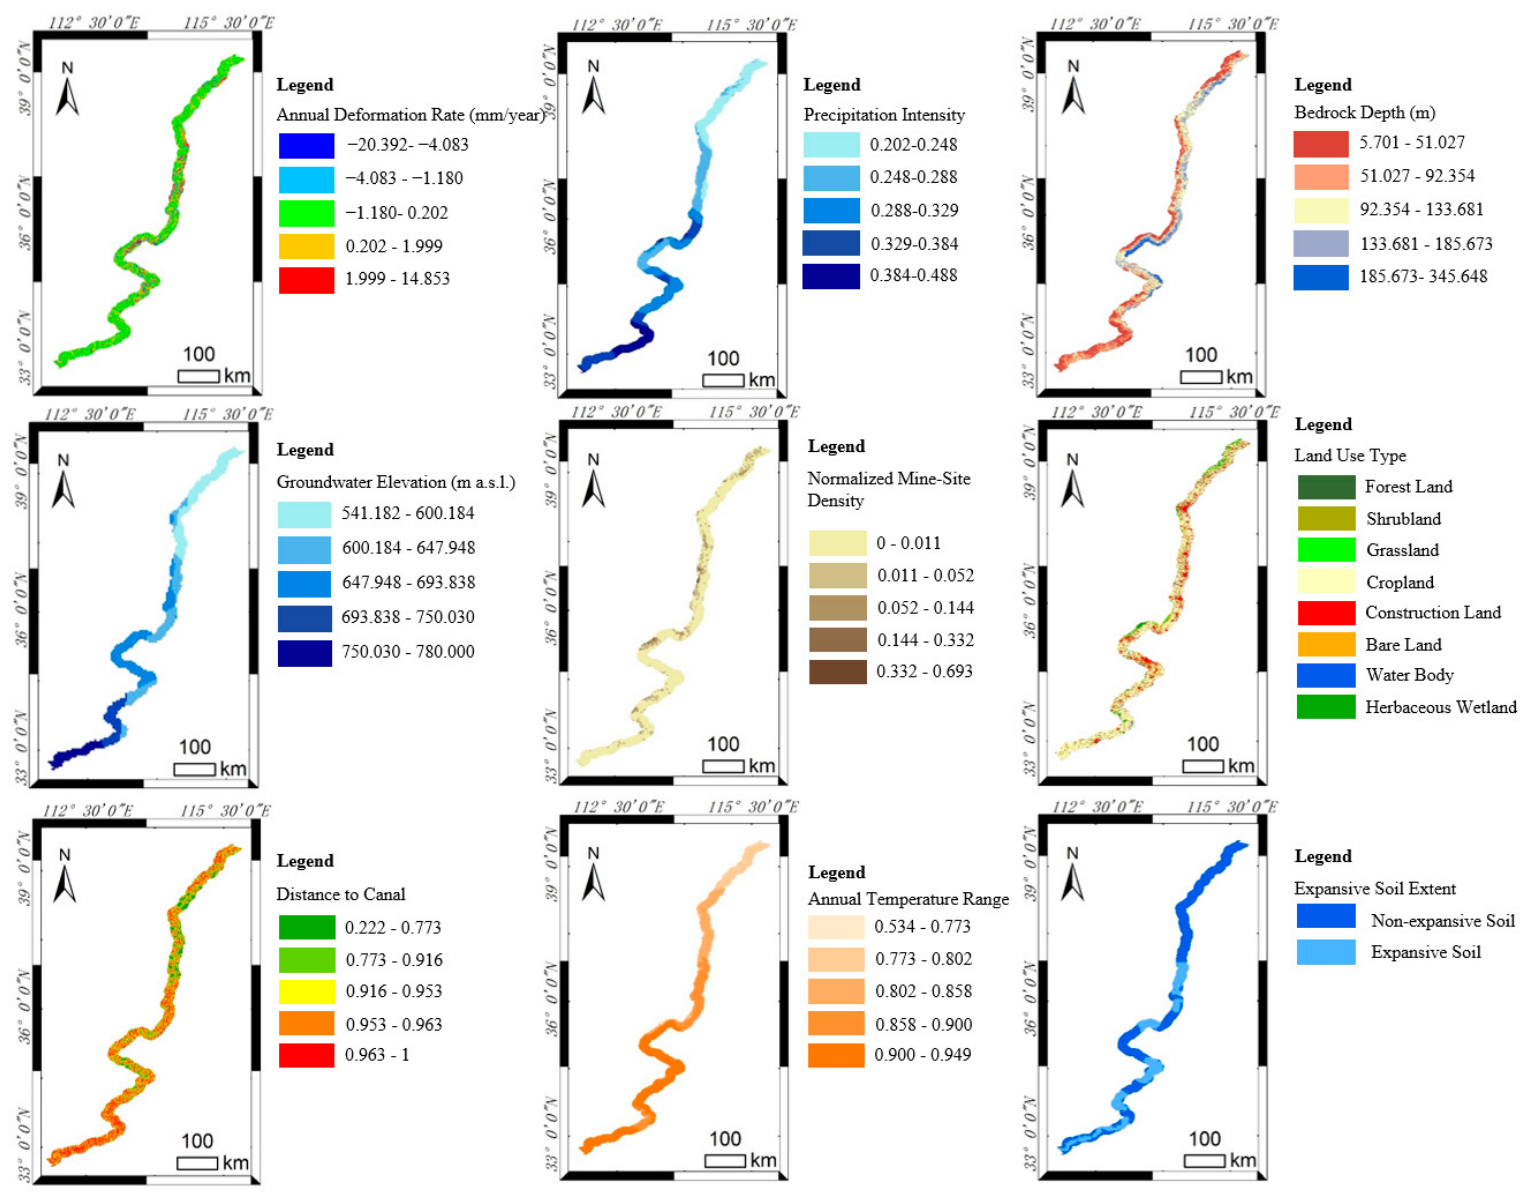
In this study, “risk” is defined as a relative subsidence risk index derived from InSAR deformation magnitude and environmental conditioning factors. It is intended for spatial comparison along the canal and does not represent absolute engineering risk, structural vulnerability, or expected loss. Given the extensive spatial span and the intricate environmental conditions along the SNWD-MR, this study selected nine key indicators to construct the risk evaluation indicator system (Figure 5). These dimensions encompass InSAR deformation magnitude, groundwater elevation, distance to canal, depth to bedrock, expansive soil distribution, normalized mine-site density, land use type, precipitation, and temperature. To ensure the consistency of the spatial analysis, all indicator datasets were uniformly resampled to a spatial resolution of 40 m × 40 m and clipped to a corridor extending 10 km on each side of the main-canal centerline, corresponding to a total width of 20 km. The InSAR deformation magnitude was calculated as the absolute value of the annual LOS deformation velocity, with larger magnitudes representing greater ground instability. The groundwater elevation and distance to canal reflect groundwater dynamics and seepage stability. The depth of bedrock and the distribution of expansive soils characterize the intrinsic regional geological baseline. Normalized mine-site density and land use type account for anthropogenic disturbances and surface loading. Finally, precipitation and temperature delineate climatic triggering mechanisms and freeze–thaw effects.
The discrete meteorological station records were interpolated using the Inverse Distance Weighting (IDW) method to generate continuous raster surfaces and were subsequently resampled to the common 40 m grid for spatial alignment with the other indicators. Given the sparse station distribution, these surfaces primarily represent regional climatic patterns rather than local-scale extremes.

2.4.2. Standardization via Fuzzy Membership Functions

Due to the significant variations in the dimensions and spatial distribution characteristics of the aforementioned indicators, this study employs fuzzy mathematical theory for data standardization [46,47]. A risk grade set is defined as V = { v 1 , v 2 , v 3 , v 4 , v 5 } corresponding to very low, low, moderate, high, and very-high-risk levels, respectively. For continuous indicators, ascending or descending linear membership functions are applied depending on their specific risk contribution directions. Conversely, for categorical and binary indicators, expert scoring or binarization procedures are utilized.
V = { v 1 , v 2 , v 3 , v 4 , v 5 }
For positive indicators where higher values correspond to greater risk levels—such as InSAR deformation magnitude, depth to bedrock, normalized mine-site density, and precipitation—an ascending linear membership function is employed, defined as follows:
μ i ( x ) = x x min x max x min
For the normalized mine-site-density indicator, x represents the pre-fuzzification value shown in Figure 5. Although the complete density raster was initially normalized to the range of 0–1, the values remaining after extraction of the canal corridor ranged from 0 to 0.693. Therefore, x m i n = 0 and x m a x = 0.693 were used in Equation (7) to calculate the corresponding fuzzy membership degree.
Figure 5. Raster maps of the indicators for subsidence risk assessment. All continuous variables without units shown in the legends were normalized and are therefore dimensionless; units are not applicable to the categorical variables.
Remotesensing 18 02766 g005
For negative indicators where lower values correspond to greater risk levels—such as groundwater elevation and distance to canal—a descending linear membership function is applied, defined as follows:
μ i ( x ) = x max x x max x min
To ensure transparency and reproducibility, the mathematical boundaries, risk mapping directions, and physical justifications for the fuzzification of all nine evaluation indicators are systematically summarized in Table 4. The extreme thresholds ( x m i n and x m a x ) were determined based on regional engineering standards and the statistical distribution boundaries of the dataset within the 10 km corridor.

2.4.3. AHP Weight Determination and Consistency Test

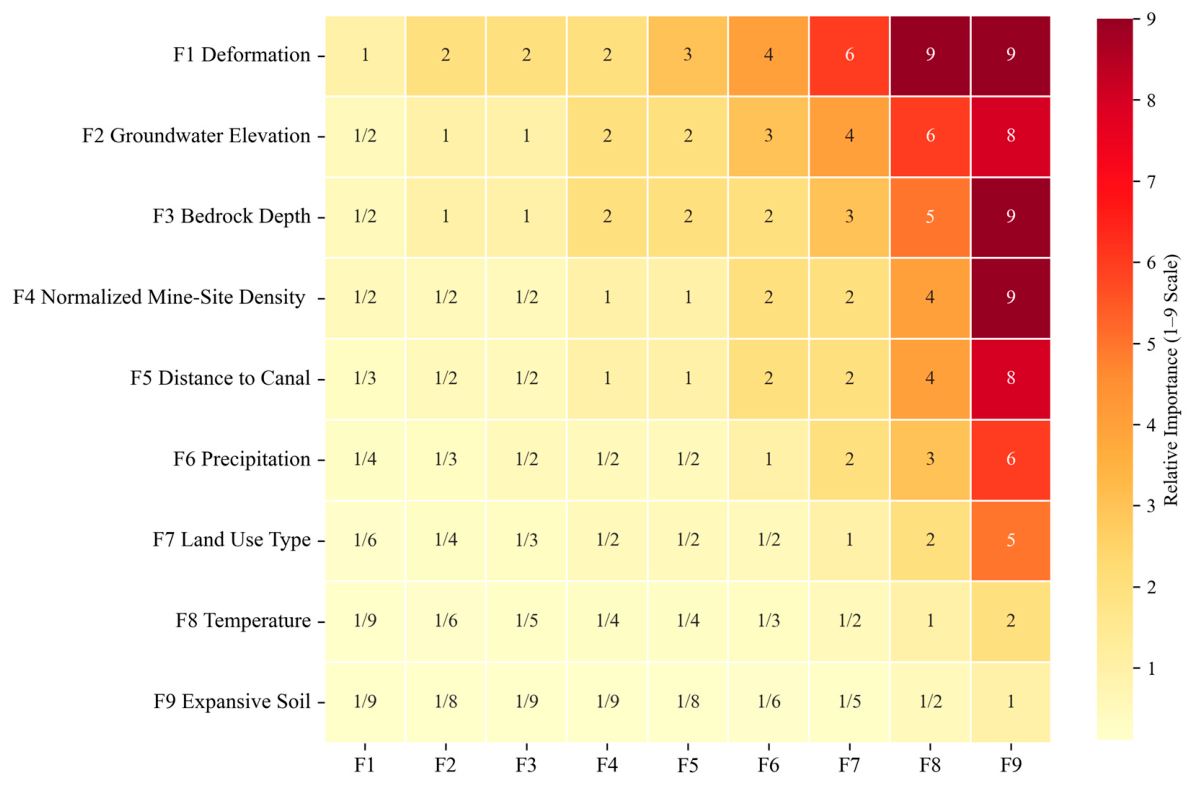
Given the absence of comprehensive historical hazard inventories for risk assessment and the imperative to accurately reflect underlying engineering geological mechanisms, this study employs the Analytic Hierarchy Process (AHP) for weight determination [40,41]. Guided by InSAR deformation monitoring principles, hydrogeological and geomechanical mechanisms, and empirical knowledge from engineering operations and maintenance, a 9 × 9 judgment matrix was constructed to conduct pairwise comparisons regarding the relative importance of each factor. The specific details of this matrix are illustrated in Figure 6.
Overall, deformation magnitude serves as the primary governing factor, exhibiting the highest weight. Groundwater elevation, bedrock depth, and normalized mine-site density rank prominently, reflecting the key driving forces of consolidation, compressible layer thickness, and localized anthropogenic disturbances, respectively. Furthermore, distance to canal, precipitation, and land use type characterize the environmental conditioning and surface loading effects. Although air temperature and expansive soil distribution exhibit relatively lower weights at the regional scale, they remain locally significant for specific canal segments.
W   =   [ w 1 ,   w 2 ,   ,   w n ] T
To verify the mathematical rigor and logical consistency of the constructed 9 × 9 pairwise comparison matrix, a formal consistency test was executed. The maximum eigenvalue ( λ m a x ) of the judgment matrix was calculated as 9.387 Based on this, the Consistency Index ( C I ) was derived using Equation (10) as:
C I = λ m a x n n 1 = 9.387 9 9 1 = 0.0484
For a 9th-order matrix ( n = 9 ), the standard Random Index ( R I ) is defined as 1.45. Consequently, the final Consistency Ratio ( C R ) was determined as:
C R = C I R I = 0.0484 1.45 0.0334
Since the calculated C R 0.0334 is well below the critical standard threshold of 0.10, the judgment matrix exhibits highly satisfactory consistency, confirming that the allocated indicator weights are mathematically valid for spatial computation.

2.4.4. Construction of the FCE Model and Spatial Computation

Following the completion of data standardization and weight determination, this study employs the Fuzzy Comprehensive Evaluation (FCE) method for risk computation. Let the weight vector be denoted as W and the fuzzy evaluation matrix as R ; the comprehensive evaluation result, B , can thus be mathematically expressed as Equation (12). Subsequently, within a Geographic Information System (GIS) environment, a Weighted Linear Combination (WLC) approach is applied to derive the final risk index for each individual raster cell.
B = W × R = ( b 1 , b 2 , , b m )
R I ( x , y ) = i = 1 n w i μ i ( x , y )
Upon deriving the continuous relative risk index (RI) raster, the Jenks Natural Breaks method was used to divide the assessment results into five classes: very low, low, moderate, high, and very high. To convert the corridor-based raster results into linear canal lengths, the main-canal centerline was divided into consecutive 40 m intervals corresponding to the raster resolution. The RI value at the midpoint of each interval was extracted from the continuous risk raster, and each interval was assigned to the corresponding risk class. The interval lengths were subsequently summed by class. Therefore, the reported lengths represent cumulative centerline lengths rather than the areal coverage of the risk classes within the 20 km-wide assessment corridor.
To ensure comparability among methods with different risk-index ranges, the high-risk zone for each method was defined as the grid cells with risk values at or above the method-specific empirical 80th percentile, corresponding to approximately the highest 20% of the common valid cells. Cells tied at the percentile cutoff were retained. Let (A) denote the Top 20% high-risk zone derived from the AHP-FCE model and (B) denote that derived from a comparator method. The AHP-referenced overlap rate and intersection over union (IoU) were calculated as follows:
O v e r l a p   R a t e = | A B | | A | × 100
I o U = | A B | | A B | × 100
Here, ( | A B | ) represents the number of grid cells identified as high risk by both methods, while ( | A B | ) represents the number of grid cells identified as high risk by at least one of the two methods.

3. Results

3.1. Deformation Along SNWD-MR

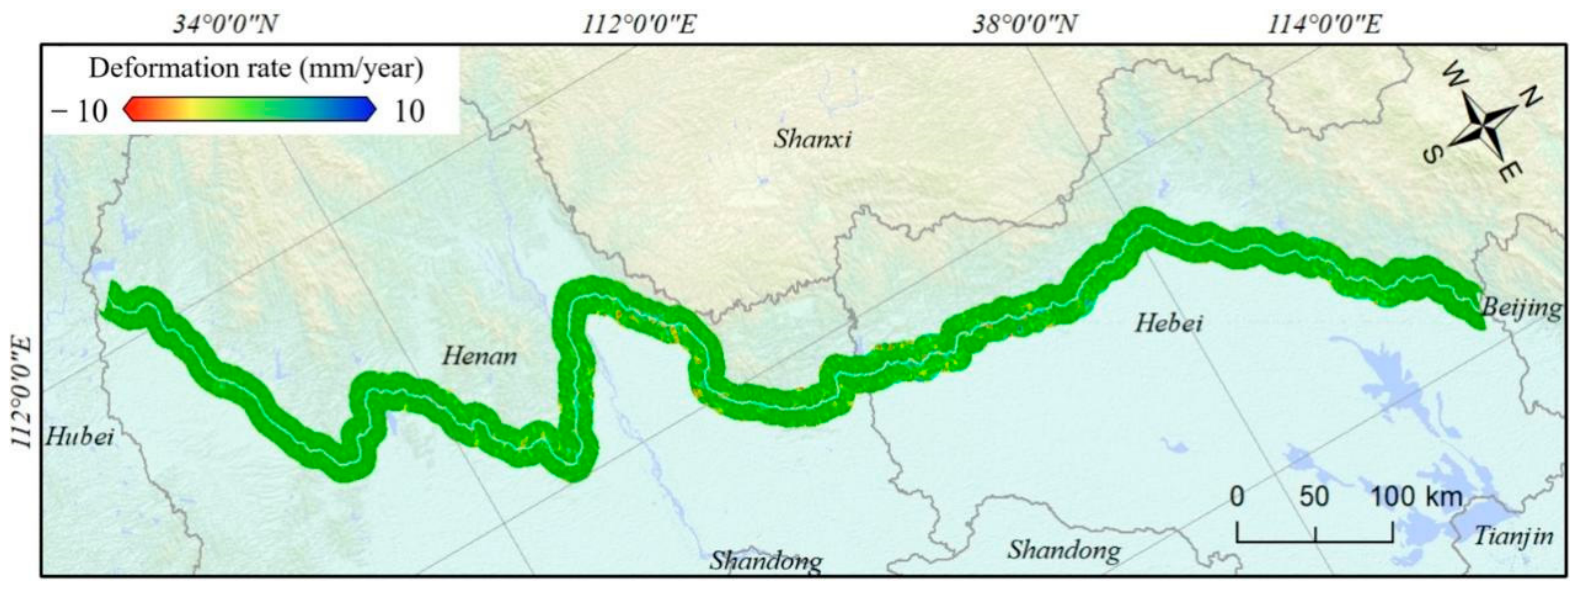
Figure 7 illustrates the land-surface deformation velocity within a corridor extending 10 km on each side of the SNWD-MR main-canal centerline, corresponding to a total width of 20 km. The deformation velocities along the entire route range from a minimum of −20.39 mm/y to a maximum of 14.85 mm/y. To enhance the spatial visualization of regions experiencing severe subsidence and uplift, the rendering range of the color scale was optimally adjusted to ±10 mm/y.
Macroscopically, surface deformation along the canal exhibits profound spatial heterogeneity. Within Henan Province, the northern canal segments, such as Anyang and Xinxiang, experience severe subsidence with localized rates exceeding −10 mm/y. Conversely, the southern regions maintain deformation velocities mostly within 3 mm/y, indicating relatively superior geological stability. In Hebei Province, distinct subsidence anomaly zones have formed in Xingtai and Handan, with velocities exceeding −10 mm/y. This distribution spatially coincides with the regional land-subsidence bowls of the North China Plain, which previous studies have widely associated with groundwater overexploitation. By comparison, deformation in the Shijiazhuang segment is notably milder, with subsidence rates generally remaining below 5 mm/y. Furthermore, deformation gradient analysis reveals that the majority of the canal route maintains a gentle variation pattern, which is highly conducive to long-term structural stability. However, significant differential deformation responses persist across geological tectonic transition zones and lithological boundaries, necessitating the continuous monitoring of localized active subsidence areas.
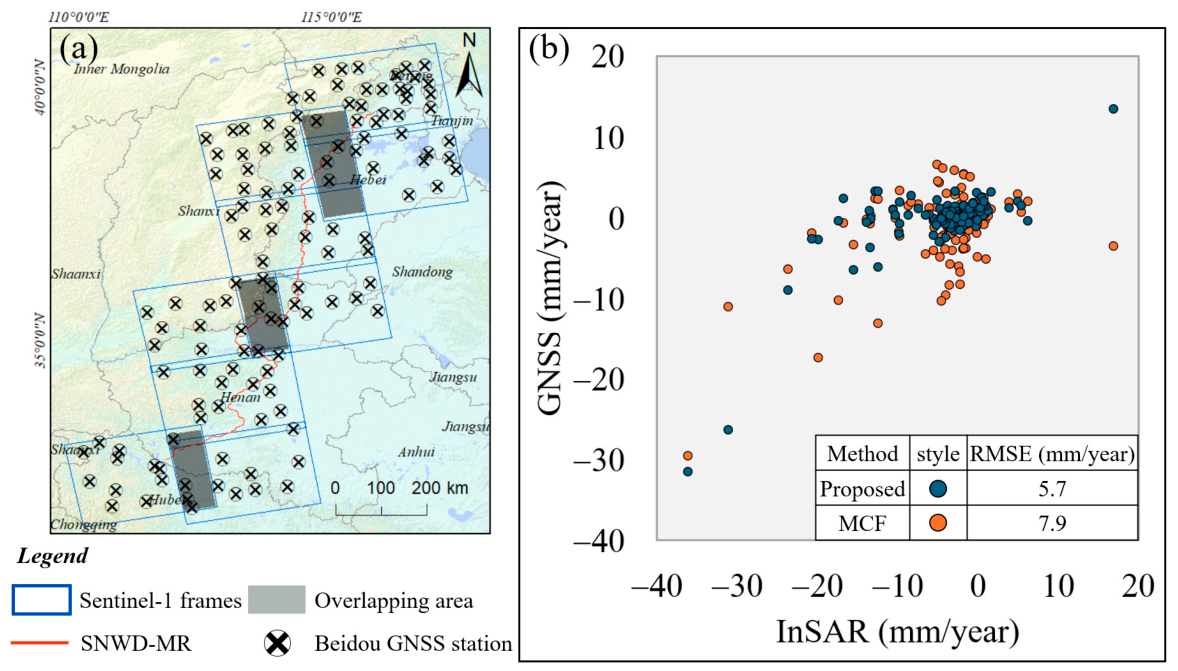
External validation was conducted using 128 valid GNSS stations located within the combined footprints of the nine Sentinel-1 SAR frames. Because the full SAR-frame footprints extend beyond the narrower 20 km wide canal corridor, Figure 8a includes several GNSS stations located outside the canal buffer but within the valid InSAR coverage. Using temporally matched observations from January 2020 to December 2022, the proposed method achieved an RMSE of 5.7 mm/y, compared with 7.9 mm/y for the traditional Minimum Cost Flow (MCF) method, corresponding to an approximately 27.8% reduction in RMSE. The proposed method also reduced the MAE from 5.3 to 4.0 mm/y and increased the Pearson correlation coefficient from 0.8 to 0.9. The mean bias was 3.4 mm/y (95% CI: 2.6–4.2 mm/y) for the proposed method and 3.8 mm/y (95% CI: 2.5–5.0 mm/y) for the traditional MCF method (Table 5). The validation was based on deformation rates calculated over the common observation period, whereas the time-series curves were presented only as auxiliary illustrations.
Beyond the external validation using the independent BeiDou dataset, we further evaluated the internal consistency of the two methods within the overlapping regions of adjacent SAR frames, as indicated by the gray-shaded areas in Figure 8a. Signed differences were calculated between the deformation-rate estimates independently obtained from adjacent frames within their common overlapping areas. In addition to the minimum, maximum, average, and standard deviation, the median and interquartile range (IQR; 25th–75th percentiles) were calculated to provide robust summaries that are less sensitive to isolated extreme values (Table 6).
The proposed method produced inter-frame differences ranging from −14.34 to 19.67 mm/y, with an average of −0.06 mm/y and a standard deviation of 0.44 mm/y. In comparison, the MCF results ranged from −49.06 to 62.26 mm/y, with an average of −0.17 mm/y and a standard deviation of 1.54 mm/y. The proposed method had a median of 0.010 mm/y and an interquartile range of −0.755 to 0.773 mm/y, corresponding to an IQR width of 1.528 mm/y. The MCF method had a median of −0.004 mm/y and an interquartile range of −2.768 to 2.743 mm/y, with an IQR width of 5.512 mm/y. Although the averages and medians of both methods were close to zero, the central 50% range of the proposed method was 72.3% narrower than that of MCF. Together with its lower standard deviation, this robust comparison indicates greater internal consistency of the proposed method across adjacent SAR frames and demonstrates that the broader distribution obtained using MCF is not attributable solely to its extreme maximum value.
The aforementioned validations demonstrate that the proposed method effectively eliminates the spatial discontinuities in deformation across different image frames and water bodies, thereby ensuring the spatial continuity and reliability of the deformation velocity field along the entire route. Consequently, this derived deformation monitoring layer can serve as a highly reliable dynamic input variable to be deeply integrated into the subsequent risk assessment framework. Building upon this, the current study conducts synergistic spatial modeling and computation by coupling the InSAR deformation magnitude with eight other environmental factors—encompassing hydrogeological conditions, geo-environmental settings, and anthropogenic activities—to ultimately facilitate the comprehensive subsidence risk zonation for the entire SNWD-MR.

3.2. Results of Subsidence Risk Zonation Along the Entire Route

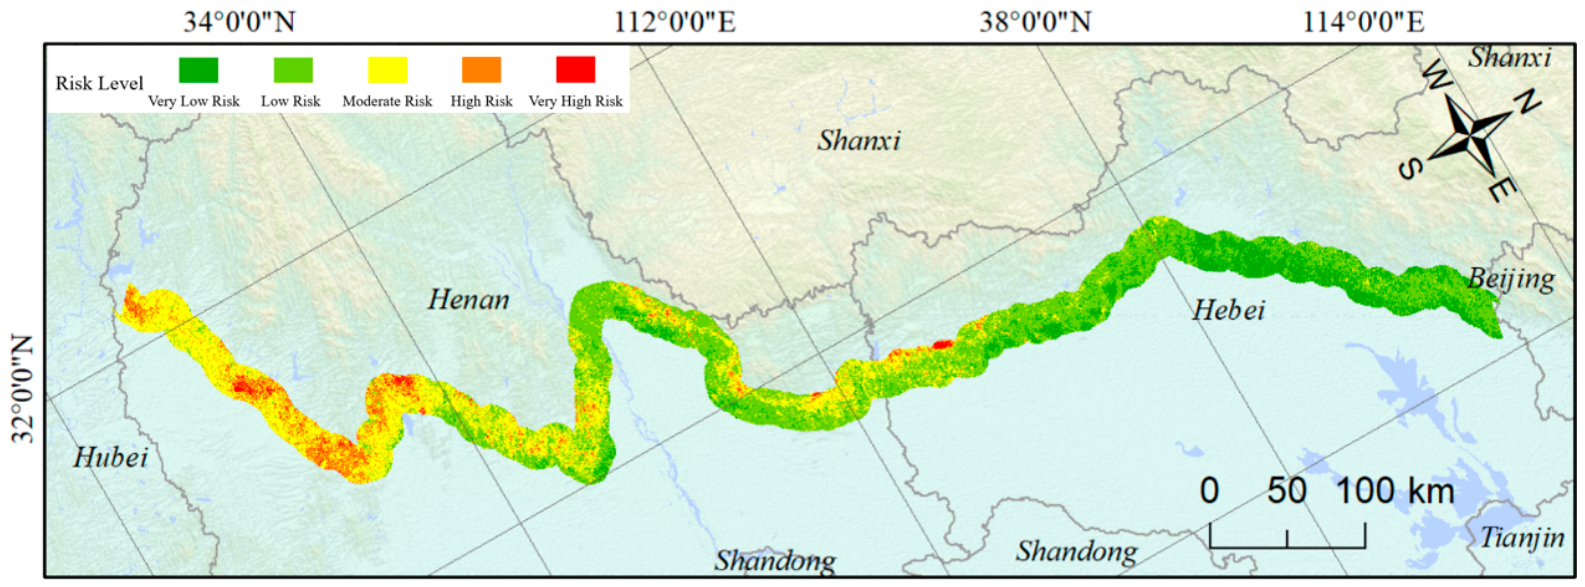
By integrating the InSAR deformation magnitude with the eight multi-source environmental factors through spatial mapping, fuzzification, and weighted computation, the comprehensive subsidence risk zonation along the entire route of the main canal was generated (Figure 9). This model transcends the limitations of relying solely on physical deformation characteristics by comprehensively considering the interactive control effects of hydro-dynamics, geological settings, and anthropogenic activities. Consequently, it provides a spatially differentiated representation of relative subsidence risk along the canal. Figure 9 clearly reveals that the very-high- and high-risk zones are primarily developed in the southern Hebei Plain, the Jiaozuo–Xinxiang mining area, and the Zhengzhou–Xuchang urban construction belt, exhibiting a strong spatial coupling with significant subsidence funnels and intense anthropogenic disturbances. The very-low-risk class is concentrated near the Danjiangkou headworks and in hilly or mountainous bedrock segments. In the model, these areas combine relatively shallow competent bedrock and limited compressible sediment with comparatively weak mining disturbances, thereby reducing the evaluated subsidence potential.
In conjunction with Figure 9 and Table 7, it is evident that the subsidence risk along the entire route exhibits a pronounced spatial heterogeneity, characterized by the coexistence of discrete isolated hotspots and continuous elongated belts. Specifically, within the segment spanning from northern Henan to southern Hebei, the presence of deep Quaternary unconsolidated sediments and severe groundwater elevation decline jointly form a continuous high-risk belt of approximately 200 km under multi-factor coupling. Meanwhile, a series of localized very-high-risk points are induced near mining areas such as Pingdingshan and Handan due to intense mining-related disturbances. Additionally, in geologically sensitive areas such as Nanyang, the model sensitively captures the combined hazard potential of expansive soil backgrounds and specific fill structures, categorizing these zones as moderate-to-high risk areas. These results illustrate the ability of the AHP-FCE framework to characterize spatially heterogeneous relative subsidence-risk patterns along ultra-long linear infrastructure.

4. Discussion

4.1. Local Comparison of Deformation Patterns, Subsidence Risk, and Time-Series Evolution

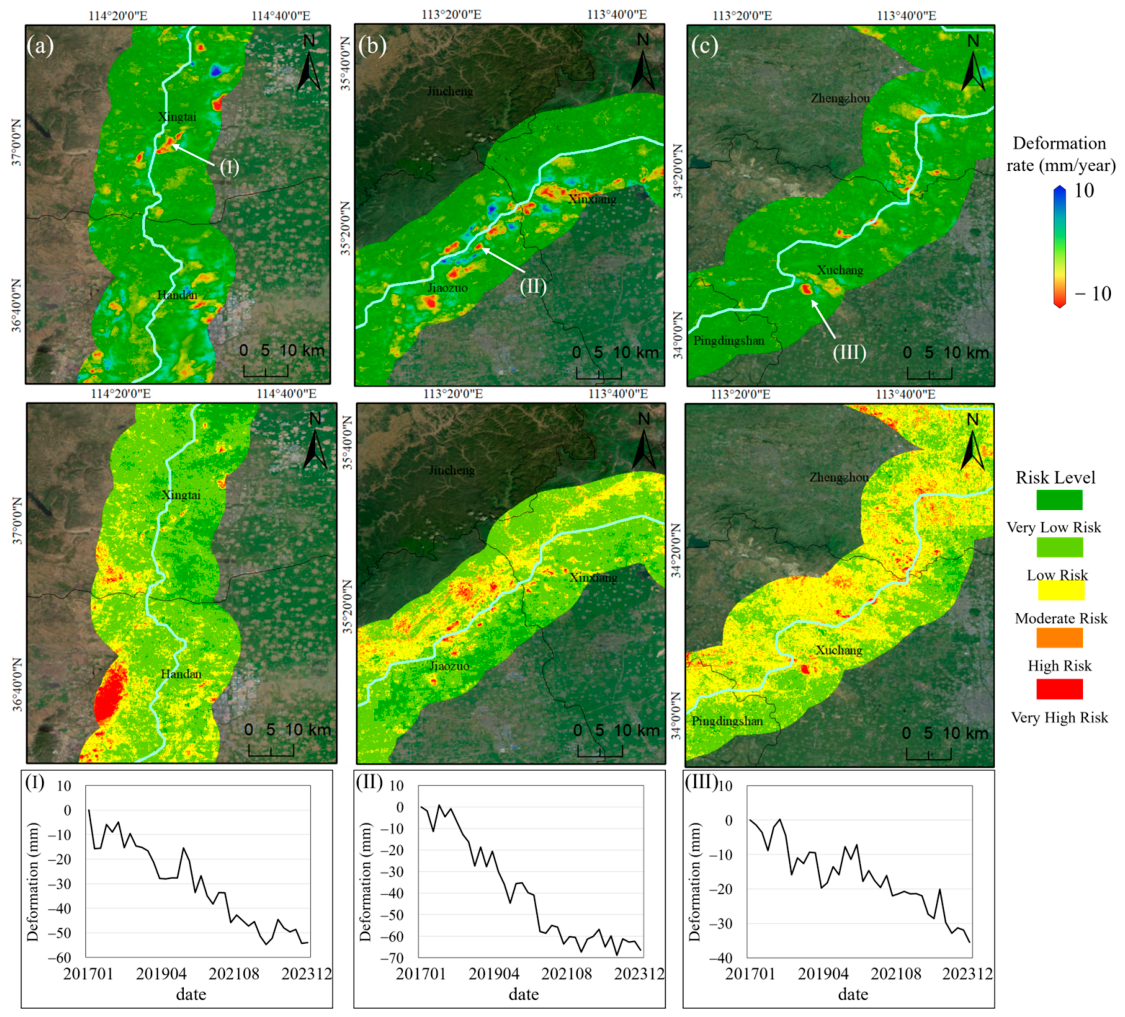
As illustrated in Figure 10, representative deformation patterns and their corresponding time-series curves were extracted for typical regions along the canal route. In Figure 10a, the Xingtai and Handan segments exhibit maximum subsidence rates exceeding 10 mm/y, with Point (I) recording a cumulative subsidence of −54.7 mm. Its time-series curve displays a seasonal fluctuation pattern characterized by rapid subsidence during winter and spring, followed by slower rates during summer and autumn, primarily controlled by the periodic effects of irrigation pumping and natural groundwater recharge. Figure 10b corresponds to the Jiaozuo and Xinxiang regions, where the mapped distribution of mine locations indicates a mining-related spatial context. Point (II) experienced two distinct accelerated subsidence phases in 2019 and 2021. However, annual mining-production data, time-resolved information on goaf expansion, and mining-event records were unavailable for the 2017–2023 study period. Consequently, these two acceleration phases are reported as characteristics of the observed deformation time series and are not interpreted as evidence of a quantitative temporal or causal relationship with mining activity. Figure 10c reveals the deformation patterns of the Zhengzhou–Xuchang segment. Specifically, the strip-shaped subsidence zone in southern Zhengzhou exhibits a high spatial alignment with the canal direction, which is closely associated with engineering construction and operational loads. In contrast, the subsidence characteristics in the Xuchang segment, as represented by Point (III), display an evolutionary pattern intertwined with urban expansion and complex geological settings.
Figure 10 shows that localized deformation anomalies in the Xingtai–Handan, Jiaozuo–Xinxiang, and Zhengzhou–Xuchang segments generally correspond to areas of elevated subsidence risk. Moderate-risk zones are widely distributed along these segments, with localized high- and very-high-risk patches near pronounced deformation areas. The spatial patterns do not coincide completely because the risk assessment also incorporates environmental and anthropogenic factors.
The analysis of these representative scenarios confirms that the subsidence along the canal route exhibits a multi-source-driven and spatially heterogeneous pattern. Specifically, the Xingtai–Handan segment is jointly influenced by groundwater depletion and deep Quaternary sedimentary deposits; the Jiaozuo–Xinxiang segment spatially coincides with the mapped distribution of mine locations, although the temporal contribution of mining activity cannot be quantified using the available data; and the Zhengzhou–Xuchang segment reflects the combined effects of urban expansion, engineering operational loads, and complex geological settings. This implies that subsidence hazard potential must be comprehensively assessed by considering the interactions among multiple factors—such as groundwater elevation, depth to bedrock, and land use—rather than relying solely on conventional deformation rate reclassification. In light of this, the following sections evaluate the spatial stability, uncertainty, cross-method agreement, and physical coherence of the derived AHP-FCE risk zonation through weight perturbation tests, sensitivity analysis, Monte Carlo simulations, multi-model comparisons, and deformation-distribution analysis.

4.2. Model Robustness, Sensitivity, and Uncertainty Analysis

To mitigate potential biases inherent in subjective weight allocation [46], this study evaluates the robustness of the AHP-FCE model from a multi-dimensional perspective: (1) weight perturbation testing, which quantifies the spatial overlap ratio of high-risk zones by introducing a ±10% variation to the weights of the nine factors; (2) sensitivity analysis, which quantitatively identifies the dominant factors driving variations in the areal extent of high-risk zones; and (3) Monte Carlo stochastic simulations, which compute the mean risk, standard deviation, and high-risk probability layers under 1000 independent uniformly distributed ±10% perturbations of the nine AHP weights, with the perturbed weights renormalized after each iteration, thereby verifying the spatial convergence and uncertainty of the final zonation results.
Monte Carlo uncertainty analysis was conducted using 1000 iterations. In each iteration, the nine baseline AHP weights were independently perturbed by random values drawn from a uniform distribution within ±10% and subsequently renormalized to sum to one. A fixed random seed of 2026 was used. The risk surface was recalculated after each perturbation, and the resulting ensemble was used to derive the cell-wise mean risk, standard deviation, and probability of exceeding the empirical 80th-percentile threshold of 0.431 used in the Top-20% analysis. The simulation was implemented in Python 3.10.19 using NumPy 2.2.6 and Rasterio 1.4.4.
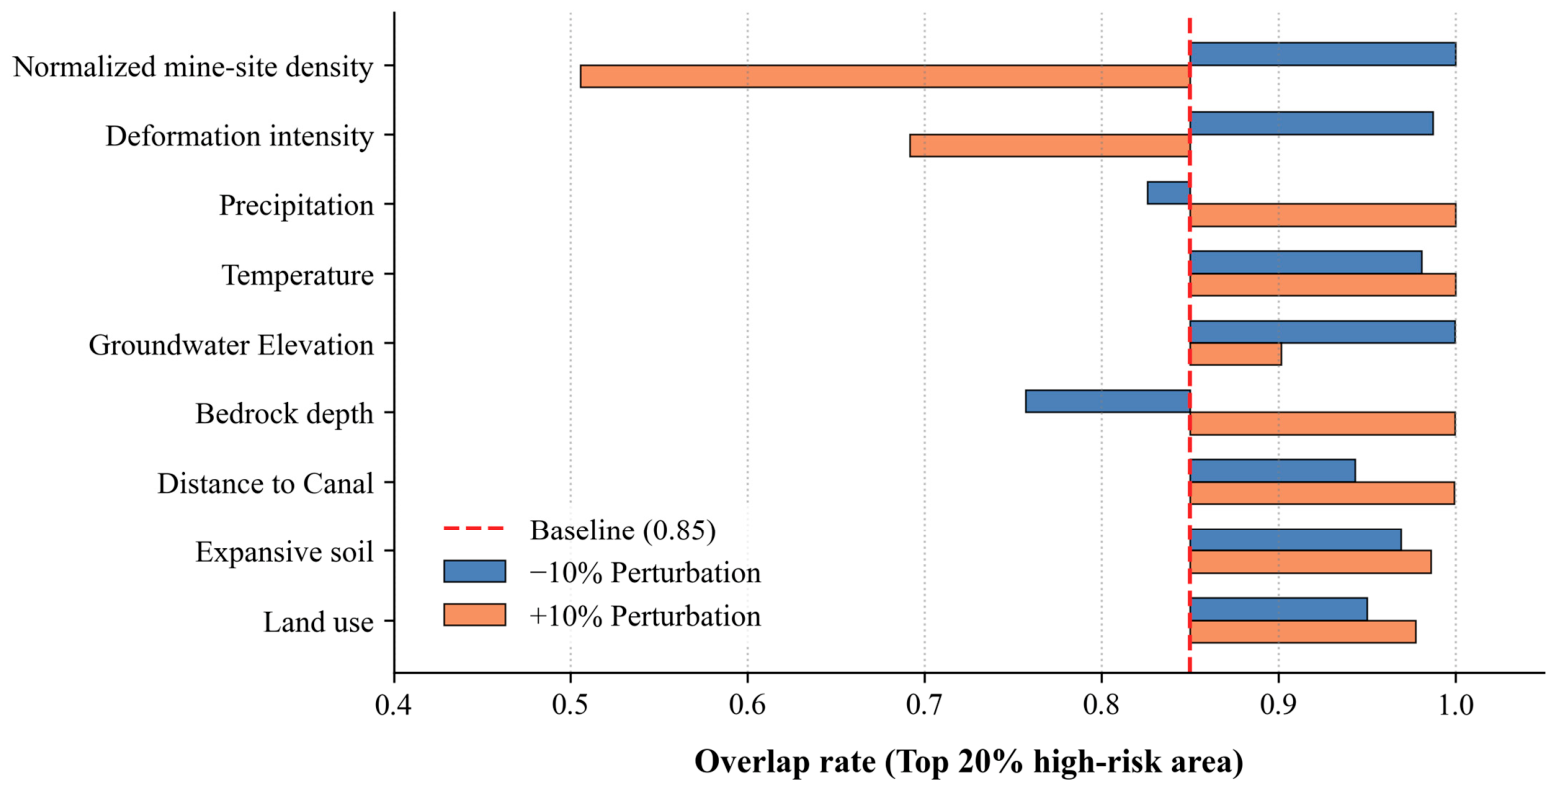
The weight perturbation experiments (illustrated in Figure 11) show that the spatial risk pattern remained stable under most tested perturbations, with spatial overlap ratios ranging from 0.90 to 1.00 across the majority of scenarios. Among the evaluated factors, a 10% increase in the weight of normalized mine-site density yields the lowest overlap ratio (approximately 0.51), indicating that the model is most sensitive to this specific parameter. This is closely followed by a 10% increase in the weight of deformation magnitude (resulting in an overlap ratio of roughly 0.69), which further corroborates the foundational role of the InSAR monitoring data within the overall assessment framework.
The pronounced directional asymmetry for mining intensity arises from the localized spatial distribution of mining disturbance together with the rank-based Top-20% threshold. Increasing the mining weight promotes many mining-dominated cells across the empirical 80th-percentile cutoff and therefore changes the membership of the high-risk set. By contrast, decreasing the mining weight leaves the ranking more strongly governed by deformation magnitude, groundwater elevation, and depth to bedrock, which are already aligned with much of the baseline high-risk corridor. The asymmetry therefore reflects both spatial localization and the nonlinear response introduced by thresholding the continuous risk surface.
The 1000 Monte Carlo simulations produced a mean risk map that was spatially consistent with the baseline AHP risk map. Across all valid grid cells, the mean of the cell-wise standard deviations was 0.00686, while the maximum cell-wise standard deviation was 0.00845. These limited variations indicate that the resulting spatial risk pattern was relatively insensitive to the specified ±10% perturbations of the nine AHP weights, thereby supporting the robustness of the model results.
Additionally, a baseline source of uncertainty stems from the spatial scale mismatch of climatic inputs. Interpolating sparse regional meteorological station records into a high-resolution 40 m grid may introduce localized smoothing effects. While these macro-climatic surfaces successfully capture regional trends such as freeze–thaw zones and rainfall gradients, future tasks should exploit high-density micro-meteorological sensor arrays to minimize false precision at localized structural scales.

4.3. Cross-Method Agreement and Internal Physical Consistency Assessment

To further evaluate the spatial stability and physical coherence of the relative risk zonation, two complementary analyses were conducted. First, the Top-20% highest-risk zones derived from AHP-FCE were compared with those obtained using the Equal Weight, Entropy Weight, and TOPSIS methods to characterize cross-method spatial agreement. Second, the distribution of InSAR-derived deformation velocities across the delineated risk zones was examined to assess the physical consistency between the zonation results and the observed deformation field.
The spatial comparison shows that the AHP-FCE framework has the highest agreement with the Equal Weight method for the Top-20% highest-risk zones (Table 8). Moderate agreement with the Entropy Weight method and lower agreement with TOPSIS reflect differences in weighting strategies and decision rules. In particular, TOPSIS produces more isolated anomalous hotspots, whereas AHP-FCE retains greater spatial continuity in the risk belts. These results characterize both the consistent components of the mapped risk pattern and its sensitivity to different evaluation methods.
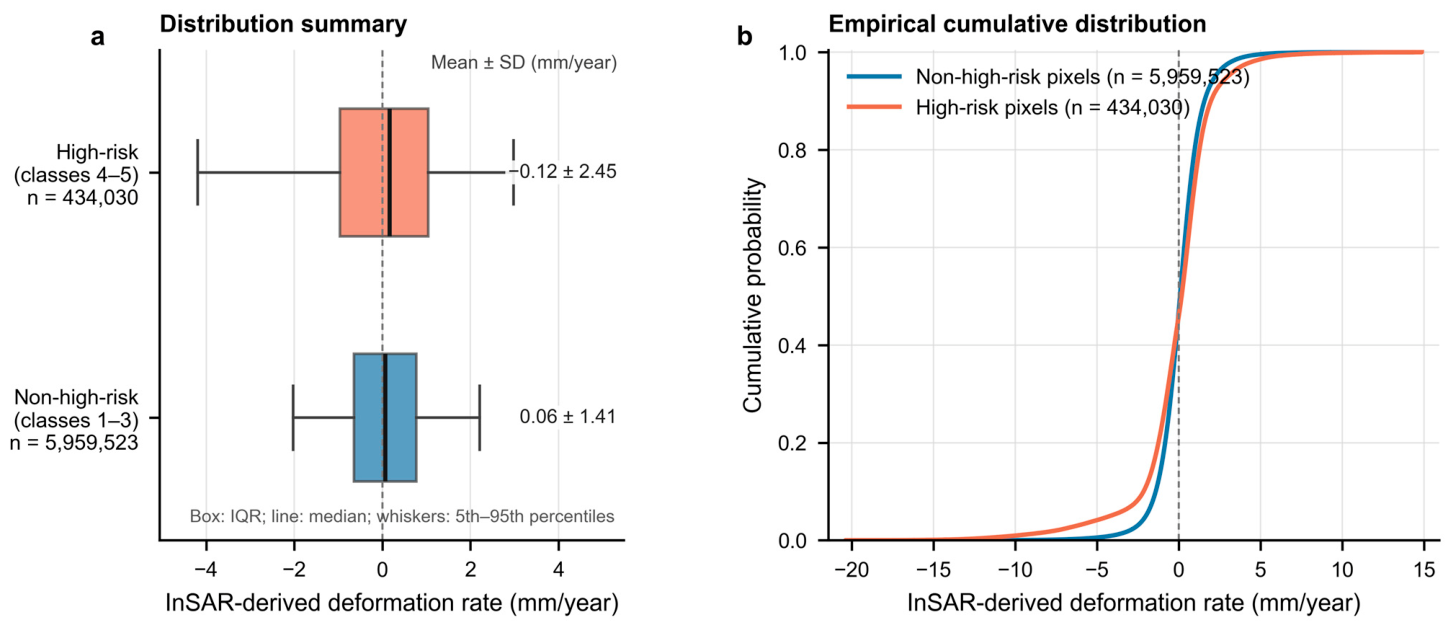
Figure 12a compares the distributions of InSAR-derived deformation rates between the high-risk group and the non-high-risk group, while Figure 12b presents the corresponding empirical cumulative distribution functions (ECDFs). All descriptive statistics were calculated across all valid raster pixels within each group. Specifically, the high-risk group comprised all pixels in classes 4–5 (n = 434,030), rather than only the very-high-risk pixels in class 5, whereas the non-high-risk group comprised pixels in classes 1–3 (n = 5,959,523). The mean deformation rate was −0.12 ± 2.45 mm/y (mean ± SD) in the high-risk group and 0.06 ± 1.41 mm/y in the non-high-risk group. The larger standard deviation and wider interquartile range of the high-risk group indicate greater spatial variability and a more pronounced negative tail in its deformation-rate distribution.
The ECDF curves in Figure 12b further support this distributional contrast. Strongly negative deformation rates accumulate more rapidly in the high-risk group, indicating a greater prevalence of severe subsidence values within this group. However, both groups show partial overlap around zero deformation, reflecting that deformation alone does not determine the final risk classification. This overlap is expected because the AHP-FCE framework integrates deformation with multiple hydrogeological, geo-environmental, anthropogenic, and meteorological factors. Overall, the deformation distributions across the different risk groups provide an internal physical consistency assessment of the zonation and support the physical coherence of the integrated assessment framework.

4.4. Methodological Applicability and Structural Boundaries

The proposed AHP-FCE assessment framework provides a coherent regional-scale relative risk zonation for the plain and expansive-soil terrain of the SNWD-MR corridor, although its applicability boundaries should be carefully considered. The current indicator system is highly tailored for long-distance, open-canal, surface hydraulic corridors. If this framework is translated to water diversion projects crossing alpine valleys or involving deep-buried tunnel networks, the dynamic and static drivers would fundamentally shift. For underground engineering tunnels, regional ground surface risk mapping must be heavily adjusted by incorporating rock mass rating (RMR) indexes, underground in situ stress tensors, and tunnel excavation disturbance variables. Furthermore, while the 40 m grid resolution is mathematically robust for regional macroeconomic risk zoning across a 1432 km alignment, it lacks the fine-scale resolution necessary for individual structure diagnosis, which should be augmented by multi-band sub-meter SAR imagery or terrestrial structural health sensors.

5. Conclusions

To address the challenges of deformation field discontinuities caused by water body obstructions and vegetation cover along the SNWD-MR, this study proposes an advanced phase unwrapping strategy that integrates water body connectivity with multiscale down-sampling. GNSS validation showed that the proposed algorithm reduced the deformation-velocity RMSE from 7.9 to 5.7 mm/y, corresponding to an approximately 27.8% reduction in RMSE relative to the traditional MCF method. Leveraging this high-precision deformation magnitude as the core input, we developed a comprehensive assessment model by fusing nine multi-source environmental factors, including hydrogeological conditions, geo-environmental settings, and anthropogenic activities. The risk zonation reveals that the very-high-risk zones along the entire route extend for 114.6 km, accounting for 8.0% of the total length; these are primarily concentrated in the canal segments of Northern Henan and Southern Hebei, which are where the modeled risk is associated with the groundwater elevation level indicator and significant localized anthropogenic disturbances. Furthermore, the weight perturbation tests, cross-method comparisons, and internal physical consistency assessment collectively support the spatial stability and physical coherence of the regional risk pattern.
Building on the current findings, future work should focus on two primary directions. First, incorporating multi-band and high-resolution SAR data is recommended to overcome decorrelation limitations, particularly those induced by complex vegetation cover and high-gradient subsidence. Second, independent engineering-damage and historical-hazard inventories covering the full study corridor are currently unavailable; integrating such records in future work will enable external evaluation and further calibration of the framework. Furthermore, coupling macroscopic surface deformation models with microscopic finite-element mechanical models for canal structures may facilitate the transition from regional hazard screening to structural health diagnosis, thereby supporting the safe operation and maintenance of water-transfer projects.

Author Contributions

L.Z. and M.Z. contributed equally to the study, they conceived the study, developed the methodology, conducted the primary formal analysis, and wrote the original draft. S.W. acquired the funding, supervised the research process, and critically reviewed the manuscript for intellectual content. Z.C. and G.Z. contributed to the software implementation, algorithm validation, and data visualization. R.W., P.L., Y.L. (Yunxi Luo), P.Q., B.S., Z.Z., Z.X., Y.L. (Yutao Liu), Y.L. (Yuying Li) and B.L.L. were involved in multi-source data curation, field investigations, and manuscript proofreading. All authors have read and agreed to the published version of the manuscript.

Funding

This work was supported by the National Natural Science Foundation of China (Grant No. 41801397); the Henan Provincial Science and Technology Research Project (Grant No. 252102321105, 262102321098); the Science & Technology Innovation Talents in Universities of Henan Province of China (Grant No. 24HASTIT018); the Natural Science Foundation of Henan Province (Grant No. 242300421369, 262300421764); the Undergraduate Universities Young Backbone Teacher Training of Henan Province of China (Grant No. 2024GGJS104); the Key Scientific Research Project of Higher Education Institutions in Henan Province (Grant No. 26A420005); the Henan Province Higher Education Teaching Reform Research and Practice Project (Graduate Education Category) (Grant No. 2025SJGLX286Y); the Science and Technology Innovation Leading Talent Program of Henan Province (Grant No. 254200510014); and the Overseas Expertise Center for Discipline Innovation (Grant No. D23015).

Data Availability Statement

The Sentinel-1 SAR imagery used in this study is openly available from the Copernicus Open Access Hub (https://dataspace.copernicus.eu/ accessed on 5 July 2025). The auxiliary datasets implemented in the risk evaluation model were sourced from multi-agency repositories: land use classification data are accessible via the ESA World Cover platform; meteorological records (precipitation and temperature) are archived by the National Meteorological Information Center of China. Hydrogeological and anthropogenic inputs—including groundwater elevation records, geological borehole datasets, bedrock boundaries, and mineral resource extraction maps—were provided by the project maintenance authorities and contain commercially or institutionally sensitive asset details. Consequently, these restricted datasets cannot be made fully public but are available from the corresponding author upon reasonable academic request.

Acknowledgments

The authors would like to thank the anonymous reviewers and the editor for their constructive comments and suggestions, which significantly improved the quality of this manuscript. We also extend our gratitude to the European Space Agency (ESA) for freely providing the Sentinel-1 SAR data.

Conflicts of Interest

The authors declare no conflicts of interest.

References

  1. Office of the South-to-North Water Diversion Project Construction Committee, State Council, PRC. The South-to-North Water Diversion Project. Engineering 2016, 2, 265–267. [Google Scholar] [CrossRef] [Scilit]
  2. Li, Z.; Hu, J.; Zhang, X.; Zheng, W.; Wu, W.; Chen, Y.; Tang, P.; Gui, R. Characterization of elastoplastic behavior and retrieval of active zone depth for expansive soil slopes in the middle-route channel head of the South-to-North Water Diversion Project, China, using InSAR time series. Remote Sens. Environ. 2023, 295, 113666. [Google Scholar] [CrossRef] [Scilit]
  3. Jiang, Z.; Wu, Z.; Li, Z.; Hu, J.; Wu, Y.; Ou, L.; Zhang, T. Investigating the behavior of an expansive soil slope in critical linear infrastructure in China using multi-temporal InSAR. Front. Environ. Sci. 2023, 11, 1287128. [Google Scholar] [CrossRef] [Scilit]
  4. Guo, H.; Zhang, Z.; Cheng, G.; Li, W.; Li, T.; Jiao, J.J. Groundwater-derived land subsidence in the North China Plain. Environ. Earth Sci. 2015, 74, 1415–1427. [Google Scholar] [CrossRef] [Scilit]
  5. Gong, H.; Pan, Y.; Zheng, L.; Li, X.; Zhu, L.; Zhang, C.; Huang, Z.; Li, Z.; Wang, H.; Zhou, C. Long-term groundwater storage changes and land subsidence development in the North China Plain (1971–2015). Hydrogeol. J. 2018, 26, 1417–1427. [Google Scholar] [CrossRef] [Scilit]
  6. Ye, S.; Xue, Y.; Wu, J.; Yan, X.; Yu, J. Progression and mitigation of land subsidence in China. Hydrogeol. J. 2016, 24, 685–693. [Google Scholar] [CrossRef] [Scilit]
  7. Feng, W.; Zhong, M.; Lemoine, J.-M.; Biancale, R.; Hsu, H.-T.; Xia, J. Evaluation of groundwater depletion in North China using the Gravity Recovery and Climate Experiment (GRACE) data and ground-based measurements. Water Resour. Res. 2013, 49, 2110–2118. [Google Scholar] [CrossRef] [Scilit]
  8. Long, D.; Yang, W.; Scanlon, B.R.; Zhao, J.; Liu, D.; Burek, P.; Pan, Y.; You, L.; Wada, Y. South-to-North Water Diversion stabilizing Beijing’s groundwater levels. Nat. Commun. 2020, 11, 3665. [Google Scholar] [CrossRef] [Scilit] [PubMed]
  9. Zhu, L.; Gong, H.; Chen, Y.; Wang, S.; Ke, Y.; Guo, G.; Li, X.; Chen, B.; Wang, H.; Teatini, P. Effects of Water Diversion Project on groundwater system and land subsidence in Beijing, China. Eng. Geol. 2020, 276, 105763. [Google Scholar] [CrossRef] [Scilit]
  10. Dong, J.; Lai, S.; Wang, N.; Wang, Y.; Zhang, L.; Liao, M. Multi-scale deformation monitoring with Sentinel-1 InSAR analyses along the Middle Route of the South-North Water Diversion Project in China. Int. J. Appl. Earth Obs. Geoinf. 2021, 100, 102324. [Google Scholar] [CrossRef] [Scilit]
  11. Wang, N.; Dong, J.; Wang, Z.; Lei, J.; Zhang, L.; Liao, M. Monitoring Large-Scale Hydraulic Engineering Using Sentinel-1 InSAR: A Case Study of China’s South-to-North Water Diversion Middle Route Project. IEEE J. Sel. Top. Appl. Earth Obs. Remote Sens. 2022, 15, 739–750. [Google Scholar] [CrossRef] [Scilit]
  12. Wang, N.; Wang, D.; Dong, J.; Liu, Y.; Zhang, L.; Liao, M. Monitoring artificial canals with multiple SAR satellites: A case study of the Changge Canal of the South-to-North Water Diversion Project in China. Int. J. Appl. Earth Obs. Geoinf. 2023, 122, 103449. [Google Scholar] [CrossRef] [Scilit]
  13. Xiong, S.; Deng, Z.; Zhang, B.; Wang, C.; Qin, X.; Li, Q. Deformation Evaluation of the South-to-North Water Diversion Project (SNWDP) Central Route over Handan in Hebei, China, Based on Sentinel-1A, Radarsat-2, and TerraSAR-X Datasets. Remote Sens. 2023, 15, 3516. [Google Scholar] [CrossRef] [Scilit]
  14. Xiao, R.; Gao, X.; Wang, X.; Yuan, S.; Wu, Z.; He, X. Measuring Dam Deformation of Long-Distance Water Transfer Using Multi-Temporal Synthetic Aperture Radar Interferometry: A Case Study in South-to-North Water Diversion Project, China. Remote Sens. 2024, 16, 365. [Google Scholar] [CrossRef] [Scilit]
  15. Lyu, M.; Ke, Y.; Guo, L.; Li, X.; Zhu, L.; Gong, H.; Constantinos, C. Change in regional land subsidence in Beijing after south-to-north water diversion project observed using satellite radar interferometry. GISci. Remote Sens. 2020, 57, 140–156. [Google Scholar] [CrossRef] [Scilit]
  16. Shi, M.; Gao, M.; Chen, Z.; Lyu, M.; Gong, H.; Zhai, Y.; Pan, Y. Land subsidence in Beijing: Response to the joint influence of the South-to-North Water Diversion Project and ecological water replenishment, observed by satellite radar interferometry. GISci. Remote Sens. 2024, 61, 2315708. [Google Scholar] [CrossRef] [Scilit]
  17. Du, Z.; Ge, L.; Ng, A.H.-M.; Lian, X.; Zhu, Q.; Horgan, F.G.; Zhang, Q. Analysis of the impact of the South-to-North water diversion project on water balance and land subsidence in Beijing, China between 2007 and 2020. J. Hydrol. 2021, 603, 126990. [Google Scholar] [CrossRef] [Scilit]
  18. Wang, J.; Ding, K.; Chen, X.; Guo, R.; Sun, H. Influence of South-to-North Water Diversion on Land Subsidence in North China Plain Revealed by Using Geodetic Measurements. Remote Sens. 2024, 16, 162. [Google Scholar] [CrossRef] [Scilit]
  19. Shi, M.; Gong, H.; Gao, M.; Chen, B.; Zhang, S.; Zhou, C. Recent Ground Subsidence in the North China Plain, China, Revealed by Sentinel-1A Datasets. Remote Sens. 2020, 12, 3579. [Google Scholar] [CrossRef] [Scilit]
  20. Dong, J.; Guo, S.; Wang, N.; Zhang, L.; Ge, D.; Liao, M.; Gong, J. Tri-decadal evolution of land subsidence in the Beijing Plain revealed by multi-epoch satellite InSAR observations. Remote Sens. Environ. 2023, 286, 113446. [Google Scholar] [CrossRef] [Scilit]
  21. Zebker, H.A.; Villasenor, J. Decorrelation in interferometric radar echoes. IEEE Trans. Geosci. Remote Sens. 1992, 30, 950–959. [Google Scholar] [CrossRef] [Scilit]
  22. Ferretti, A.; Prati, C.; Rocca, F. Permanent Scatterers in SAR Interferometry. IEEE Trans. Geosci. Remote Sens. 2001, 39, 8–20. [Google Scholar] [CrossRef] [Scilit]
  23. Berardino, P.; Fornaro, G.; Lanari, R.; Sansosti, E. A new algorithm for surface deformation monitoring based on small baseline differential SAR interferograms. IEEE Trans. Geosci. Remote Sens. 2002, 40, 2375–2383. [Google Scholar] [CrossRef] [Scilit]
  24. Hooper, A.; Zebker, H.; Segall, P.; Kampes, B. A new method for measuring deformation on volcanoes and other natural terrains using InSAR persistent scatterers. Geophys. Res. Lett. 2004, 31, L23611. [Google Scholar] [CrossRef] [Scilit]
  25. Hooper, A.; Bekaert, D.; Spaans, K.; Arıkan, M. Recent advances in SAR interferometry time series analysis for measuring crustal deformation. Tectonophysics 2012, 514–517, 1–13. [Google Scholar] [CrossRef] [Scilit]
  26. Crosetto, M.; Monserrat, O.; Cuevas-González, M.; Devanthéry, N.; Crippa, B. Persistent Scatterer Interferometry: A review. ISPRS J. Photogramm. Remote Sens. 2016, 115, 78–89. [Google Scholar] [CrossRef] [Scilit]
  27. Osmanoğlu, B.; Sunar, F.; Wdowinski, S.; Cabral-Cano, E. Time series analysis of InSAR data: Methods and trends. ISPRS J. Photogramm. Remote Sens. 2016, 115, 90–102. [Google Scholar] [CrossRef] [Scilit]
  28. Yunjun, Z.; Fattahi, H.; Amelung, F. Small baseline InSAR time series analysis: Unwrapping error correction and noise reduction. Comput. Geosci. 2019, 133, 104331. [Google Scholar] [CrossRef] [Scilit]
  29. Yu, C.; Li, Z.; Penna, N.T.; Crippa, P. Generic Atmospheric Correction Model for Interferometric Synthetic Aperture Radar Observations. J. Geophys. Res. Solid Earth 2018, 123, 9202–9222. [Google Scholar] [CrossRef] [Scilit]
  30. Milillo, P.; Perissin, D.; Salzer, J.T.; Lundgren, P.; Lacava, G.; Milillo, G.; Serio, C. Monitoring dam structural health from space: Insights from novel InSAR techniques and multi-parametric modeling applied to the Pertusillo dam Basilicata, Italy. Int. J. Appl. Earth Obs. Geoinf. 2016, 52, 221–229. [Google Scholar] [CrossRef] [Scilit]
  31. Qin, X.; Zhang, L.; Yang, M.; Luo, H.; Liao, M.; Ding, X. Mapping surface deformation and thermal dilation of arch bridges by structure-driven multi-temporal DInSAR analysis. Remote Sens. Environ. 2018, 216, 71–90. [Google Scholar] [CrossRef] [Scilit]
  32. Huang, Q.; Crosetto, M.; Monserrat, O.; Crippa, B. Displacement monitoring and modelling of a high-speed railway bridge using C-band Sentinel-1 data. ISPRS J. Photogramm. Remote Sens. 2017, 128, 204–211. [Google Scholar] [CrossRef] [Scilit]
  33. Selvakumaran, S.; Rossi, C.; Marinoni, A.; Webb, G.; Bennetts, J.; Barton, E.; Plank, S.; Middleton, C. Combined InSAR and Terrestrial Structural Monitoring of Bridges. IEEE Trans. Geosci. Remote Sens. 2020, 58, 7141–7153. [Google Scholar] [CrossRef] [Scilit]
  34. Costantini, M. A novel phase unwrapping method based on network programming. IEEE Trans. Geosci. Remote Sens. 1998, 36, 813–821. [Google Scholar] [CrossRef] [Scilit]
  35. Wang, S.; Zhang, G.; Chen, Z.; Cui, H.; Zheng, Y.; Xu, Z.; Li, Q. Surface deformation extraction from small baseline subset synthetic aperture radar interferometry (SBAS-InSAR) using coherence-optimized baseline combinations. GISci. Remote Sens. 2022, 59, 295–309. [Google Scholar] [CrossRef] [Scilit]
  36. Li, L.; Zhang, H.; Tang, Y.; Wang, C.; Gu, F. InSAR Phase Unwrapping by Deep Learning Based on Gradient Information Fusion. IEEE Geosci. Remote Sens. Lett. 2022, 19, 4502305. [Google Scholar] [CrossRef] [Scilit]
  37. Wu, Z.; Wang, T.; Wang, Y.; Wang, R.; Ge, D. Deep-Learning-Based Phase Discontinuity Prediction for 2-D Phase Unwrapping of SAR Interferograms. IEEE Trans. Geosci. Remote Sens. 2022, 60, 5216516. [Google Scholar] [CrossRef] [Scilit]
  38. Hakim, W.L.; Fadhillah, M.F.; Won, J.-S.; Park, Y.-C.; Lee, C.-W. Advanced time-series InSAR analysis to estimate surface deformation and utilization of hybrid deep learning for susceptibility mapping in the Jakarta metropolitan region. GISci. Remote Sens. 2025, 62, 2465349. [Google Scholar] [CrossRef] [Scilit]
  39. Sciortino, A.; Marini, R.; Guerriero, V.; Mazzanti, P.; Spadi, M.; Tallini, M. Satellite A-DInSAR pattern recognition for seismic vulnerability mapping at city scale: Insights from the L’Aquila (Italy) case study. GISci. Remote Sens. 2024, 61, 2293522. [Google Scholar] [CrossRef] [Scilit]
  40. Saaty, T.L. How to make a decision: The analytic hierarchy process. Eur. J. Oper. Res. 1990, 48, 9–26. [Google Scholar] [CrossRef] [Scilit]
  41. Vaidya, O.S.; Kumar, S. Analytic hierarchy process: An overview of applications. Eur. J. Oper. Res. 2006, 169, 1–29. [Google Scholar] [CrossRef] [Scilit]
  42. Zhang, Z.; Zhang, S.; Hu, C.; Zhang, X.; Yang, S.; Yan, H.; Zhang, Z. Hazard assessment model of ground subsidence coupling AHP, RS and GIS—A case study of Shanghai. Gondwana Res. 2023, 117, 344–362. [Google Scholar] [CrossRef] [Scilit]
  43. Zhan, Y.; Zhang, Y.; Zhang, J.; Xu, J.; Chen, H.; Liu, G.; Wan, Z. Risk assessment of land subsidence in Shanghai municipality based on AHP and EWM. Sci. Rep. 2025, 15, 7339. [Google Scholar] [CrossRef] [Scilit] [PubMed]
  44. Chai, L.; Wei, L.; Cai, P.; Liu, J.; Kang, J.; Zhang, Z. Risk assessment of land subsidence based on GIS in the Yongqiao area, Suzhou City, China. Sci. Rep. 2024, 14, 11377. [Google Scholar] [CrossRef] [Scilit] [PubMed]
  45. Devara, M.; Tiwari, A.; Dwivedi, R. Landslide susceptibility mapping using MT-InSAR and AHP enabled GIS-based multi-criteria decision analysis. Geomat. Nat. Hazards Risk 2021, 12, 675–693. [Google Scholar] [CrossRef] [Scilit]
  46. Lyu, H.-M.; Shen, S.-L.; Zhou, A.; Yang, J. Risk assessment of mega-city infrastructures related to land subsidence using improved trapezoidal FAHP. Sci. Total Environ. 2020, 717, 135310. [Google Scholar] [CrossRef] [Scilit] [PubMed]
  47. Yi, S.; Lai, G.; Wang, M.; Zhang, Z.; Chen, Y.; Wen, N.; Shi, X. Risk Assessment of Ground Subsidence in Foshan (China) Based on the Integration of SBAS-InSAR Observations and Inducing Factors. Remote Sens. 2025, 17, 108. [Google Scholar] [CrossRef] [Scilit]
Figure 1. Study area and coverage of SAR imagery.
Remotesensing 18 02766 g001
Figure 2. Challenges of InSAR Application in the Middle Route of the South-to-North Water Diversion Project.
Remotesensing 18 02766 g002
Figure 3. Workflow of the connectivity-aware multiscale down-sampling InSAR phase unwrapping strategy.
Remotesensing 18 02766 g003
Figure 4. Workflow of the integrated subsidence risk assessment based on the AHP-FCE model.
Remotesensing 18 02766 g004
Figure 6. Pairwise comparison matrix for the AHP model.
Remotesensing 18 02766 g006
Figure 7. Ground surface deformation rate map of the SNWD-MR alignment.
Remotesensing 18 02766 g007
Figure 8. Spatial distribution of BeiDou GNSS reference stations and validation of InSAR precision: (a) spatial distribution of the reference stations; (b) comparison of InSAR and GNSS deformation rates.
Remotesensing 18 02766 g008
Figure 9. Integrated subsidence risk zonation map for the Middle Route of the South-to-North Water Diversion Project.
Remotesensing 18 02766 g009
Figure 10. Comparison of deformation, subsidence risk, and time-series evolution in representative canal segments: (a) Xingtai–Handan segment; (b) Jiaozuo–Xinxiang segment; (c) Zhengzhou–Xuchang segment. The upper and middle rows show deformation rates and subsidence risk levels, respectively, while panels (IIII) in the lower row show the cumulative LOS deformation time series for the corresponding segments.
Remotesensing 18 02766 g010
Figure 11. Statistics of the overlap rate of high-risk zones under ±10% weight perturbation. Top 20% denotes grid cells with risk values at or above the method-specific empirical 80th-percentile threshold.
Remotesensing 18 02766 g011
Figure 12. InSAR-derived deformation-rate distributions for high-risk (classes 4–5) and non-high-risk (classes 1–3) pixels. (a) Boxplots showing the median, IQR, 5th–95th percentiles, and mean ± SD. (b) ECDFs. n denotes valid raster pixels; all statistics are descriptive.
Remotesensing 18 02766 g012
Table 1. SAR data details.
Tile IdentifierTime SpanDirectionAcquisitionsRetained Interferometric Pairs (Top 2%)
PathFrame
11101201701–202312ascending177312
113101201701–202312ascending204414
113106201701–202312ascending204414
113111201701–202312ascending196382
40112201701–202312ascending201402
40117201701–202312ascending201402
40122201701–202312ascending201402
142121201701–202312ascending195378
142126201701–202312ascending194374
Dates are presented in yyyymm format.
Table 2. Evaluation indicator system for subsidence risk assessment.
CategoryIndicatorUnitData SourcePhysical Meaning and Hazard-Inducing Logic
Hazard ManifestationInSAR Deformation Magnitudemm/ySentinel-1 InSARAbsolute LOS deformation magnitude; larger values indicate greater ground instability regardless of deformation direction [10,11,12,13,14,19,20,47].
HydrogeologyGroundwater Elevationm a.s.l.Hydrological Monitoring StationsGroundwater-surface elevation referenced to the 1985 National Height Datum of China; lower elevations increase effective stress and subsidence potential [4,5,6,7,8,17].
Distance to CanalmGeospatial DatabaseKey indicator of proximity to the main alignment; shorter distances correspond to higher structural risks from lateral seepage and pipe leakage.
Geo-environmentBedrock DepthmGeological Borehole DataDetermines the thickness of compressible layers; greater depth correlates with higher potential subsidence.
Expansive Soil Distribution0/1Geological MapsCauses swelling upon water absorption and shrinkage upon drying, potentially triggering lining cracks and slope instability [2,3].
Human ActivityNormalized Mine-Site DensityDimensionlessMineral Resource MapsA significant anthropogenic interference factor triggering ground collapse and discontinuous deformation [42,43,44,45,46].
Land Use TypeCategoryRemote Sensing Classification DataReflects variations in surface loading and anthropogenic disturbances [42,43,44,45,46].
HydrometeorologyPrecipitationmmMeteorological Station NetworkSoftens soil and induces deformation in expansive soils.
Temperature°CMeteorological Station NetworkAffects structural durability of the canal through freeze–thaw cycles and thermal stress.
Table 3. Locations and SAR image coordinates of the reference bridges used for phase unwrapping.
SAR FrameLongitude (°E)Latitude (°N)Range CoordinateAzimuth Coordinate
P11F101112.059232.764157064698
P113F101112.473232.985415375823
P113F106113.251333.927735743163
P113F111113.394135.262548972290
P40F112114.143635.619519363219
P40F117114.473037.158535893079
P40F122114.866938.621954962479
P142F121114.951738.75497265202
P142F126115.467839.364820741221
Table 4. Canal Risk Indicators and Membership Functions.
IndicatorRisk DirectionxminxmaxMembership Function TypePhysical Basis & Engineering Justification
InSAR Deformation MagnitudePositive0.20 mm/y20.39 mm/yLinear AscendingLarger deformation magnitudes indicate greater ground instability.
Groundwater ElevationNegative541.18 m780.00 mLinear DescendingLower groundwater elevations increase effective stress and subsidence potential in compressible layers.
Distance to CanalNegative0 m10000 mLinear DescendingProximity to the main channel governs lateral seepage risks and hydraulic boundaries.
Bedrock DepthPositive5.70 m345.65 mLinear AscendingDeeper bedrock indicates thicker compressible Quaternary sediments prone to compaction.
Expansive Soil DistributionBinary0 (Absent)1 (Present)Discrete MappingGoverns swelling-shrinkage hazards that trigger canal lining cracks and slope failure.
Normalized Mine-Site DensityPositive00.693 (Dimensionless)Linear AscendingAnthropogenic driver inducing goaf collapse, soil fracturing, and discontinuous deformation.
Land Use TypeCategorical0 (Forest/Water)1 (Construction)Expert AssignmentsReflects the spatial distribution of static structural loads and human disturbances.
PrecipitationPositive0.2020.488Linear AscendingClimatic trigger that saturates expansible clay minerals and softens canal foundations.
Temperature RangePositive0.5340.949Linear AscendingThermal stressors governing concrete freeze–thaw cycles and structural durability.
Table 5. Statistical comparison between the temporally matched InSAR and GNSS deformation rates from 2020 to 2022.
MethodnMean Bias (mm/y)MAE (mm/y)RMSE (mm/y)Pearson’s r95% CI of Mean Residual (mm/y)
Proposed method1283.44.05.70.92.6–4.2
Traditional MCF method1283.85.37.90.82.5–5.0
Table 6. Statistical comparison of results in overlapping areas.
Indexes (mm/y)Proposed MethodMCF
Minimum 14.34 49.06
Maximum19.6762.26
Average 0.06 0.17
Standard deviation0.441.54
Median0.010−0.004
Interquartile range (Q1–Q3)−0.755 to 0.773−2.768 to 2.743
IQR width1.5285.512
Table 7. Statistics of centerline lengths, proportions, and risk-index intervals for different relative subsidence risk classes.
Risk LevelRisk-Index IntervalLength (km)Proportion (%)Primary Distribution Area
Very High Risk0.3928 < RI ≤ 0.4830114.68.0Anyang, Handan–Xingtai, and parts of Xinxiang segments
High Risk0.3767 < RI ≤ 0.3928243.417.0Zhengzhou–Jiaozuo, Cangzhou fringes, and parts of Baoding segments
Moderate Risk0.3468 < RI ≤ 0.3767415.329.0Xuchang, Shijiazhuang, and southern Beijing segments
Low Risk0.3068 < RI ≤ 0.3468386.627.0Nanyang expansive soil segments (stable areas) and Tianjin branch
Very Low RiskRI ≤ 0.3068272.119.0Danjiangkou headworks and bedrock segments in hilly/mountainous areas
Table 8. Comparison of spatial consistency for high-risk zones (Top 20%) among different evaluation methods.
Comparison GroupAHP-Referenced Overlap Rate (%)IoU (%)Analysis and Conclusion
AHP-FCE vs. Equal Weight Method65.8749.11Highest spatial agreement among the compared methods.
AHP-FCE vs. Entropy Weight Method48.6132.11Moderate spatial agreement, reflecting sensitivity to local data variability.
AHP-FCE vs. TOPSIS27.7216.09Lower spatial agreement, reflecting differences in decision rules and sensitivity to isolated anomalies.
Disclaimer/Publisher’s Note: The statements, opinions and data contained in all publications are solely those of the individual author(s) and contributor(s) and not of MDPI and/or the editor(s). MDPI and/or the editor(s) disclaim responsibility for any injury to people or property resulting from any ideas, methods, instructions or products referred to in the content.