Article

Three-Dimensional Displacement Analysis and Statistical Modeling of the Pubugou Rockfill Dam Using Multi-Track InSAR


1
School of Geography and Information Engineering, China University of Geosciences, Wuhan 430074, China
2
College for Elite Engineers, China University of Geosciences, Wuhan 430074, China
3
Hebei Provincial Institute of Cartography, Shijiazhuang 050031, China
4
State Key Laboratory of Lake and Watershed Science for Water Security, Nanjing 211135, China
5
Nanjing Institute of Geography and Limnology, Chinese Academy of Sciences, Nanjing 211135, China
*
Author to whom correspondence should be addressed.
Remote Sens. 2026, 18(17), 2853; https://doi.org/10.3390/rs18172853
Submission received: 21 July 2026 / Revised: 17 August 2026 / Accepted: 21 August 2026 / Published: 23 August 2026

Highlights

What are the main findings?
  • Multi-track InSAR combined with spatial clustering revealed heterogeneous three-dimensional displacement regimes across the ultra-high rockfill dam.
  • Three displacement clusters exhibited different evolution characteristics, with long-term accumulation dominating the upper dam zone, and periodic responses more pronounced in the central dam.
What are the implications of the main findings?
  • The improved HST/HTT models incorporating the predominant displacement component provide a more effective representation of nonlinear long-term displacement evolution.
  • Spatially resolved displacement analysis improves the understanding of dam responses to reservoir operation and environmental variations for long-term monitoring.

Abstract

Long-term displacement in ultra-high rockfill dams is spatially heterogeneous, yet point-based monitoring and single-track InSAR provide only a limited account of its three-dimensional evolution. To address this limitation, we develop a workflow combining multi-track three-dimensional InSAR reconstruction, temporal feature clustering and modified HST/HTT modeling. In the modified models, the conventional linear time term is replaced by a predominant displacement component, allowing nonlinear long-term behavior to be represented alongside hydraulic and thermal responses. Three Sentinel-1 tracks acquired between 2014 and 2023 were used to analyze the Pubugou Dam. Maximum vertical and eastward displacement rates reached 17.70 and 19.41 mm/yr, respectively, while cumulative vertical displacement reached approximately 178 mm. Three coherent displacement zones were resolved: the upper dam was dominated by long-term accumulation, the central section displayed the strongest periodic response, and the lower dam and abutments remained comparatively stable. The modified models reproduced the observed series more closely in sample than the conventional formulations, while the fitted coefficients indicated a stronger and more spatially variable response to reservoir level than to air temperature. This integrated analysis provides a spatially resolved account of long-term displacement and environmental response across an ultra-high rockfill dam.

1. Introduction

Large hydropower projects play a critical role in energy supply, flood regulation, and downstream risk mitigation [1]. Ultra-high rockfill dams are widely used in mountainous and seismically active regions due to their structural flexibility and adaptability to complex geological conditions [2,3,4,5]. In addition to long-term trends, reservoir-level fluctuations and ambient temperature variations can induce periodic displacement response at millimeter to centimeter scales [6,7]. These characteristics highlight the importance of continuous and spatially detailed displacement monitoring for understanding dam behavior and ensuring operational safety.
Multi-temporal Interferometric Synthetic Aperture Radar (InSAR) has become an effective tool for monitoring dam displacement, owing to its wide spatial coverage and millimeter-level measurement sensitivity [8,9]. Previous studies have demonstrated its capability in capturing long-term displacement trends of large dams, such as the Shuibuya and Xiaolangdi rockfill dams [10,11]. However, many InSAR-based studies rely on single-track line-of-sight measurements or focus on a limited number of representative points, which constrains the ability to capture the full spatial variability of dam displacement [9,12]. Given that near-polar SAR systems are primarily sensitive to vertical and east–west motion components, the combination of ascending and descending observations can improve the geometric interpretation of displacement but generally allows for the retrieval of only two-dimensional (2D) displacement components [13,14]. This capability has been demonstrated in previous studies. At the Atatürk clay-cored rockfill dam, the east–west displacement reached ~5 mm/yr during 2016–2020 and exceeded the vertical component, with the largest displacement concentrated at the dam crest [15]. In contrast, at the Sardoba earth-rockfill dam, the maximum vertical settlement rate exceeded 50 mm/yr during 2017–2020, while the cumulative east–west displacement at typical locations reached about 90–100 mm [16]. These results highlight the importance of multi-dimensional displacement characterization for understanding dam displacement behavior.
In rockfill dams, displacement patterns are shaped by construction sequence, material zoning, stress redistribution, and reservoir-induced hydraulic conditions, which can generate spatially heterogeneous displacement regimes that are not adequately represented by limited monitoring points or spatially averaged displacement series [17]. Spatial clustering based on cumulative three-dimensional displacement therefore provides a practical approach for delineating dam zones with similar integrated displacement characteristics [18,19]. Once these regimes are identified, their displacement time series can be further analyzed to distinguish long-term accumulation from periodic responses [18]. Such pattern-oriented analysis provides a basis for understanding spatial differences in displacement behavior.
In addition to geometric characterization, dam displacement is strongly influenced by external driving factors, including reservoir water-level fluctuations, temperature variations, and long-term creep evolution [20]. Statistical behavior models, such as the Hydrostatic-Seasonal-Time (HST) and Hydrostatic-Temperature-Time (HTT) models, are widely used to quantify the relationship between displacement and external forcing [21,22]. These models decompose displacement into contributions from water level, seasonal or temperature effects, and a time-dependent trend. However, conventional formulations typically represent the long-term component using a linear term and are often applied to single-point or spatially averaged observations. Such simplifications limit their ability to capture nonlinear long-term evolution and spatial heterogeneity in dam displacement. As a result, the linkage between spatially variable displacement patterns and statistical modeling remains insufficiently explored.
To address these gaps, this study investigates the spatially heterogeneous displacement behavior of the Pubugou ultra-high rockfill dam using multi-track Sentinel-1 datasets acquired from 2014 to 2023. Multi-track Sentinel-1 observations are first combined with a surface-parallel flow (SPF) constraint to reconstruct three-dimensional displacement time series over the dam surface. Spatially coherent dam zones are then identified by clustering temporal features of the displacement series. Finally, improved HST and HTT models incorporating the predominant long-term displacement components are used to quantify the spatial variability of reservoir-level, seasonal, temperature, and time-dependent responses. Through this framework, the study aims to reveal how internal structural adjustment and external hydraulic–thermal loading jointly control the heterogeneous displacement evolution of an ultra-high rockfill dam.

2. Study Area and Datasets

2.1. Pubugou Dam and Reservoir Setting

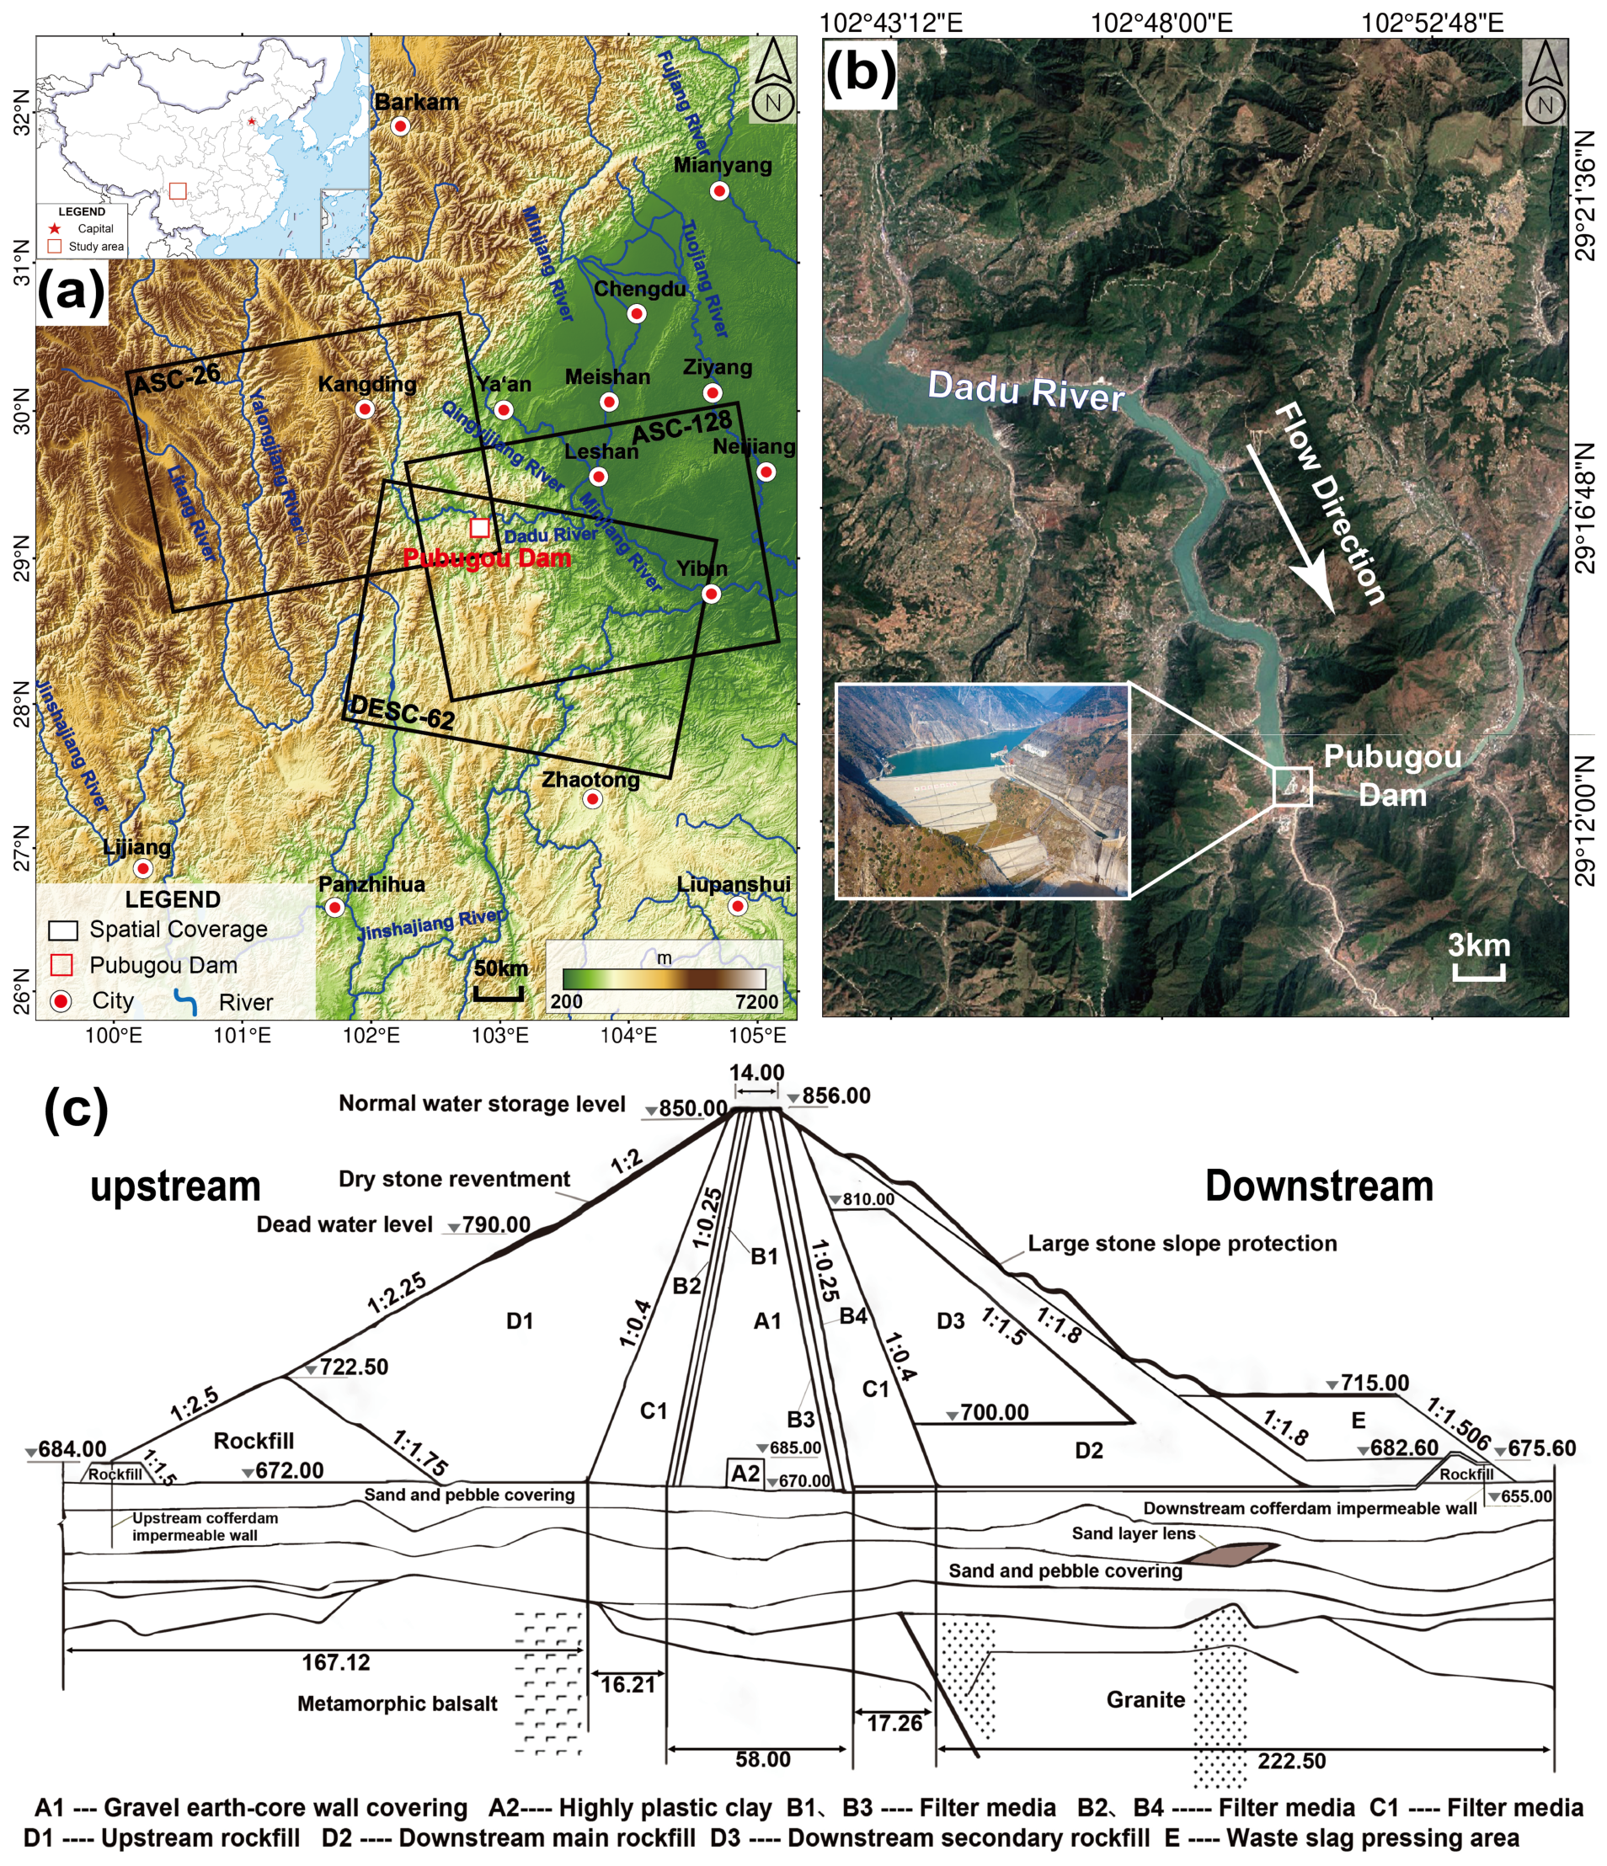
The Pubugou Hydropower Station is in the middle reaches of the Dadu River (Figure 1). Constructed between 2005 and 2010, the station primarily serves functions of power generation and flood control [23]. The dam is situated within a mountainous canyon characterized by an asymmetric V-shaped valley and significant topographic relief. Tectonically, it lies on the western margin of the Yangtze paraplatform, an area with relatively low structural activity. The foundation and abutment slopes are composed predominantly of granite and limestone, exhibiting good rock-mass integrity [24].
The Pubugou Dam is a typical ultra-high rockfill dam with a central gravelly soil core. The dam is 186 m high and has a crest length of 540 m, impounding a reservoir with a total reservoir capacity of 5.39 × 10⁹ m3 [25]. The dam includes upstream and downstream rockfill shells, complemented by filter and transition zones composed of graded granular materials. The reservoir operates between a normal water level of 850 m and a dead water level of 790 m [26]. The region is characterized by a subtropical monsoon climate, with a mean annual temperature of 15–18 °C and annual precipitation of 800–1200 mm concentrated in the summer months [27]. The monsoon climate and seasonal reservoir regulation produce pronounced annual variations in hydrological and thermal conditions, providing important external forcing for displacement analysis.

2.2. Datasets

Three Sentinel-1 SAR datasets acquired in Interferometric Wide Swath (IW) mode were used in this study, corresponding to orbit tracks 26, 62, and 128 (Table 1 and Figure 1). Tracks 26 and 128 were collected from ascending orbits, whereas track 62 was acquired from descending orbit. The combination of these multi-track observations provides complementary viewing geometries, enabling improved characterization of dam displacement [12,28]. A 30 m resolution ALOS World 3D digital surface model (DSM) was used for coregistration, topographic phase removal and geocoding.
Reservoir water-level records were collected from the Large and Medium Reservoir Information System maintained by the Sichuan Provincial Department of Water Resources and supplemented with the Yangtze River Basin Water Reservoir (YWR) dataset v1.0 [29]. Air temperature data were acquired from the RP5 meteorological station (station ID: 56287). Both datasets have a daily temporal resolution, providing a reliable temporal basis for analyzing lagged responses and hysteretic relationships between external forcing and dam displacement.

3. Methodology

3.1. Time Series InSAR Processing and Three-Dimensional Displacement Reconstruction

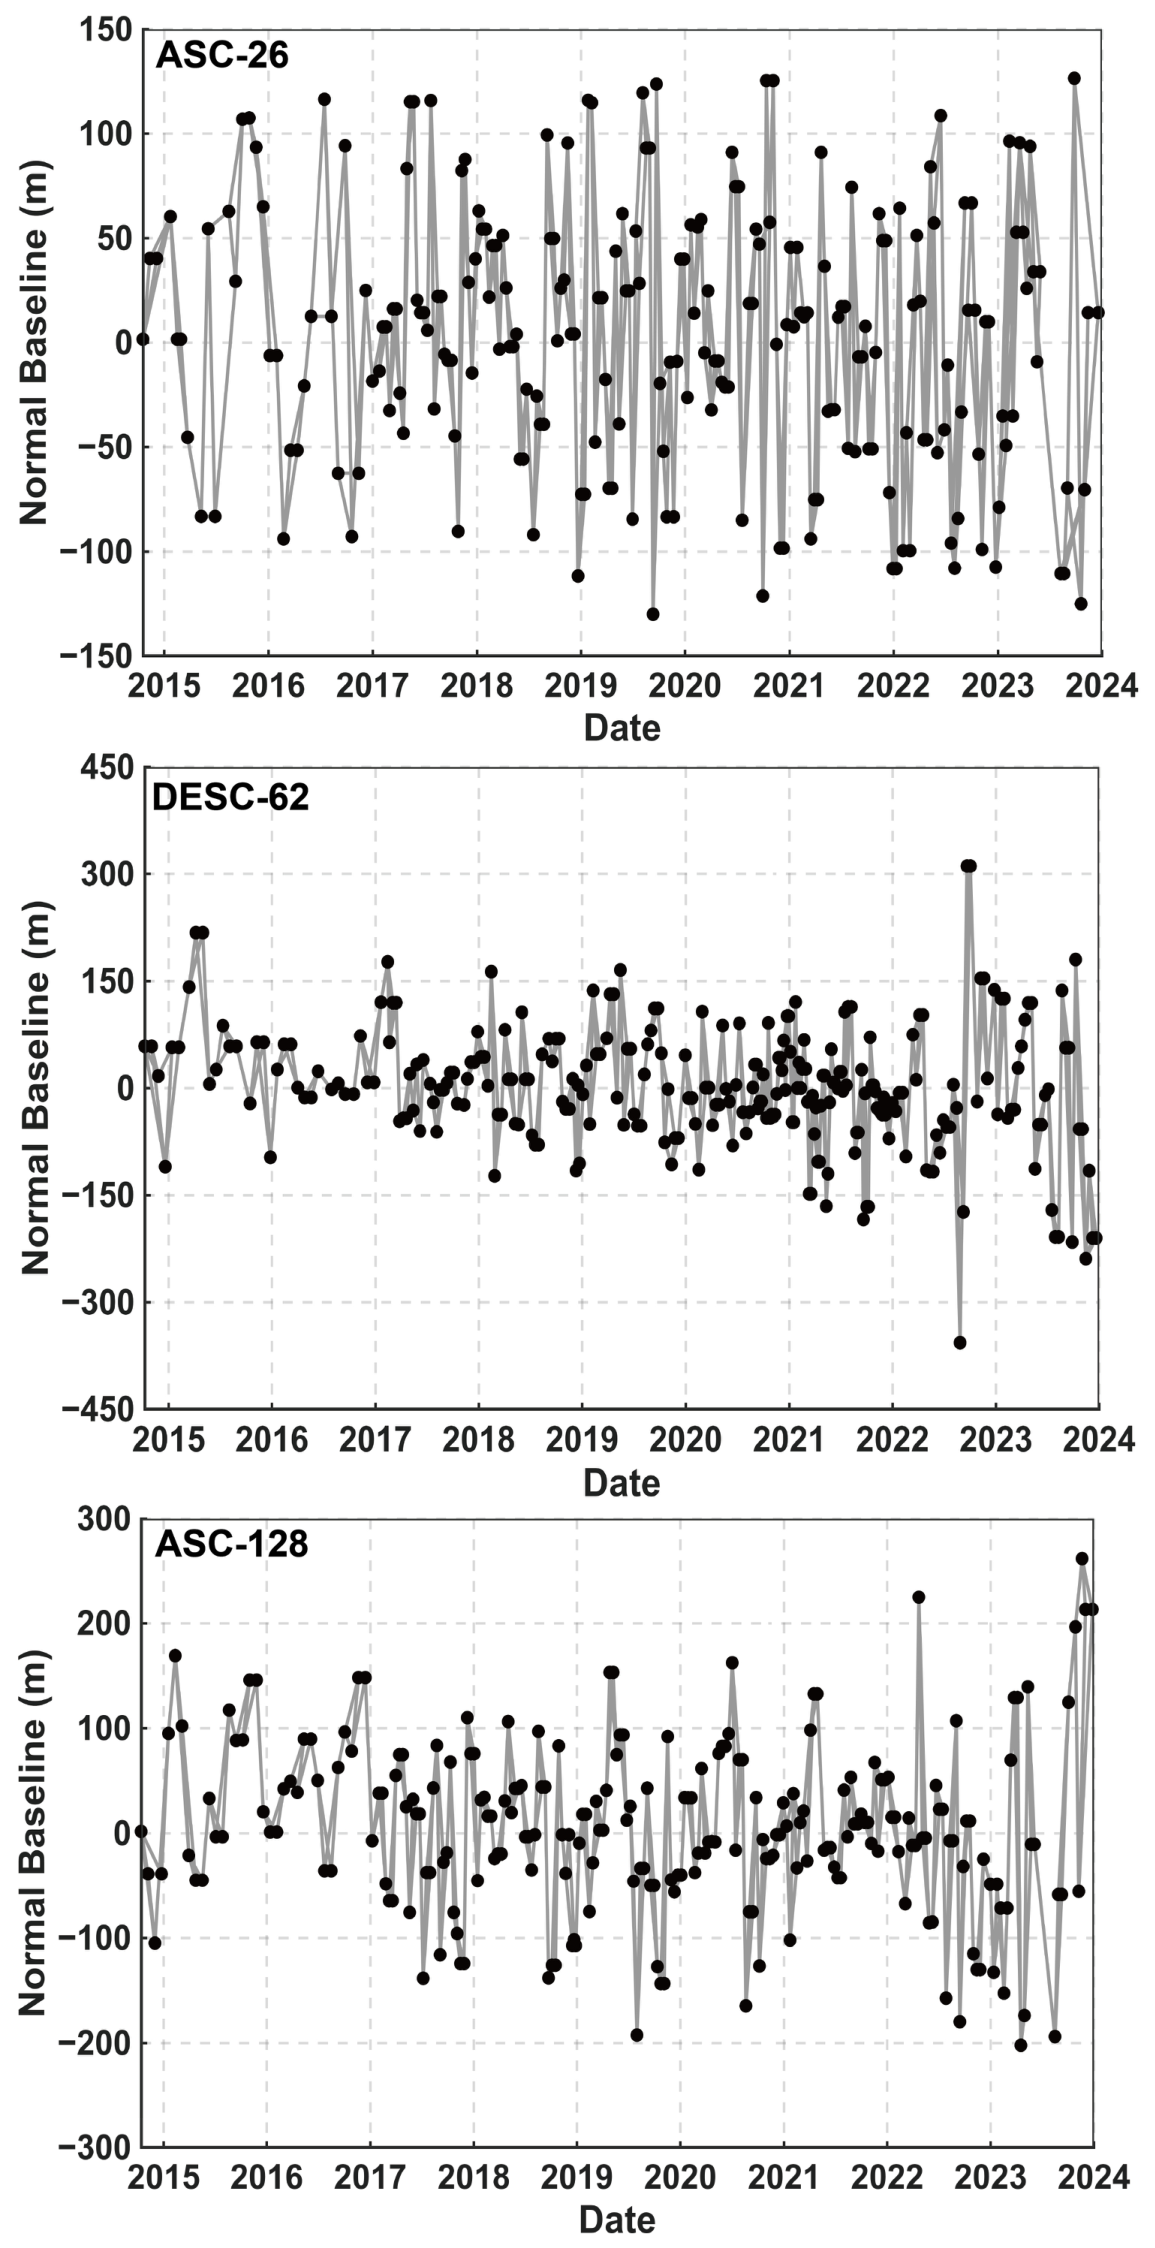
Time series InSAR processing was first performed independently for each Sentinel-1 dataset to obtain line-of-sight (LOS) displacement observations. The Sentinel-1 images in each dataset were co-registered to a reference image using the Enhanced Spectral Diversity (ESD) method to ensure accurate alignment of TOPS bursts [30]. Interferometric pairs were then generated according to the temporal and perpendicular baseline networks shown in Figure 2, with multi-look factors of 4 in azimuth direction and 1 in range direction. The topographic phase was removed using the AW3D DSM. A Goldstein phase filter was subsequently applied to improve the quality of the interferograms. The filtered differential interferograms were unwrapped using the Minimum Cost Flow (MCF) algorithm. The unwrapped interferometric phase Δ ϕ for each pixel can be expressed as follows:
Δ ϕ = Δ ϕ d i s p + Δ ϕ d e m + Δ ϕ a t m + Δ ϕ o r b + Δ ϕ n
where Δ ϕ d i s p denotes the displacement phase, and Δ ϕ d e m , Δ ϕ a t m , Δ ϕ o r b and Δ ϕ n represent phase contributions induced by DEM error, atmospheric phase delay, orbital error, and noise, respectively. Orbital errors were modeled using low-order polynomial fitting, while DEM-related phase components were estimated from perpendicular baseline geometry and atmospheric phase delays were corrected using Generic Atmospheric Correction Online Service (GACOS) products [31]. After removing these error components, time series LOS displacement for each dataset was retrieved through least-squares inversion. LOS velocity precision was estimated from the interferometric coherence and radar wavelength as follows:
V p r e c i s i o n = λ 4 π 1 γ 2 2 γ 2
where λ is the radar wavelength and γ is the interferometric coherence. V p r e c i s i o n represents internal precision rather than externally validated accuracy; lower values indicate higher precision.
The LOS displacement time series derived from two ascending and one descending Sentinel-1 datasets were subsequently used to estimate the three-dimensional displacement field. For the i-th orbit, the relationship between 3D and LOS displacement can be expressed as follows:
L O S i = s i n θ i s i n α i · V n s i n θ i c o s α i · V e + c o s θ i · V v
where V n , V e and V v denote northward, eastward, and vertical displacement components, respectively, while θ i and α i are incidence and azimuth angles.
Because Sentinel-1 operates in a near-polar orbit, LOS measurements are primarily sensitive to the eastward and vertical motions, whereas the north–south component is weakly constrained. Therefore, even multi-track SAR observations require an additional constraint for stable three-dimensional displacement reconstruction. In this study, a surface-parallel flow (SPF) constraint was introduced to regularize the inversion, assuming that displacement is approximately related to the local topographic surface [32]. The SPF constraint can be expressed as follows:
V v = d H d y V n + d H d x V e
where H x , y represents the surface elevation, and d H d y and d H d x denote the topographic slopes in the north–south and east–west directions, respectively. The SPF constraint is reasonable for this study because the dominant displacement of rockfill dams is generally associated with gravity-driven settlement and slope-parallel adjustment.
Since the three Sentinel-1 tracks were acquired on different dates, their LOS displacement time series were first restricted to the common observation period from 19 October 2014 to 19 December 2023. A common temporal framework was constructed from the union of the acquisition dates of the three tracks, and missing LOS observations at these dates were estimated separately for each track using time-based linear interpolation between adjacent valid observations. No extrapolation was performed beyond the valid temporal coverage of any track. The temporally aligned LOS observations were then combined with the SPF constraint to reconstruct the three-dimensional displacement components.
The LOS displacement represents the projection of the ground displacement vector onto the radar viewing direction; therefore, multi-track observations with different acquisition geometries can be integrated to estimate displacement components in different directions. As the north–south component is poorly constrained by near-polar SAR observations, the SPF assumption was introduced to reduce the number of unknowns and improve the stability of the inversion [33]. The relationship between LOS displacement and three-dimensional displacement components was expressed as follows:
L O S 1 L O S 2 L O S 3 0 = sin θ 1 sin α 1 sin θ 1 cos α 1 cos θ 1 sin θ 2 sin α 2 sin θ 2 cos α 2 cos θ 2 sin θ 3 sin α 3 sin θ 3 cos α 3 cos θ 3 d H / d y d H / d x 1 V n V e V v
The three-dimensional displacement field was retrieved using constrained regularized least squares. The three-track V p r e c i s i o n values were propagated through the inversion as:
C 3 D = H C L O S H T
where C L O S is the diagonal covariance matrix containing the squared V p r e c i s i o n values, and H is the mapping matrix of the constrained inversion. Component uncertainties were obtained from the square roots of the diagonal elements of C 3 D . The effective condition number of the augmented design matrix was used to assess inversion stability.

3.2. Displacement Pattern Clustering

K-means clustering was used to identify spatially coherent displacement patterns across the dam. Eight features were extracted from each cumulative three-dimensional displacement series: mean, linear slope, standard deviation, maximum, minimum, range, recent slope and curvature. The recent slope was calculated from the final ten observations, while curvature was represented by the quadratic coefficient. Together, these features describe displacement magnitude, variability and temporal evolution.
After standardization, the data were partitioned by minimizing the within-cluster sum of squares:
J = k = 1 K X i C k | x i u k | 2
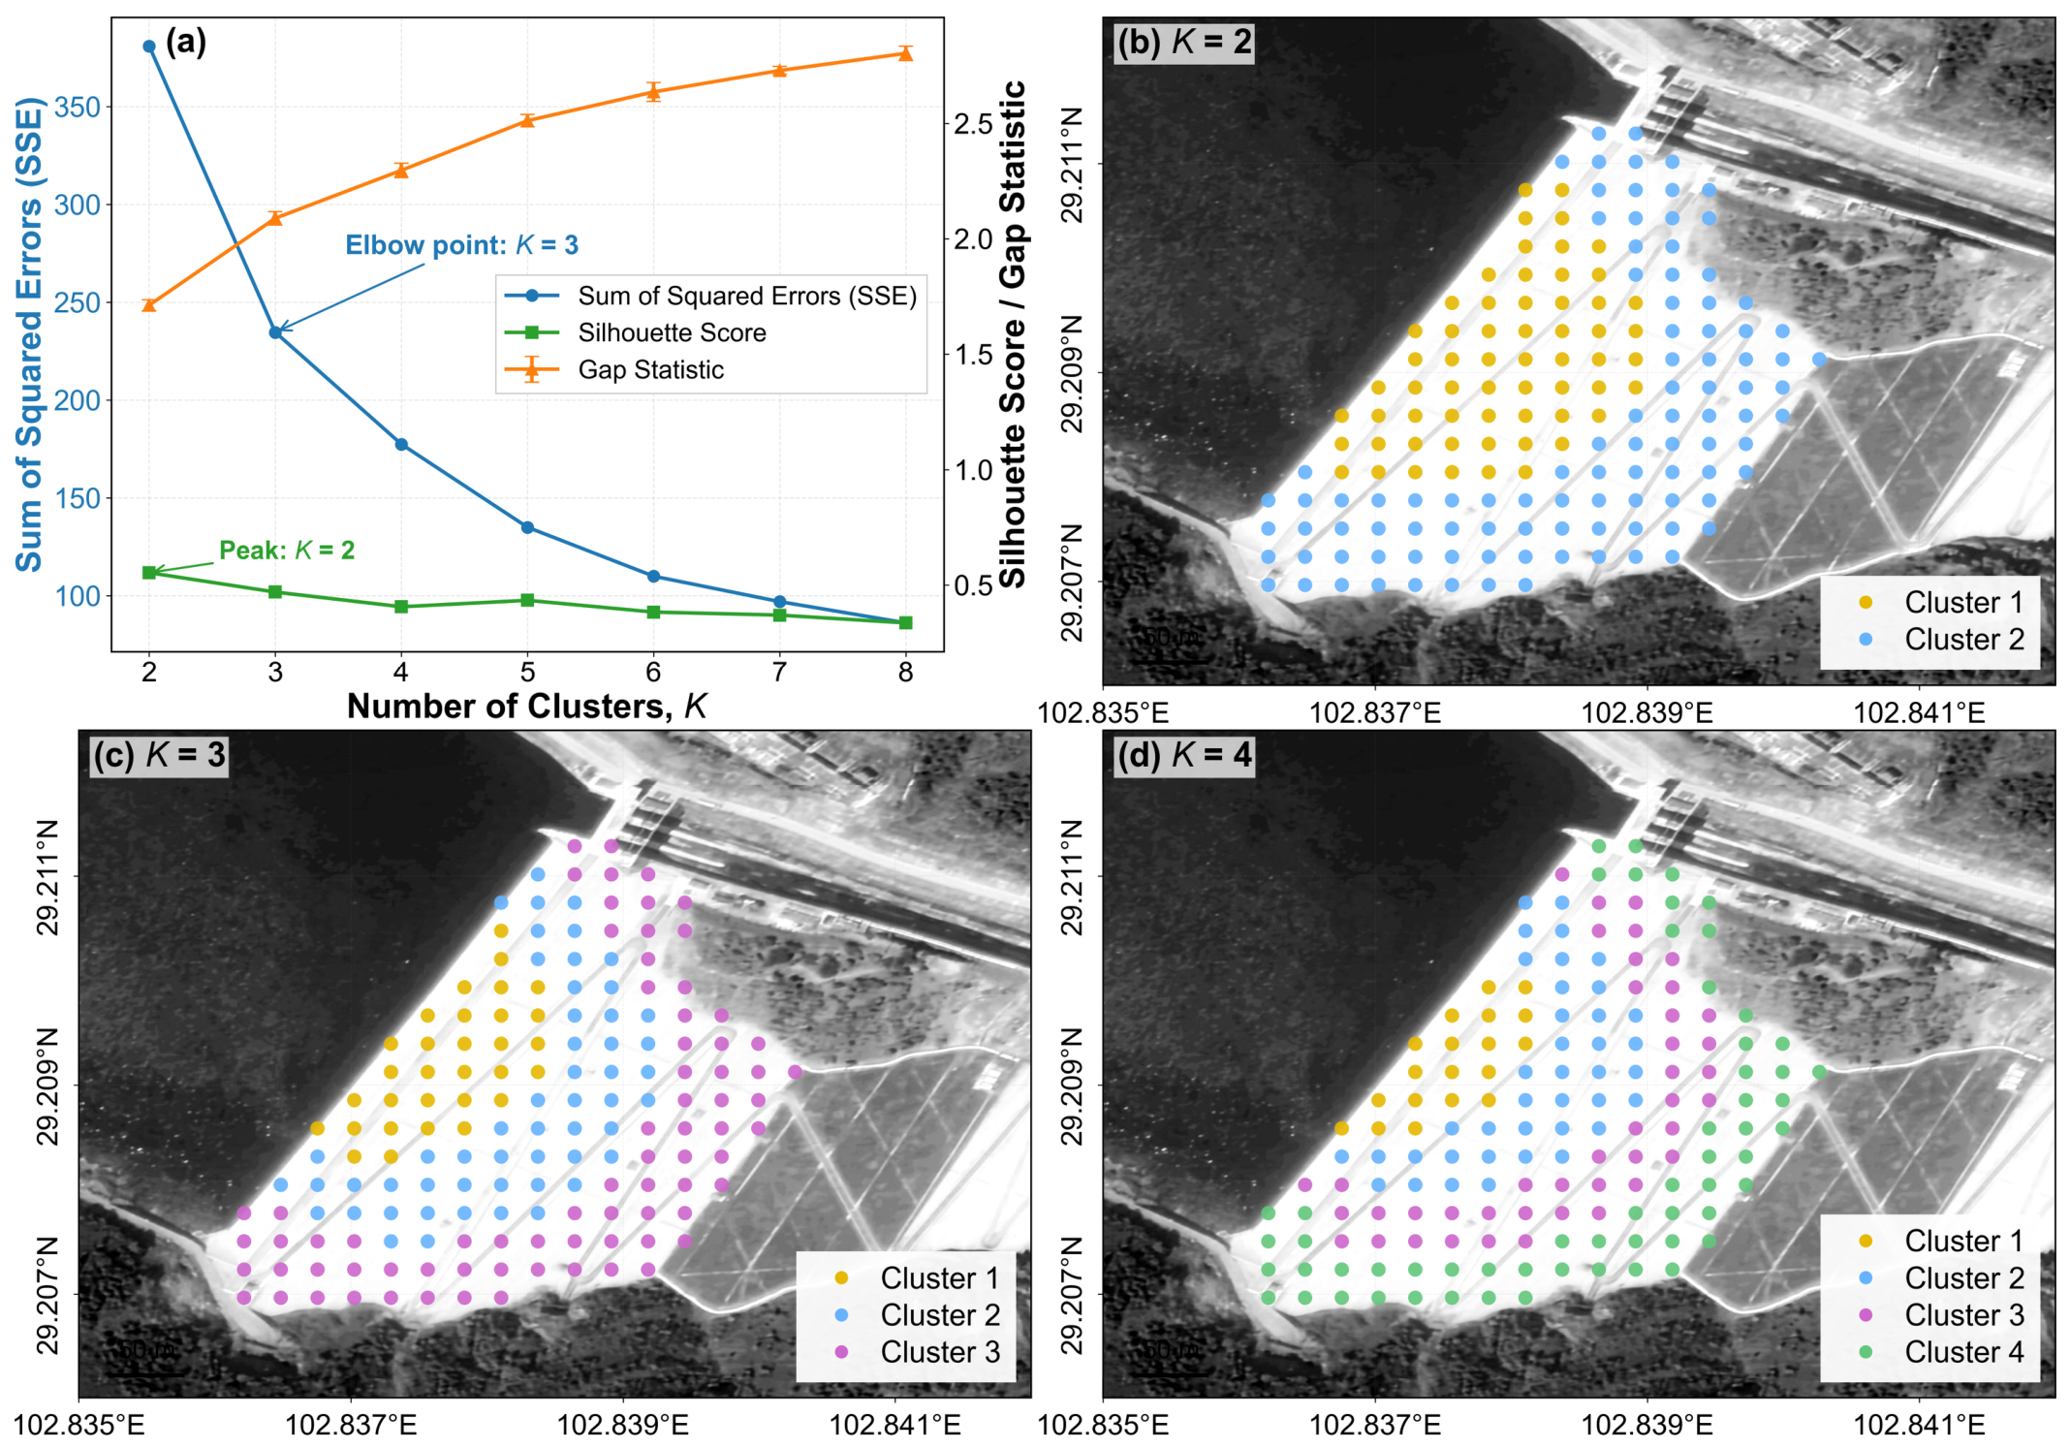
where C k and u k denote cluster k and its centroid, respectively. Values of K from 2 to 5 were evaluated using SSE, silhouette score, gap statistic and the spatial coherence of the resulting partitions [34]. The final solution was selected by balancing quantitative performance and spatial interpretability.

3.3. Improved HST and HTT Models

Statistical behavior models were used to quantify the relationship between dam displacement and external forcing. The Hydrostatic-Seasonal-Time (HST) model represents displacement as the sum of hydrostatic, seasonal, and time-dependent components, whereas the Hydrostatic-Temperature-Time (HTT) model replaces the seasonal component with an explicit temperature-related term [21,35]. In conventional formulations, the time-dependent component is commonly represented by a linear time term. However, this simplification may be insufficient for high rockfill dams, where long-term displacement often evolves nonlinearly due to progressive particle rearrangement, creep, and structural adjustment.
To better represent nonlinear long-term displacement evolution, this study introduced a predominant displacement component derived from hydrological year-based kinematic decomposition [36] of the time series displacement. The predominant cumulative displacement was reconstructed as follows:
D p r e t = t 0 t V 0 τ d τ
where V 0 τ denotes the predominant displacement rate within each hydrological year. This reconstructed component preserves the observed staged long-term displacement trajectory and was used to replace the conventional linear time term in the HST and HTT models.
The improved HST and HTT models are expressed as follows:
δ H S T = a h ( t ) + b 1 s i n s + b 2 cos s + b 3 sin 2 s + b 4 cos 2 s + λ D p r e t + d
δ H T T = a h t + b T t + λ D p r e t + d
where δ denotes cumulative displacement, h ( t ) and T ( t ) represent reservoir water level and air temperature, respectively; t is time, and the angular time variable is defined as s = 2 π t 365.25 . Coefficients a , b , d and λ are regression coefficients. Reservoir water level and air temperature are used as external forcing variables, and the remaining coefficients are regression parameters estimated from the displacement time series.
The classical and improved HST/HTT models were first fitted to the time series displacements to compare their fitting performance. Model performance was evaluated using the coefficient of determination (R2), root mean square error (RMSE), and residual distributions. The improved models were then applied to all valid measurement points to analyze the spatial variability of fitted parameters, including water-level sensitivity, seasonal or temperature response, nonlinear long-term behavior, and model fitting accuracy.

4. Results

4.1. Displacement Rate Maps of the Pubugou Dam

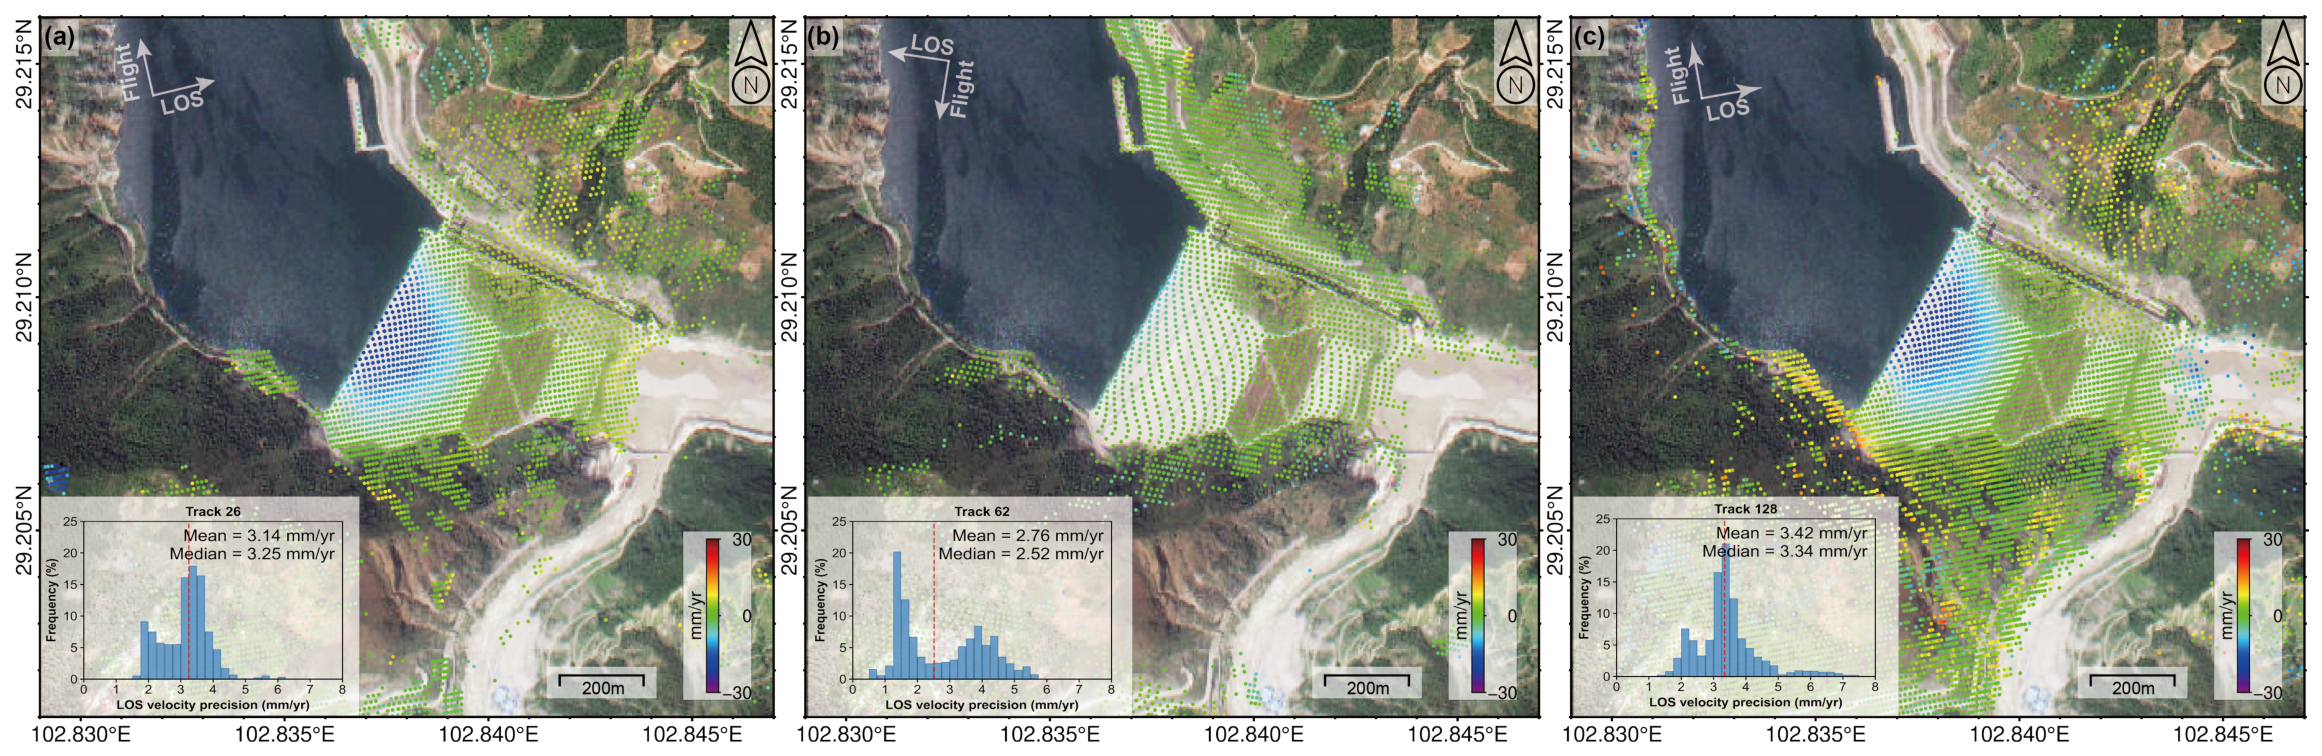
Figure 3 shows the LOS displacement rates derived from ascending Sentinel-1 tracks 26 and 128 and descending track 62. Positive and negative values represent motion toward and away from the satellite, respectively. The two ascending tracks show broadly consistent displacement patterns, with relatively large LOS displacement rates mainly distributed in the upper and middle parts of the dam. The descending dataset contains fewer valid measurement points, mainly due to geometric distortions such as layover and shadow effects. Median V p r e c i s i o n values were 3.25, 2.52, and 3.34 mm/yr for tracks 26, 62 and 128, respectively.
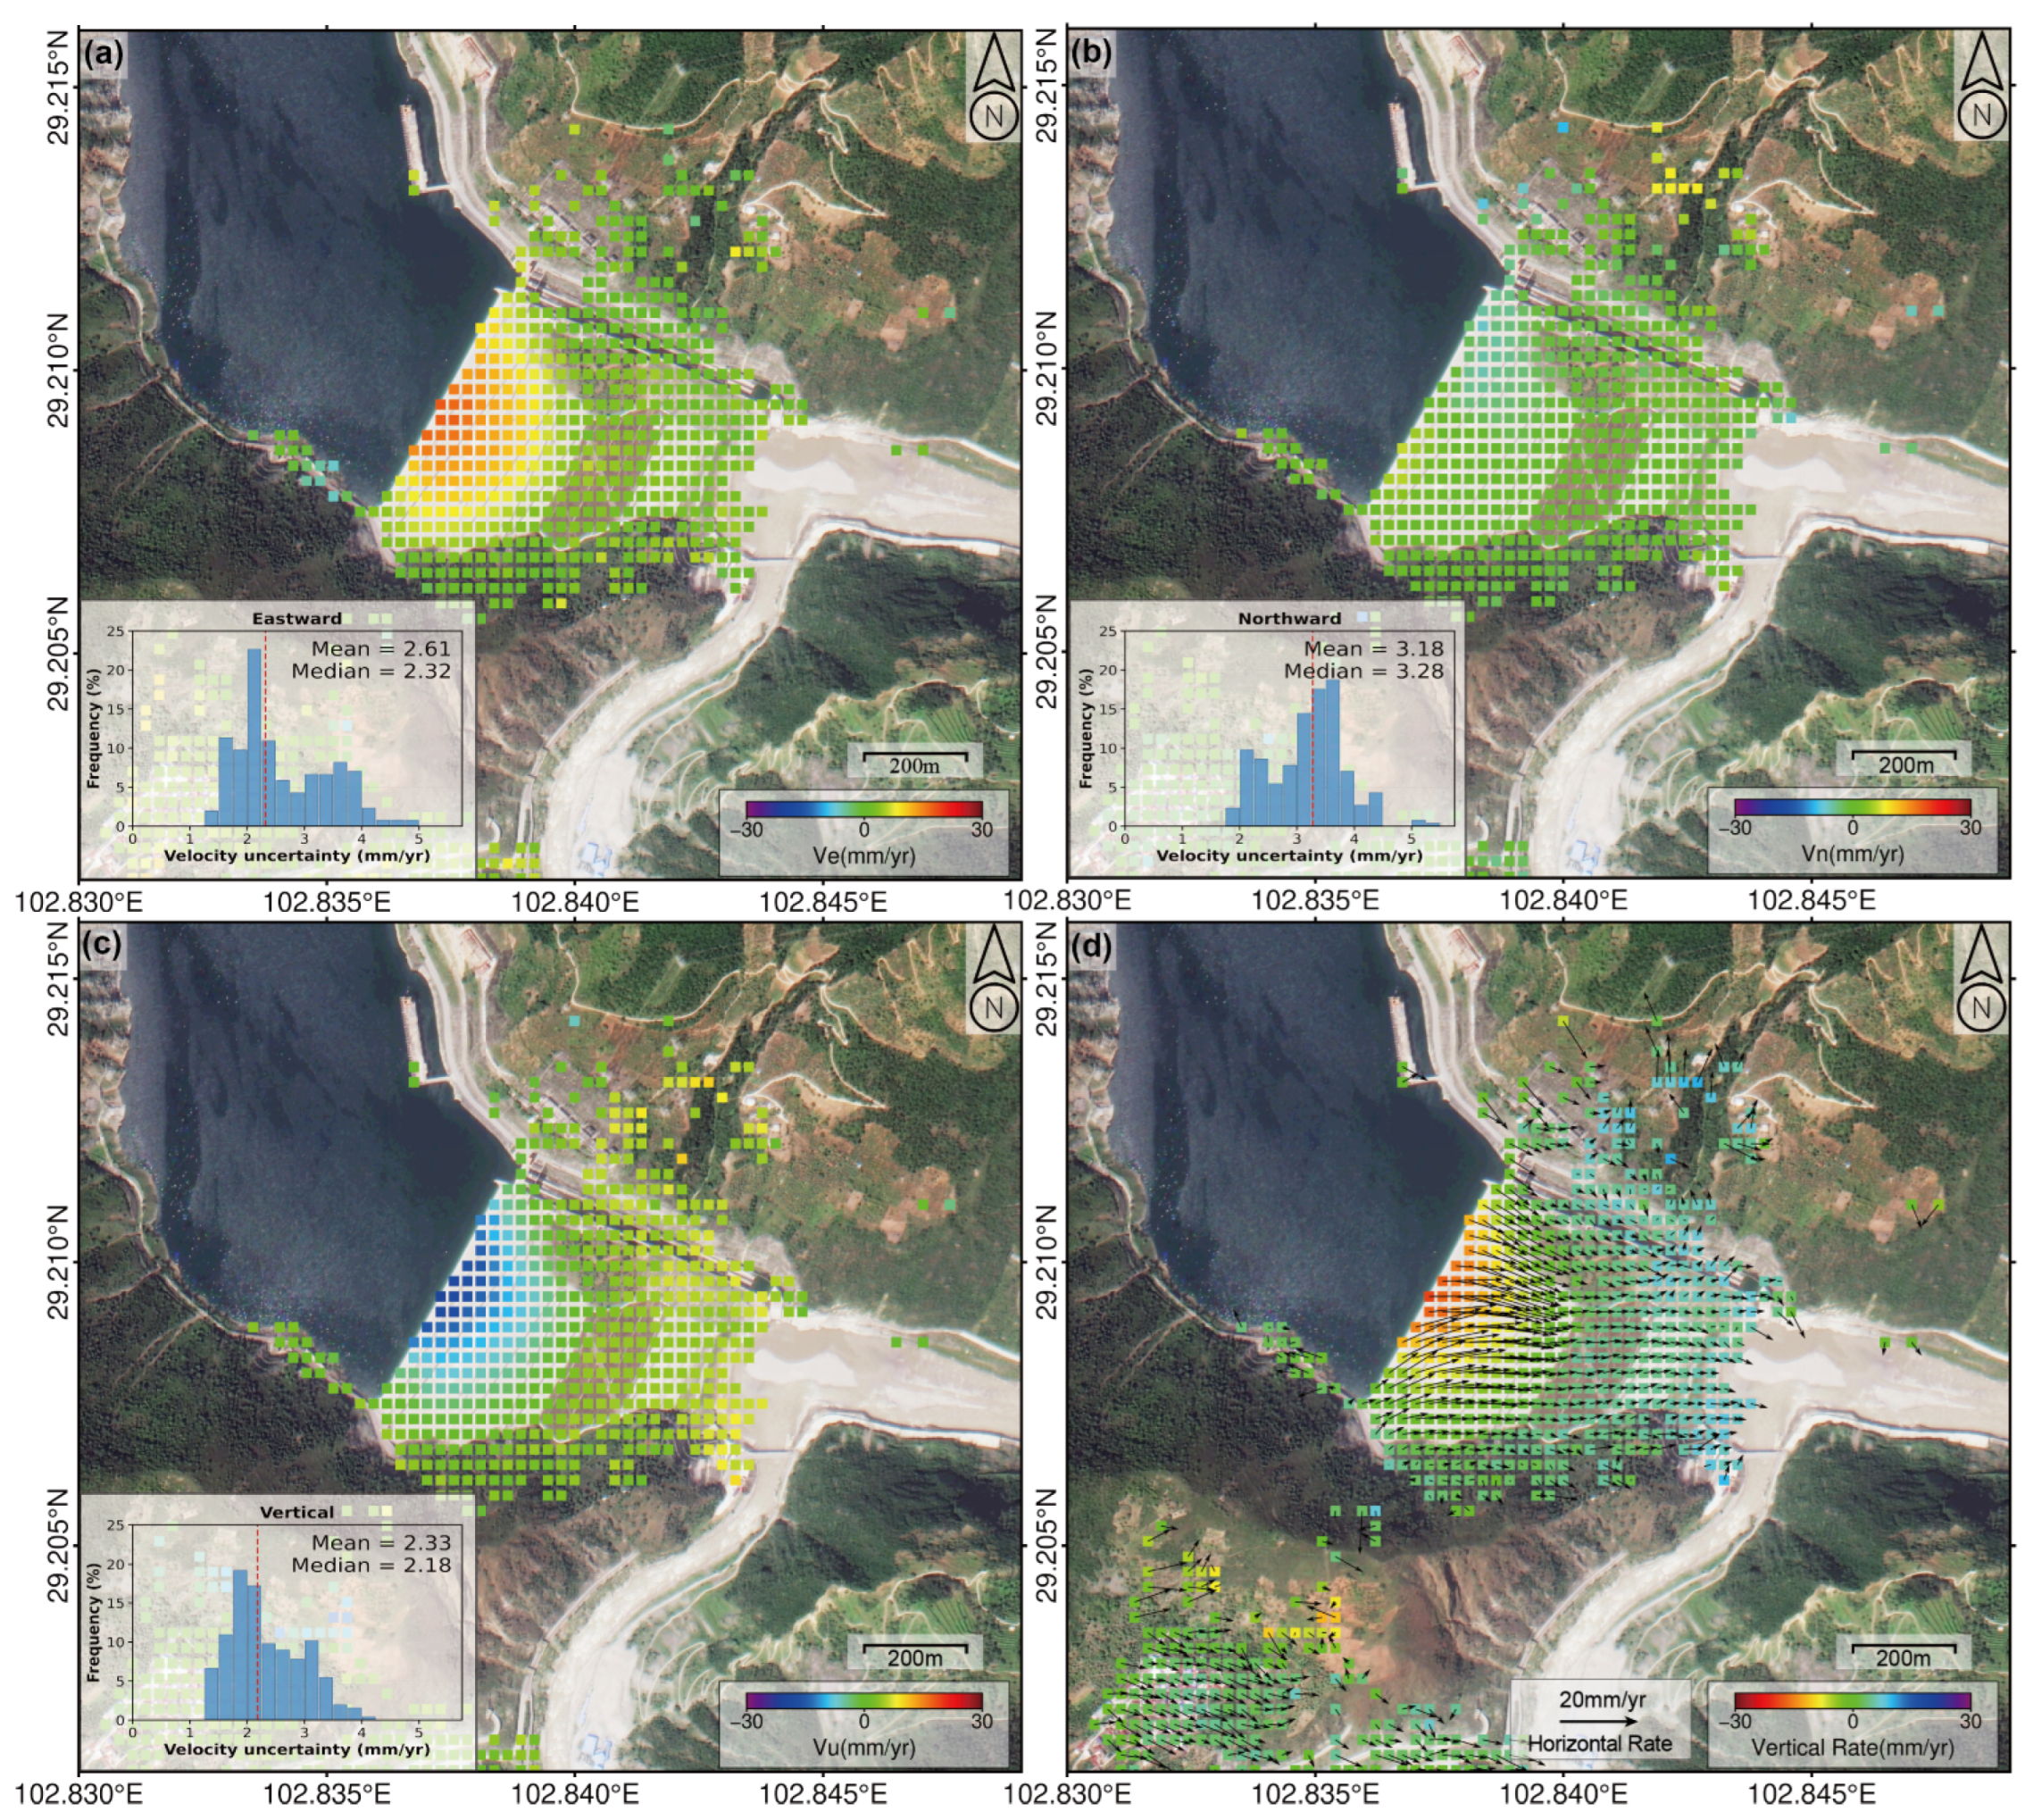
The multi-track observations were used to reconstruct the three-dimensional displacement field of the dam (Figure 4). The maximum displacement rates in the vertical, eastward, and northward directions are 17.70, 19.41, and 8.12 mm/yr, respectively. The displacement is mainly distributed in vertical and eastward directions, whereas the northward component is relatively small. This directional difference is consistent with the sensitivity of Sentinel-1 LOS observations to vertical and east–west motion components [12]. Median uncertainties were 2.32, 3.28 and 2.18 mm/yr for the eastward, northward and vertical components, respectively. The effective condition number ranged from 8.49 to 9.02, with a median of 9.00. The larger northward uncertainty reflects the limited north–south sensitivity of Sentinel-1 observations.
The cumulative vertical displacement also shows clear spatial variability. The largest cumulative displacement is concentrated in the middle and upper dam, with a maximum value of approximately 178 mm. In contrast, the lower dam and abutment areas exhibit much smaller displacement, generally close to 0 mm. The displacement gradually decreases from the upper dam toward the downstream toe.

4.2. Displacement Patterns and Kinematics of the Pubugou Dam

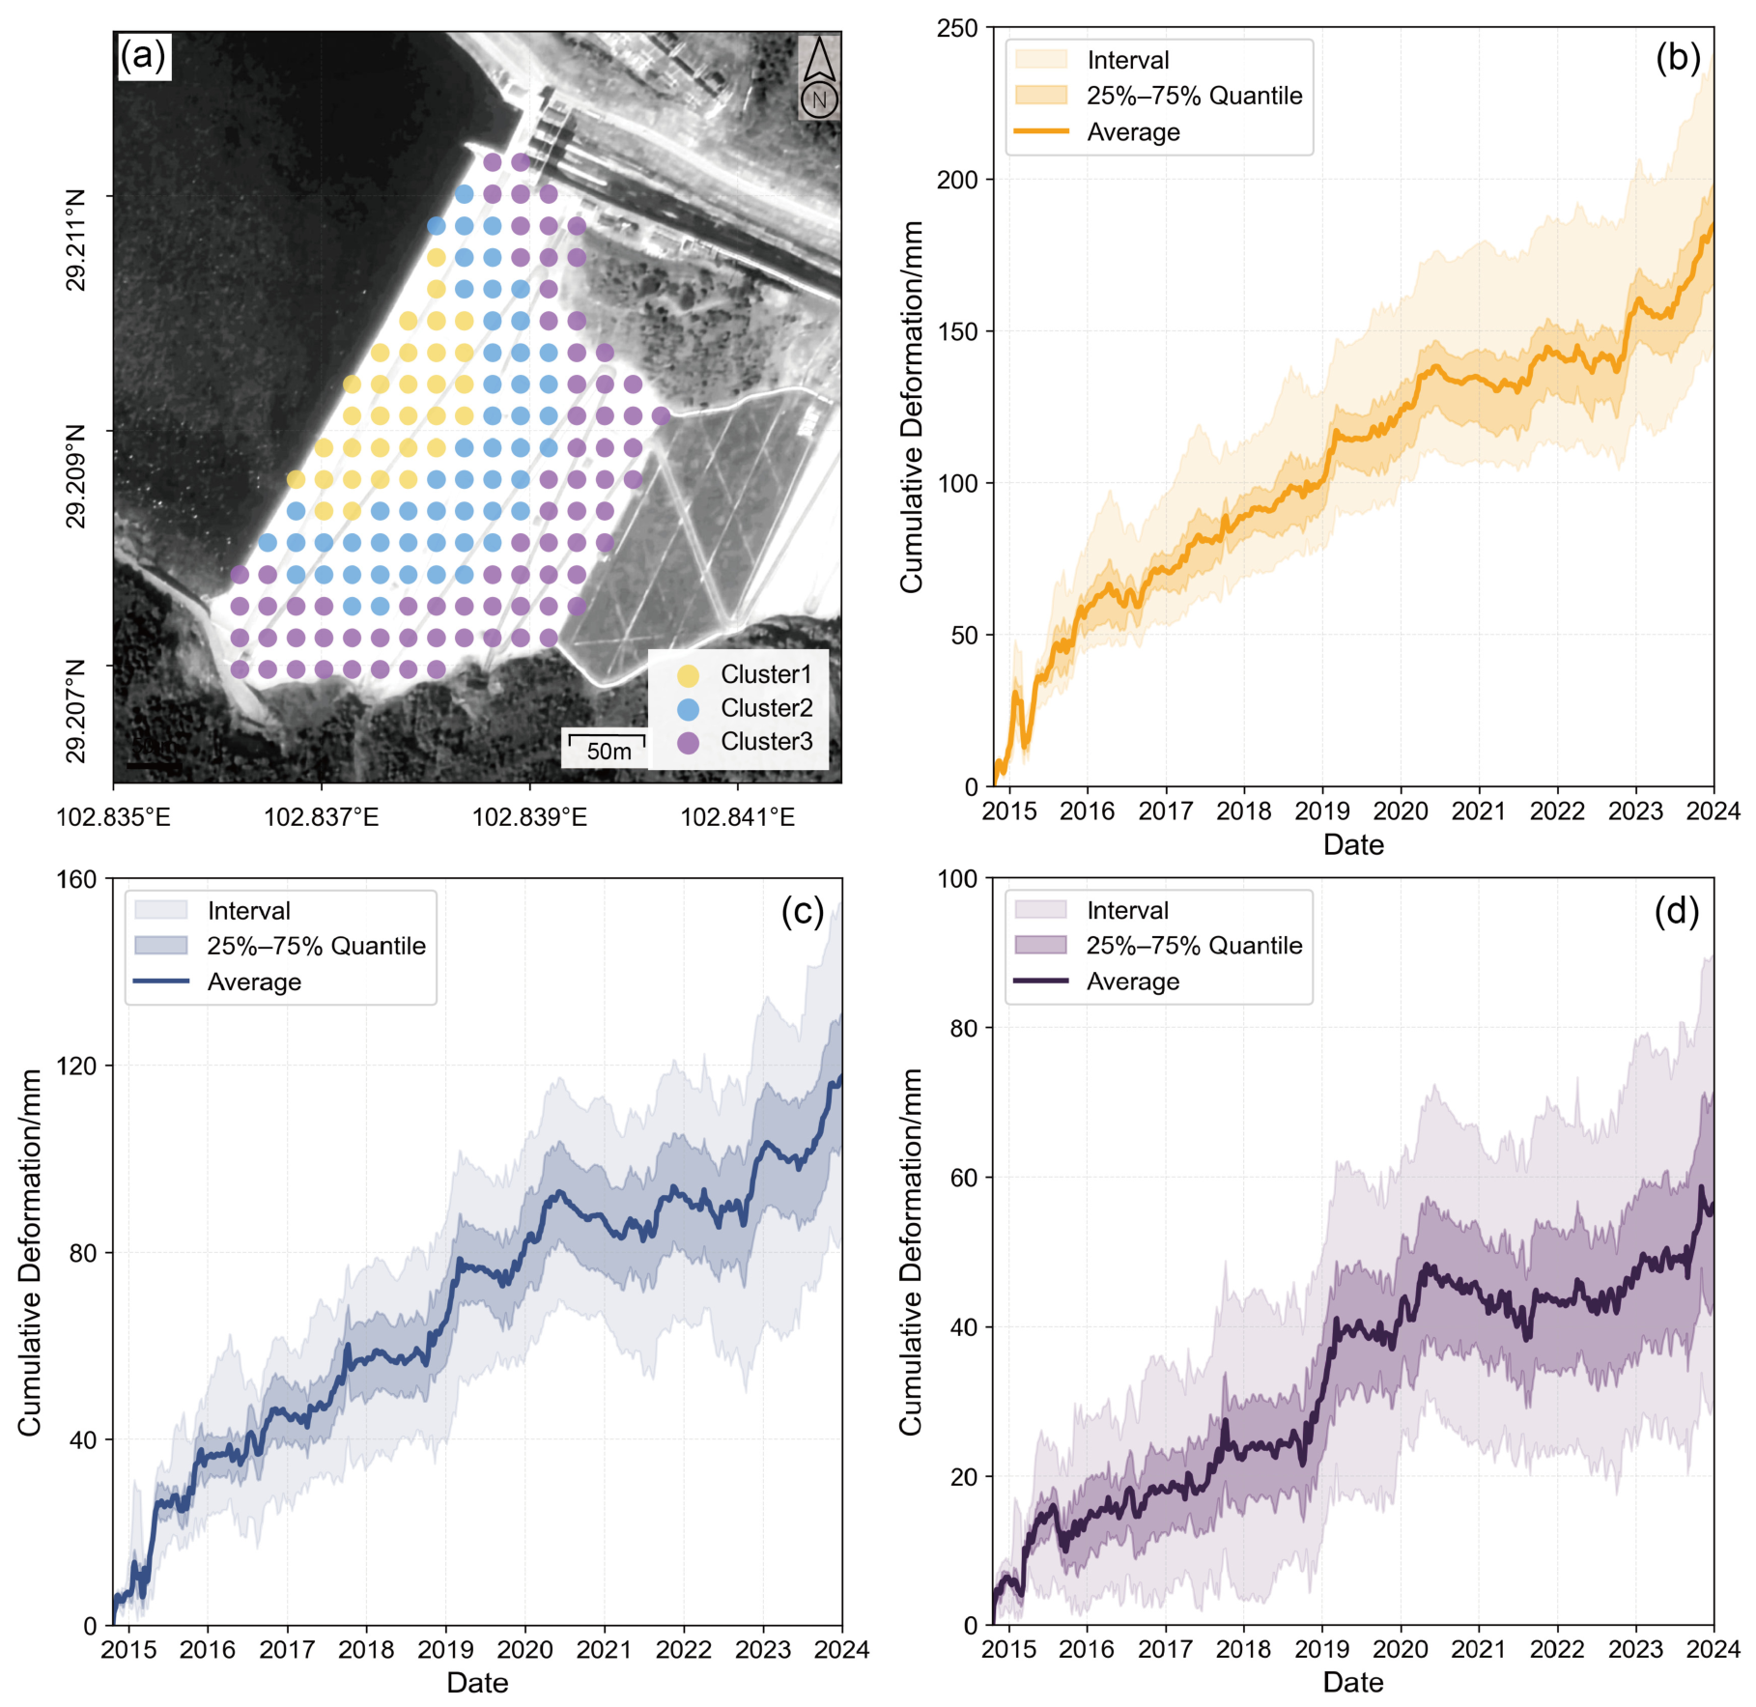
Three displacement clusters were identified (Figure 5a). K = 2 achieved the highest silhouette score (0.553), whereas K = 3 reduced the SSE by 38.42% while retaining a silhouette score of 0.469 (Table A1). Spatial comparison showed that K = 2 merged distinct displacement zones, whereas K = 4 mainly subdivided existing zones. K = 3 therefore provided the most interpretable spatial partition (Figure A1).
The cumulative displacement series of the three clusters are shown in Figure 5b–d. Cluster 1 exhibits the largest cumulative displacement, exceeding 140 mm by December 2023, followed by Cluster 2 with approximately 100 mm, whereas Cluster 3 remains below 60 mm. The wider interquartile ranges for Clusters 1 and 2 indicate greater variability among measurement points than in Cluster 3. Spatially, Cluster 1 is mainly distributed in the upper dam and corresponds to the later-stage fill zone, Cluster 2 occupies the middle dam and represents the main rockfill body, whereas Cluster 3 is concentrated near the downstream toe and both abutments, corresponding to the early-stage fill zone. The spatial consistency between clustering results and dam structural zones suggests that the identified clusters represent different displacement evolution regimes rather than purely statistical groupings.
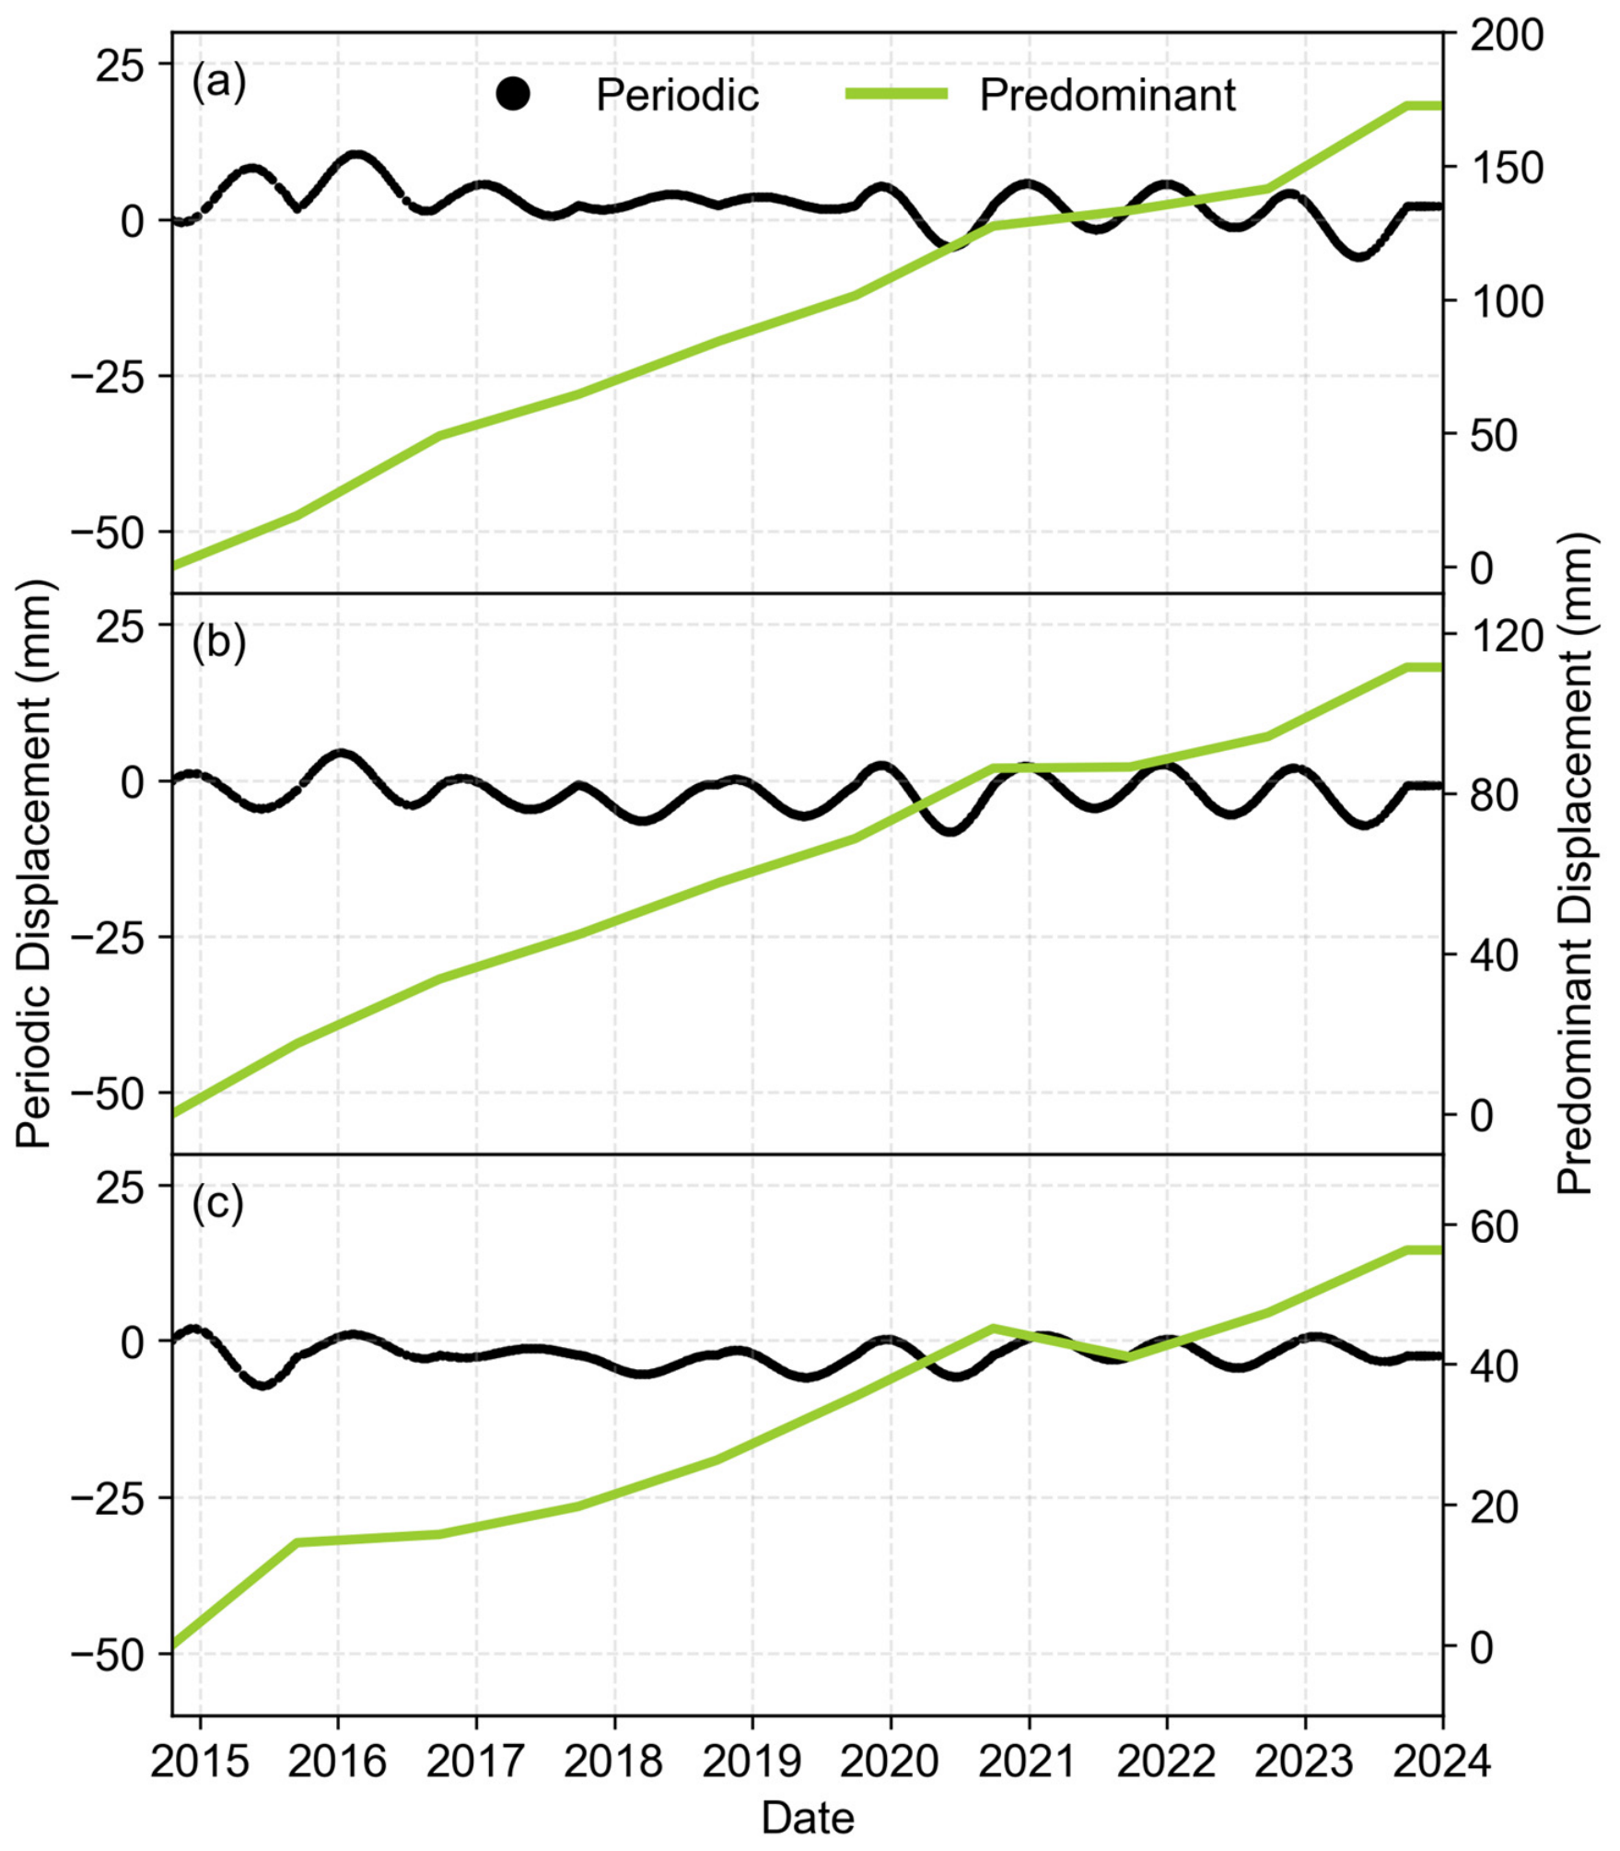
The decomposition of the cluster-mean displacement series further reveals differences in temporal components (Figure 6). The predominant component dominates the long-term displacement evolution in all three clusters and reaches 172.47, 115.51, and 56.76 mm for Clusters 1, 2, and 3, respectively. In contrast, the periodic component exhibits much smaller amplitudes and remains generally within ±10 mm. Among the three clusters, Cluster 2 shows the most pronounced periodic fluctuations, whereas Cluster 3 exhibits the weakest periodic response. These results indicate that the clusters differ not only in displacement magnitude, but also in the relative contributions of long-term accumulation and periodic response.

4.3. Model Fitting Performance and Spatial Variability of Parameters

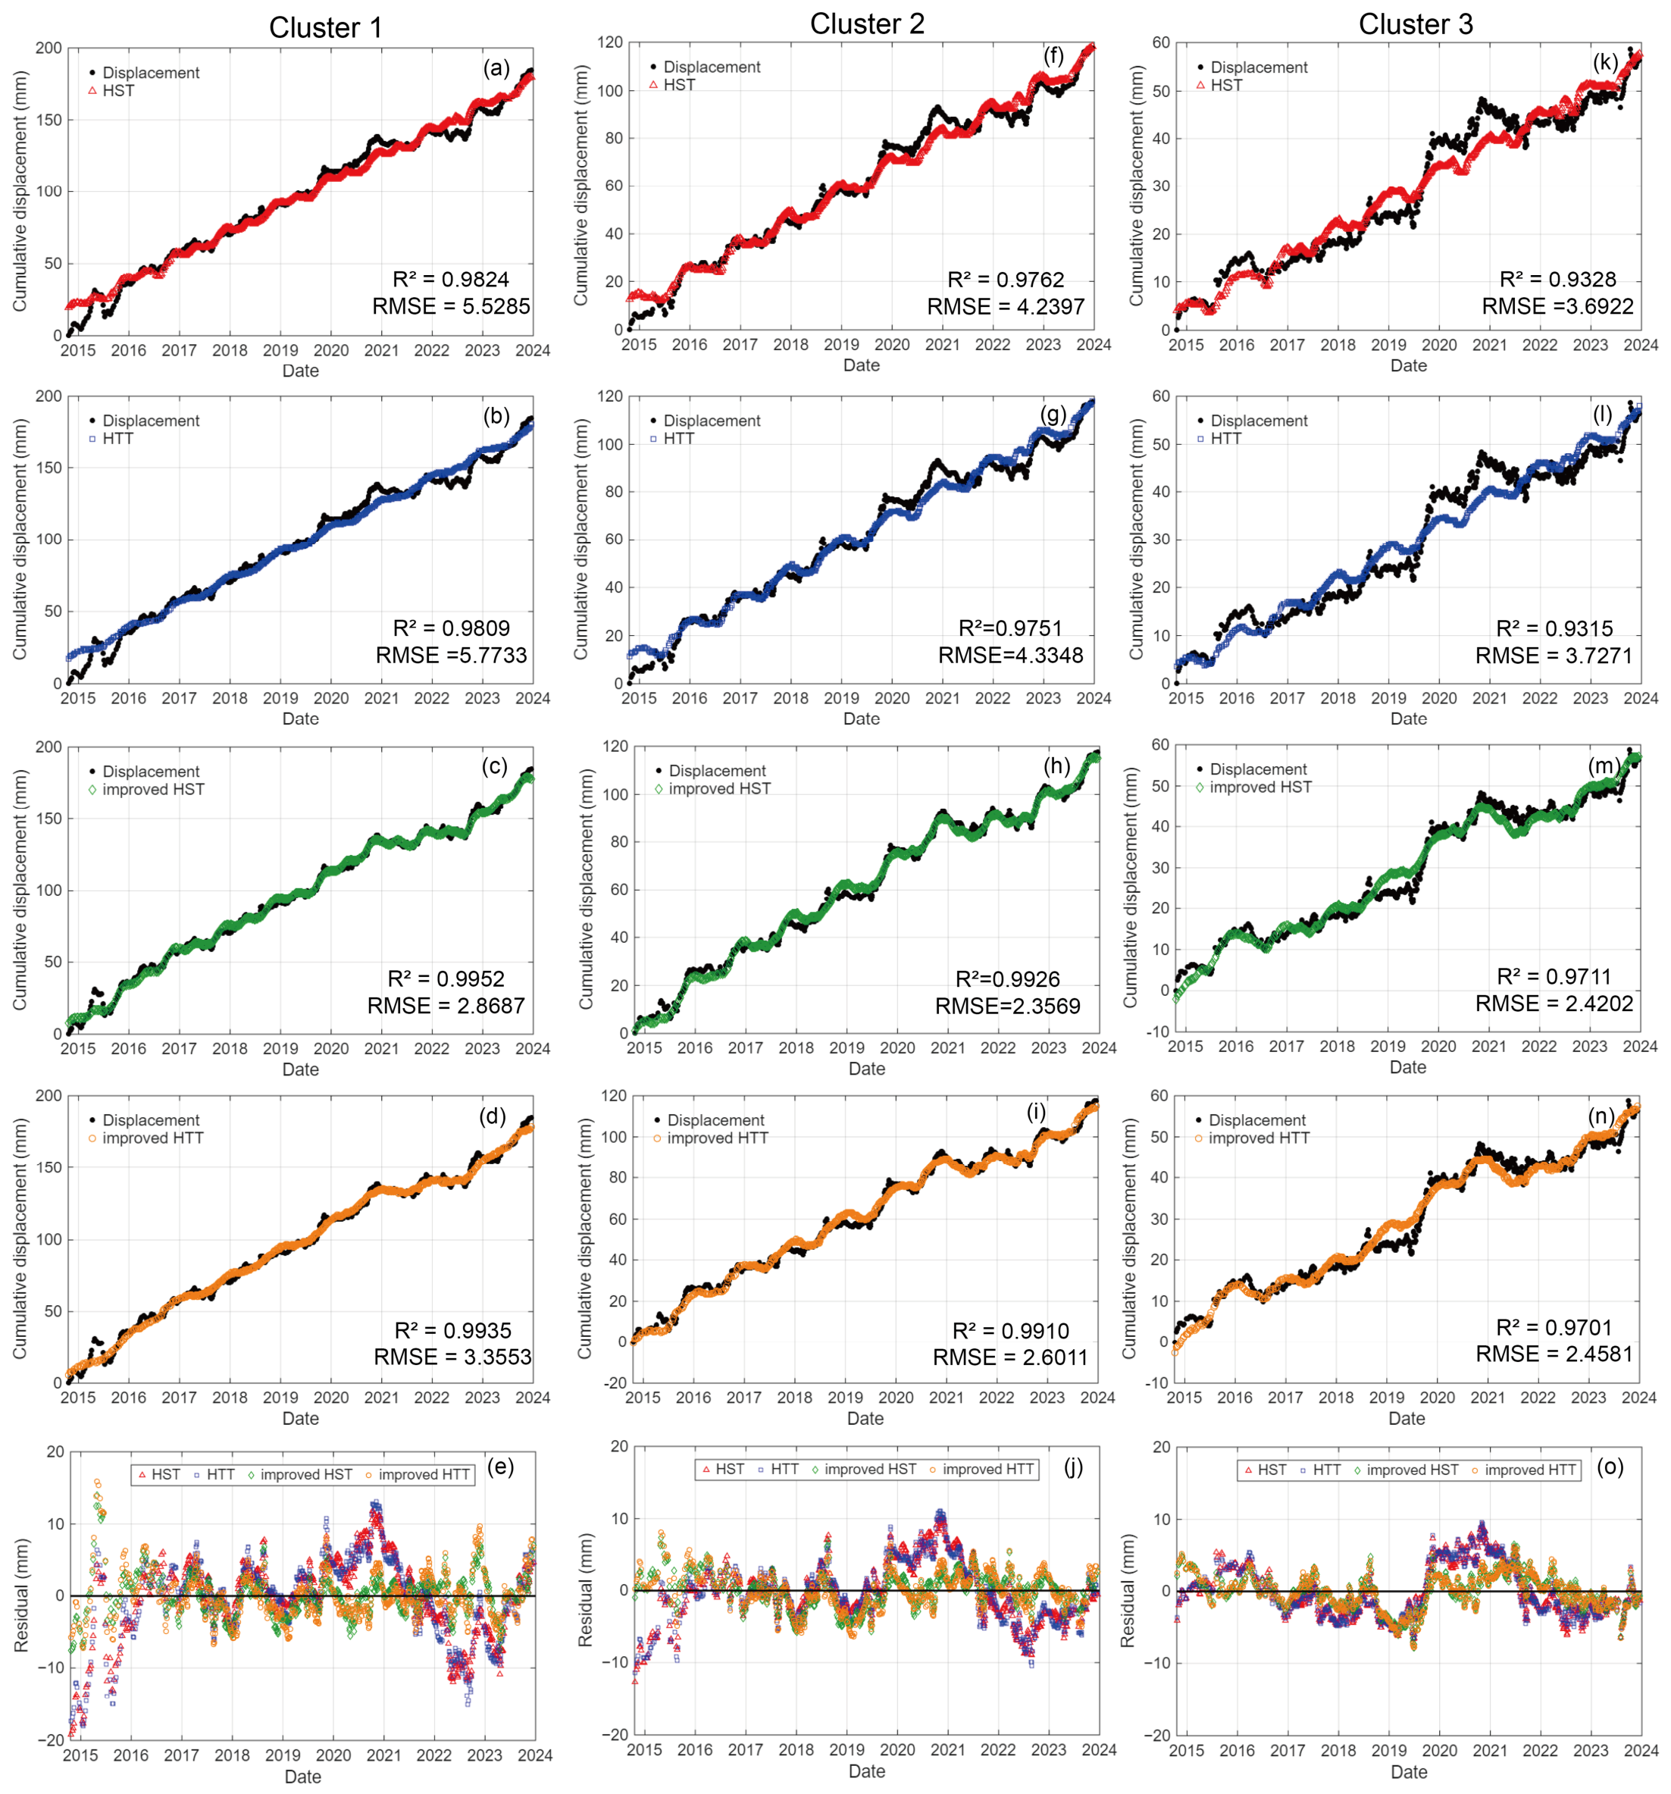
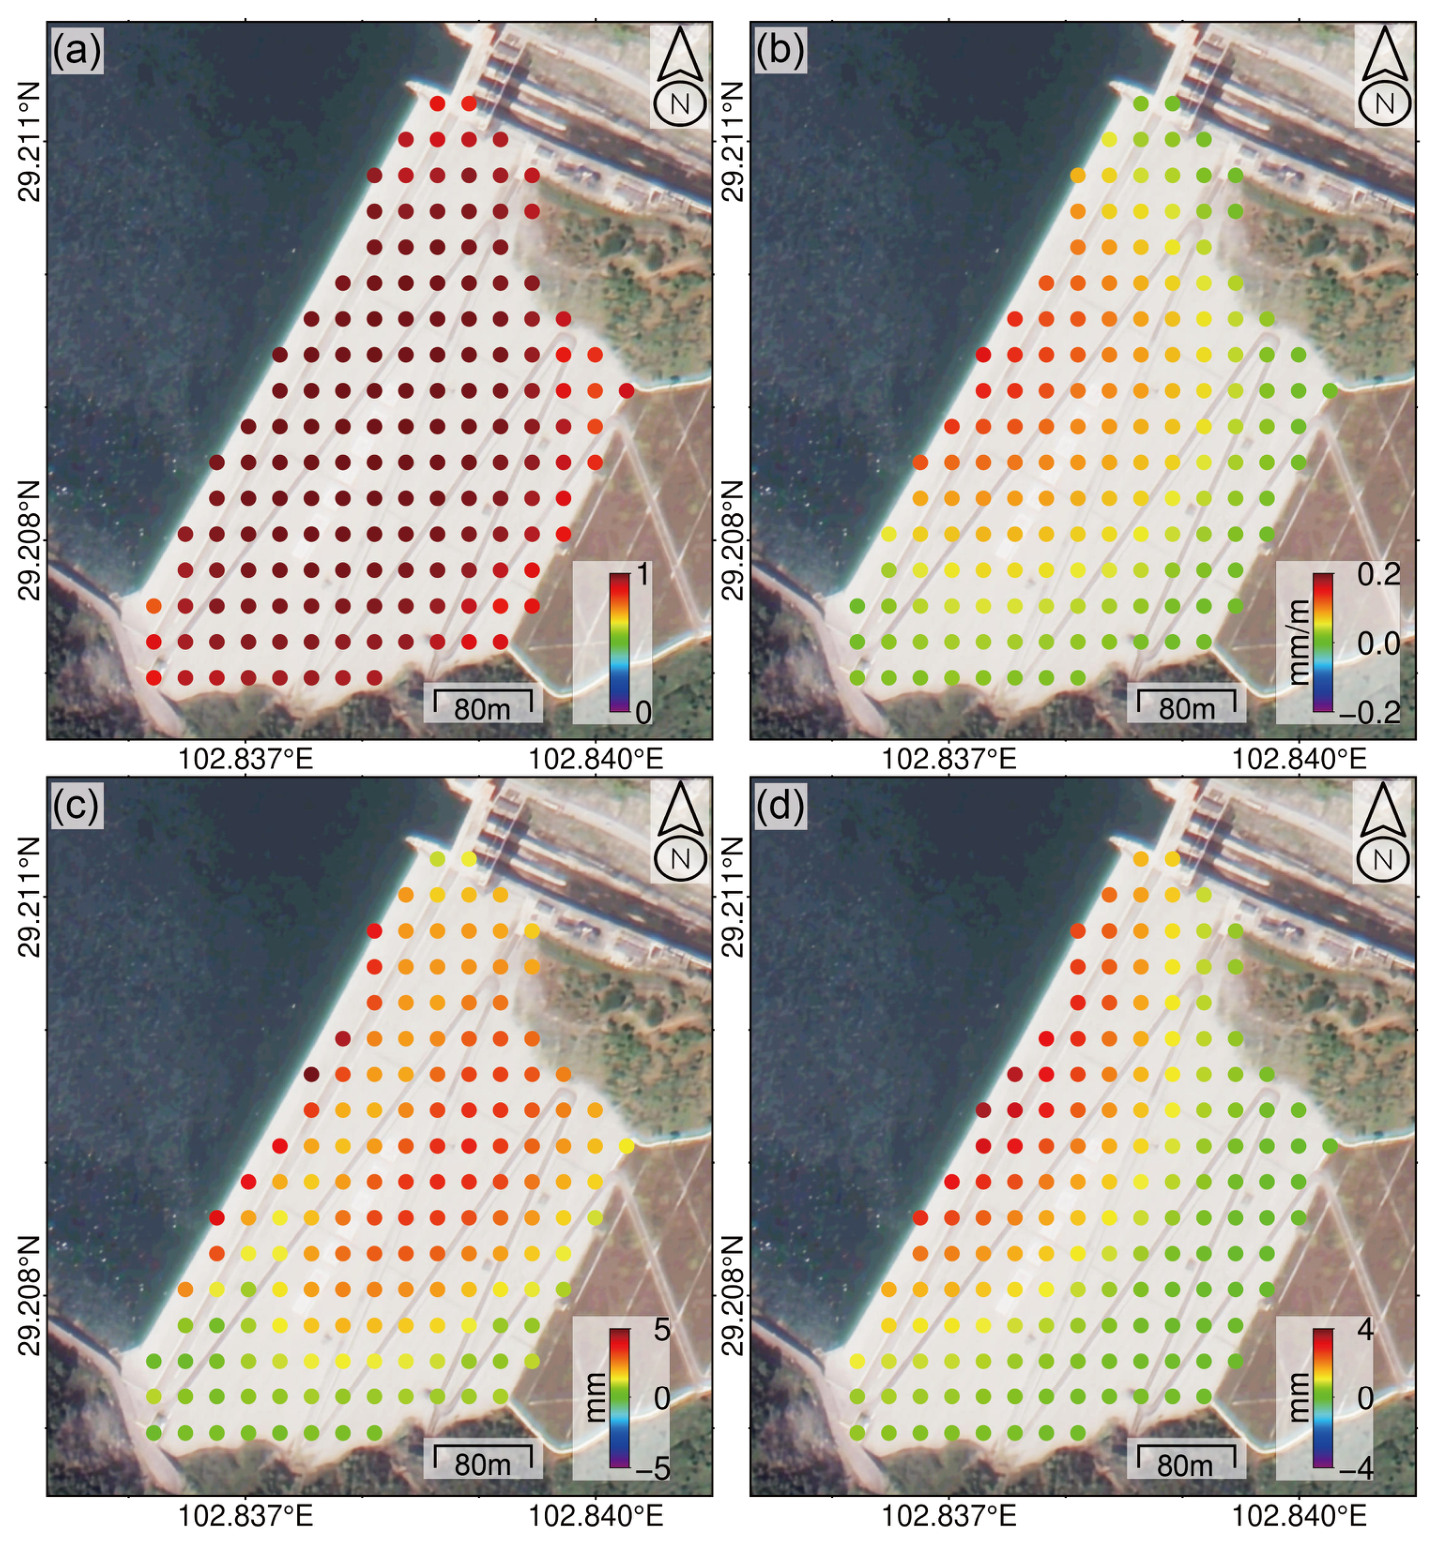
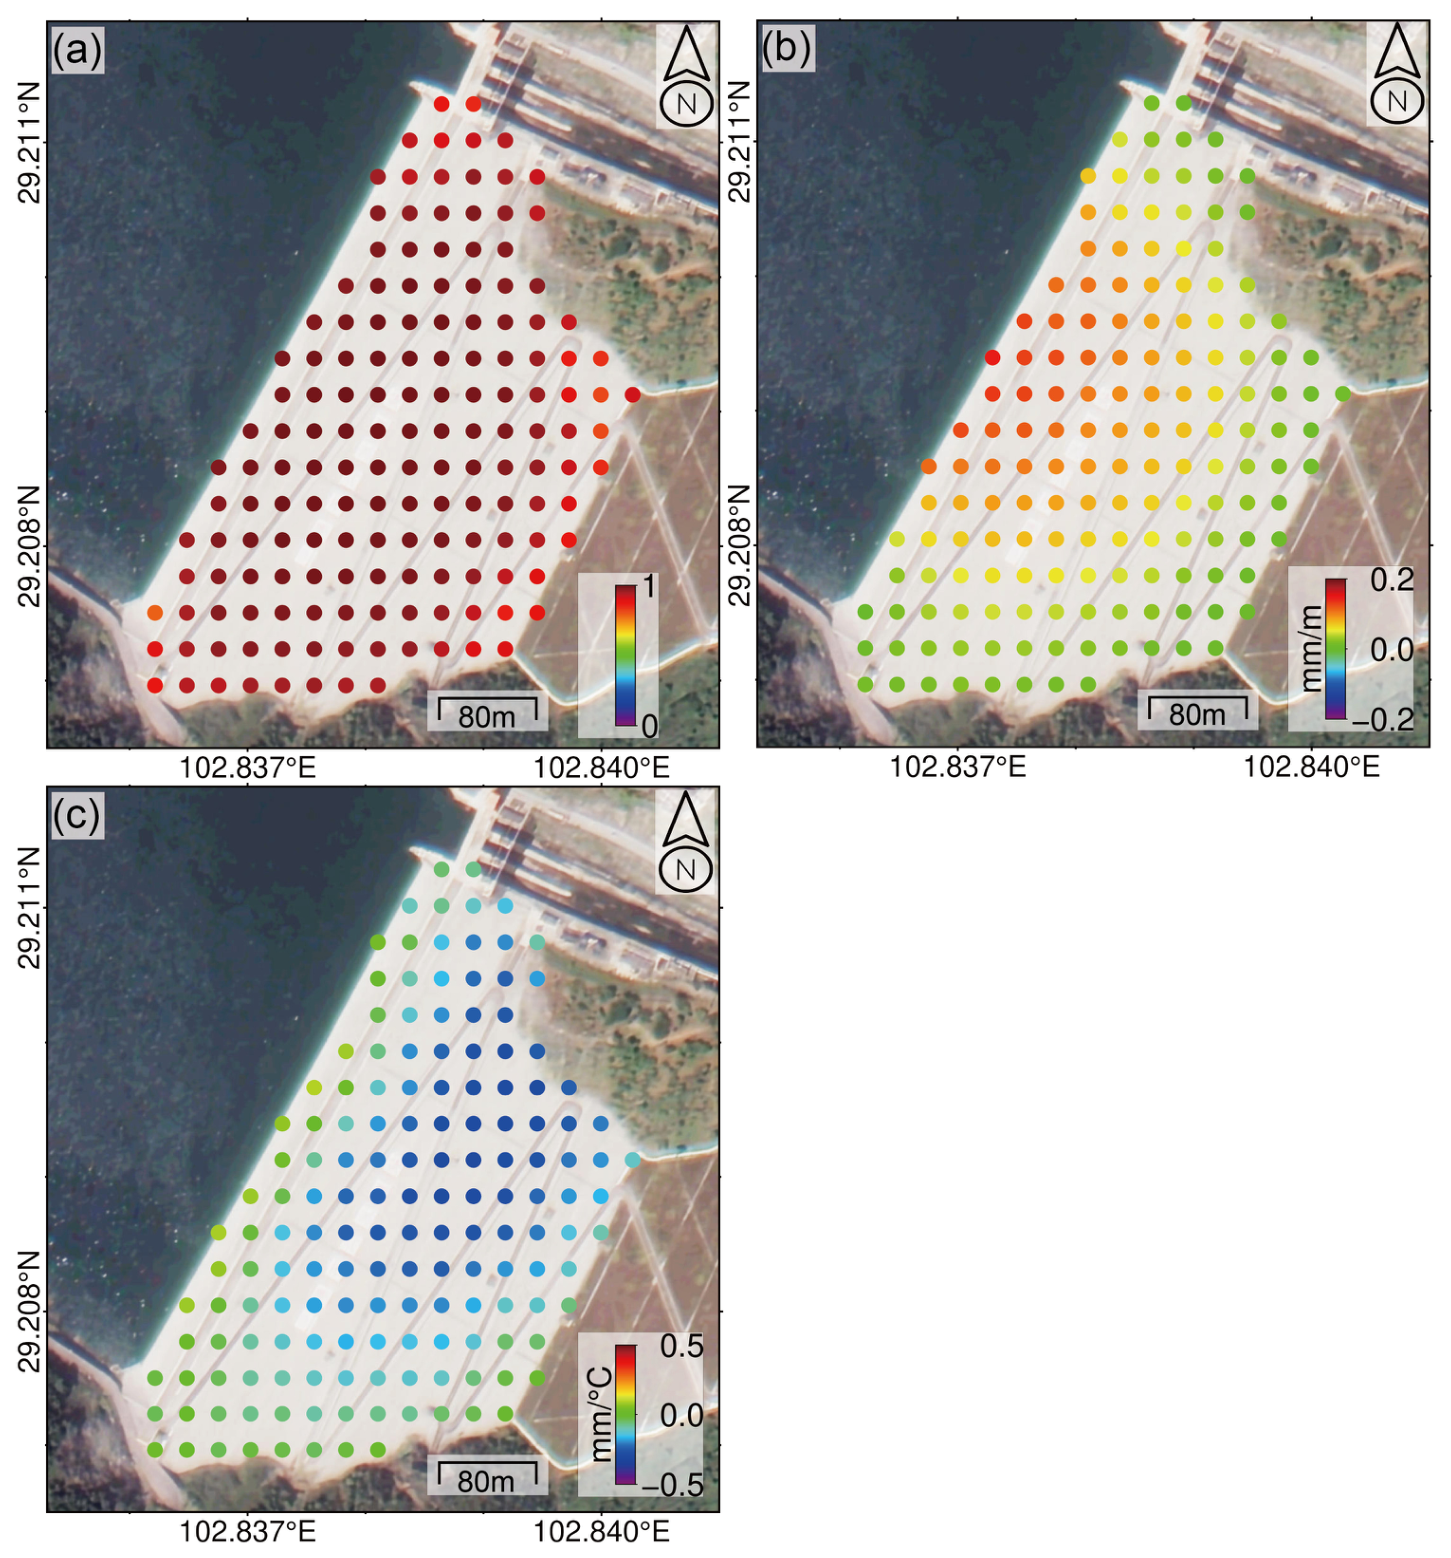
Figure 7 compares the fitting performance of the original and improved HST/HTT models for the three displacement clusters. All models reproduce the overall displacement evolution, but the improved models show closer agreement with the observed displacement series. The improvement is most evident for Clusters 1 and 2, where the larger cumulative displacement leads to clearer deviations from the conventional linear time term. For example, in Cluster 1, the R2 of the improved HST model increases from 0.982 to 0.995, while the RMSE decreases from 5.53 to 2.87 mm. The residuals of the improved models are more concentrated around zero, indicating that the predominant displacement component better represents nonlinear long-term displacement evolution. As D p r e t is derived from the observed displacement, these metrics reflect in-sample reconstruction rather than predictive performance. The spatial distributions of the fitted parameters are shown in Figure 8 and Figure 9, and the corresponding parameter ranges are summarized in Table 2. The spatial distribution of R2 (Figure 8a and Figure 9a) is generally consistent between the two improved models. Higher values are mainly distributed in the upper and central dam, whereas relatively lower values occur near the downstream toe and dam margins. Nevertheless, most points in the upper and central dam exhibit R2 values above 0.97, whereas lower values occur mainly near the downstream toe, indicating that both models maintain good fitting capability across different dam zones.
The water-level coefficient a (Figure 8b and Figure 9b) shows the most pronounced spatial variability among the fitted parameters. Larger values are concentrated in the upper and central dam, while smaller values occur near the downstream toe and abutments. According to Table 2, the values of a in the improved HST model decrease from 0.088–0.156 mm/m in the high-displacement zone to 0.009–0.049 mm/m in the relatively stable zone, with similar spatial variations observed in the improved HTT model. This distribution is consistent with the displacement zoning identified in Section 4.2.
The annual and semi-annual amplitudes of the improved HST model (Figure 8c,d) exhibit similar spatial patterns. Both amplitudes are larger in the upper dam and gradually decrease toward the downstream toe. The annual amplitude decreases from 1.3–4.9 mm in the high-displacement zone to 0.2–3.0 mm in the low-displacement zone, while the semi-annual amplitude shows a similar reduction from 1.6–3.6 mm to below 1.8 mm (Table 2).
The temperature coefficient b (Figure 9c) shows weaker spatial variability than the water-level coefficient a. Negative values dominate most monitoring points, whereas values close to zero are mainly distributed near the downstream toe and dam margins. In contrast, the nonlinear coefficient λ remains relatively stable throughout the dam (Table 2). Most values are close to 1, with slightly larger variations only observed in the lower and marginal zones.
The fitted parameters exhibit distinct spatial patterns that are consistent with the displacement zoning identified from the InSAR observations. These results reveal heterogeneous displacement responses among different dam sections and provide a basis for further analysis of their controlling mechanisms.

5. Discussion

5.1. Spatially Variable Displacement Patterns and Their Controlling Mechanisms

The three-dimensional displacement indicates that the Pubugou dam exhibits spatially variable displacement patterns, rather than a uniform deformation mode, during long-term operation. This variability is reflected in both displacement magnitude and the relative contributions of long-term accumulation and periodic responses. These spatially differentiated patterns suggest that the observed deformation is governed by zone-dependent combinations of internal structural adjustment and external hydraulic loading.
The three clusters identified from the displacement series features show distinct temporal behavior. Cluster 1, which is distributed in the upper dam region, has the largest cumulative displacement and is dominated by the predominant long-term component. This correspondence between spatial clustering and temporal decomposition indicates that the displacement evolution of Cluster 1 is primarily governed by progressive long-term adjustment rather than reversible periodic response. In high rockfill dams, such long-term displacement is commonly associated with particle rearrangement, void compression, particle breakage, and time-dependent creep under sustained stress conditions [37,38]. After filling and reservoir impoundment, the internal contact structure of rockfill materials gradually evolves toward a denser and more stable state through particle sliding, rotation, and local crushing, resulting in continuous volume reduction [39]. Therefore, the persistent displacement accumulation observed in Cluster 1 mainly reflects the continuing adjustment of the rockfill skeleton.
Cluster 2 is located primarily in the central dam region and is characterized by moderate cumulative displacement but the most pronounced periodic component among the three clusters. This pattern indicates that the central dam region is more sensitive to cyclic external loading, especially reservoir-level fluctuations. Reservoir-level changes periodically modify hydraulic loading, pore-water pressure, and effective stress conditions within the dam body [40]. During reservoir rise and drawdown cycles, repeated loading and unloading can generate recoverable displacement components superimposed on the long-term deformation trend. The stronger periodic response in Cluster 2 therefore suggests a closer coupling between reservoir-induced stress variations and displacement evolution.
Cluster 3 is concentrated near the lower dam and abutment regions and shows the smallest cumulative displacement and the weakest periodic response. This indicates that both progressive long-term adjustment and reversible external-loading responses are relatively limited in this zone. The downstream toe and abutment areas are mechanically constrained by the foundation and surrounding valley geometry, which can limit additional displacement accumulation. In addition, these zones may have undergone a longer period of stress adjustment, reducing the potential for further particle rearrangement and creep deformation [41]. As a result, Cluster 3 represents a relatively stable displacement regime compared with Clusters 1 and 2.
Previous studies provide external support for these results. Huang et al. reported LOS velocities of −34 to 10 mm/yr and a similar pattern of greater deformation in the central dam and relative stability at the margins [42]. Based on in situ monitoring, Zhou et al. found that settlement was greatest near the valley center and decreased towards the abutments; the modeled maximum crest settlement increased by 21.5 cm between February 2014 and May 2019, comparable in magnitude to the maximum cumulative vertical displacement of 17.8 cm measured from October 2014 to December 2023 in this study. Given differences in observation period, reference datum and spatial sampling, this comparison indicates broad consistency rather than pointwise validation [43].
These spatially differentiated displacement patterns indicate that the long-term behavior of high rockfill dams should be evaluated using zone-specific interpretations rather than a uniform displacement assumption. Although relatively large cumulative displacement is observed in the upper and central dam regions, the displacement time series shows gradual accumulation and regular temporal fluctuations without abrupt acceleration. This behavior suggests that the observed displacement primarily reflects continuous structural adjustment during long-term operation rather than abnormal deformation. The maximum annual periodic amplitude derived from the improved HST model was 4.921 mm, corresponding to approximately 0.003% of the dam height (186 m), indicating that the periodic component remained small relative to the dam scale [44]. Nevertheless, the upper dam region requires attention because of its larger cumulative displacement and continuing long-term adjustment, whereas the central dam region should be monitored for its stronger sensitivity to reservoir-induced periodic responses. These zones should therefore remain priority areas for long-term monitoring.

5.2. Implications of Improved HST/HTT Modeling

The improved HST and HTT models provide a way to link spatial displacement patterns with their controlling factors. Conventional HST/HTT formulations usually approximate the time-dependent component using a predefined linear term, which may be insufficient for high rockfill dams, where long-term displacement commonly evolves in a nonlinear and staged manner. By introducing the predominant displacement component derived from the observed displacement series, the improved models preserve the nonlinear long-term trajectory while still quantifying the effects of reservoir level, seasonal variation, and temperature. This formulation is therefore more consistent with the progressive adjustment behavior of rockfill materials than a single linear time trend.
The spatial distributions of model parameters further show that external forcing does not generate a uniform response across the dam body. The water-level coefficient exhibits the strongest spatial variability, with larger values concentrated in the upper and central dam regions and smaller values near the downstream toe and abutments. This pattern indicates that hydraulic loading is the dominant external factor controlling reversible displacement responses. Reservoir-level changes directly modify hydraulic pressure and effective stress conditions in the dam foundation system, producing more immediate mechanical effects than temperature variations. The spatial variation in the water-level coefficient therefore reflects differences in local state of stress, hydraulic transmission, and structural constraint.
Temperature-related responses are weaker and less spatially variable than reservoir-level responses. Air temperature variations propagate through the dam by heat conduction, causing attenuation and delay with depth because of thermal inertia [22]. Accordingly, coefficient b represents an effective response to atmospheric thermal forcing rather than a direct measure of the internal thermal state. This explains its weaker spatial variability relative to the hydrostatic coefficient.
By combining displacement clustering with improved statistical modeling, the analysis provides a spatially differentiated interpretation of dam behavior. Clustering first delineates dam zones with similar displacement histories, and the improved HST/HTT models then quantify how each zone responds to long-term evolution and external forcing. This combined framework avoids interpreting the dam as a single uniform system and instead links displacement magnitude, temporal behavior, and driving factors within spatially coherent patterns. Such a framework can support more targeted monitoring by identifying zones where cumulative adjustment or reservoir sensitivity is more pronounced.

5.3. Limitations and Future Work

Several limitations should be acknowledged. First, the three-dimensional reconstruction depends on the multi-track observation geometry and the validity of the SPF constraint, introducing uncertainty where the assumed displacement direction is violated [45,46]. Published comparisons provide only indirect support because collocated and contemporaneous ground observations were unavailable. Future work should validate the reconstructed displacement using leveling, GNSS or internal monitoring data.
Second, as D p r e t is derived from the observed displacement, the improved fit does not provide independent validation. The models are data-driven and do not represent material properties or coupled seepage–deformation processes. Future work should assess their robustness using independent observations and coupled hydro-mechanical or thermo-hydro-mechanical modeling.
Third, using air temperature as a proxy does not resolve internal temperature gradients or spatially variable thermal lag [47]. Future work should incorporate internal temperature observations or coupled heat transfer modeling. Sudden displacement responses associated with extreme events, such as earthquakes, rapid reservoir drawdown, or unusual flood operations, may also require additional dynamic information. Further applications to different dam types, structural configurations, and geological settings are needed to assess the generality of the proposed framework.

6. Conclusions

In this study, we characterized the long-term three-dimensional displacement of the Pubugou ultra-high rockfill dam from 2014 to 2023 using multi-track Sentinel-1 InSAR observations. We found that the spatial distribution of dam displacement is highly heterogeneous, with larger displacement concentrated in the upper and central dam regions, with relatively limited displacement near the lower dam. The maximum vertical and eastward displacement rates reached 17.70 and 19.41 mm/yr, respectively, and the maximum cumulative vertical displacement reached approximately 178 mm during the observation period. Spatial clustering analysis identified three displacement patterns across the dam. Cluster 1, mainly located in the upper dam region, is characterized by the largest cumulative displacement and a dominant long-term component, suggesting continuing adjustment of the rockfill skeleton. Cluster 2, located in the central dam region, exhibits stronger periodic responses, indicating greater sensitivity to reservoir-level fluctuations. Cluster 3, distributed near the lower dam and abutment regions, shows relatively limited long-term and periodic displacement, reflecting stronger structural constraints and a more stable deformation state. The improved HST and HTT models provided a closer reconstruction of nonlinear long-term displacement than conventional formulations. The spatial distribution of model parameters indicates that reservoir-level variations exert a stronger influence on dam displacement than temperature variations. This suggests that the observed displacement is jointly controlled by progressive internal adjustment and external hydraulic loading, while temperature-related effects are comparatively weaker during the observation period. Our results demonstrate that multi-track InSAR, spatial clustering, and statistical behavior modeling can provide useful insights into the spatially variable displacement behavior of high rockfill dams. The identified zones with larger cumulative displacement and stronger reservoir sensitivity should remain priority areas for long-term monitoring. With the continued accumulation of SAR images and dam monitoring data, the proposed framework can be further improved to track long-term dam deformation, quantify its response to external forcing, and support safety assessment of ultra-high rockfill dams.

Author Contributions

Conceptualization, X.S.; methodology, P.B. and X.S.; validation, P.B., W.H. and Y.C.; formal analysis, P.B.; investigation, P.B.; resources, X.S.; data curation, P.B.; writing—original draft preparation, P.B.; writing—review and editing, W.H. and Y.C.; visualization, P.B.; supervision, X.S.; project administration, X.S.; funding acquisition, X.S. All authors have read and agreed to the published version of the manuscript.

Funding

This research was funded by the National Natural Science Foundation of China, grant number 42474061.

Data Availability Statement

The Sentinel-1 SAR datasets, ALOS World 3D DSM data, reservoir water-level records, and meteorological temperature data used and analyzed in this study are publicly available from their respective official open-access platforms as described in the manuscript. Further processed data that support the findings of this study are available from the corresponding author upon reasonable request.

Conflicts of Interest

The authors declare no conflicts of interest.

Appendix A

Table A1. Quantitative evaluation of cluster numbers from K = 2 to K = 5.
KSSESSE Reduction (%)Silhouette ScoreGap StatisticGap SE
2381.009-0.5531.7120.024
3234.64138.420.4692.0890.029
4177.40124.390.4062.2960.031
5134.93523.940.4342.5120.026
Note: SSE reduction is calculated relative to the preceding value of K. Gap SE denotes the standard error of the gap statistic.
Figure A1. Evaluation of cluster number sensitivity. (a) SSE, silhouette score and gap statistic for different values of K; spatial partitions obtained with (b) K = 2, (c) K = 3 and (d) K = 4.
Remotesensing 18 02853 g0a1

References

  1. Zhang, F.; Yang, Q.; Wang, J.; Liu, H.; Zeng, Q.; Yan, L.; Zhao, B.; Tang, J.; Zhao, K.; Zang, Y.; et al. Hydropower system in the Yarlung-Tsangpo Grand Canyon can mitigate flood disasters caused by climate change. Commun. Earth Environ. 2025, 6, 323. [Google Scholar] [CrossRef] [Scilit]
  2. Li, W.; Li, Z.; Ge, W.; Wu, S. Risk evaluation model of life loss caused by dam-break flood and its application. Water 2019, 11, 1359. [Google Scholar] [CrossRef] [Scilit]
  3. Wen, L.; Chai, J.; Xu, Z.; Qin, Y.; Li, Y. Monitoring and numerical analysis of behaviour of Miaojiaba concrete-face rockfill dam built on river gravel foundation in China. Comput. Geotech. 2017, 85, 230–248. [Google Scholar] [CrossRef] [Scilit]
  4. Wen, L.; Chai, J.; Xu, Z.; Qin, Y.; Li, Y. A statistical review of the behaviour of concrete-face rockfill dams based on case histories. Géotechnique 2018, 68, 749–771. [Google Scholar] [CrossRef] [Scilit]
  5. Jiang, T.; Wang, X.-L. Comparative study on slope stability analysis methods of earth-rock DAMS. In Proceedings of the 8th International Conference on Informatics, Environment, Energy and Applications, Osaka, Japan, 16–19 March 2019; pp. 159–164. [Google Scholar] [CrossRef] [Scilit]
  6. Pramthawee, P.; Jongpradist, P.; Sukkarak, R. Integration of creep into a modified hardening soil model for time-dependent analysis of a high rockfill dam. Comput. Geotech. 2017, 91, 104–116. [Google Scholar] [CrossRef] [Scilit]
  7. Salari, M.; Akhtarpour, A.; Khosravi, S. Long-term deformation mechanism of Masjed-e-Soleyman high rockfill dam. Sci. Iran. 2024, in press. [Google Scholar] [CrossRef] [Scilit]
  8. Celik, F.; Sanli, F.B.; Celik, K.; Celik, A. Kurtun Dam oscillate characterization with landslide possible effect detection using InSAR observations. Nat. Hazards 2025, 121, 16747–16763. [Google Scholar] [CrossRef] [Scilit]
  9. Ziemer, J.; Stein, G.; Wicker, C.; Jänichen, J.; Klöpper, D.; Last, K.; Denzler, J.; Schmullius, C.; Shadaydeh, M.; Dubois, C. Enhancing the prediction of dam deformations: A novel data-driven approach. Remote Sens. 2025, 17, 1026. [Google Scholar] [CrossRef] [Scilit]
  10. Zhou, W.; Li, S.; Zhou, Z.; Chang, X. InSAR Observation and Numerical Modeling of the Earth-Dam Displacement of Shuibuya Dam (China). Remote Sens. 2016, 8, 877. [Google Scholar] [CrossRef] [Scilit]
  11. Liu, Y.; Fan, H.; Wang, L.; Zhuang, H. Monitoring of surface deformation in a low coherence area using distributed scatterers InSAR: Case study in the Xiaolangdi Basin of the Yellow River, China. Bull. Eng. Geol. Environ. 2021, 80, 25–39. [Google Scholar] [CrossRef] [Scilit]
  12. Hu, J.; Li, Z.W.; Ding, X.L.; Zhu, J.J.; Zhang, L.; Sun, Q. Resolving three-dimensional surface displacements from InSAR measurements: A review. Earth-Sci. Rev. 2014, 133, 1–17. [Google Scholar] [CrossRef] [Scilit]
  13. Scaioni, M.; Marsella, M.; Crosetto, M.; Tornatore, V.; Wang, J. Geodetic and Remote-Sensing Sensors for Dam Deformation Monitoring. Sensors 2018, 18, 3682. [Google Scholar] [CrossRef] [Scilit] [PubMed]
  14. Chen, Q.; Zhang, H.; Xu, B.; Liu, Z.; Mao, W. Accessing the Time-Series Two-Dimensional Displacements around a Reservoir Using Multi-Orbit SAR Datasets: A Case Study of Xiluodu Hydropower Station. Remote Sens. 2023, 15, 168. [Google Scholar] [CrossRef] [Scilit]
  15. Bayik, C.; Abdikan, S.; Arıkan, M. Long term displacement observation of the Atatürk Dam, Turkey by multi-temporal InSAR analysis. Acta Astronaut. 2021, 189, 483–491. [Google Scholar] [CrossRef] [Scilit]
  16. Xiao, R.; Jiang, M.; Li, Z.; He, X. New insights into the 2020 Sardoba dam failure in Uzbekistan from Earth observation. Int. J. Appl. Earth Obs. Geoinf. 2022, 107, 102705. [Google Scholar] [CrossRef] [Scilit]
  17. Zhou, W.; Li, S.; Zhou, Z.; Chang, X. Remote Sensing of Deformation of a High Concrete-Faced Rockfill Dam Using InSAR: A Study of the Shuibuya Dam, China. Remote Sens. 2016, 8, 255. [Google Scholar] [CrossRef] [Scilit]
  18. Hill, P.; Biggs, J.; Ponce-López, V.; Bull, D. Time-Series Prediction Approaches to Forecasting Deformation in Sentinel-1 InSAR Data. J. Geophys. Res. Solid Earth 2021, 126, e2020JB020176. [Google Scholar] [CrossRef] [Scilit]
  19. Tiwari, A.; Shirzaei, M. A novel machine learning and deep learning semi-supervised approach for automatic detection of InSAR-based deformation hotspots. Int. J. Appl. Earth Obs. Geoinf. 2024, 126, 103611. [Google Scholar] [CrossRef] [Scilit]
  20. Tian, J.; Luo, Y.; Lu, X.; Li, Y.; Chen, J. Physical data-driven modeling of deformation mechanism constraints on earth-rock dams based on deep feature knowledge distillation and finite element method. Eng. Struct. 2024, 307, 117899. [Google Scholar] [CrossRef] [Scilit]
  21. Salazar, F.; Morán, R.; Toledo, M.Á.; Oñate, E. Data-Based Models for the Prediction of Dam Behaviour: A Review and Some Methodological Considerations. Arch. Comput. Methods Eng. 2017, 24, 1–21. [Google Scholar] [CrossRef] [Scilit]
  22. Belmokre, A.; Santillan, D.; Mihoubi, M.K. Improved Hydrostatic-Season-Time Model for Dam Monitoring: Inclusion of a Thermal Analytical Solution. In Proceedings of the 1st International Conference on Structural Damage Modelling and Assessment; Abdel Wahab, M., Ed.; Lecture Notes in Civil Engineering; Springer: Singapore, 2021; Volume 110, pp. 67–78. [Google Scholar] [CrossRef] [Scilit]
  23. Peng, M.; Liang, Y.; Xing, H.; Yang, G.; Zhu, Y.; Zhang, L.; Li, B.; Cai, S.; Bi, J. Stochastic seepage stability analysis of the Pubugou clay core rockfill dam with potentially high permeability zone by integrating multi-source monitoring information. Georisk Assess. Manag. Risk Eng. Syst. Geohazards 2025, 19, 427–447. [Google Scholar] [CrossRef] [Scilit]
  24. Zhang, S.; Zhang, L.M.; Chen, H.X. Relationships among three repeated large-scale debris flows at Pubugou Ravine in the Wenchuan earthquake zone. Can. Geotech. J. 2014, 51, 951–965. [Google Scholar] [CrossRef] [Scilit]
  25. Mei, X.; Wang, N.; Ma, G.; Wang, J.; Wang, Y.; Wu, J.; Han, M.; Cai, B. Deformation Process and Mechanism Analyses of a Rock Slope Based on Long-Term Monitoring at the Pubugou Hydropower Station, China. Geofluids 2021, 2021, 6615424. [Google Scholar] [CrossRef] [Scilit]
  26. Liang, H.; Zhang, H.; Guo, J.; Xiang, X.; Zhang, L. Safety monitoring and effect analysis of fracturing body on the right bank of Pubugou reservoir head in China based on space-ground-body monitoring mode. Landslides 2024, 21, 1221–1241. [Google Scholar] [CrossRef] [Scilit]
  27. Yang, S.; Chen, J.; Liang, R.; Wang, Y.; Li, K. Interpretable machine learning model for reservoir outflow water temperature prediction. Renew. Energy 2026, 256, 124080. [Google Scholar] [CrossRef] [Scilit]
  28. Pepe, A.; Calò, F. A Review of Interferometric Synthetic Aperture RADAR (InSAR) Multi-Track Approaches for the Retrieval of Earth’s Surface Displacements. Appl. Sci. 2017, 7, 1264. [Google Scholar] [CrossRef] [Scilit]
  29. Wang, Y.; Gong, Y.; Liu, X.; Jing, Y.; She, X.; Fan, M.; Zhao, G.; Xu, N.; Ma, Y.; Zhao, Y.; et al. Enhanced Satellite Monitoring of Reservoir Water Storage Variations in the Yangtze River Basin from 1990 to 2023. J. Remote Sens. 2025, 5, 0384. [Google Scholar] [CrossRef] [Scilit]
  30. Yagüe-Martínez, N.; Prats-Iraola, P.; González, F.R.; Brcic, R.; Shau, R.; Geudtner, D.; Eineder, M.; Bamler, R. Interferometric Processing of Sentinel-1 TOPS Data. IEEE Trans. Geosci. Remote Sens. 2016, 54, 2220–2234. [Google Scholar] [CrossRef] [Scilit]
  31. Yu, C.; Li, Z.; Penna, N.T.; Crippa, P. Generic atmospheric correction model for interferometric synthetic aperture radar observations. J. Geophys. Res. Solid Earth 2018, 123, 9202–9222. [Google Scholar] [CrossRef] [Scilit]
  32. Hu, X.; Lu, Z.; Pierson, T.C.; Kramer, R.; George, D.L. Combining InSAR and GPS to determine transient movement and thickness of a seasonally active low-gradient translational landslide. Geophys. Res. Lett. 2018, 45, 1453–1462. [Google Scholar] [CrossRef] [Scilit]
  33. Samsonov, S.; d’Oreye, N. Multidimensional time-series analysis of ground deformation from multiple InSAR data sets applied to Virunga Volcanic Province. Geophys. J. Int. 2012, 191, 1095–1108. [Google Scholar] [CrossRef] [Scilit]
  34. Ibrahim, K.S.M.H.; Huang, Y.F.; Ahmed, A.N.; Koo, C.H.; El-Shafie, A. A review of the hybrid artificial intelligence and optimization modelling of hydrological streamflow forecasting. Alex. Eng. J. 2022, 61, 279–303. [Google Scholar] [CrossRef] [Scilit]
  35. Sigtryggsdóttir, F.G.; Snæbjörnsson, J.T.; Grande, L. Statistical Model for Dam-Settlement Prediction and Structural-Health Assessment. J. Geotech. Geoenviron. Eng. 2018, 144, 04018059. [Google Scholar] [CrossRef] [Scilit]
  36. Jiang, M.; Zhao, X.; Shi, X. Kinematic Behavior Analysis of the Wadi Landslide From Time-Series Sentinel-1 Data. IEEE J. Sel. Top. Appl. Earth Obs. Remote Sens. 2022, 15, 127–135. [Google Scholar] [CrossRef] [Scilit]
  37. Oldecop, L.A.; Alonso, E.E. A model for rockfill compressibility. Géotechnique 2001, 51, 127–139. [Google Scholar] [CrossRef]
  38. Yang, Q.; Wang, Y.; Zuo, Y. Long-term deformation characteristics of high concrete-faced rockfill dams under cyclic loading of water. Chin. J. Geotech. Eng. 2024, 46, 1339–1346. [Google Scholar] [CrossRef]
  39. Zou, D.-G.; Liu, J.-M.; Kong, X.-J.; Zhou, C.-G.; Yang, Q.-P. A simple permanent deformation model of rockfill materials. Water Sci. Eng. 2018, 11, 302–309. [Google Scholar] [CrossRef] [Scilit]
  40. Zhou, X.; Chi, S.; Jia, Y. Wetting Deformation of Core-Wall Rockfill Dams. Int. J. Geomech. 2019, 19, 04019084. [Google Scholar] [CrossRef] [Scilit]
  41. Oldecop, L.A.; Alonso, E. Theoretical investigation of the time-dependent behaviour of rockfill. Géotechnique 2007, 57, 289–301. [Google Scholar] [CrossRef] [Scilit]
  42. Huang, H.; Jiang, D.; Liu, H.; Luo, Z. Deformation monitoring for Pubugou Hydropower Station of Dadu River based on multi-temporal InSAR technology. Sci. Technol. Eng. 2023, 23, 13112–13120. [Google Scholar] [CrossRef]
  43. Zhou, X.; He, Q.; Cai, W.; Zhou, J. Full-plane deformation modeling and crack analysis of HCRD. Hydro-Sci. Eng. 2026, 1, 157–169. [Google Scholar] [CrossRef]
  44. Ministry of Water Resources of the People’s Republic of China. Design Code for Rolled Earth-Rock Fill Dams: SL 274-2020; China Water & Power Press: Beijing, China, 2020. [Google Scholar]
  45. Notti, D.; Herrera, G.; Bianchini, S.; Meisina, C.; García-Davalillo, J.C.; Zucca, F. A methodology for improving landslide PSI data analysis. Int. J. Remote Sens. 2014, 35, 2186–2214. [Google Scholar] [CrossRef] [Scilit]
  46. Hilley, G.E.; Bürgmann, R.; Ferretti, A.; Novali, F.; Rocca, F. Dynamics of slow-moving landslides from permanent scatterer analysis. Science 2004, 304, 1952–1955. [Google Scholar] [CrossRef] [Scilit] [PubMed]
  47. Mata, J. Interpretation of concrete dam behaviour with artificial neural network and multiple linear regression models. Eng. Struct. 2011, 33, 903–910. [Google Scholar] [CrossRef] [Scilit]
Figure 1. (a) Geographic location of the Pubugou Dam and spatial coverage of the Sentinel-1 SAR datasets. (b) Optical image of the Pubugou Dam, with the inset showing a photograph of the dam. (c) Structure of the Pubugou Dam.
Remotesensing 18 02853 g001
Figure 2. Temporal and perpendicular baseline connection graphs for tracks 26, 62, and 128 used for interferogram generation.
Remotesensing 18 02853 g002
Figure 3. LOS displacement rates from (a) ascending Track 26, (b) descending Track 62 and (c) ascending Track 128. Insets show the LOS velocity precision distributions.
Remotesensing 18 02853 g003
Figure 4. Three-dimensional displacement rate maps of the Pubugou Dam: (a) eastward, (b) northward, (c) vertical, and (d) combined horizontal and vertical displacement rates. Insets in (ac) show the corresponding uncertainty distributions.
Remotesensing 18 02853 g004
Figure 5. K-means clustering of the three-dimensional displacement series: (a) spatial distribution and (bd) displacement series of Clusters 1–3.
Remotesensing 18 02853 g005
Figure 6. Predominant and periodic displacement components of the three displacement clusters: (a) Cluster 1, (b) Cluster 2, and (c) Cluster 3.
Remotesensing 18 02853 g006
Figure 7. Fits of the conventional and improved HST/HTT models for the three displacement clusters. Panels (ae), (fj), and (ko) correspond to Clusters 1, 2, and 3, respectively, with HST, HTT, improved HST, improved HTT, and residuals shown from top to bottom.
Remotesensing 18 02853 g007
Figure 8. Spatial distributions of the fitted parameters for the improved HST: (a) coefficient of determination (R2), (b) water-level coefficient a, (c) annual amplitude, and (d) semi-annual amplitude.
Remotesensing 18 02853 g008
Figure 9. Spatial distributions of the fitted parameters for the improved HTT: (a) coefficient of determination (R2), (b) water-level coefficient a, and (c) temperature coefficient b.
Remotesensing 18 02853 g009
Table 1. Basic information of Sentinel-1 SAR datasets.
SensorSentinel-1
Track number2662128
Orbit directionAscendingDescendingAscending
Heading angle (°)347.3192.7347.3
Look angle (°)45.642.034.1
Temporal coverage19 October 2014–19 December 20239 October 2014–21 December 202314 October 2014–26 December 2023
Number of scenes230271236
Table 2. Parameter ranges of the improved HST and HTT models for the three displacement clusters.
ParameterImproved HST ModelParameterImproved HTT Model
Cluster 1Cluster 2Cluster 3Cluster 1Cluster 2Cluster 3
a (mm/m)0.088~0.1560.045~0.0920.009~0.049a (mm/m)0.083~0.1470.041~0.0910.004~0.049
Annual periodic amplitude (mm) 1.332~4.9210.414~3.7340.210~3.031b (mm/°C)−0.249~0.094−0.289~0.080−0.286~0.027
Semi-annual periodic amplitude (mm)1.639~3.5790.392~2.5050.060~1.758
λ 0.771~1.2550.755~1.3140.589~1.551 λ 0.770~1.2510.775~1.3180.591~1.553
d (mm)9.898~10.4099.665~10.3829.587~10.218d (mm)14.790~16.54813.903~16.53413.763~16.194
R20.983~0.9960.930~0.9940.793~0.981R20.973~0.9940.925~0.9910.787~0.979
Disclaimer/Publisher’s Note: The statements, opinions and data contained in all publications are solely those of the individual author(s) and contributor(s) and not of MDPI and/or the editor(s). MDPI and/or the editor(s) disclaim responsibility for any injury to people or property resulting from any ideas, methods, instructions or products referred to in the content.