Article

Cross-Scale Performance Evaluation of GPM IMERG V07 Precipitation Products in a Typical Mountainous Monsoon Region

1
Agriculture Science and Technology Information Research Institute, Guangxi Academy of Agricultural Sciences, Nanning 530007, China
2
Nanning Station of Guangxi (Farmland Type), Ecological Quality Comprehensive Monitoring Station of Ministry of Ecology and Environment, Nanning 530007, China
3
Guangxi Institute of Meteorological Science, Nanning 530022, China
*
Author to whom correspondence should be addressed.
Remote Sens. 2026, 18(17), 2867; https://doi.org/10.3390/rs18172867
Submission received: 2 March 2026 / Revised: 13 July 2026 / Accepted: 18 August 2026 / Published: 24 August 2026

Highlights

What are the main findings?
  • IMERG V07 improves daily precipitation detection capabilities compared to V06, but its amplified systematic positive biases accumulate, causing performance degradation at the monthly scale, especially for the Final Run.
  • V07’s retrieval accuracy is strongly constrained by surface and seasonal factors, with significant overestimation occurring in zones where relatively dry conditions (mean annual precipitation < 1300 mm) and complex terrain (100–500 m elevation) co-occur, as well as during the wet season.
What are the implications of the main findings?
  • The V07 Late run is suitable for short-term daily hydrological applications, but long-term cumulative uses (e.g., drought or agricultural monitoring) require rigorous, physical-based bias correction.
  • Future satellite precipitation algorithms should adopt dynamic climatological calibration and volume conservation constraints to suppress systematic overestimation and prevent its cross-scale error propagation.

Abstract

Satellite precipitation products like GPM IMERG are crucial for hydrological modeling and disaster prevention; yet, their reliability in complex mountainous monsoon regions remains challenging. While the latest IMERG V07 introduces key upgrades, including a Climatological Calibration Algorithm (CCA), its cross-scale error propagation mechanisms and performance heterogeneity in complex underlying surfaces are poorly understood. This study evaluates the daily and monthly performance of IMERG V07 and V06 (Early, Late, and Final Runs) from 2014 to 2020 against 91 rain gauges in Guangxi, China—a typical mountainous monsoon region. The evaluation employs multiple statistical metrics and a multi-dimensional stratification approach based on elevation, precipitation intensity, and seasonality to quantify error propagation and climate-topography coupling effects. The results reveal that V07, particularly the Late Run, enhances daily precipitation detection capabilities, it significantly increases the proportion of systematic positive bias from 62.3 to 64.8% (V06) to 67.2–68.9% (V07). Consequently, upon temporal aggregation to the monthly scale, this systematic overestimation is severely amplified, leading to degraded performance, with the Final Run suffering the most substantial accuracy loss. Furthermore, retrieval accuracy is heavily constrained by surface heterogeneity, with systematic overestimation surging in areas where relatively dry (mean annual precipitation < 1300 mm) and complex terrain (elevation 100–500 m) coincide. The introduced CCA effectively improved dry season estimations but failed during wet season by introducing substantial positive biases. Ultimately, while V07 better captures short-term precipitation dynamics, its structural systematic biases compromise long-term cumulative reliability, highlighting the necessity for physics-based bias correction in hydrological applications and dynamic calibration in future algorithm upgrades.

1. Introduction

Satellite Precipitation Products (SPPs) have become a crucial data source for hydrological modeling and disaster prevention due to their extensive coverage and continuous observation capabilities [1,2,3]. Nevertheless, terrain complexity and monsoon interference substantially limit the reliability of SPPs, making it a pivotal challenge to resolve this inherent deficiency in satellite precipitation algorithm optimization [4,5,6]. Accordingly, it is essential to assess the precision of SPPs and quantify their error propagation mechanisms to enhance the accuracy of complex hydrological simulation and disaster early warning.
The Integrated Multi-satellite Retrievals for GPM (IMERG), a flagship product of the Global Precipitation Measurement (GPM) plan [7,8], is widely recognized for its high spatiotemporal resolution and reliable performance [9,10,11,12,13,14]. Since its deployment in 2014, IMERG has undergone several significant algorithmic iterations [15,16]. The latest version (V07), released in 2023, features key upgrades such as microwave sensing algorithm optimization and cross-sensor calibration. Notably, it introduces a physics-constrained Climatological Calibration Algorithm (CCA) for the first time in the Early and Late Runs [17,18], designed to reduce systematic biases of real-time products in the absence of ground observation calibration, which is regarded as a pivotal advance in Near Real Time (NRT) product performance.
Evaluations spanning disparate climate regimes highlight the evident advantages of IMERG V07 relative to V06 in precipitation detection, quantitative estimation, and hydrological simulation. A global assessment over landslide-prone terrain found V07 improve correlation with ground measurements at 82% of gauge locations and better Root Mean Square Error (RMSE) at 73% of locations [19]. Independent assessments across Western Europe [20], the United States [20,21,22], Brazil [23,24], Australia, [25] and China [18,26,27] consistently indicate that V07 effectively reduces estimation error while enhancing precipitation detection capabilities and the fidelity of spatiotemporal structure. For instance, the Probability of Detection (POD) improves by 5.0%, and the RMSE decreases by 3.7% over mainland China [18]. The mean error in event precipitation decreased by 75–85%, and the RMSE decreased by 15–30% in North Carolina [22]. In terms of hydrological simulation, V07 ranks among the most reliable datasets for predicting ground-based observations in Nigeria [28]. In the continental United States, V07 demonstrated superior peak flow capture ability compared to V06 [21]. In Australia, the percent bias in the flow duration curve high-segment volume (FHV) decreased from V06 (−61.52% to −38.85%) to V07 (−39.29% to −30.64%) [25], indicating a significant improvement in flood simulation.
Despite overall performance improvements, the uncertainty of V07 under specific complex meteorological and underlying surface remains significant. Current studies generally indicate that V07’s performance varies by season, surface characteristics, and precipitation types. While it performs well in detecting moderate precipitation, it still struggles with weak precipitation (drizzle) and moderate to extreme events, particularly in area with complex terrain, where its ability to capture precipitation remains limited [19,21,23,26,27,29]. More notably, research in the Indonesian Maritime Continent shows that the V07 Final Run underperforms V06 in three key metrics: precipitation accumulation (PA), precipitation frequency (PF), and precipitation intensity (PI) [30], reflecting the new algorithm’s insufficient adaptability to certain climatic regions.
These assessments across continents and climate zones lay the foundation for understanding the performance of V07, but there are still significant knowledge gaps in existing research. Current studies mostly focus on single short-term temporal scales such as hourly or daily, lacking exploration of the error propagation mechanism from short-term to long-term cumulative scales. As the temporal scale increases, random errors in precipitation products may be partially offset, but systematic bias may be dramatically amplified during the accumulation process [31,32,33]. The existing single-scale evaluation approach not only makes it difficult to clarify the cumulative effects of systematic bias across different temporal scales but also easily leads to misjudgments of V07’s long-term performance, reducing its reliability in application scenarios with high requirements for cumulative precipitation accuracy, such as drought monitoring and agricultural irrigation. Furthermore, existing studies have rarely evaluated the performance discrepancies among the three V07 Runs (Early, Late, Final) across different temporal scales; following the introduction of the CCA, the spatiotemporal heterogeneity of accuracy accumulation for NRT products remains unclear, and the combined effects of topographic and precipitation intensity on bias accumulation also require further analysis.
As a typical mountainous monsoon region in South China, Guangxi features transitional terrain ranging from the Yunnan–Guizhou Plateau to coastal plains; the combined influence of topography and climate creates a complex hydro-meteorological environment, providing an ideal test area for examining the applicability of satellite precipitation products under heavy rainfall conditions. In addition, Guangxi is a major agricultural area and a key disaster-prone region in China; reliable precipitation monitoring is critical for local water resource allocation and disaster mitigation policymaking, and relevant evaluation findings can be well extrapolated to analogous mountainous monsoon regions worldwide.
To address the aforementioned shortcomings, this study takes Guangxi as the research area and systematically compares the performance differences in various IMERG V07 Runs relative to V06 at daily and monthly scales, filling the gap in multi-scale error analysis. The main innovations are: (1) revealing the scale dependence of performance by comparing multi-metric evaluations at daily and monthly scales, and exploring the propagation and evolution characteristics of errors during temporal aggregation; (2) quantifying the bias accumulation mechanism, with a focus on analyzing the joint modulation effect of elevation gradients and precipitation intensity on the V07 retrieval accuracy; (3) clarifying the boundaries of algorithm improvements, evaluating the practical benefits of Early/Late Runs in typical monsoon regions after the introduction of the CCA, and providing deviation correction basis for regional hydrometeorological applications.

2. Materials and Methods

2.1. Study Area

Guangxi is located in southern China (104°26′–112°04′E, 20°54′–26°24′N), with the Tropic of Cancer passing through its central region. The terrain is high in the northwest and low in the southeast, with hills and river valleys widely distributed in the central and southern parts, forming an overall mountainous and hilly basin landscape (Figure 1a). Guangxi is characterized by both marine and continental climates and is one of the regions with the most abundant precipitation in China. Annual precipitation generally exceeds 1000 mm (Figure 1b), with distinct dry and wet seasons. The rainy season spans April to September, with a peak in June (Figure 1c). Based on the mean annual precipitation observed at meteorological stations across the study area (Figure 1d), the geometrical interval classification method [34] was adopted to derive two precipitation thresholds of 1322 mm and 1736 mm. To facilitate climatic zonation and comparative analysis, these thresholds were rounded to 1300 mm and 1700 mm. Accordingly, Guangxi was categorized into three precipitation gradient zones: low-rainfall Zone I (mean annual precipitation < 1300 mm), moderate-rainfall Zone II (1300–1700 mm), and high-rainfall Zone III (≥1700 mm).

2.2. Data

2.2.1. IMERG Products

IMERG achieves continuous global precipitation retrieval by integrating microwave and infrared observations from multiple satellites, providing precipitation products with a spatial resolution of 0.1° and a temporal resolution of 30 min. According to data timeliness and calibration strategy, the products are divided into three series: Early Run, Late Run, and Final Run (abbreviated as ER, LR, and FR, respectively). Among them, ER and LR are NRT products, with release delays of approximately 4 h and 12 h, respectively. The main difference between them is that ER only uses forward propagation, while LR uses both forward and backward propagation. FR has a release delay of about 3.5 months and incorporates monthly Global Precipitation Climatology Center (GPCC) ground observation data for bias correction, making it more reliable and stable [9,35].
The IMERG V06B and V07B data used in this study were downloaded from the public platform provided by the GPM official website (https://gpm.nasa.gov). For each version, three precipitation Runs were obtained, with the time span ranging from 1 January 2014 to 31 December 2020 and the temporal resolutions including daily and monthly. Since monthly products of the ER are not released on the GPM official website, the daily products were accumulated by natural months to generate the monthly precipitation for ER from January 2014 to December 2020. Ultimately, a total of 12 datasets were obtained: two IMERG versions, three Runs, and two temporal scales.

2.2.2. Validation Data

Ground validation data were obtained from 91 national meteorological stations in Guangxi. Since data from 12 of these stations were incorporated by GPCC for calibrating the FR, these stations were excluded when validating the FR to ensure the independence of ground validation. Station metadata indicate that none of the 91 stations experienced major relocations during the study period (2014–2020), ensuring long-term consistency of the observation series. The distribution of these stations across different elevation gradients and rainfall zones is shown in Table 1.
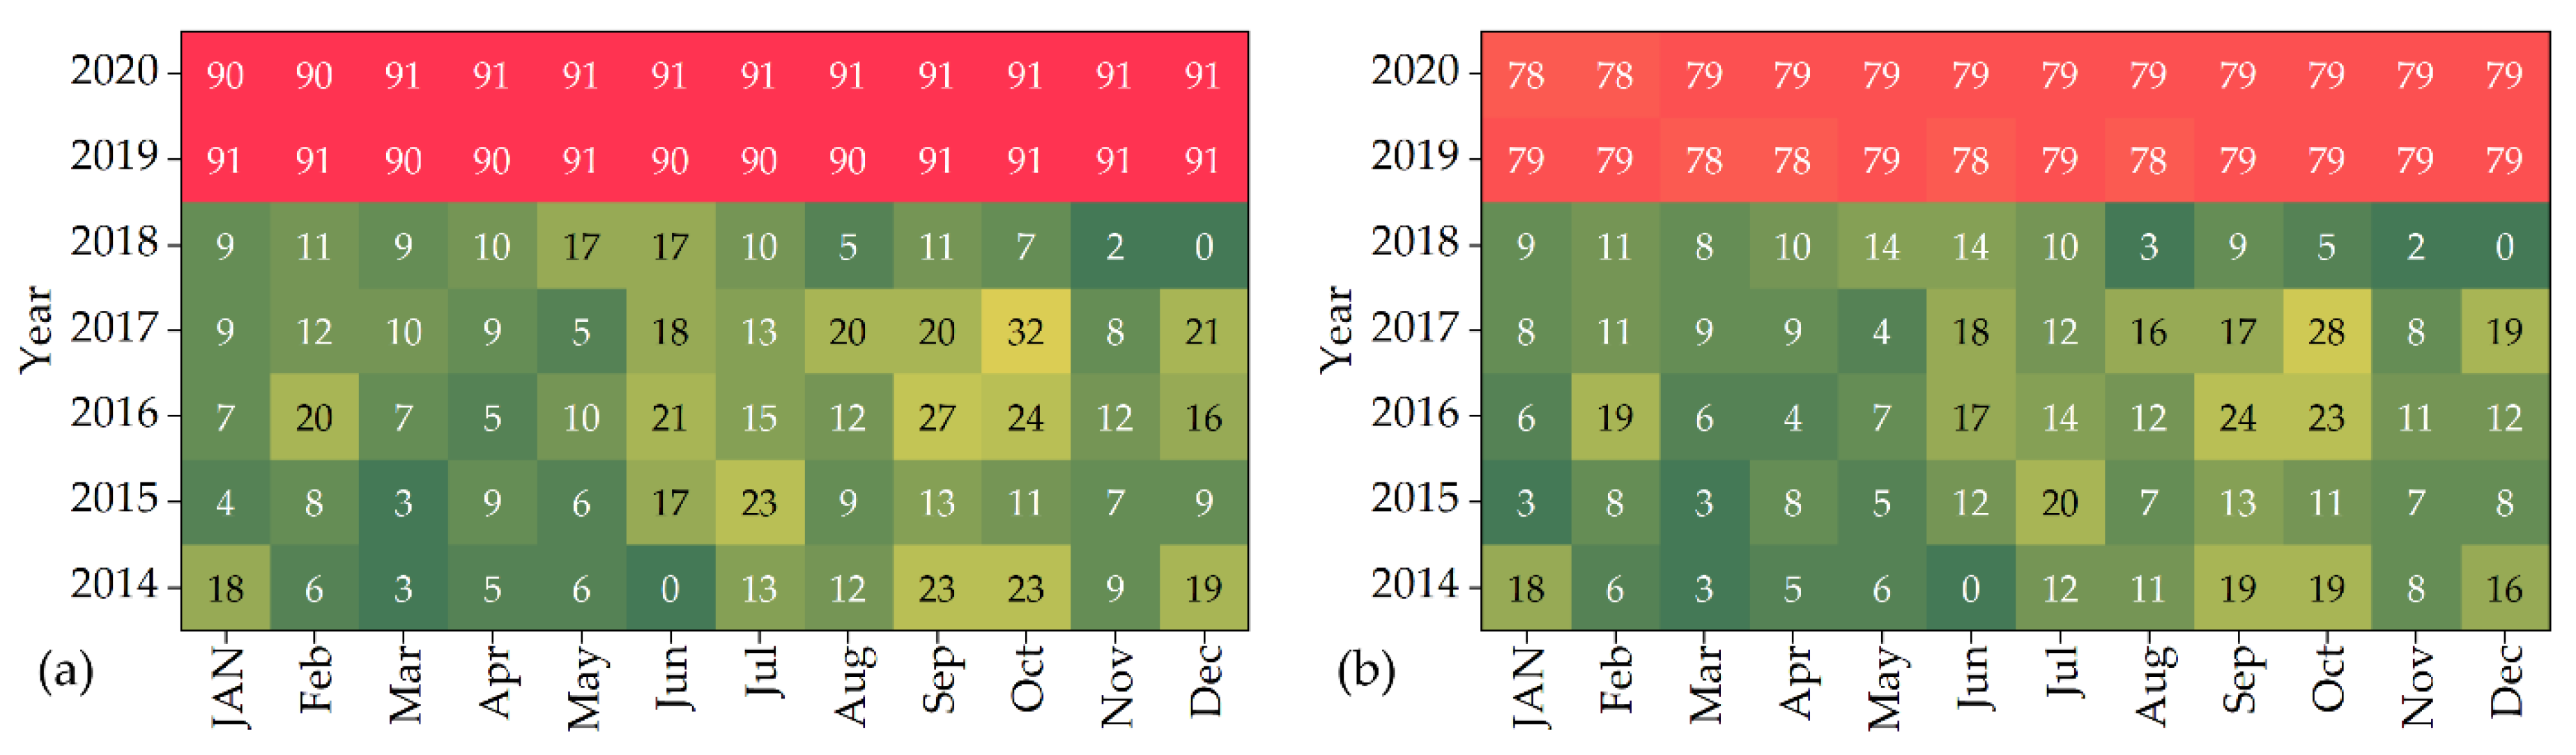
The observed daily and monthly precipitation data were provided by the Guangxi Meteorological Bureau, with a unit of millimeters (mm) and a measurement resolution of 0.1 mm. All data underwent rigorous quality control procedures, including checks for climate extremes, historical station extremes, spatiotemporal consistency, and internal consistency [26,36,37], to ensure accuracy and reliability. Daily precipitation was recorded from 08:00 BJT to 08:00 BJT the next day, corresponding to 00:00–24:00 UTC, which is consistent with the temporal coverage of IMERG products. Monthly precipitation was aggregated from daily values on a natural month basis. To ensure data integrity at the monthly scale, a month was treated as invalid if any missing observation occurred within that month. Daily data were also flagged as invalid if matched monthly records were unavailable to unify study periods for both temporal scales. The number of stations with complete observed data for each period is shown in Figure 2.

2.3. Methodology

2.3.1. Data Spatial Matching Scheme

Rain gauge observations provide point-scale precipitation measurements, whereas IMERG products represent area-averaged precipitation within grid cells, leading to spatial mismatches between point-based gauge data and satellite-based grid data. To evaluate the performance of SPPs, gauge data are usually interpolated to the same resolution as satellite product [38,39]. However, interpolation quality heavily depends on the density and distribution of stations due to the strong spatial heterogeneity of precipitation. In regions with sparse stations, interpolation may lead to excessive smoothing of spatial variability, introducing significant uncertainty [40,41]. Given the limited number of stations in this study and that each gauge is independently located within a single grid, corresponding values from the IMERG grid were extracted based on the geographic coordinates of the gauges. This widely adopted alignment strategy in regions with sparse stations was used to ensure the authenticity of the validation data [37,40,42]. The numbers of paired daily and monthly samples obtained after matching are listed in Table 2, which also presents station density and data completeness for each year.

2.3.2. Data Grouping Scheme

To reveal the spatiotemporal differences in V07’s performance evolution under different geographical and climatic backgrounds, overall statistical and multidimensional stratified statistics were conducted. Spatially, grouping was done by station, rainfall zones, and elevation gradient, with elevation divided into four gradients of <100 m, 100–200 m, 200–500 m, and 500–1000 m. Temporally, the dataset was divided by meteorological seasons into winter (December–February of the following year), spring (March–May), summer (June–August), and autumn (September–November), and according to regional precipitation seasonality into dry season (October–March of the following year) and wet season (April–September). The sample counts for each group are shown in Table 3 and Table 4. In the evaluation of daily precipitation event detection, 0.1 mm is used as the threshold to distinguish precipitation or non-precipitation, and classification is carried out according to intensity thresholds of 1 mm, 2 mm, 5 mm, 10 mm, 20 mm, and 50 mm, dividing precipitation into no/tiny rain, light rain, low moderate rain, high moderate rain, low heavy rain, high heavy rain, and violent rain [37,42], to analyze the capabilities of precipitation detection in different magnitudes.

2.3.3. Evaluation Metrics

Four quantitative metrics, namely, Correlation Coefficient (CC), Root Mean Square Error (RMSE), Relative Bias (RB), and Kling-Gupta Efficiency (KGE) were adopted to evaluate the performance of IMERG Runs, and the systematic error proportion (Es) was evaluated based on the linear regression correction model [37,42]. CC quantifies the linear correlation and temporal synchronization in variability trends between IMERG estimates and gauge observations. RMSE measures the overall deviation between IMERG and observed values, where smaller values indicate higher accuracy. RB assesses the relative departure of IMERG from observations and identifies overestimation or underestimation: positive values denote overestimation, negative values denote underestimation, and smaller absolute values represent smaller bias. KGE comprehensively integrates three statistical components: correlation, variability (ratio of standard deviations), and bias (ratio of means). It is used to holistically evaluate the consistency of IMERG products with observations in terms of trend, amplitude, and systematic bias.
In order to evaluate the capability of precipitation detection, the Probability of Detection (POD) is used to characterize the proportion of effectively detected precipitation events, the False Alarm Ratio (FAR) reflects the misjudgment of situations, the Critical Success Index (CSI) comprehensively evaluates the overall accuracy of precipitation detection, and the Probability Density Function (PDF) is used to analyze the frequency distribution in different precipitation intensity [37,42]. The formulas for these metrics are shown in Table 5.
In addition, the Bootstrap Confidence Interval method [43,44] was adopted to calculate the 95% confidence intervals of all statistical metrics for quantitatively assessing their uncertainties. Since the precipitation evaluation metrics generally fail to follow a normal distribution, the Wilcoxon signed-rank test [45,46] was applied to examine the statistical significance of differences in various metrics between the two IMERG versions.

3. Results

3.1. Daily Scale Performance and Event Detection

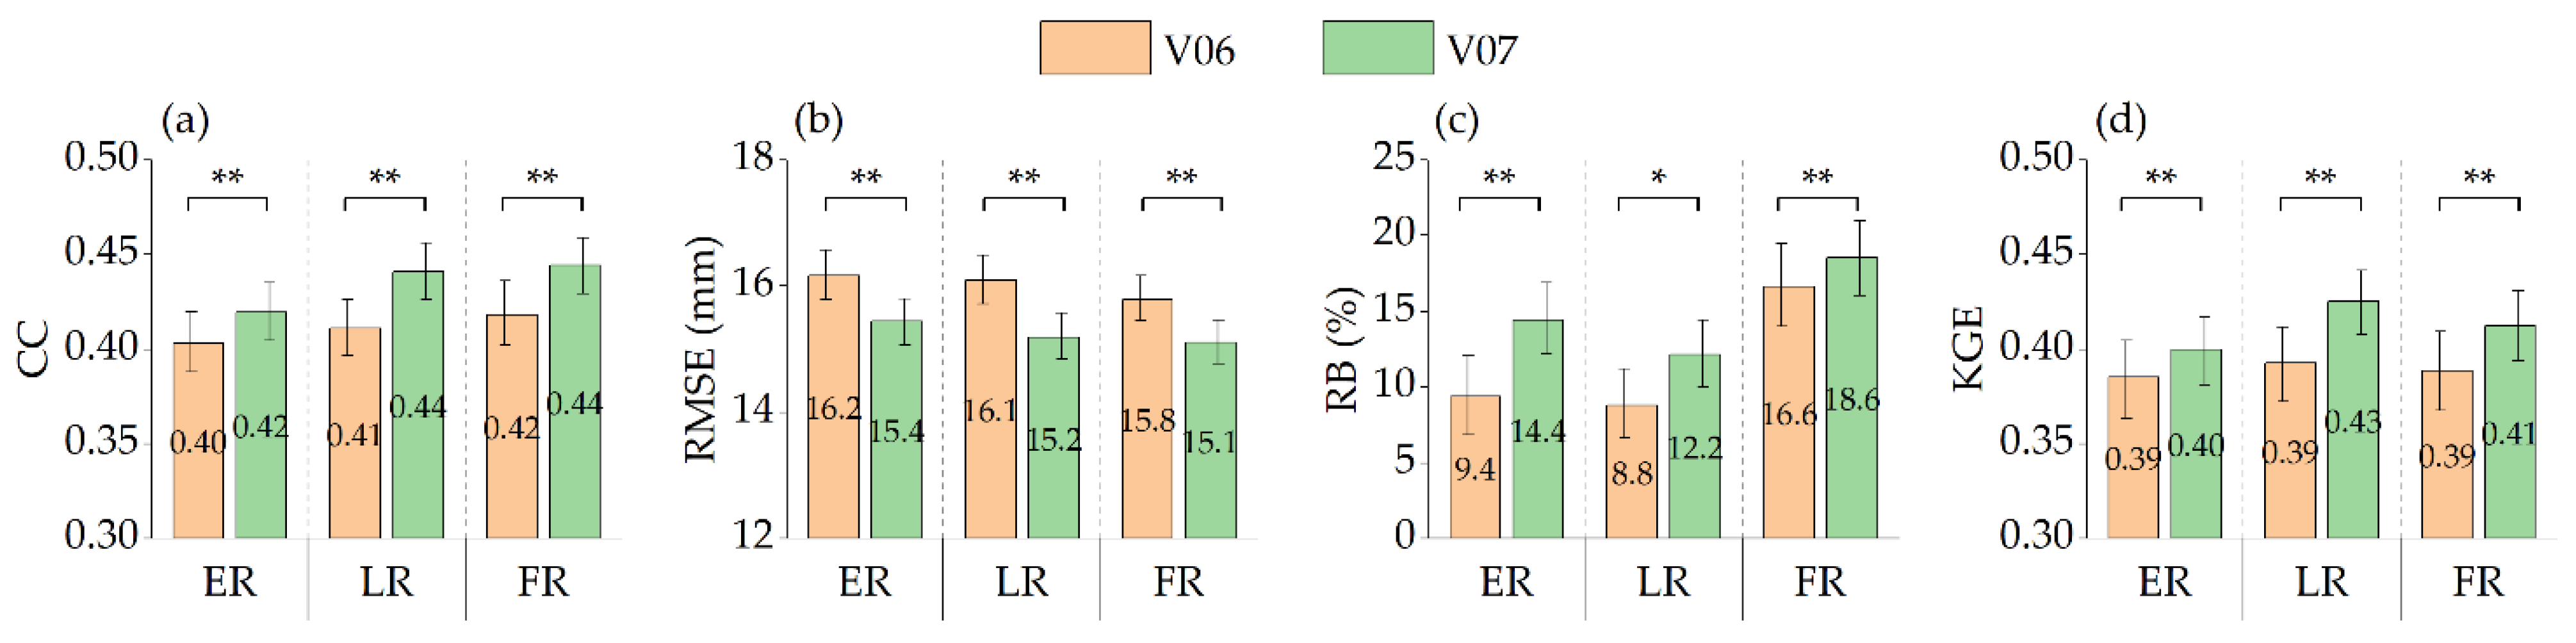
Figure 3 summarizes the overall statistical performances of daily precipitation from the two IMERG versions. V07 achieves better spatiotemporal consistency and quantitative estimation accuracy compared to V06. Specifically, CC and KGE of all three V07 Runs increase significantly (p < 0.01), accompanied by pronounced declines in RMSE, demonstrating substantial improvements in the upgraded algorithm in capturing daily precipitation variability. Nevertheless, such accuracy gains are offset by aggravated systematic overestimation bias: the RB of all V07 Runs rises statistically significantly from 9.4–16.6% (V06) to 14.4–18.6% (V07).
Notably, LR exhibits the most prominent performance improvement across the version update, with its KGE rising to 0.43 (±0.02), which outperforms not only its V06 counterpart but also the gauge-calibrated FR (0.41 ± 0.02). This finding highlights the great application potential of the NRT V07 products for daily hydrological practice. However, the exacerbated overestimation implies that elaborate bias correction is indispensable prior to practical utilization.
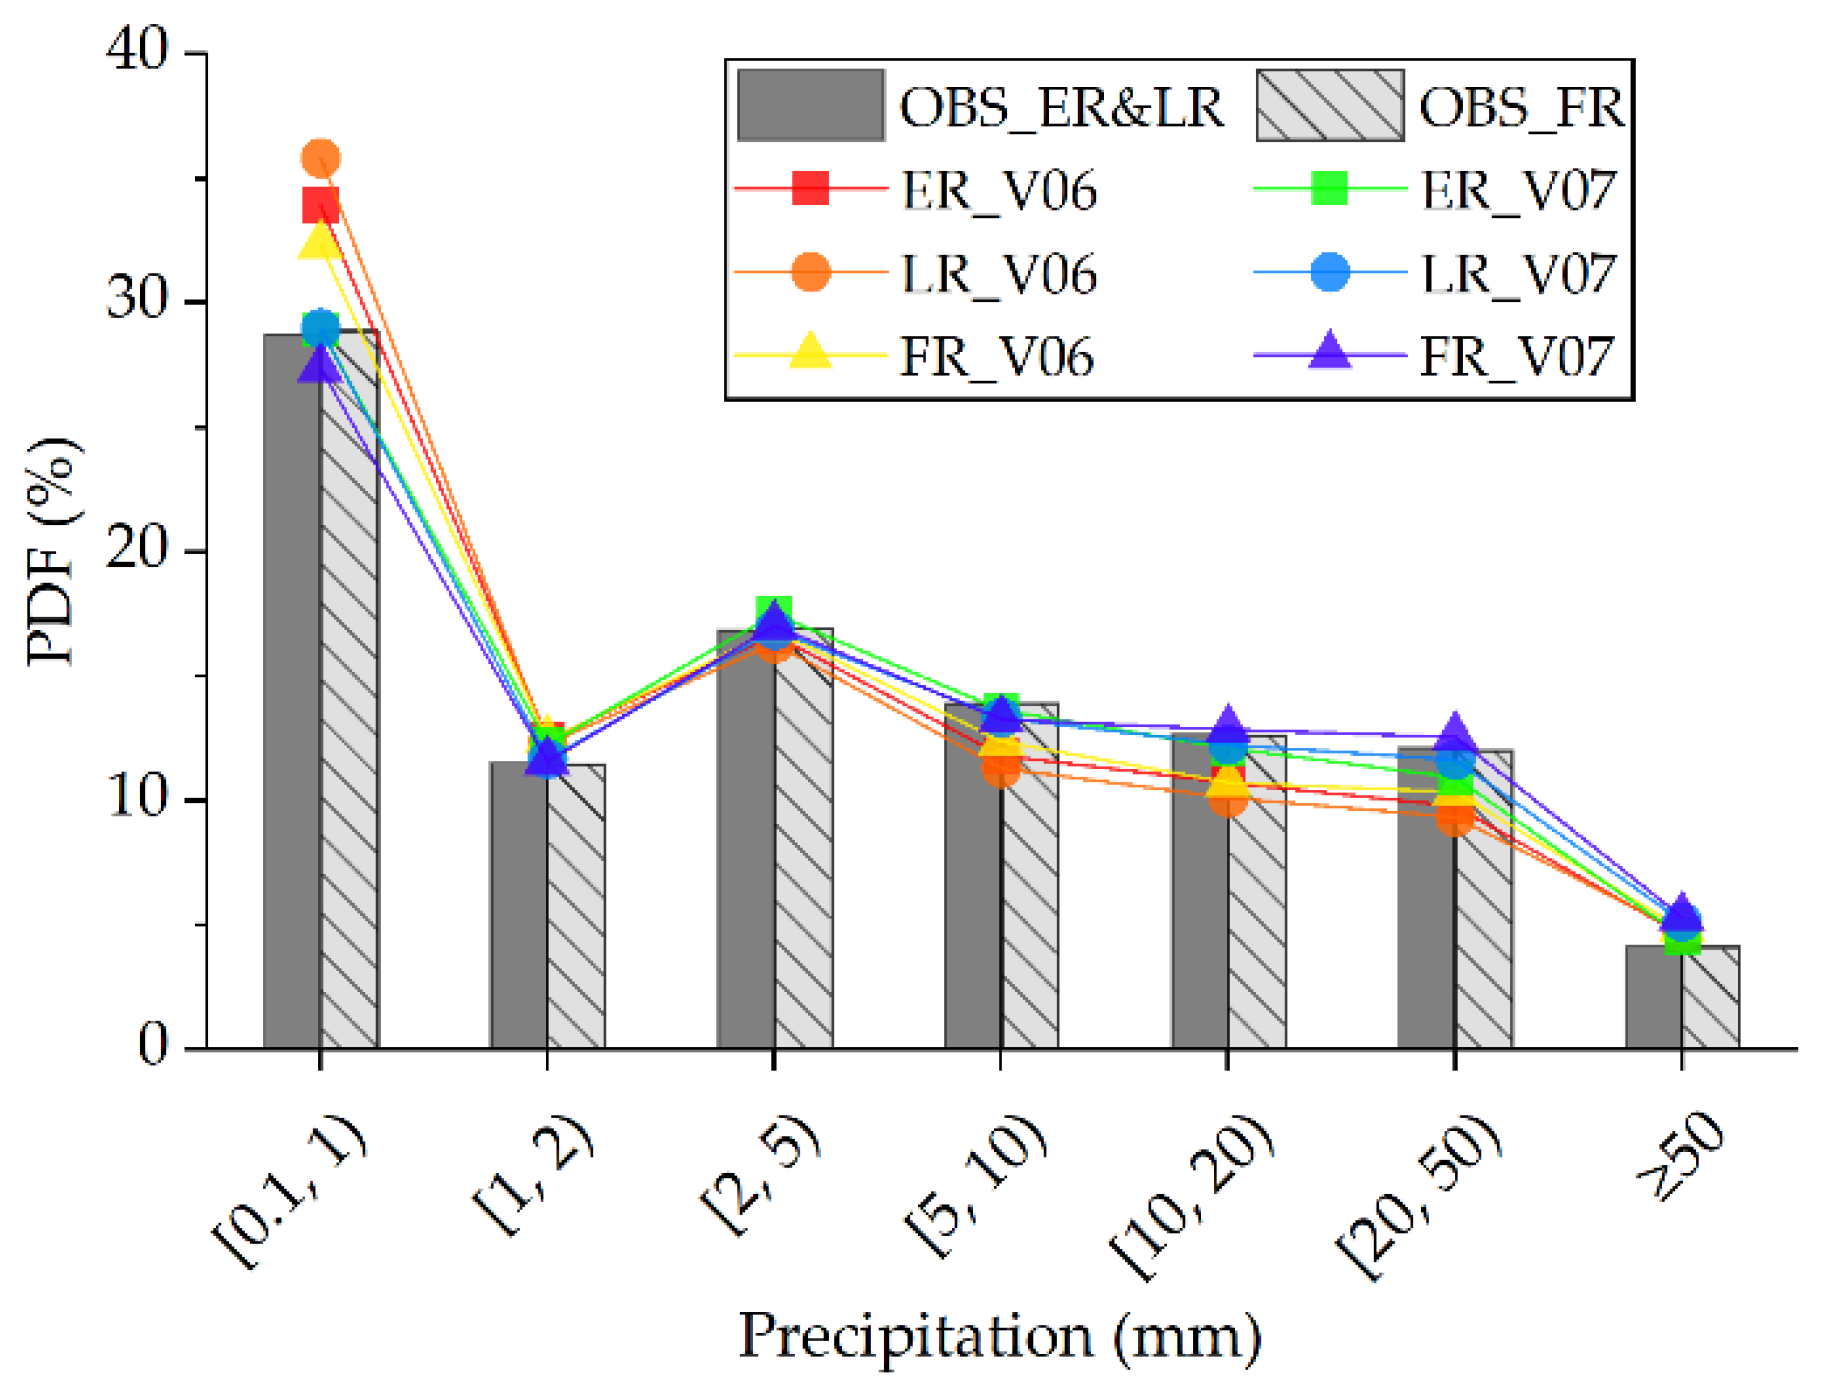
Probability density distributions across discrete precipitation intensity bins (Figure 4) reveal that V07 agrees better with observations and outperforms V06 remarkably in reproducing the precipitation magnitude structure. The most pronounced improvement occurs for tiny rain ranging from 0.1 mm to 1 mm; the corresponding PDF decreases from 32 to 36% (V06) to 27–29% (V07), closely matching the observed proportion of 29% and effectively eliminating the spurious overestimation of drizzle frequency inherent to V06. The PDF curve shifts upward entirely and converges toward observations between 5 mm and 50 mm, indicating substantial mitigation of the frequency underestimation for moderate-to-heavy precipitation.
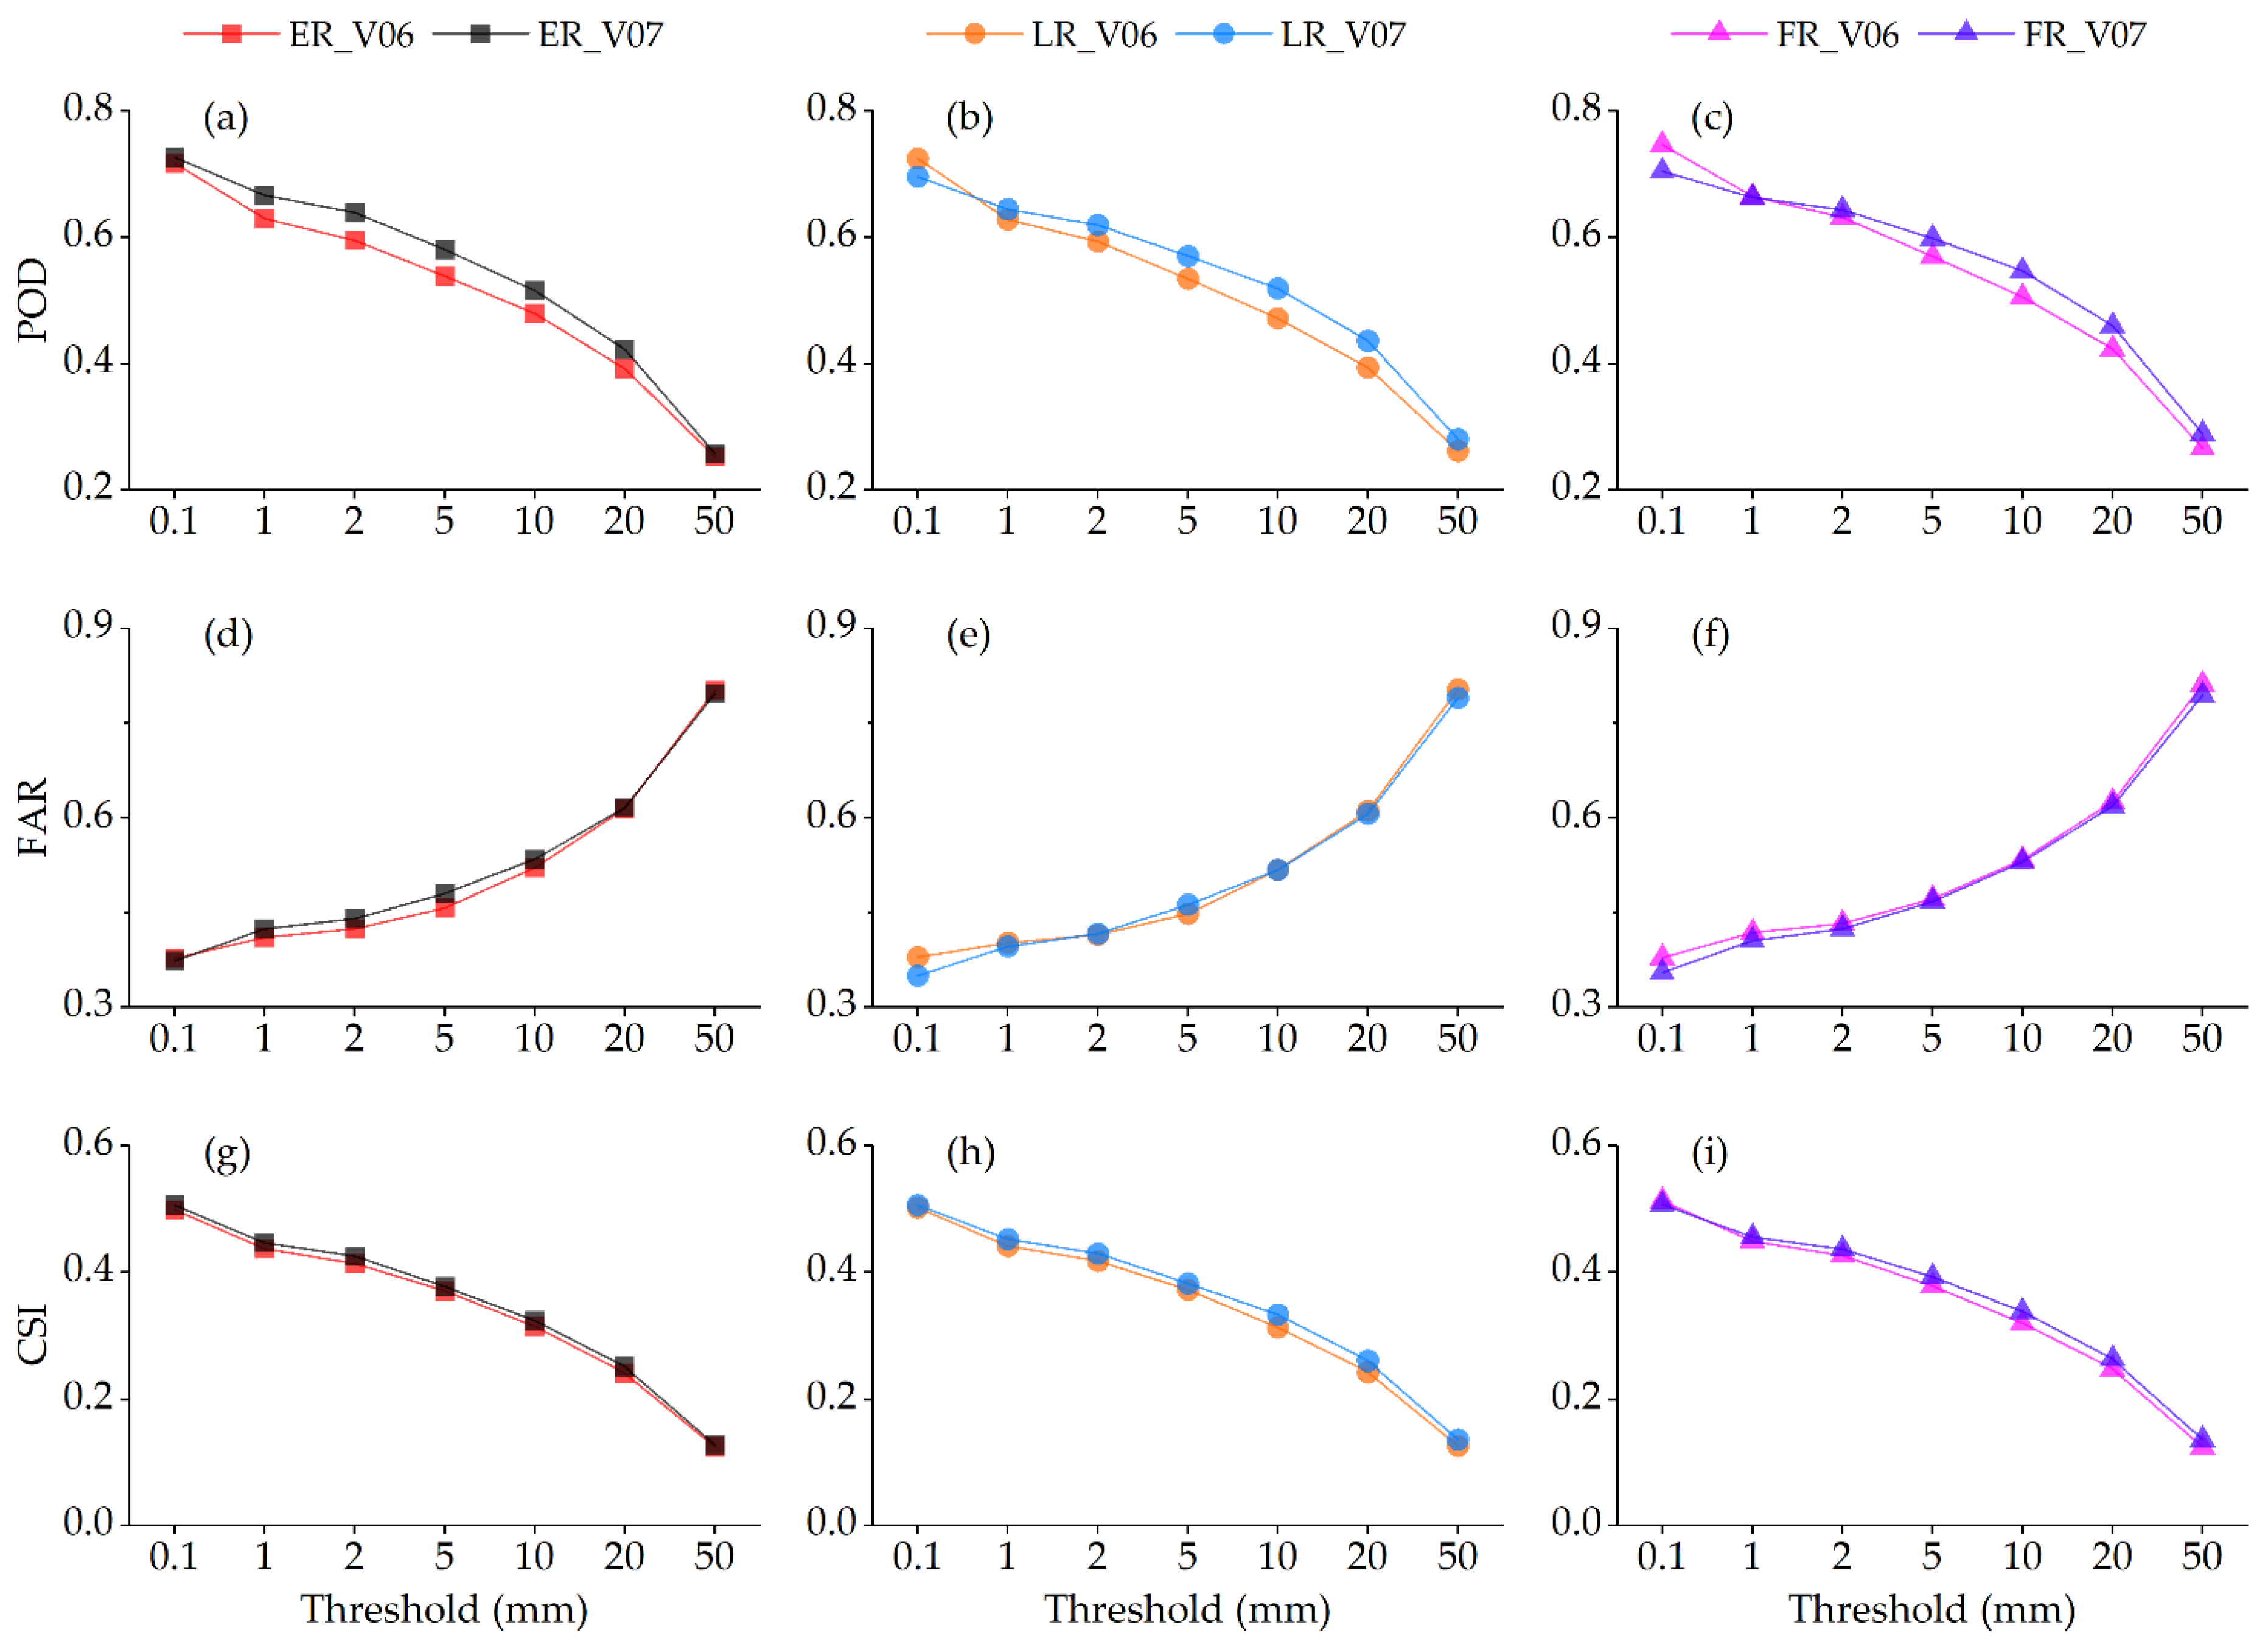
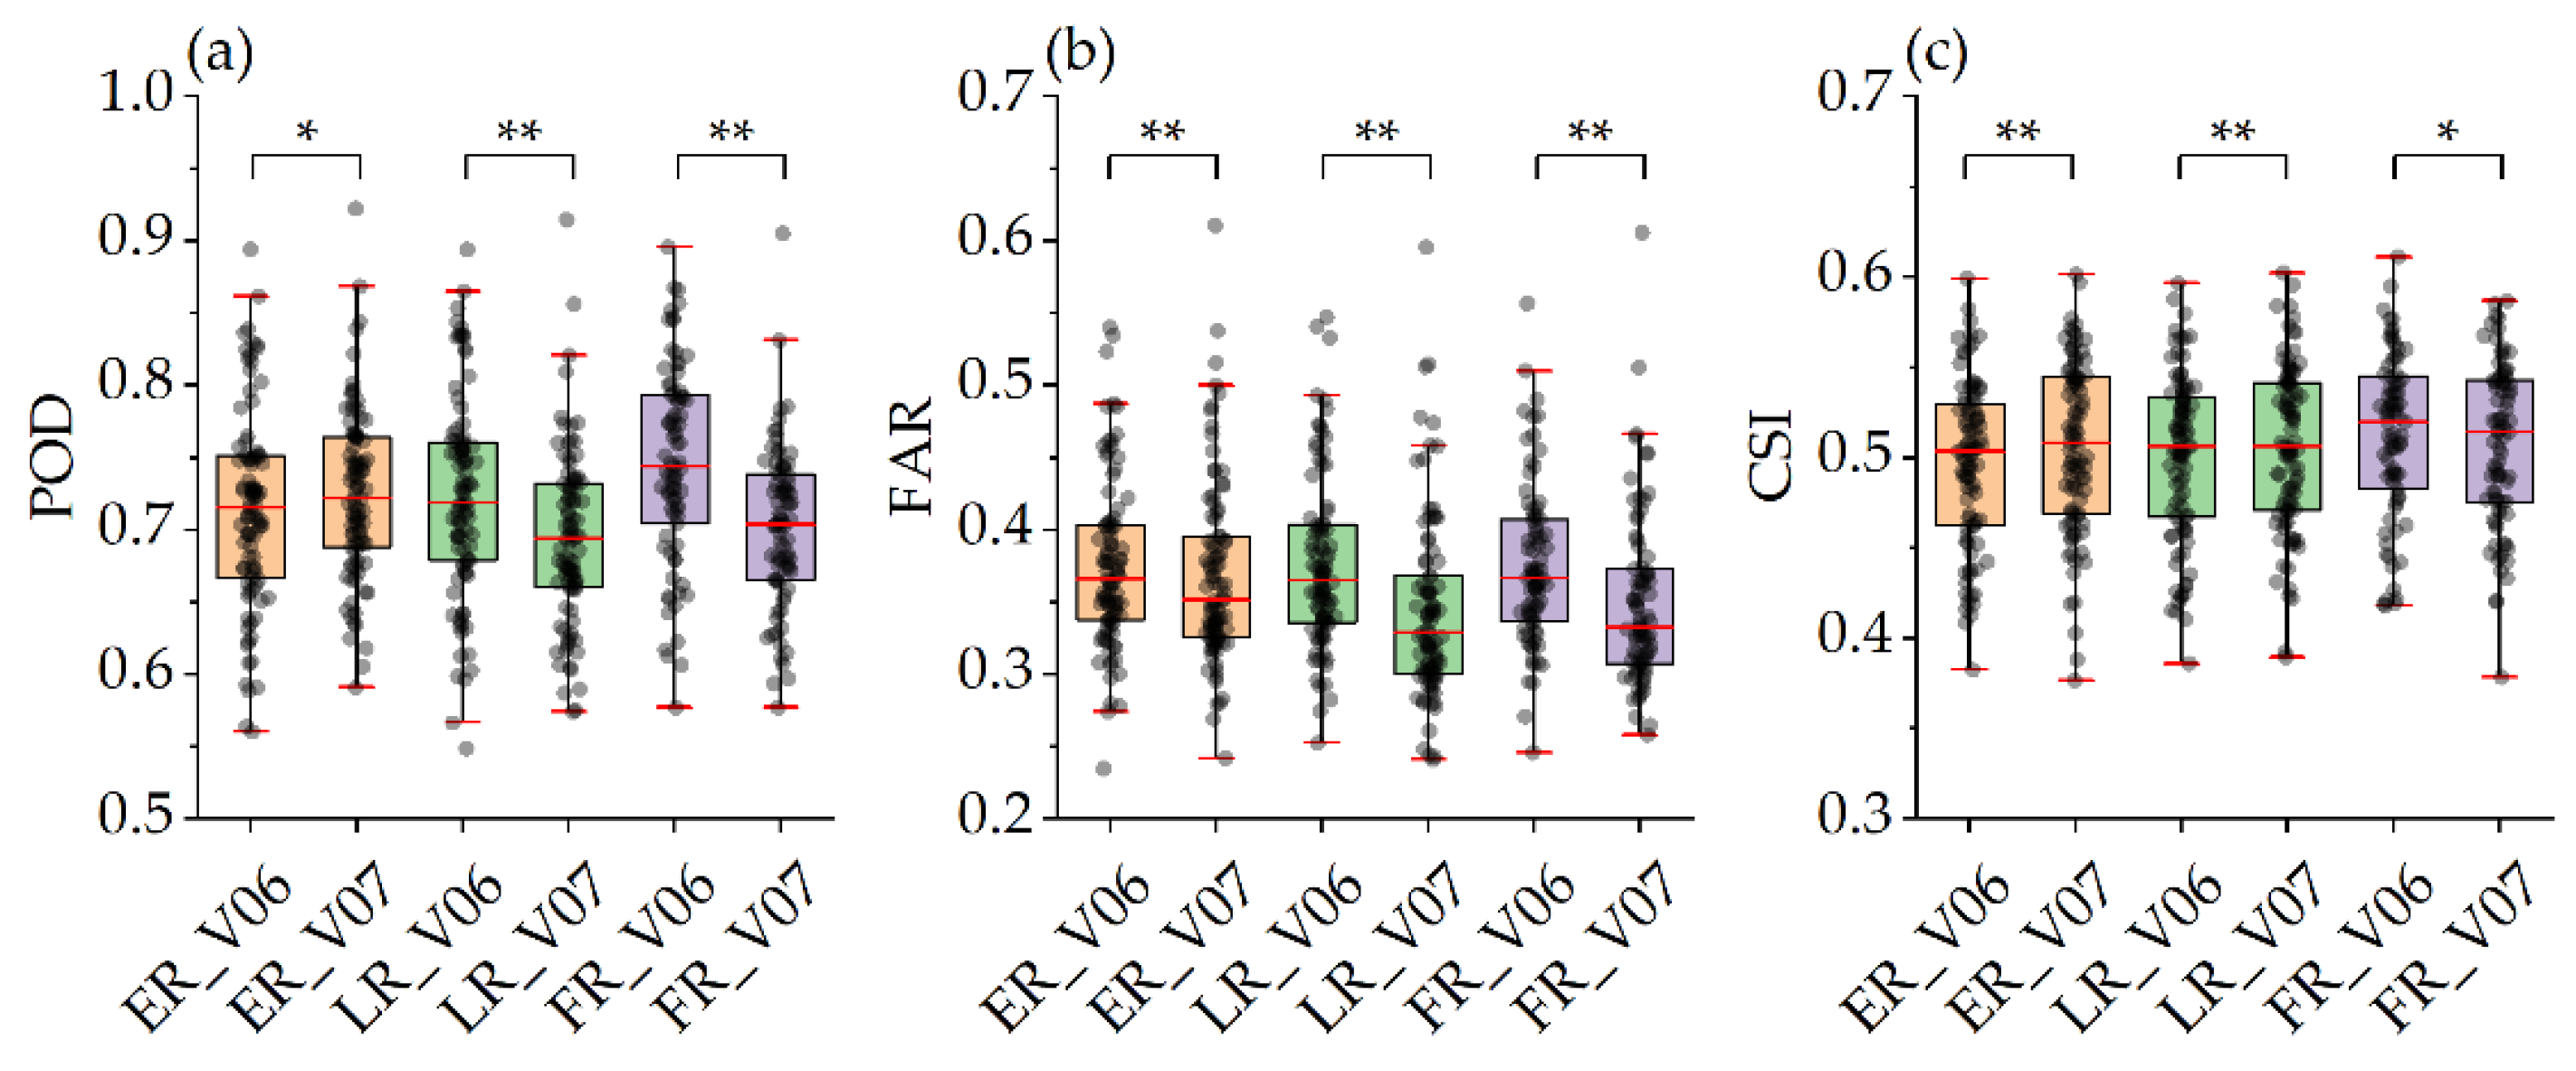
Categorical verification results stratified by precipitation intensity classes (Figure 5) illustrate that for rainfall exceeding 2 mm, V07 yields generally higher POD (Figure 5a–c) and CSI (Figure 5g–i) alongside stable FAR (Figure 5d–f) relative to V06, revealing an evident improvement in V07’s capability to detect effective rainfall events. For precipitation or non-precipitation discrimination defined at the 0.1 mm threshold, however, both LR and FR exhibit reduced FAR (Figure 5e,f) at the cost of declining POD (Figure 5b,c). Boxplots of event-detection metrics for all gauges (Figure 6) further demonstrate that the POD of LR and FR drops significantly (p < 0.01), which differs from the synchronized improvement of all ER metrics. Overall, while V07 achieves a more realistic precipitation probability distribution, its ability to capture trace precipitation remains challenging.

3.2. Monthly Scale Performance and Error Propagation

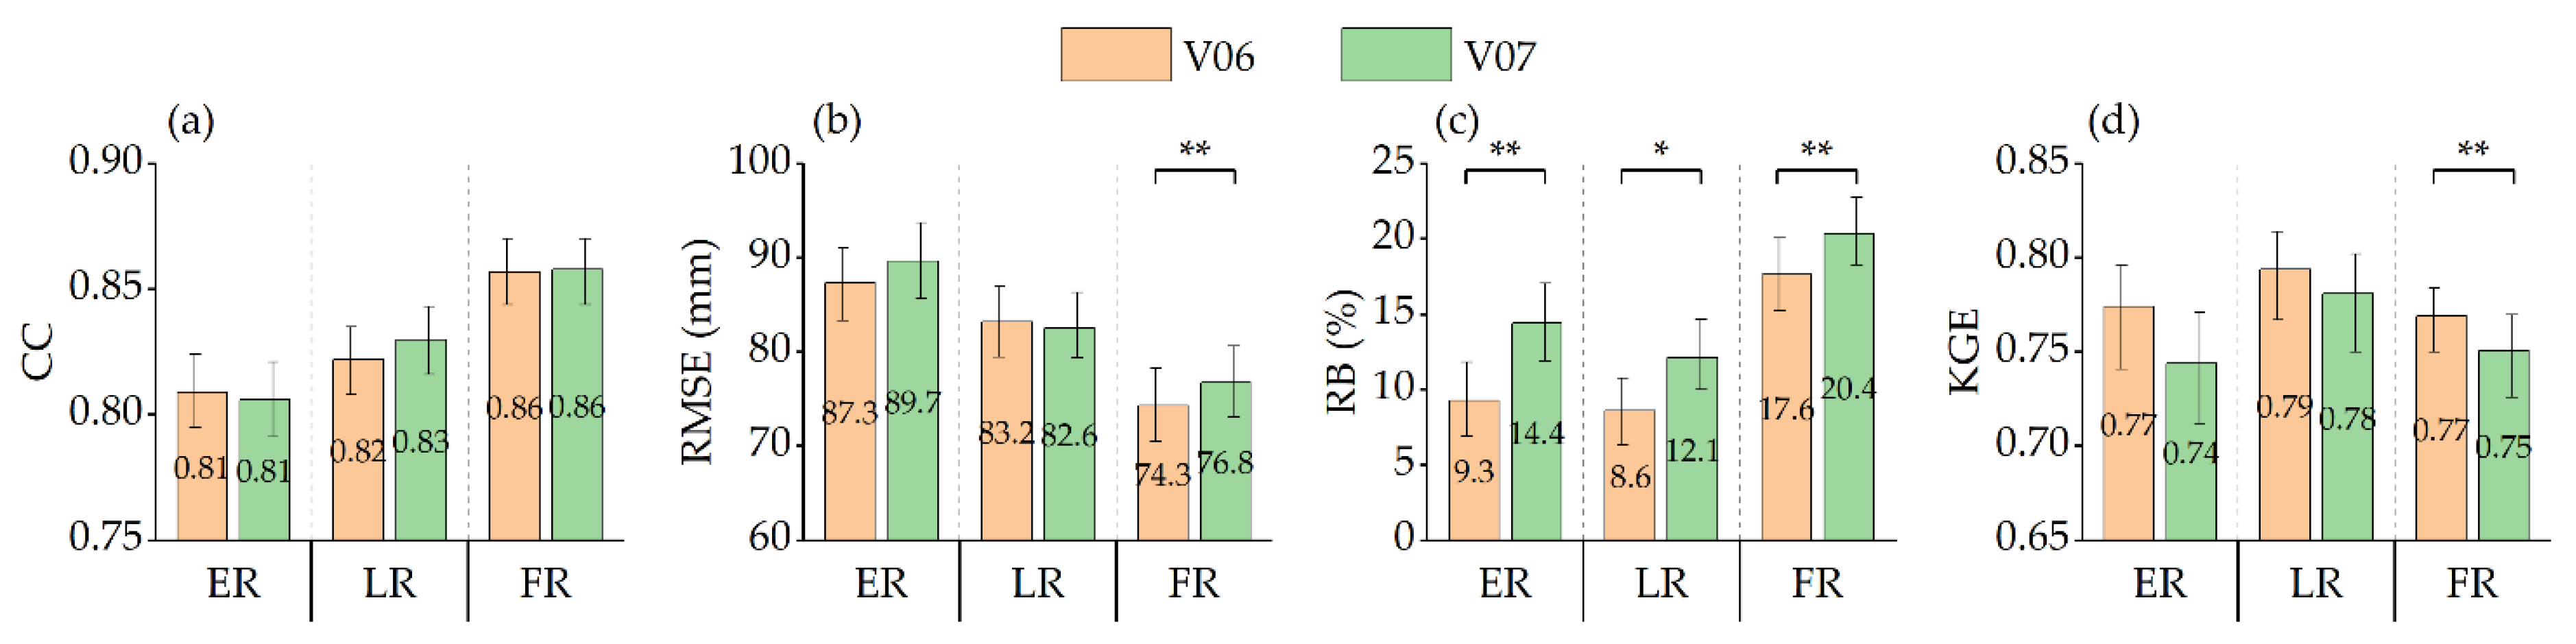
Figure 7 presents the overall statistical metrics of monthly precipitation for the two IMERG versions. In contrast to the overall improvement at the daily scale, V07 exhibits performance degradation at the monthly scale. Although both V07 and V06 sustain high correlations (CC > 0.80) with no statistically significant inter-version differences in CC, the systematic overestimation bias present on daily scale is amplified during temporal aggregation, leading to reduced quantitative estimation accuracy in V07, with FR suffering the most pronounced degradation. Specifically, all V07 Runs show deteriorated RB and KGE relative to V06, with the RB of FR reaching 20.4% (95% Bootstrap confidence interval of 18.3% to 22.8%). In addition, FR is the only Run passing the highly significant test (p < 0.01) for both decreased KGE and elevated RMSE. Despite retaining the highest CC and lowest RMSE among all V07 Runs, FR incurs the largest accuracy loss relative to its V06 counterpart, and its performance superiority against NRT Runs is substantially diminished on monthly scale.
Cross-scale evolution of error components (Table 6) reveals the statistical mechanism underlying the performance shifts across temporal scales. During temporal aggregation from daily to the monthly scales, the fraction of systematic error for all Runs increases from 62 to 69% at daily scale to 77–86% at the monthly scale. Random errors associated with individual precipitation events are largely offset via temporal averaging, leaving systematic error as the dominant contributor to total monthly error for both versions.
However, it is necessary to distinguish between this temporal aggregation effect and the inter-version change in the systematic error fraction. While V07 exhibits a higher systematic-error proportion than V06 at the daily scale, its systematic error fraction actually becomes lower than that of V06 at the monthly scale across all three Runs (e.g., dropping to 80.1% for FR_V07 versus 85.9% for FR_V06). Therefore, the degradation of V07’s monthly performance is not driven by a higher systematic error proportion relative to V06, but rather by the magnitude and accumulation of its positive biases.

3.3. Spatial Heterogeneity

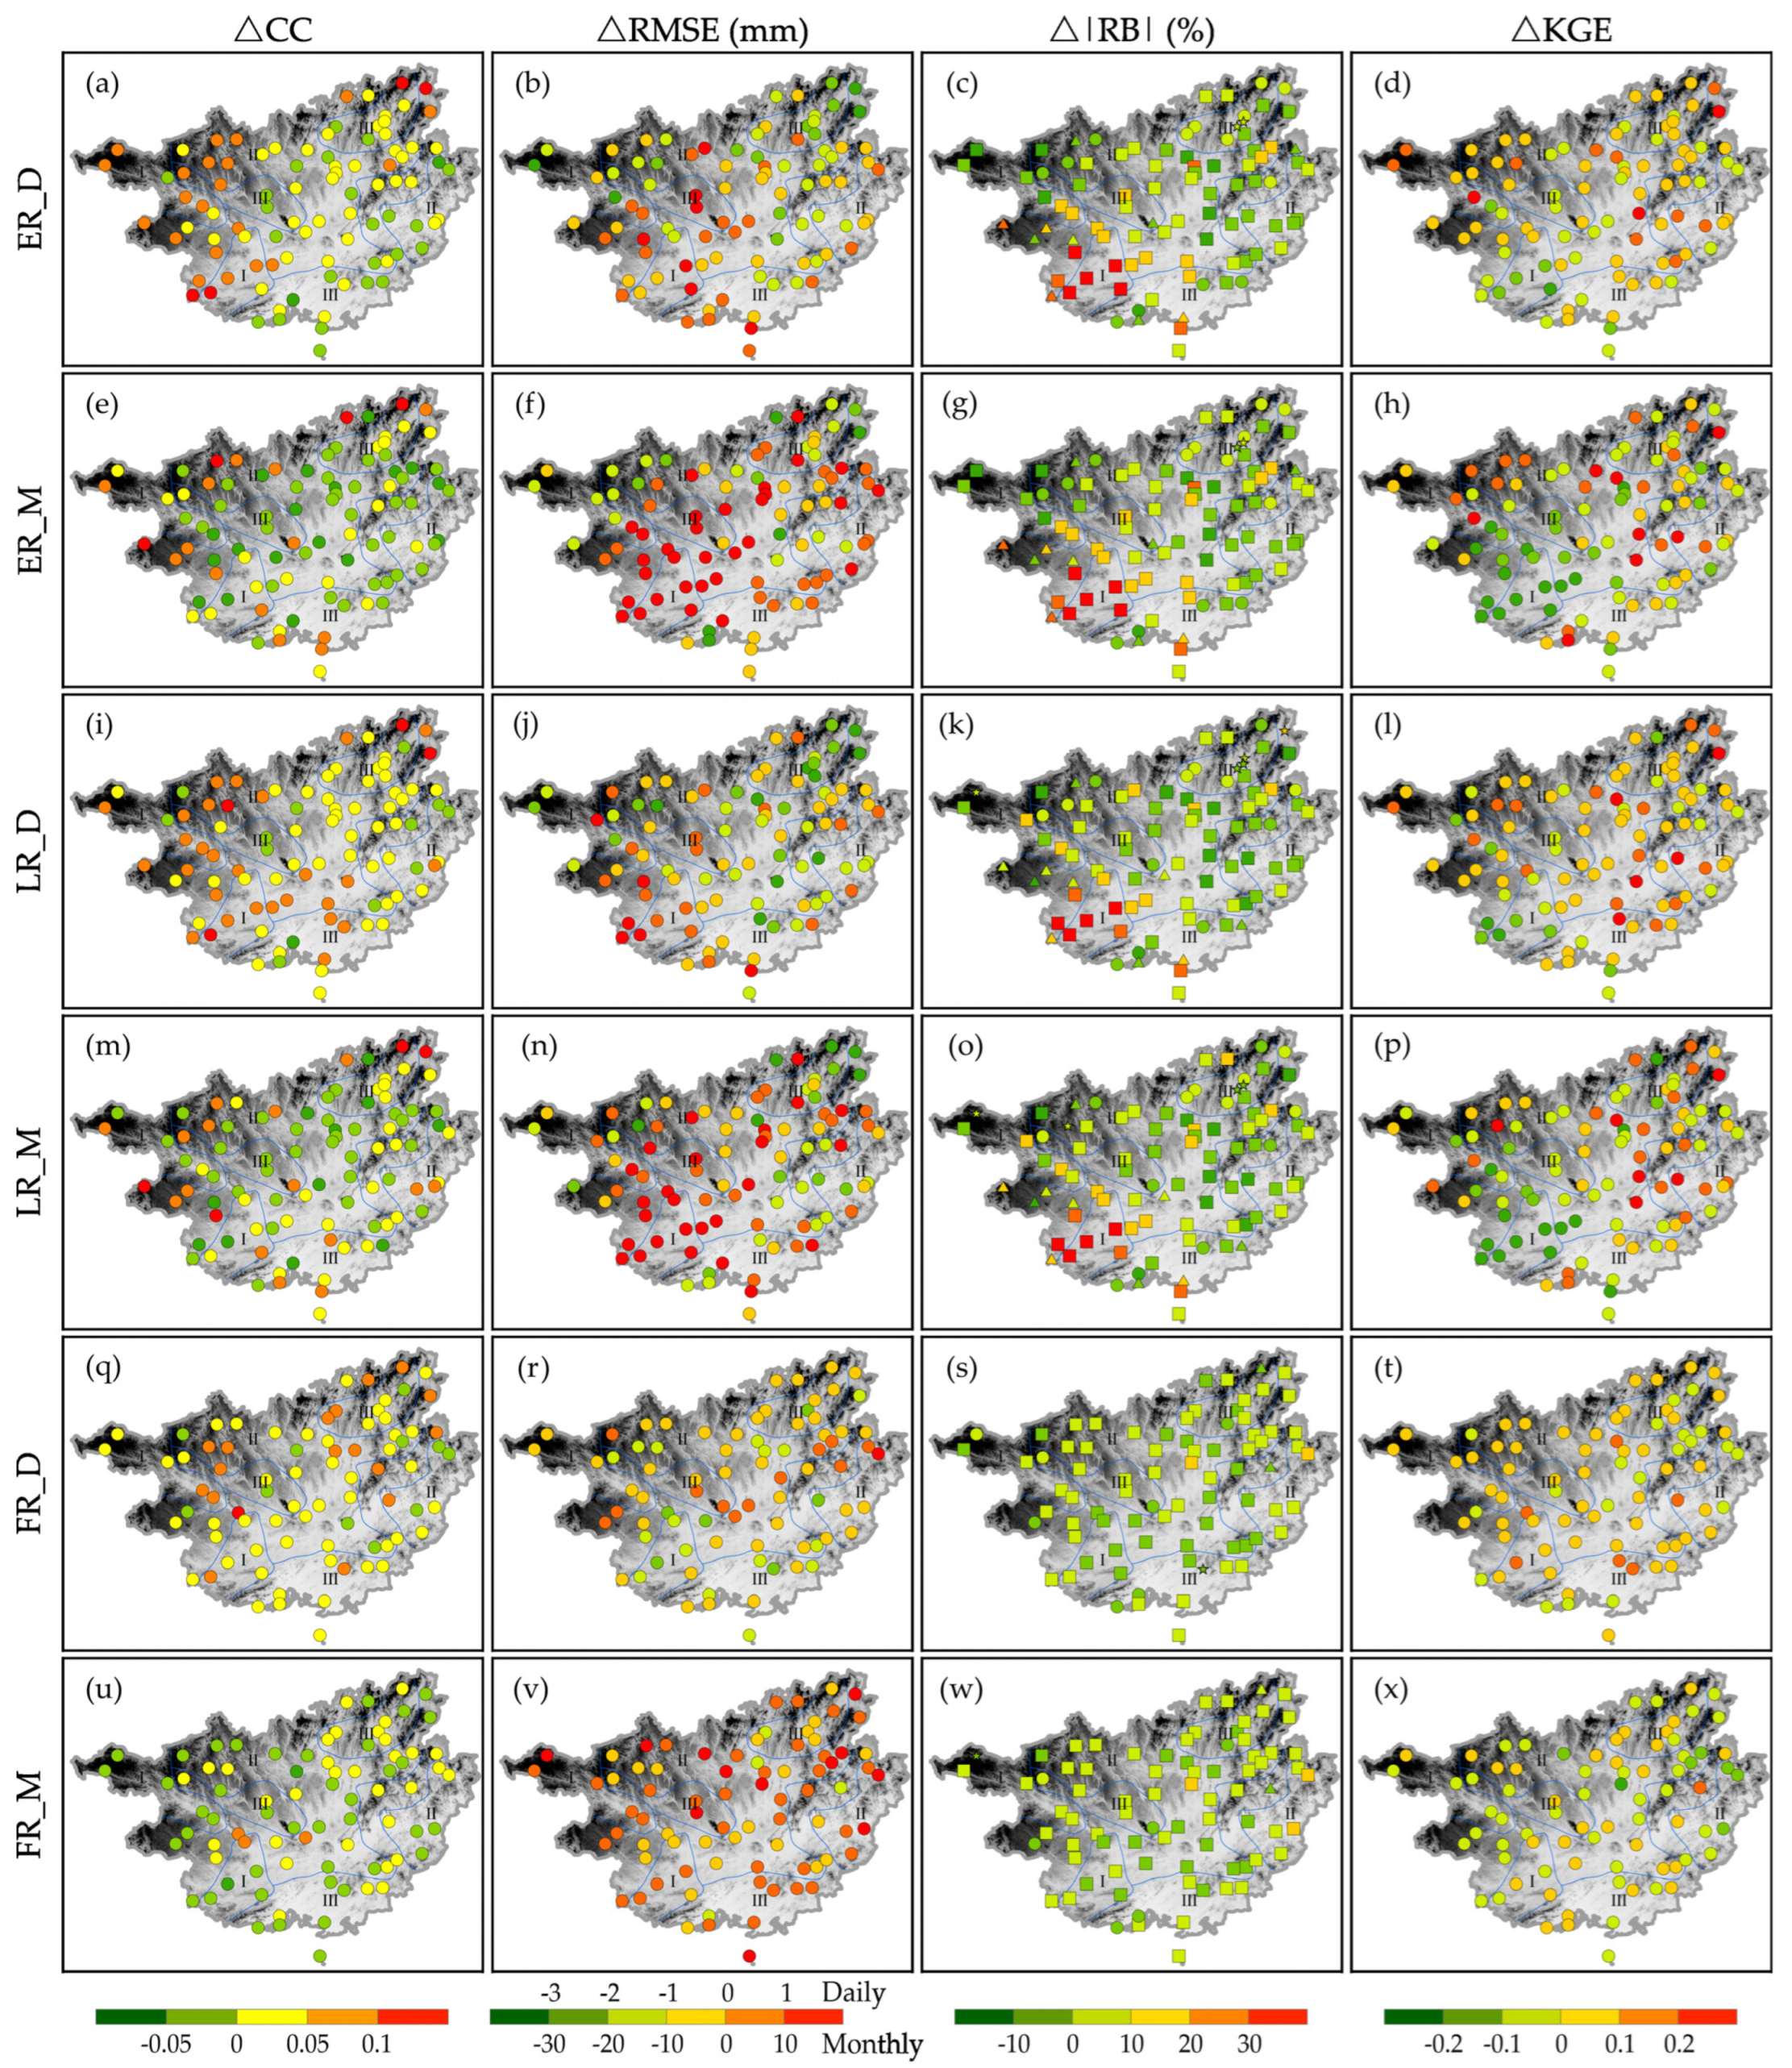
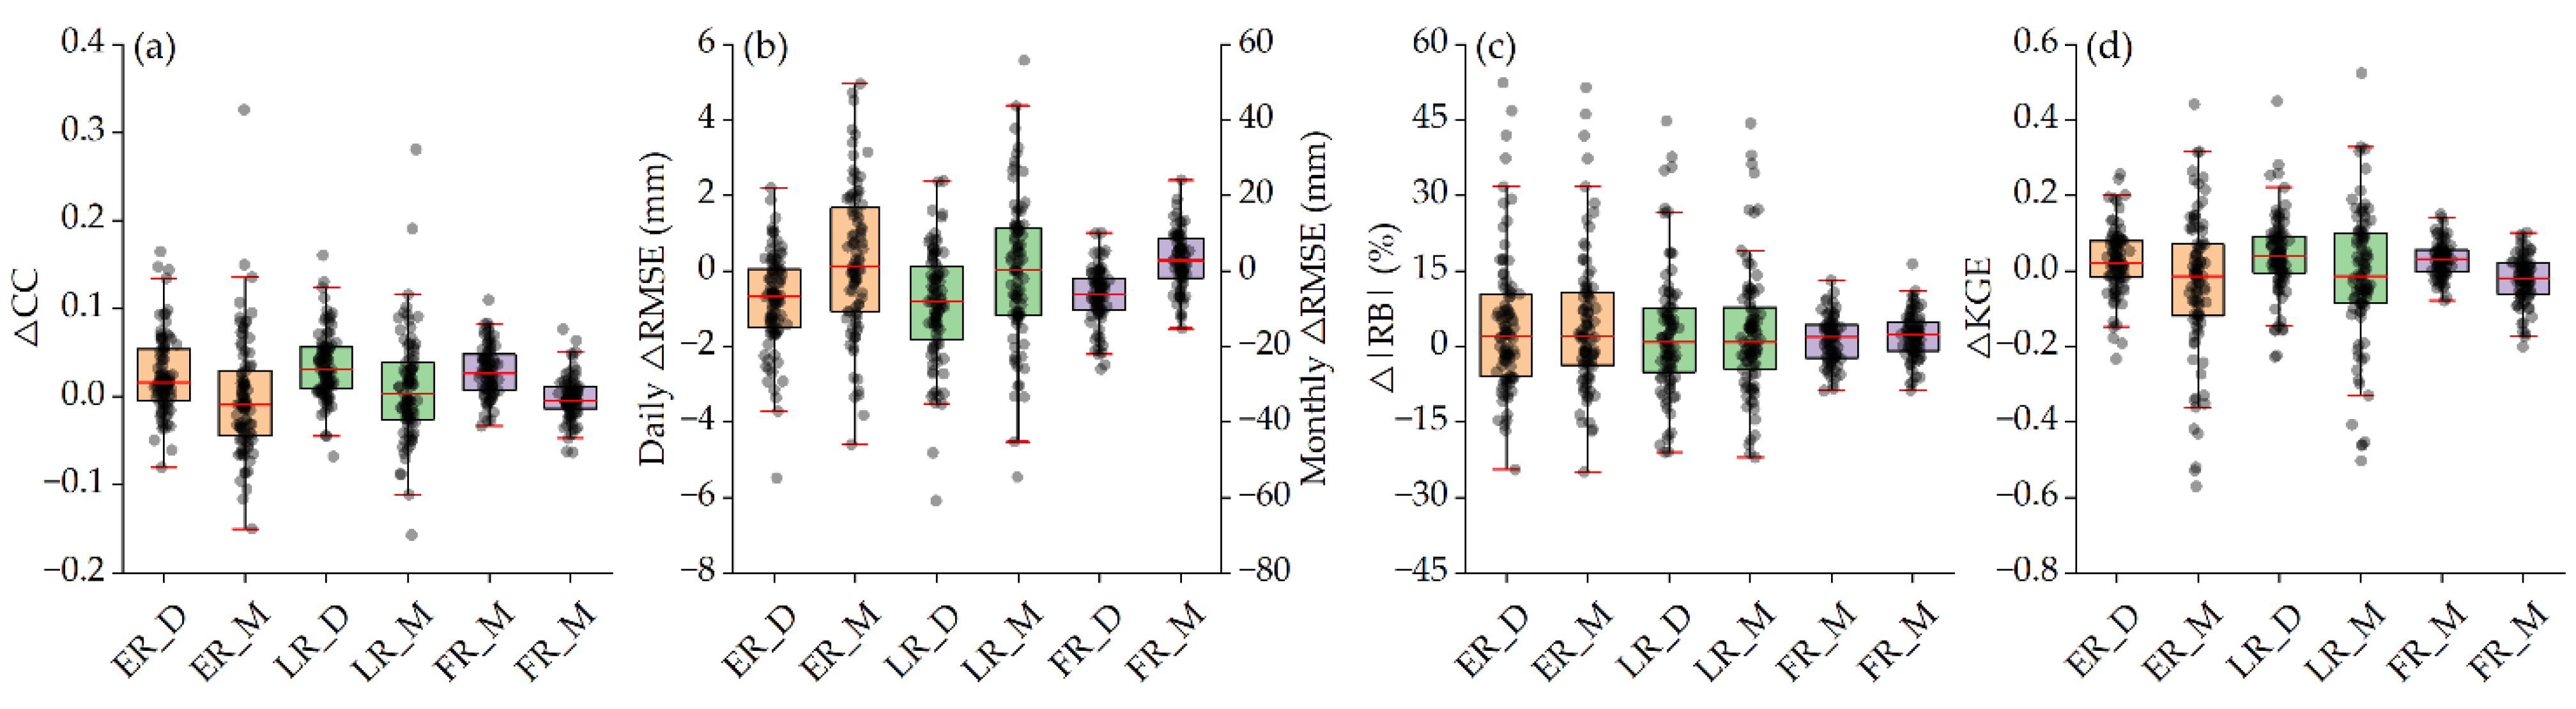
Spatial distribution maps (Figure 8) of the differences in various metrics between the two versions (V07 minus V06) reveal a prominent spatial heterogeneity in performance changes in V07 relative to V06. At the daily scale, most metrics exhibit a widespread improvement across the rugged mountainous terrain of northwest Guangxi, demonstrating notable advancements of the updated algorithm over complex topography. In contrast, the spatial extent of such improvements shrinks substantially at the monthly scale, and accumulated systematic errors severely degrade estimation accuracy across these complicated terrains. Boxplots of metric differences (Figure 9) further indicate that ΔCC, ΔRMSE and ΔKGE feature narrower boxes with fewer outliers for daily data, corresponding to more universal and spatially consistent performance gains. After temporal aggregation to monthly values, however, the boxes extend vertically with widened interquartile ranges and increased outliers, demonstrating amplified spatial heterogeneity in performance evolution at the monthly scale. Moreover, panels (c), (g), (k) and (o) in Figure 8 illustrate concentrated sharp rises in Δ|RB| for ER and LR over low-elevation zones in southwestern Guangxi, suggesting that the aggravated systematic overestimation of V07 is not only influenced by elevation but is also closely linked to local microclimatic characteristics.

3.3.1. Elevation Impacts

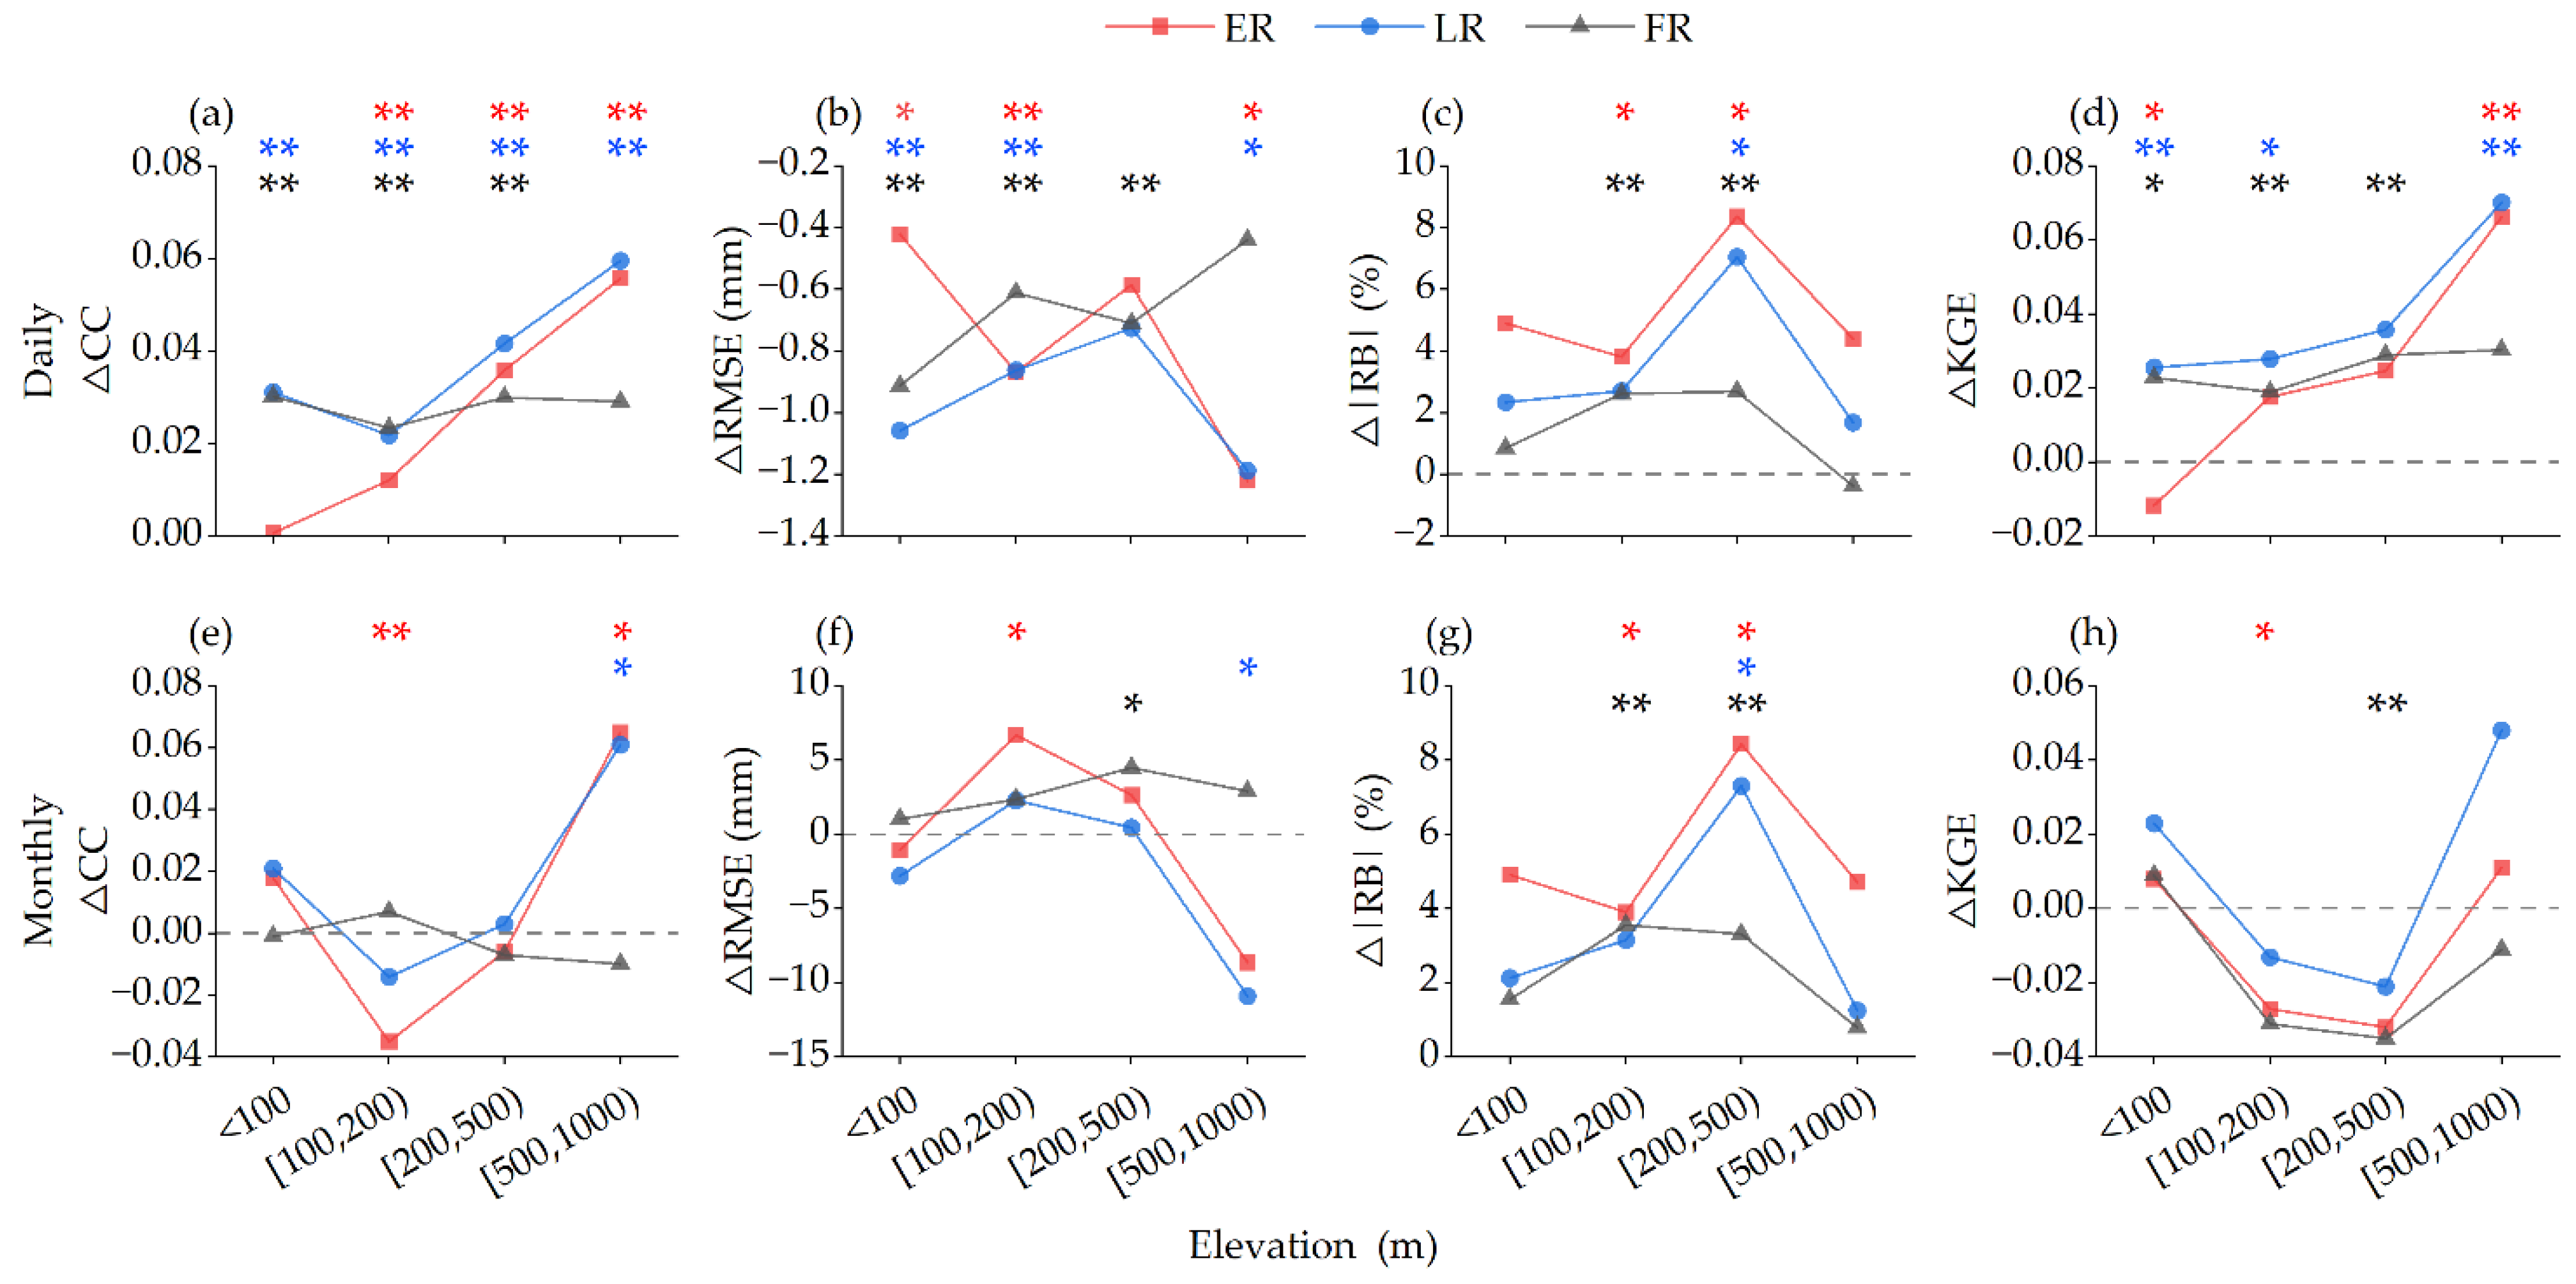
The variation patterns of metrics across elevation gradients (Figure 10) reveal that the performance evolution of V07 is sensitive to elevation, with distinct discrepancies existing in topographic responses between NRT products (ER, LR) and the final calibrated product (FR). For ER and LR, Δ|RB| (Figure 10c,g) exhibits prominent peaks within the elevation range of [200, 500 m) at both daily and monthly scales. This suggests that V07 introduces the most severe systematic overestimation in the hill-mountain transition zone, where the accumulated biases further cause the sharpest decline in KGE at the monthly scale (Figure 10h). As elevation increases to [500, 1000 m), the quantitative errors of NRT products decline substantially across both timescales, along with the highest ΔKGE values. These results demonstrate that V07 delivers substantial performance gains for ER and LR at relatively high elevations.
In contrast, FR shows mild metric fluctuations with elevation, reflecting the stable constraining effect of gauge-based calibration. However, its monthly ΔRMSE remains positive throughout all elevation gradients. For terrain above 100 m, ΔKGE is persistently negative, and no marked improvement is detected in the [500, 1000 m) elevation as seen in ER and LR. This implies that V07 calibration strategy cannot retain the algorithmic advantages of NRT products, and instead amplifies monthly scale error accumulation in high-elevation regions.

3.3.2. Effects of Mean Annual Precipitation Zones

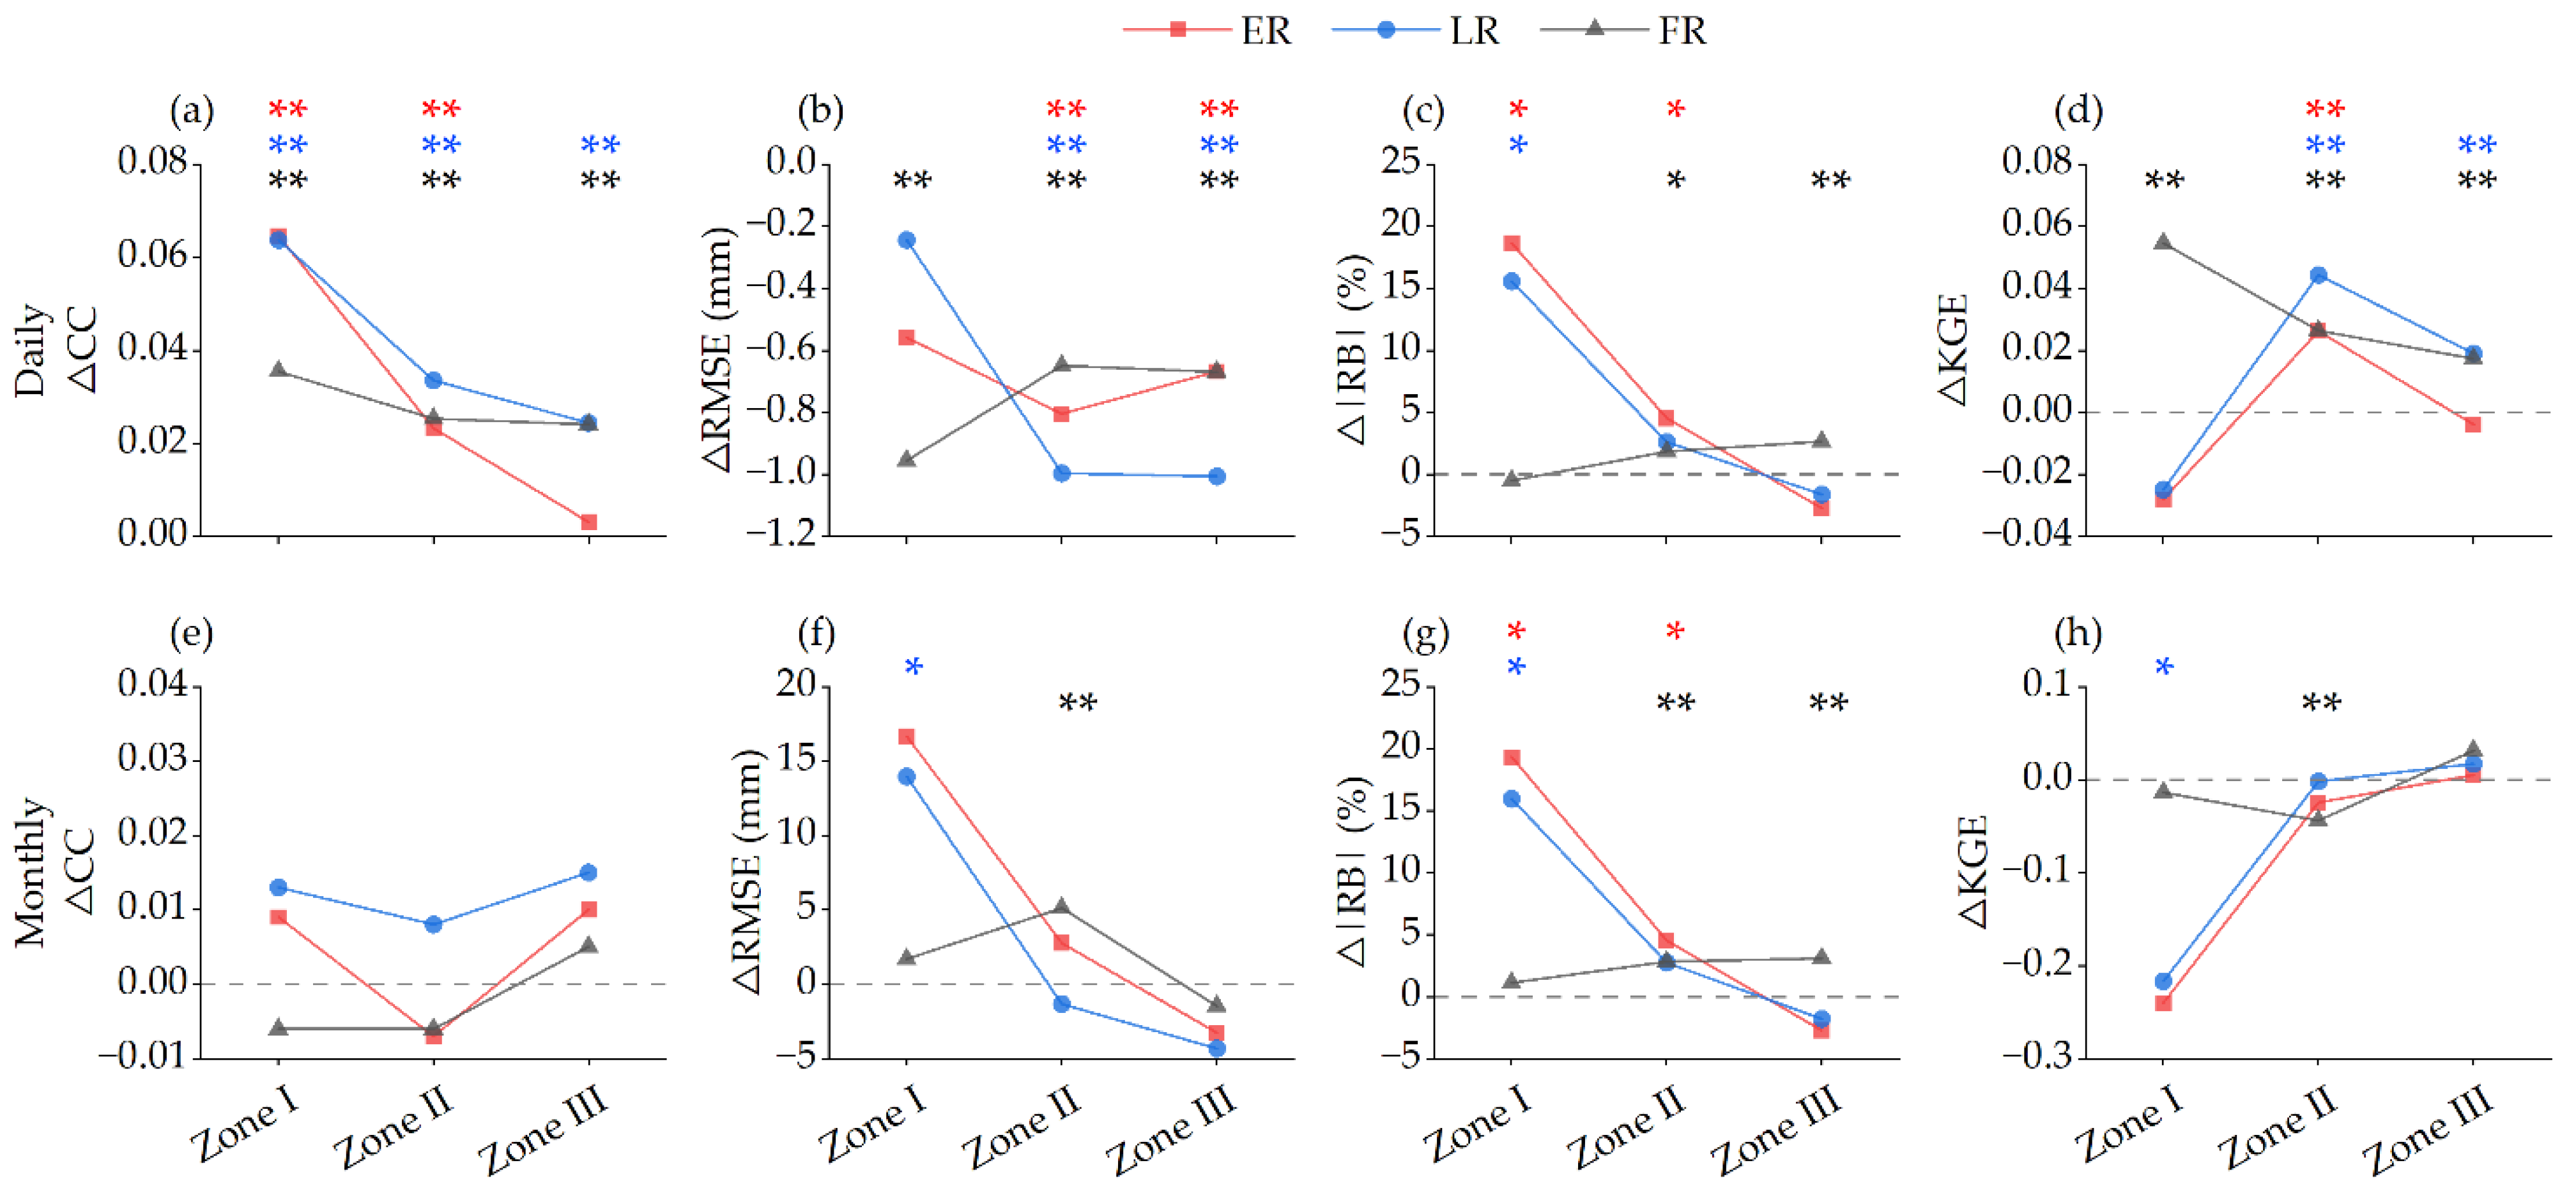
Beyond the topographic constraints imposed by complex terrain, the spatial evolution of V07 performance is heavily modulated by regional climatic characteristics (Figure 11). In regions with the lowest mean annual precipitation (Zone I), the NRT Runs (ER and LR) exhibit significant performance degradation. Specifically, the Δ|RB| of ER and LR increased sharply by 15–20% at both daily and monthly scales (Figure 11c,g). This excessive bias effectively offsets the gains achieved through improved CC, leading to a decline in KGE at daily scale (Figure 11d) and a severe drop exceeding 0.2 at monthly scale (Figure 11h). These findings indicate that V07 NRT algorithm introduces prominent positive biases in relatively arid environments. In contrast, errors of ER and LR are reduced in Zone III with the highest precipitation. At both temporal scales, ΔRMSE (Figure 11b,f) and Δ|RB| (Figure 11c,g) exhibit negative values, signaling a marked improvement in quantitative estimation accuracy compared to V06.
The response of FR to the precipitation gradient differs markedly from that of the NRT Runs. Performance metrics for FR fluctuate more gradually across the gradient, without the sharp surge of systematic bias observed in Zone I. This suggests that the gauge calibration effectively suppresses retrieval biases induced by climatic heterogeneity. Nevertheless, in Zone III where systematic biases (Δ|RB|) of ER and LR have been alleviated, FR still presents a notable aggravation of overestimation (Figure 11c,g). FR failed to inherit the precision enhancements achieved by the satellite-only retrieval algorithms in high rainfall zone, implying that the calibration scheme may lead to over correction in humid environments and thereby diminishing the efficacy of the accuracy optimization in the Final product.

3.3.3. Combined Effects of Elevation and Mean Annual Precipitation

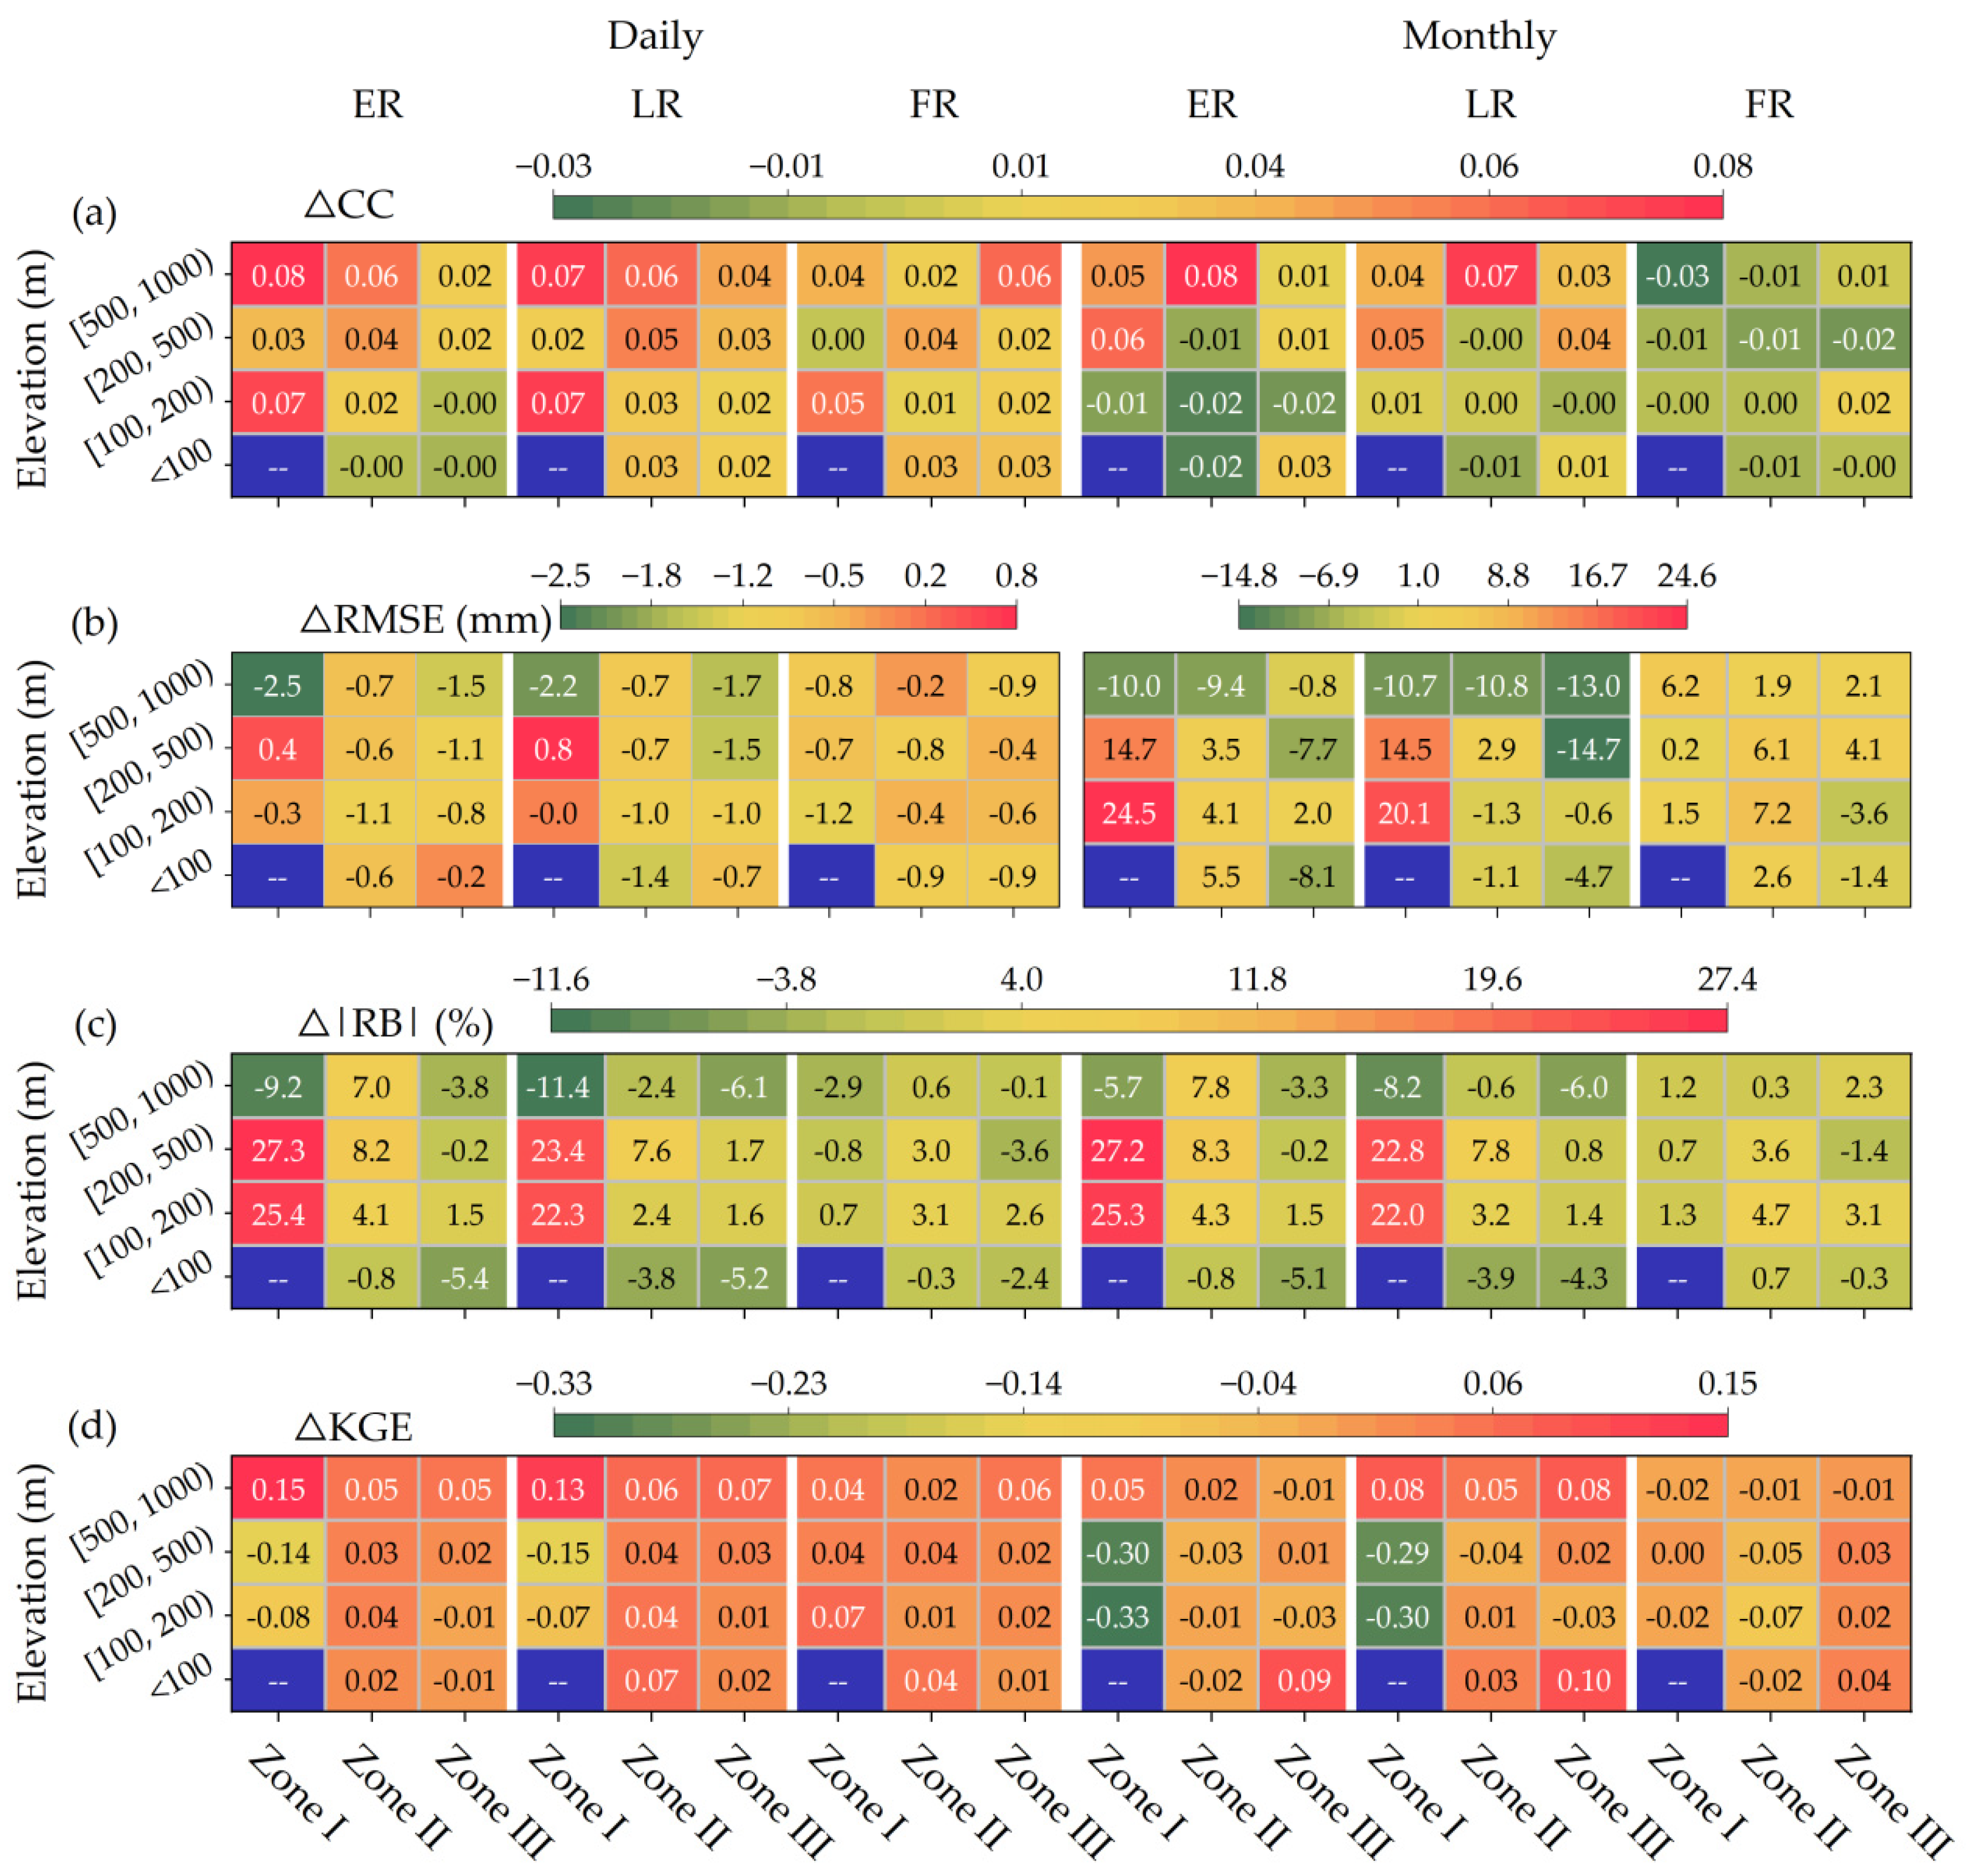
The interactive statistical analysis (Figure 12), derived by stratifying the study area based on both precipitation zones and elevation gradients, demonstrates that the multi-scale performance evolution of V07 is not a function of isolated environmental factors. Instead, it is profoundly governed by a synergistic climate-topography coupling mechanism. Specifically, the NRT Runs exhibit a marked error surge at the intersection of low-precipitation regions and mid-to-low elevation zones ([100, 500 m)). In these areas, Δ|RB| exceeds 22% at both daily and monthly scales, while the monthly ΔRMSE surpasses 14 mm, leading to a severe decline in KGE. These findings suggest that V07 algorithm introduces a significant systematic overestimation when processing precipitation in hilly to-mountainous transitions under arid backgrounds, with biases substantially exacerbated during temporal aggregation from daily to monthly scales. Conversely, the intersection of Zone I and high elevation regions ([500, 1000 m)) represents the most significant optimization. This specific zone exhibits the best performance metrics at the daily scale and maintains superior performance at the monthly scale, highlighting the efficacy of V07’s algorithmic improvements in high-altitude mountainous regions. In comparison, FR demonstrates relatively stable performance across all interactive zones. Although the gauge calibration successfully suppresses the degradation observed in the arid/mid-elevation regions, it fails to inherit the performance enhancements achieved by the satellite-only products in high-altitude arid regions.

3.4. Temporal Heterogeneity

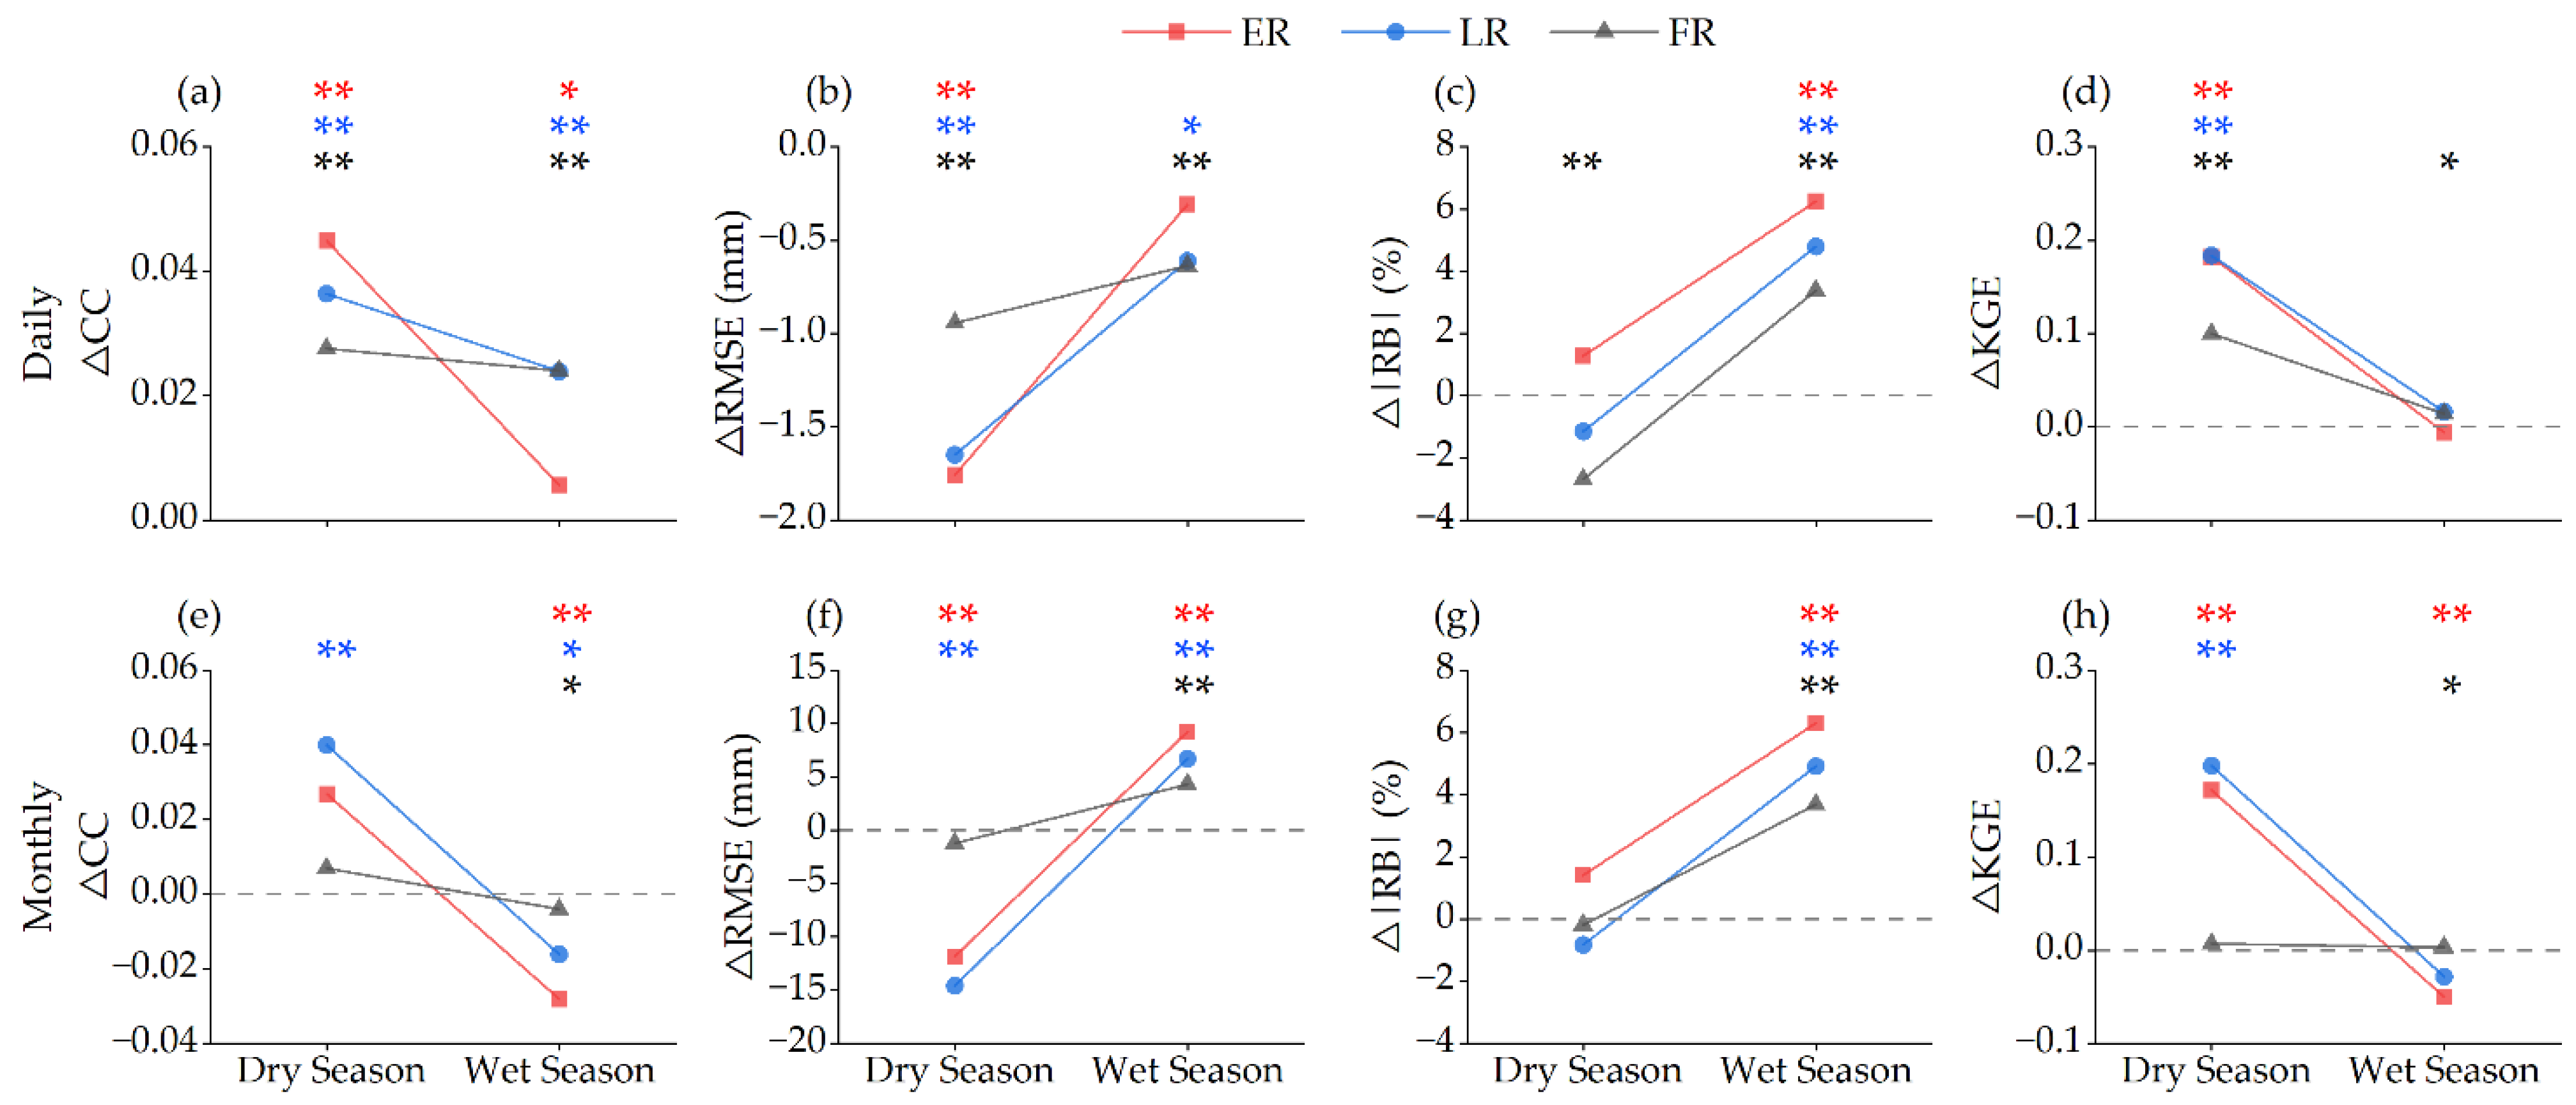
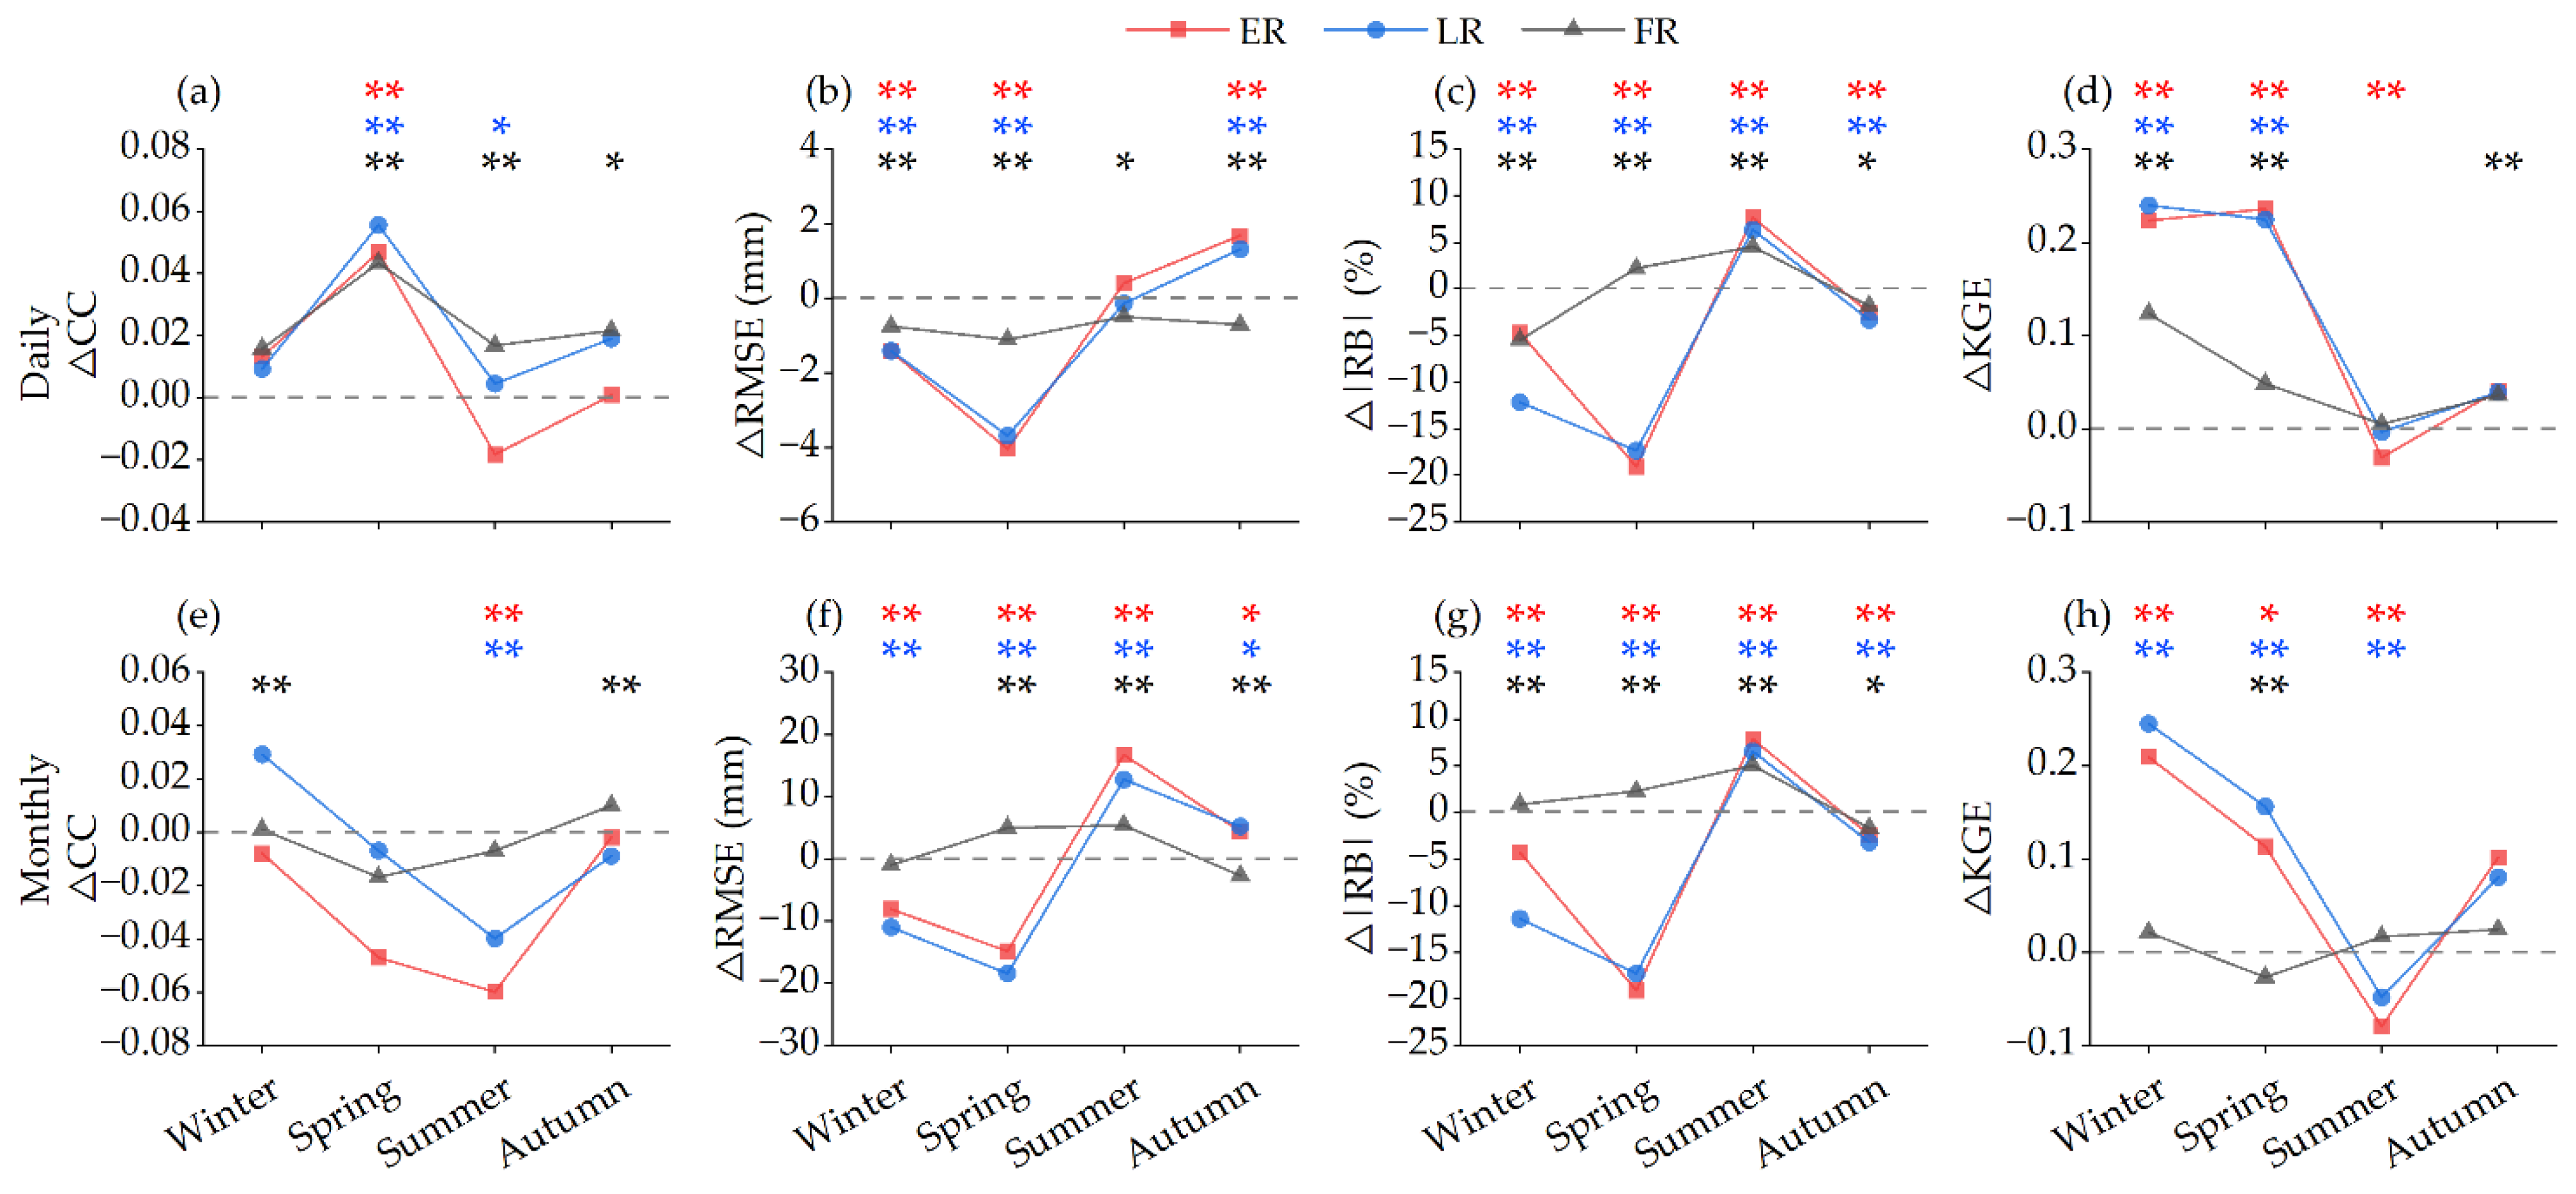
The performance evolution of V07 exhibits pronounced temporal heterogeneity across dry and wet seasons (Figure 13) as well as meteorological seasons (Figure 14). During the dry season, ER and LR demonstrate substantial improvements. Specifically, KGE increased by over 0.17 at both daily and monthly scales, accompanied by a significant convergence of error metrics with the RMSE decreased by more than 1.6 mm at daily scale and over 11 mm at monthly scale. Conversely, performance degrades during the wet season, which is primarily due to pronounced systematic overestimation. At the daily scale, although CC and RMSE show marginal optimization, the sharp increase in |RB| offsets these benefits, resulting in no significant improvement in KGE. Following temporal aggregation to monthly scale, all metrics for the wet season deteriorate substantially, indicating a severe performance degradation for the products.
The subdivision into meteorological seasons (Figure 14) further highlights this temporal contrast, particularly the stark divergence between spring and summer. In spring, typically dominated by stratiform clouds and frontal precipitation systems, Δ|RB| for ER and LR at both daily and monthly scales exhibits a substantial reduction of over 17%. Furthermore, the reduction in RMSE during this period is the most pronounced of the entire year, indicating a significant enhancement in quantitative accuracy. In sharp contrast, summer—characterized by frequent convective activities—witnesses a surge in error metrics. When aggregated to monthly scales, summer performance metrics deteriorate comprehensively, with |RB| increasing by over 6% and RMSE surging by more than 12 mm, revealing a severe systematic overestimation bias.
FR follows an evolutionary trajectory distinct from NRT counterparts. Across all seasonal groupings, the metrics of FR exhibit lower volatility. While the gauge-based calibration effectively suppresses the systematic overestimation observed during the wet season and summer, it also partially dampens the performance gains derived from satellite algorithm upgrades in the dry season and spring.

4. Discussion

4.1. Algorithmic Updates and Their Effects

Compared with IMERG V06, V07 achieves better spatiotemporal consistency at daily scale and exhibits enhanced capability for detecting moderate-to-heavy precipitation events. These findings are consistent with previous evaluations conducted across mainland China and North America [18,22], verifying the prominent improvements brought by the updated algorithm. Noticeable performance gains are particularly observed in LR, which highlights the pivotal role of the incorporated CCA. Nevertheless, the overall performance improvement is accompanied by a marked increase in systematic overestimation, a phenomenon similarly reported in Sichuan Province, China [26]. Despite V07 adopts multiple strategies to mitigate the prevalent overestimation present in V06, addressing this bias in complex environments remains a formidable challenge.
This problem can be attributed to the combined effects of multiple algorithmic mechanisms. First, the static background constraints imposed by CCA on NRT runs may cause over correction when confronted with local extreme climatic fluctuations. Especially in regions with sparse calibration samples, this mechanism may generate anomalously high systematic precipitation patches, leading to overestimation [17]. Second, the suboptimal extraction of microwave scattering features over complex mountainous terrain or under monsoonal flows results in residual regime-dependent biases in GPROF retrievals [17]. These biases may be further amplified by the SHARPEN extreme distribution reconstruction procedure, ultimately leading to severe systematic overestimation in targeted areas.

4.2. Temporal-Scale Dependency and Error Propagation

A key finding of this study is that the performance evolution of V07 exhibits pronounced temporal scale dependency, as the enhancements observed at daily scale do not persist at monthly scale. At the daily scale, while V07 successfully constrains the overall dispersion, the proportion of systematic error within its error structure is consistently higher than that of V06 (Table 6). Upon temporal aggregation, this high proportion of systematic positive bias—unlike random error, which tends to be neutralized through smoothing—accumulates and amplifies as the integration window expands. Importantly, although the systematic error proportion at the monthly scale is lower for V07 than for V06, the magnitude of the accumulated positive bias in V07 is significantly larger. This leads to a sharp inflation of the total bias at the monthly scale, ultimately resulting in a widespread degradation of KGE. This error propagation mechanism clarifies that the dramatic performance decline of the Final Run upon transitioning to the monthly scale is driven by the severe magnitude of accumulated positive bias, rather than its relative systematic error fraction.
In addition, to mitigate the overestimation of winter land precipitation in V06, V07 removes the GPCP monthly climatology calibration of the CORRA algorithm over land [17,47]. Our results verify that this revision achieves the intended effects (Figure 14). However, without this robust monthly reference constraint, the overestimation generated over complex underlying surfaces may no longer be corrected. Such biases are further aggravated through temporal aggregation, which deteriorates the performance of V07 for monthly precipitation estimation. While V07 shows greater strengths in capturing the patterns of short-duration precipitation events, it presents inherent structural defects in estimating long-duration precipitation amounts.

4.3. Spatial Heterogeneity Linked to Climatic/Terrain Drivers

The pronounced spatial heterogeneity in the performance variations in V07 essentially reflects how the core GPROF V07 algorithm responds to underlying surfaces and physical precipitation processes. In high elevation mountainous areas of Guangxi, V07 yields considerable error reduction and improved performance. This benefit may be associated with the refined land surface classification scheme adopted by GPROF V07. Specifically, the introduction of mountain specific surface types and orographic enhancement sub-classes enables the algorithm to more accurately extract scattering signals from ice-phase hydrometeors in cold alpine environments [17].
In contrast, errors rise sharply at the transitional zones between arid regions and low-to-mid elevation areas. In these zones, relatively dry air causes falling hydrometeors to evaporate readily. As a result, cloud signals captured by microwave exceed the actual surface precipitation. Such dynamic losses may not be fully eliminated during GPROF retrieval. Meanwhile, the SHARPEN algorithm could further misclassifies these spurious microwave signals as higher precipitation magnitudes, eventually triggering concentrated systematic overestimation across low-to-mid elevation areas under arid conditions. This finding is consistent with the conclusions reported by Guo et al. [27] for arid and semi-arid regions across China, and further explains the similar overestimation detected over the topographically and climatically complex Sichuan Basin [26].

4.4. Temporal Heterogeneity Driven by Precipitation Type Transition

This study reveals that V07 achieves remarkable performance improvements in dry season and spring, whereas systematic overestimation deteriorates notably in wet season and summer. Such seasonal heterogeneity indicates varying adaptability of the updated algorithm to distinct precipitation systems. Precipitation in winter and spring is predominantly generated by stratiform clouds and frontal activities, which is generally continuous, steady and low in intensity with a relatively flat histogram distribution. Accordingly, the amplification effect of extreme values by the SHARPEN algorithm remains weak. Meanwhile, these stable precipitation characteristics align well with the static historical climatological background provided by CCA, which may partly explain the substantial reduction in systematic errors.
In contrast, intense convection and thunderstorms prevail in summer, and the associated extreme precipitation tends to induce asymmetric bias amplification in the SHARPEN algorithm [17]. More importantly, summer precipitation in monsoon regions features abrupt occurrence and strong interannual variability. When observed precipitation deviates substantially from climatological means or anomalous events occur, the constraints based on historical averages adopted by CCA may be readily exceeded, leading to over-correction or under-correction and subsequent severe systematic biases. The incompatibility between static algorithm frameworks and highly variable, intense monsoon convection may account for the degraded overall performance of V07 products throughout summer and the entire wet season.

4.5. Implications for Applications and Algorithm Optimization Suggestions

The IMERG V07 Late Run exhibits strong capability in capturing precipitation dynamics at the daily scale, making it the preferred product for flood warning and real-time precipitation monitoring across Guangxi. Nevertheless, the inherent systematic overestimation of V07 may lead to overly optimistic assessments of regional total water resources. For applications relying on accumulated precipitation, such as agricultural irrigation scheduling and drought monitoring, physically based correction of systematic biases is highly recommended.
Regarding the cross-scale error propagation and spatiotemporal heterogeneity identified in this study, we suggest integrating frequently updated soil moisture [48] or real-time meteorological drought indices as covariates into the CCA module to develop dynamically constrained climatology calibration (Dynamic CCA). This approach is expected to mitigate systematic overestimation in arid areas. Given that large systematic errors at the daily scale constitute the primary cause of performance degradation at the monthly scale, a volume conservation penalty is proposed for the morphing interpolation procedure. This constraint ensures that the interpolation process only redistributes precipitation intensity spatially without increasing the total water volume of convective systems, thereby fundamentally blocking the accumulation and propagation of systematic overestimation from daily to monthly scales.

4.6. Limitations and Uncertainties

Although a rigorous validation framework was adopted in this study, the research is constrained by observational data and thus subject to certain limitations and uncertainties. Meteorological stations are sparsely distributed across the study area, especially in regions above 500 m elevation. The point-to-pixel matching approach may introduce errors due to the limited spatial representativeness of samples. In addition, the study period is restricted to 2014–2020, which is insufficient to evaluate the algorithm stability under long-term climatic conditions. Further analysis of the coupling mechanisms between topographic and climatic driving factors also requires datasets with higher spatiotemporal resolution. Despite these shortcomings, the revealed performance evolution patterns of V07 provide reliable references for improving its applications in complex monsoon regions.

5. Conclusions

This study uses observational data from 91 national meteorological stations across Guangxi, China for the period 2014–2020 to systematically evaluate the performance differences between GPM IMERG V07 and V06 (Early, Late and Final Runs) at daily and monthly scales over this typical mountainous monsoon region. We particularly quantify the error propagation during temporal aggregation and the modulating effects of coupled climate-terrain interactions on retrieval accuracy. The main conclusions are summarized as follows:
(1)
V07, especially the Late Run, outperforms V06 in capturing daily precipitation dynamics, yet it features a higher fraction of systematic positive biases in its error structure. Such substantial systematic overestimation is amplified during temporal aggregation to the monthly scale, leading to widespread degradation of overall performance at longer timescales, and the reliability of Final Run is impaired most severely at the monthly scale.
(2)
The retrieval accuracy of V07 is strongly controlled by underlying surface conditions. NRT products exhibit a sharp rise in systematic overestimation in transitional zones combining arid areas (mean annual precipitation ≤ 1300 mm) and low-to-mid [100, 500 m) elevations. Gauge-based calibration for the Final Run mitigates performance degradation in arid regions, but weakens accuracy improvements in wet areas and fails to retain the performance gains of NRT products in high elevation.
(3)
The incorporation of CCA effectively improves the retrieval accuracy of NRT products in the dry season (winter and spring). In the wet season and summer with frequent intense convection, however, extreme precipitation easily breaks the static constraints of CCA derived from historical climatology, resulting in a dramatic increase in systematic positive biases. The Final Run greatly reduces systematic overestimation in the dry season but compromises the optimization effects achieved in the wet season.

Author Contributions

Conceptualization, S.Y.; methodology, S.Y.; software, Q.H.; validation, S.Y., Y.C., G.X. and Q.H.; acquisition and processing of data, Y.C.; writing—original draft preparation, S.Y.; writing—review and editing, Y.C.; visualization, G.X. All authors have read and agreed to the published version of the manuscript.

Funding

This research was funded by the National Natural Science Foundation of China (42465010), the Science and Technology Major Program of Guangxi Science and Technology Department (AA22036002) and the Guangxi Academy of Agricultural Sciences Achievement Transformation Project (NCZ202612).

Data Availability Statement

The raw data supporting the conclusions of this article will be made available by the authors upon request.

Acknowledgments

The authors would like to extend their sincere gratitude to the anonymous reviewers and editorial staff for their valuable comments and suggestions, which greatly improved the quality of this paper. We are also deeply thankful to the Guangxi Meteorological Bureau for providing the ground validation data and to the National Aeronautics and Space Administration (NASA) for providing the IMERG precipitation estimates (versions V06 and V07), which were fundamental to the success of this study.

Conflicts of Interest

The authors declare no conflicts of interest.

References

  1. Guo, H.; Chen, S.; Bao, A.; Behrangi, A.; Hong, Y.; Ndayisaba, F.; Hu, J.; Stepanian, P.M. Early Assessment of Integrated Multi-Satellite Retrievals for Global Precipitation Measurement over China. Atmos. Res. 2016, 176–177, 121–133. [Google Scholar] [CrossRef] [Scilit]
  2. Zhou, Z.; Guo, B.; Xing, W.; Zhou, J.; Xu, F.; Xu, Y. Comprehensive Evaluation of Latest GPM Era IMERG and GSMaP Precipitation Products over Mainland China. Atmos. Res. 2020, 246, 105132. [Google Scholar] [CrossRef] [Scilit]
  3. Nepal, B.; Shrestha, D.; Sharma, S.; Shrestha, M.S.; Aryal, D.; Shrestha, N. Assessment of GPM-Era Satellite Products’ (IMERG and GSMaP) Ability to Detect Precipitation Extremes over Mountainous Country Nepal. Atmosphere 2021, 12, 254. [Google Scholar] [CrossRef] [Scilit]
  4. Yu, L.; Ma, L.; Li, H.; Zhang, Y.; Kong, F.; Yang, Y. Assessment of High-Resolution Satellite Rainfall Products over a Gradually Elevating Mountainous Terrain Based on a High-Density Rain Gauge Network. Int. J. Remote Sens. 2020, 41, 5620–5644. [Google Scholar] [CrossRef] [Scilit]
  5. Tang, X.; Li, H.; Qin, G.; Huang, Y.; Qi, Y. Evaluation of Satellite-Based Precipitation Products over Complex Topography in Mountainous Southwestern China. Remote Sens. 2023, 15, 473. [Google Scholar] [CrossRef] [Scilit]
  6. Li, L.; Chen, X.; Ma, Y.; Zhao, W.; Zuo, H.; Liu, Y.; Cao, D.; Xu, X. Implications for Validation of IMERG Satellite Precipitation in a Complex Mountainous Region. Remote Sens. 2023, 15, 4380. [Google Scholar] [CrossRef] [Scilit]
  7. Hou, A.Y.; Kakar, R.K.; Neeck, S.; Azarbarzin, A.A.; Kummerow, C.D.; Kojima, M.; Oki, R.; Nakamura, K.; Iguchi, T. The Global Precipitation Measurement Mission. Bull. Am. Meteorol. Soc. 2014, 95, 701–722. [Google Scholar] [CrossRef] [Scilit]
  8. Skofronick-Jackson, G.; Petersen, W.A.; Berg, W.; Kidd, C.; Stocker, E.F.; Kirschbaum, D.B.; Kakar, R.; Braun, S.A.; Huffman, G.J.; Iguchi, T.; et al. The Global Precipitation Measurement (GPM) Mission for Science and Society. Bull. Am. Meteorol. Soc. 2017, 98, 1679–1695. [Google Scholar] [CrossRef] [Scilit] [PubMed]
  9. Jiang, L.; Bauer-Gottwein, P. How Do GPM IMERG Precipitation Estimates Perform as Hydrological Model Forcing? Evaluation for 300 Catchments across Mainland China. J. Hydrol. 2019, 572, 486–500. [Google Scholar] [CrossRef] [Scilit]
  10. Ghimire, U.; Akhtar, T.; Shrestha, N.K.; Paul, P.K.; Schürz, C.; Srinivasan, R.; Daggupati, P. A Long-Term Global Comparison of IMERG and CFSR with Surface Precipitation Stations. Water Resour. Manag. 2022, 36, 5695–5709. [Google Scholar] [CrossRef] [Scilit]
  11. Reichle, R.H.; Liu, Q.; Ardizzone, J.V.; Crow, W.T.; De Lannoy, G.J.M.; Kimball, J.S.; Koster, R.D. IMERG Precipitation Improves the SMAP Level-4 Soil Moisture Product. J. Hydrometeorol. 2023, 24, 1699–1723. [Google Scholar] [CrossRef] [Scilit]
  12. Ekpetere, K.O.; Mehta, A.V.; Coll, J.M.; Liang, C.; Onochie, S.O.; Ekpetere, M.C. Estimating Rainfall Anomalies with IMERG Satellite Data: Access via the IPE Web Application. Remote Sens. 2024, 16, 4137. [Google Scholar] [CrossRef] [Scilit]
  13. Leivadiotis, E.; Psilovikos, A. A Performance Evaluation and Statistical Analysis of IMERG Precipitation Products During Medicane Daniel (September 2023) in the Thessaly Plain, Greece. Water 2025, 17, 2401. [Google Scholar] [CrossRef] [Scilit]
  14. Mohammed, S.; Nasr, A.; Mahmoud, M. Comprehensive Assessment of GPM-IMERG and ERA5 Precipitation Products Across Ireland. Remote Sens. 2025, 17, 3154. [Google Scholar] [CrossRef] [Scilit]
  15. Huffman, G.J.; Bolvin, D.T.; Braithwaite, D.; Hsu, K.; Joyce, R.; Kidd, C.; Nelkin, E.; Sorooshian, S.; Tan, J.; Xie, P. IMERG Multi-Satellite Products Across Two Decades. Available online: https://ntrs.nasa.gov/citations/20205001707 (accessed on 12 December 2025).
  16. Huffman, G.J.; Bolvin, D.T.; Braithwaite, D.; Hsu, K.; Joyce, R.; Kidd, C.; Nelkin, E.J.; Sorooshian, S.; Tan, J.; Xie, P. A Quick Summary of IMERG Versions and Features. Available online: https://ntrs.nasa.gov/citations/20180004086 (accessed on 12 December 2025).
  17. IMERG V07 Release Notes. NASA Global Precipitation Measurement Mission. Available online: https://gpm.nasa.gov/resources/documents/imerg-v07-release-notes (accessed on 10 December 2025).
  18. Wang, Y.; Li, Z.; Gao, L.; Zhong, Y.; Peng, X. Comparison of GPM IMERG Version 06 Final Run Products and Its Latest Version 07 Precipitation Products across Scales: Similarities, Differences and Improvements. Remote Sens. 2023, 15, 5622. [Google Scholar] [CrossRef] [Scilit]
  19. Stanley, T.A.; Sutton, J.R.P.; Vershel, R.S.; Amatya, P.M. Better Satellite Precipitation Algorithms Slightly Improved Landslide Hazard Assessment. J. Appl. Meteorol. Climatol. 2025, 64, 1379–1394. [Google Scholar] [CrossRef] [Scilit]
  20. Xiong, J.; Tang, G.; Yang, Y. Continental Evaluation of GPM IMERG V07B Precipitation on a Sub-Daily Scale. Remote Sens. Environ. 2025, 321, 114690. [Google Scholar] [CrossRef] [Scilit]
  21. Zhu, S.; Li, Z.; Chen, M.; Wen, Y.; Gao, S.; Zhang, J.; Wang, J.; Nan, Y.; Ferraro, S.C.; Tsoodle, T.E.; et al. How Has the Latest IMERG V07 Improved the Precipitation Estimates and Hydrologic Utility over CONUS against IMERG V06? J. Hydrol. 2024, 645, 132257. [Google Scholar] [CrossRef] [Scilit]
  22. Bartuska, E.; Beighley, R.E.; Pieper, K.J.; Jones, C.N. Quantifying Improvements in Derived Storm Events from Version 07 of GPM IMERG Early, Late, and Final Data Products over North Carolina. Remote Sens. 2025, 17, 2567. [Google Scholar] [CrossRef] [Scilit]
  23. Rozante, J.R.; Rozante, G. IMERG V07B and V06B: A Comparative Study of Precipitation Estimates Across South America with a Detailed Evaluation of Brazilian Rainfall Patterns. Remote Sens. 2024, 16, 4722. [Google Scholar] [CrossRef] [Scilit]
  24. Batista, F.F.; Rodrigues, D.T.; Santos e Silva, C.M.; Andrade, L.D.M.B.; Mutti, P.R.; Potes, M.; Costa, M.J. Performance Assessment of IMERG V07 Versus V06 for Precipitation Estimation in the Parnaíba River Basin. Remote Sens. 2025, 17, 3613. [Google Scholar] [CrossRef] [Scilit]
  25. Meng, H.; Zhao, T. Evaluation of the Hydrological Utility of the GPM IMERG Satellite Precipitation Products. Atmos. Res. 2025, 322, 108139. [Google Scholar] [CrossRef] [Scilit]
  26. Li, X.; Liu, J.; Cui, W.; Wang, H.; Liao, A.; Wang, Y.; Gao, W. Comparative Evaluation of GPM IMERG V07 Early, Late and Final Run Products Compared to IMERG V06 in Sichuan Province, China. Theor. Appl. Climatol. 2025, 156, 354. [Google Scholar] [CrossRef] [Scilit]
  27. Guo, H.; Tian, Y.; Li, J.; Guo, C.; Meng, X.; Wang, W.; De Maeyer, P. Has IMERG_V07 Improved the Precision of Precipitation Retrieval in Mainland China Compared to IMERG_V06? Remote Sens. 2024, 16, 2671. [Google Scholar] [CrossRef] [Scilit]
  28. Salami, A.A. Optimising Rainfall Prediction in Nigeria: Integrating Ground-Based, Satellite, and Climate Model Data. Earth Syst. Environ. 2025, 10, 5007–5026. [Google Scholar] [CrossRef] [Scilit]
  29. Yousefi Sohi, H.; Farmani, M.A.; Behrangi, A. How Do IMERG V07, IMERG V06, and ERA5 Precipitation Products Perform over Snow–Ice-Free and Snow–Ice-Covered Surfaces at a Range of Near-Surface Temperatures? J. Hydrometeorol. 2025, 26, 837–855. [Google Scholar] [CrossRef] [Scilit]
  30. Ramadhan, R.; Marzuki, M.; Suryanto, W.; Sholihun, S.; Yusnaini, H.; Muharsyah, R. Validating IMERG Data for Diurnal Rainfall Analysis across the Indonesian Maritime Continent Using Gauge Observations. Remote Sens. Appl. Soc. Environ. 2024, 34, 101186. [Google Scholar] [CrossRef] [Scilit]
  31. Chen, X.; Xu, X.; Zhang, Q.; Liu, Y.; Chen, D.; Ma, Y. Reduction of the GPM IMERG Final Run Underestimation in the Eastern Himalaya. J. Hydrometeorol. 2025, 26, 445–458. [Google Scholar] [CrossRef] [Scilit]
  32. Li, R.; Guilloteau, C.; Kirstetter, P.; Foufoula-Georgiou, E. A New Event-Based Error Decomposition Scheme for Satellite Precipitation Products. Geophys. Res. Lett. 2023, 50, e2023GL105343. [Google Scholar] [CrossRef] [Scilit]
  33. Arshad, M.; Ma, X.; Yin, J.; Ullah, W.; Ali, G.; Ullah, S.; Liu, M.; Shahzaman, M.; Ullah, I. Evaluation of GPM-IMERG and TRMM-3B42 Precipitation Products over Pakistan. Atmos. Res. 2021, 249, 105341. [Google Scholar] [CrossRef] [Scilit]
  34. Li, S.; Shan, J. Adaptive Geometric Interval Classifier. ISPRS Int. J. Geo-Inf. 2022, 11, 430. [Google Scholar] [CrossRef] [Scilit]
  35. Keikhosravi-Kiany, M.S.; Balling, R.C. Evaluation of GPM IMERG Early, Late, and Final Run in Representing Extreme Rainfall Indices in Southwestern Iran. Remote Sens. 2024, 16, 2779. [Google Scholar] [CrossRef] [Scilit]
  36. Gao, R.; Li, L.; Wang, Y.; Li, W.; Yun, Z.; Gai, Y. Improvements and Limitations of the Latest Version 8 of GSMaP Compared with Its Former Version 7 and IMERG V06 at Multiple Spatio-Temporal Scales in Mainland China. Atmos. Res. 2024, 308, 107517. [Google Scholar] [CrossRef] [Scilit]
  37. Lei, H.; Zhao, H.; Ao, T. Ground Validation and Error Decomposition for Six State-of-the-Art Satellite Precipitation Products over Mainland China. Atmos. Res. 2022, 269, 106017. [Google Scholar] [CrossRef] [Scilit]
  38. Hu, J.; Miao, C.; Su, J.; Zhang, Q.; Gou, J.; Sun, Q. An Upgraded High-Precision Gridded Precipitation Dataset for the Chinese Mainland Considering Spatial Autocorrelation and Covariates. Earth Syst. Sci. Data 2025, 17, 3987–4004. [Google Scholar] [CrossRef] [Scilit]
  39. Gharnouki, I.; Aouissi, J.; Benabdallah, S.; Tramblay, Y. Assessing the Variability of Satellite and Reanalysis Rainfall Products over a Semiarid Catchment in Tunisia. Acta Geophys. 2024, 72, 1257–1273. [Google Scholar] [CrossRef] [Scilit]
  40. Xie, W.; Yi, S.; Leng, C.; Xia, D.; Li, M.; Zhong, Z.; Ye, J. The Evaluation of IMERG and ERA5-Land Daily Precipitation over China with Considering the Influence of Gauge Data Bias. Sci. Rep. 2022, 12, 8085. [Google Scholar] [CrossRef] [Scilit] [PubMed]
  41. Merino, A.; García-Ortega, E.; Navarro, A.; Fernández-González, S.; Tapiador, F.J.; Sánchez, J.L. Evaluation of Gridded Rain-gauge-based Precipitation Datasets: Impact of Station Density, Spatial Resolution, Altitude Gradient and Climate. Int. J. Climatol. 2021, 41, 3027–3043. [Google Scholar] [CrossRef] [Scilit]
  42. Xin, Y.; Yang, Y.; Chen, X.; Yue, X.; Liu, Y.; Yin, C. Evaluation of IMERG and ERA5 Precipitation Products over the Mongolian Plateau. Sci. Rep. 2022, 12, 21776. [Google Scholar] [CrossRef] [Scilit] [PubMed]
  43. Achite, M.; Bazrafshan, O.; Pakdaman, Z.; Wałęga, A.; Pourhaghverdi, F.; Caloiero, T. Uncertainty Analysis of SPI and SRI Calculation Using Bootstrap in the Mediterranean Regions of Algeria. Nat. Hazards 2024, 120, 11031–11061. [Google Scholar] [CrossRef] [Scilit]
  44. Ibrahim, M.N. Assessment of the Uncertainty Associated with Statistical Modeling of Precipitation Extremes for Hydrologic Engineering Applications in Amman, Jordan. Sustainability 2022, 14, 17052. [Google Scholar] [CrossRef] [Scilit]
  45. Hamill, T.M. Hypothesis Tests for Evaluating Numerical Precipitation Forecasts. Weather Forecast. 1999, 14, 155–167. [Google Scholar] [CrossRef] [Scilit]
  46. Morsy, M.; Scholten, T.; Michaelides, S.; Borg, E.; Sherief, Y.; Dietrich, P. Comparative Analysis of TMPA and IMERG Precipitation Datasets in the Arid Environment of El-Qaa Plain, Sinai. Remote Sens. 2021, 13, 588. [Google Scholar] [CrossRef] [Scilit]
  47. Wang, J.; Wolff, D.B.; Tan, J.; Huffman, G.J. Understanding Overland Satellite-Based Precipitation Errors in IMERG Products as a Function of Input Sources. J. Hydrometeorol. 2025, 26, 1219–1235. [Google Scholar] [CrossRef] [Scilit]
  48. Massari, C.; Brocca, L.; Pellarin, T.; Abramowitz, G.; Filippucci, P.; Ciabatta, L.; Maggioni, V.; Kerr, Y.; Fernandez Prieto, D. A Daily 25 Km Short-Latency Rainfall Product for Data-Scarce Regions Based on the Integration of the Global Precipitation Measurement Mission Rainfall and Multiple-Satellite Soil Moisture Products. Hydrol. Earth Syst. Sci. 2020, 24, 2687–2710. [Google Scholar] [CrossRef] [Scilit]
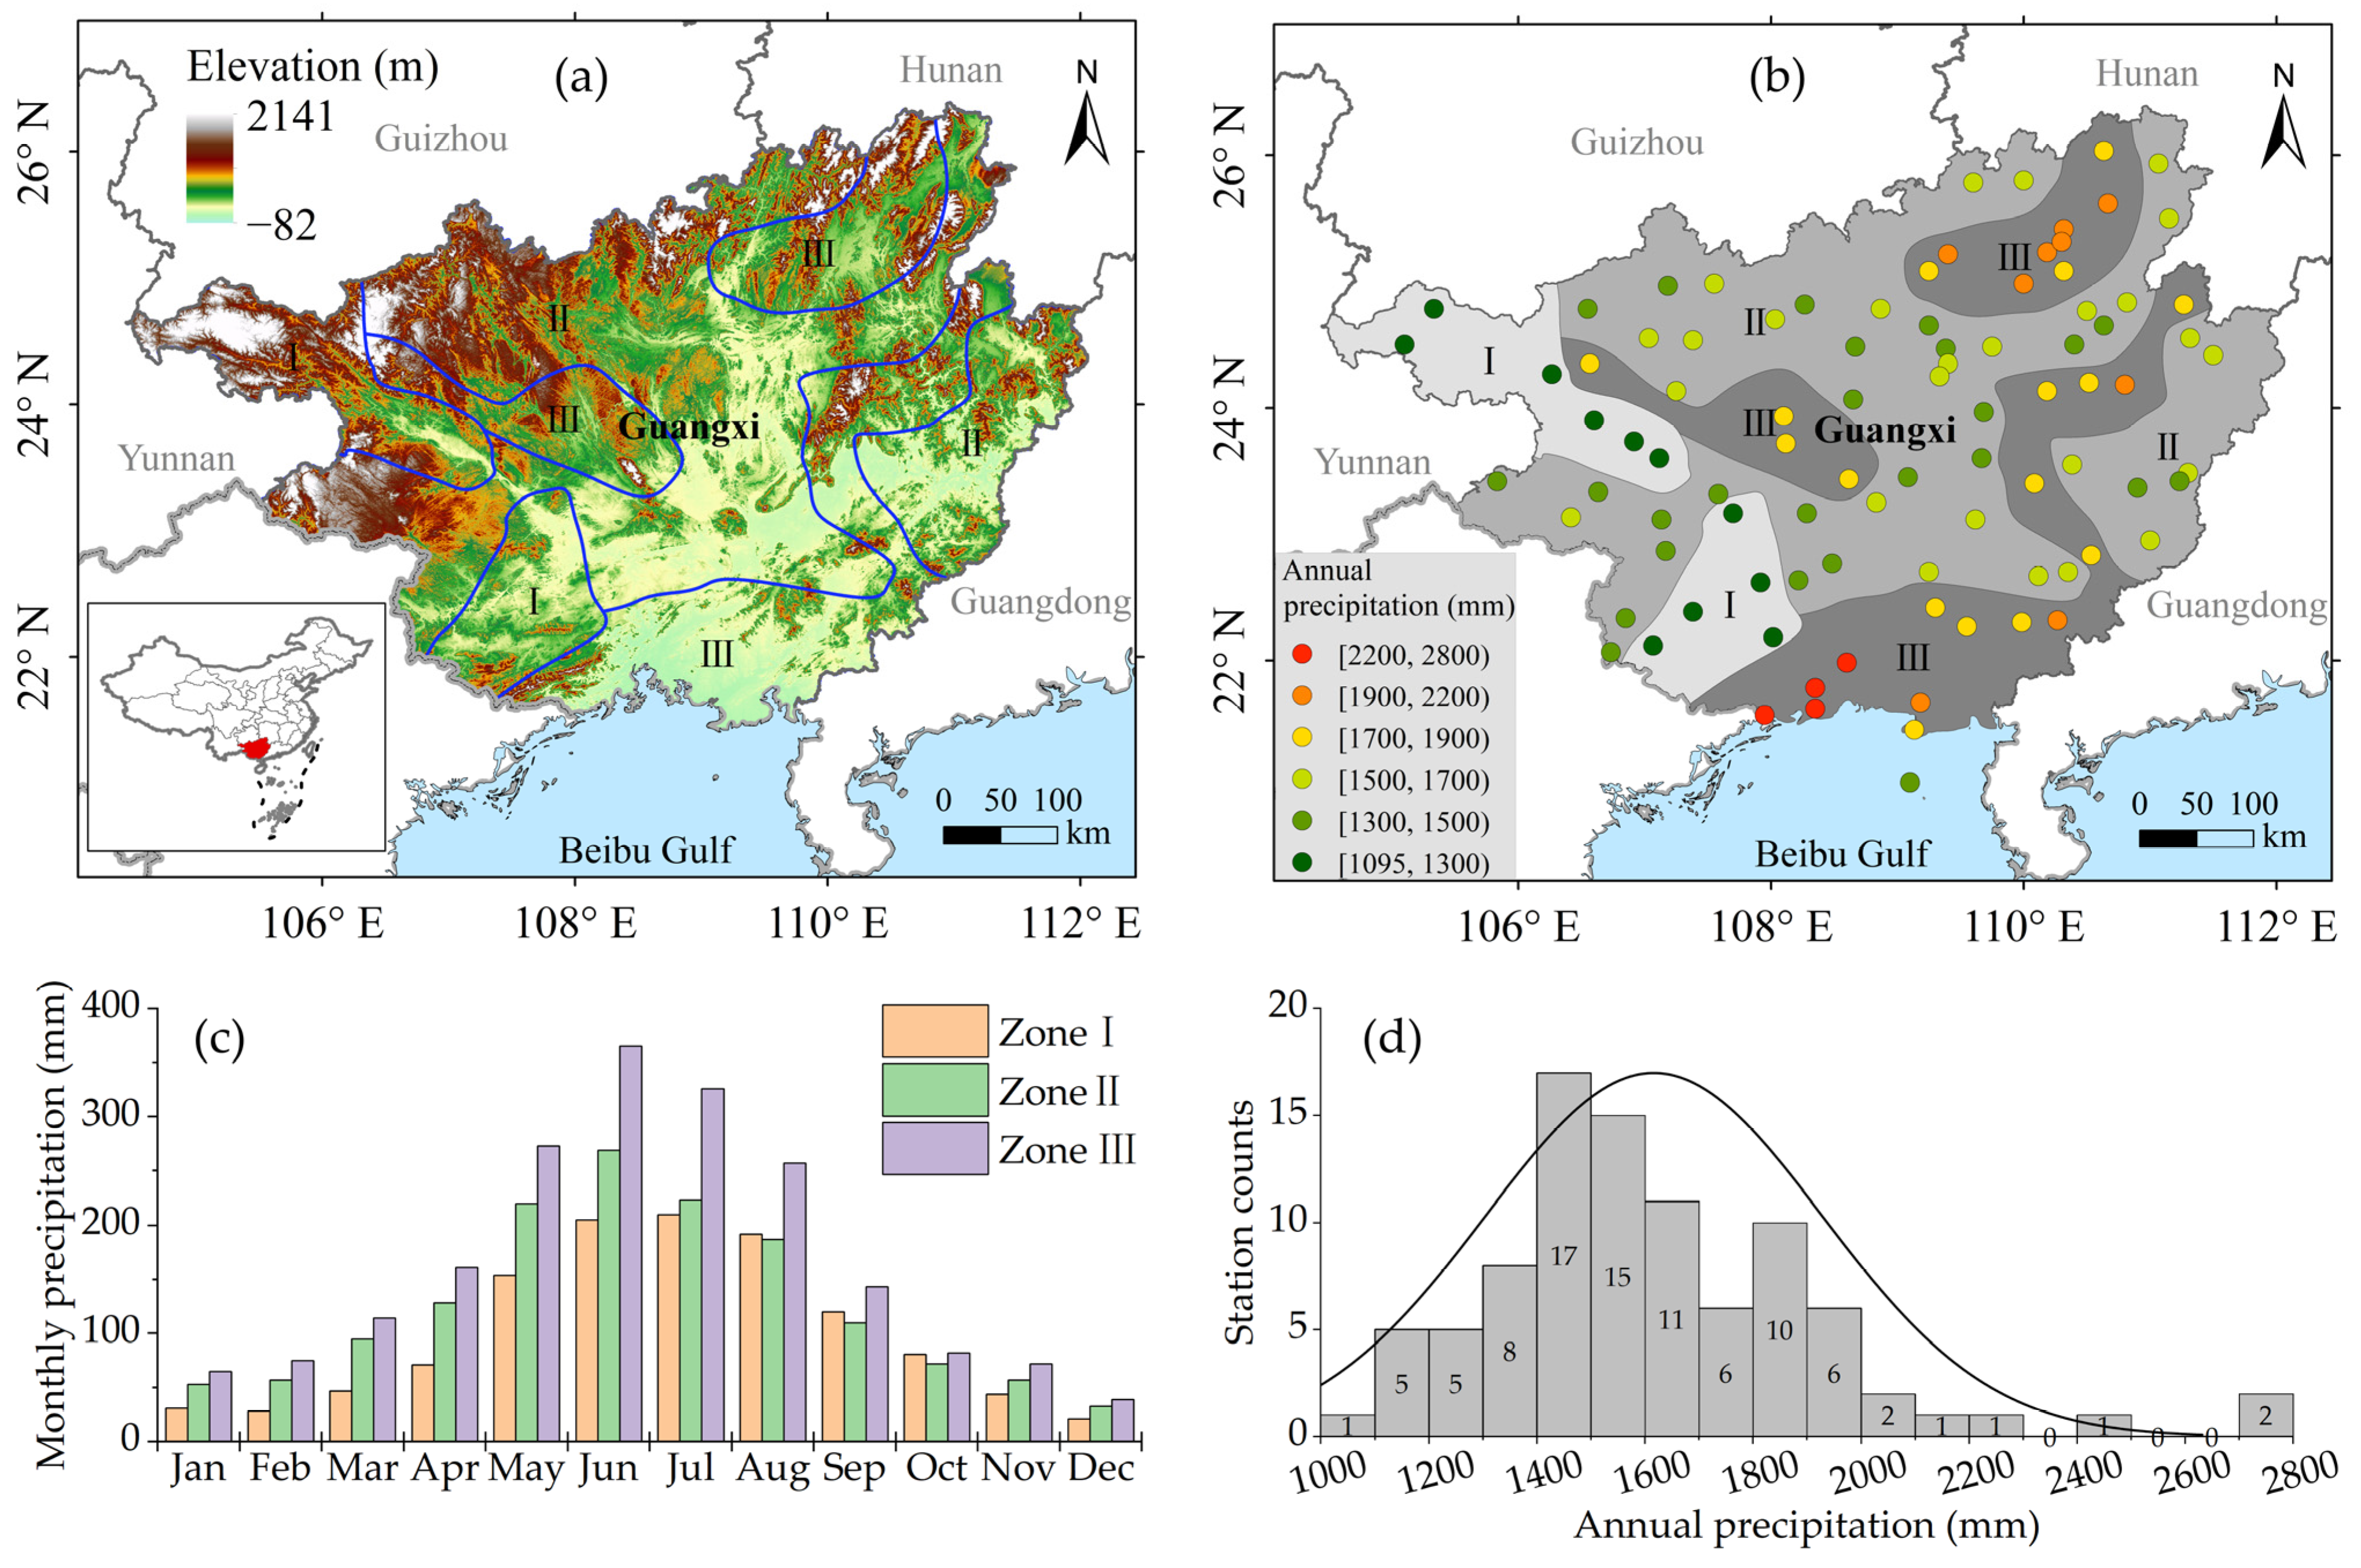
Figure 1. Basic information of Guangxi, China: (a) Location and elevation; (b) Distribution of meteorological stations and study areas; (c) Monthly mean precipitation; (d) Station counts in different mean annual precipitation ranges.
Remotesensing 18 02867 g001
Figure 2. Number of stations with complete observed data for (a) ER, LR and (b) FR at each period.
Remotesensing 18 02867 g002
Figure 3. Metrics of daily precipitation for V06 and V07: (a) CC; (b) RMSE; (c) RB; (d) KGE. * indicates p < 0.05 and ** indicates p < 0.01.
Remotesensing 18 02867 g003
Figure 4. Probability density distributions of V06 and V07.
Remotesensing 18 02867 g004
Figure 5. Categorical verification results stratified by precipitation intensity classes: (ac): POD; (df): FAR; (gi): CSI.
Remotesensing 18 02867 g005
Figure 6. Boxplots of precipitation event detection metrics for all gauges: (a) POD; (b) FAR; (c) CSI * indicates p < 0.05 and ** indicates p < 0.01.
Remotesensing 18 02867 g006
Figure 7. Metrics of monthly precipitation for V06 and V07: (a) CC; (b) RMSE; (c) RB; (d) KGE. * indicates p < 0.05 and ** indicates p < 0.01.
Remotesensing 18 02867 g007
Figure 8. Spatial distribution of metrics variation (ΔCC, ΔRMSE, Δ|RB|, ΔKGE) between the two versions (V07 minus V06) for ER (ah), LR (ip) and FR (qx). The suffix D represents Daily, and M represents Monthly. In panels (c,g,k,o,s,w), ○ denotes persistent underestimation; □ denotes persistent overestimation; △ denotes a shift from underestimation to overestimation; ☆ denotes a shift from overestimation to underestimation.
Remotesensing 18 02867 g008
Figure 9. Boxplots of metric variation (V07 minus V06) for daily (suffix D) and monthly (suffix M) scales: (a) ΔCC; (b) ΔRMSE; (c) Δ|RB|; (d) ΔKGE.
Remotesensing 18 02867 g009
Figure 10. Metrics variation (V07 minus V06) across elevation gradients for daily (ad) and monthly (eh) scales. * indicates p < 0.05 and ** indicates p < 0.01.
Remotesensing 18 02867 g010
Figure 11. Metrics variation (V07 minus V06) across precipitation gradient zones for daily (ad) and monthly (eh) scales. * indicates p < 0.05 and ** indicates p < 0.01.
Remotesensing 18 02867 g011
Figure 12. Metrics variation (V07 minus V06) across interaction between precipitation zones and elevation gradients: (a) ΔCC; (b) ΔRMSE; (c) Δ|RB|; (d) ΔKGE. Indigo blue fill denotes missing data.
Remotesensing 18 02867 g012
Figure 13. Metrics variation (V07 minus V06) across dry and wet seasons for daily (ad) and monthly (eh) scales. * indicates p < 0.05 and ** indicates p < 0.01.
Remotesensing 18 02867 g013
Figure 14. Metrics variation (V07 minus V06) across meteorological seasons for daily (ad) and monthly (eh) scales. * indicates p < 0.05 and ** indicates p < 0.01.
Remotesensing 18 02867 g014
Table 1. Station counts by elevation gradients and rainfall zones.
IMERG
Runs
Precipitation
Zone
Elevation (m)Total
<100[100, 200)[200, 500)[500, 1000)
ER and LRZone I072211
Zone II141912651
Zone III10144129
Total244018991
FRZone I062210
Zone II131611545
Zone III7124124
Total203417879
Table 2. Numbers of paired daily and monthly samples and data completeness.
YearStation CountsStation Density
(Station/10,000 km2)
Daily
Samples
Monthly
Samples
Data Completeness
(%)
ER and LRFRER and LRFRER and LRFRER and LRFRER and LRFR
201463562.72.44192376313712312.513.0
201552442.21.93619319111910510.911.1
201665582.72.45351471117615516.116.4
201765572.72.45396484417715916.216.8
201848412.01.732752877108959.910.0
201991793.83.332,97228,635108794499.599.6
202091793.83.333,24628,854109094699.999.8
Overall91793.83.388,05176,8752894252737.938.1
Table 3. Sample counts of rainfall zones and elevation gradient.
Temporal
Scale
IMERG
Run
Rainfall
Zone
Elevation (m)Total
<100[100, 200)[200, 500)[500, 1000)
DailyER and LRZone I062932956203811,287
Zone II13,48018,21811,287493047,915
Zone III943914,757386279128,849
Total22,91939,26818,105775988,051
FRZone I055012956203810,495
Zone II12,71915,38610,315416942,589
Zone III642212,716386279123,791
Total19,14133,60317,133699876,875
MonthlyER and LRZone I02079767371
Zone II2966984191621575
Zone III28645216050948
Total58213576762792894
FRZone I01819767345
Zone II2956053631371400
Zone III21136116050782
Total50611476202542527
Table 4. Sample counts of seasons.
Temporal
Scale
IMERG
Run
WinterSpringSummerAutumnDry
Season
Wet
Season
DailyER and LR21,49920,17922,84423,52943,35144,700
FR18,86717,57019,85420,58438,01738,858
MonthlyER and LR71365874877514251469
FR62657365067812501277
Table 5. Formulas for evaluation metrics.
MetricsFormulaRangeOptimal ValueUnit
Correlation Coefficient (CC) C C = i = 1 N ( G i G ¯ ) ( O i O ¯ ) i = 1 N ( G i G ¯ ) 2 . i = 1 N ( O i O ¯ ) 2 −1 to 11Unitless
Root Mean Square Error
(RMSE)
R M S E = 1 N i = 1 N ( G i O i ) 2 0 to +∞0mm
Relative Bias
(RB)
R B = i = 1 N ( G i O i ) i = 1 N O i × 100 % −∞ to +∞0%
Kling-Gupta Efficiency (KGE) K G E = 1 ( C C 1 ) 2 + ( β 1 ) 2 + ( γ 1 ) 2
β = G ¯ O ¯     ,         γ = C V G C V O
−∞ to 11Unitless
Systematic Error Proportion (Es) E s = i = 1 N ( G * i O i ) 2 i = 1 N G i O i 2 × 100 %
G * i = a × O i + b
0 to 1000%
Probability of Detection (POD) P O D = H H + M 0 to 11Unitless
False Alarm Ratio
(FAR)
F A R = F H + F 0 to 10Unitless
Critical Success Index
(CSI)
C S I = H H + M + F 0 to 11Unitless
Probability Density Function (PDF) P D F i = n i N × 100 % 0 to 100Null%
Where N is the number of samples; Gi and Oi are the IMERG estimates and gauge observations at time step i, respectively; G ¯ and O ¯ are the mean values of Gi and Oi, respectively; CVG and CVO are the standard deviations of Gi and Oi, respectively; H is the number where both IMERG estimates and observations detect rainfall occurrence; F is the number with rainfall detected by IMERG but no rainfall recorded by observations; M is the number capturing observed rainfall while IMERG fails to identify precipitation; n is the sample count within each precipitation intensity bin; a and b denote the slope and intercept of the additive error model, respectively.
Table 6. Systematic error proportion (%) of V06 and V07.
Temporal
Scale
ER_V06ER_V07LR_V06LR_V07FR_V06FR_V07
Daily62.367.262.467.964.868.9
Monthly80.777.983.681.585.980.1
Disclaimer/Publisher’s Note: The statements, opinions and data contained in all publications are solely those of the individual author(s) and contributor(s) and not of MDPI and/or the editor(s). MDPI and/or the editor(s) disclaim responsibility for any injury to people or property resulting from any ideas, methods, instructions or products referred to in the content.