Article

Mapping Vegetation Alliances Using Deep Learning and Multi-Source Remote Sensing Data

1
College of Resources and Environment, University of Chinese Academy of Sciences, Beijing 101408, China
2
Beijing Yanshan Earth Critical Zone National Research Station, University of Chinese Academy of Sciences, Beijing 101408, China
3
National Key Laboratory of Earth System Numerical Modeling and Application, University of Chinese Academy of Sciences, Beijing 101408, China
4
Northwest Institute of Plateau Biology, Chinese Academy of Sciences, Xining 810008, China
5
College of Life Science, University of Chinese Academy of Sciences, Beijing 101408, China
*
Author to whom correspondence should be addressed.
Remote Sens. 2026, 18(17), 2880; https://doi.org/10.3390/rs18172880
Submission received: 3 July 2026 / Revised: 11 August 2026 / Accepted: 18 August 2026 / Published: 26 August 2026
(This article belongs to the Section Ecological Remote Sensing)

Highlights

What are the main findings?
  • An efficient deep learning approach was developed for fine-grained vegetation classification, systematically integrating multi-source, multi-temporal remote sensing habitat data with an extensive large-scale ground survey.
  • The resulting 2023 vegetation map successfully identified 32 distinct alliances, directly revealing their contemporary spatial distribution patterns and current status across Xinjiang.
What are the implications of the main findings?
  • The integration of deep learning with complex habitat data offers a framework that overcomes the limitations of traditional mapping, establishing an efficiently updatable system for continuous, large-area fine-grained ecosystem monitoring.
  • By precisely distinguishing specific vegetation alliances, this research provides a crucial scientific basis for sustainable land management and dynamic ecological assessment in arid environments.

Abstract

Mapping vegetation alliances is essential for understanding ecological patterns and supporting sustainable land management in arid and semi-arid areas. However, traditional remote sensing typically only distinguishes grassland boundaries or broad subclasses, failing to differentiate specific vegetation alliances. Furthermore, while traditional vegetation mapping relies heavily on field surveys, manual interpretation, and expert knowledge, this labor-intensive approach hinders efficient large-scale mapping. This study proposes an efficient method for vegetation mapping by integrating field survey data with multi-source and multi-temporal remote sensing variables using deep learning. A series of deep neural network models was designed to systematically characterize and leverage spectral signatures, climatic factors, and topographic habitat features for fine-grained classification of 32 vegetation alliances in Xinjiang, a typical arid to semi-arid region. The resulting vegetation map achieved an alliance-level classification accuracy of 0.5125 on an independent test set, with the five most dominant alliances: Stipa spp. desert steppe, Stipa spp. steppe, Poa spp. meadow, and Anabasis spp. desert, accounting for over 10.45% of the total area of Xinjiang. Compared with traditional approaches, this method significantly improves mapping efficiency and offers a scalable solution for large-area, updatable vegetation classification. The approach provides a valuable reference for ecological assessment and dynamic vegetation monitoring in arid and semi-arid regions.

1. Introduction

Vegetation maps are fundamental tools for describing natural environments and ecological resources. They support a wide range of applications, including analyzing vegetation zonation, resource estimation, and environmental planning [1,2,3]. However, while conventional Land Use and Land Cover (LULC) products typically categorize landscapes at the coarse vegetation formation group level (e.g., distinguishing only broad classes like ‘Forest’ or ‘Desert’), the vegetation alliance represents a significantly finer taxonomic unit defined by specific dominant species (e.g., Phragmites australis meadow). Crucially, precise differentiation of vegetation alliances reveals the heterogeneity of pastoral resources. Accurate mapping enables the separation of palatable, nutritious forage (e.g., Stipa spp.) [4] from non-forage or low-palatability cover types, providing a scientific basis for sustainable grazing management [5]. As the ultimate product of botanical surveys and research, vegetation maps rely heavily on comprehensive data collection and rigorous interpretation.
Field-based investigations provide fine-grained and highly accurate ecological information, such as species composition, physiological traits, and other biodiversity indicators. However, such methods are inherently limited in spatial coverage and labor-intensive, making them challenging to apply to broad, dynamic ecosystems [1,6]. Remote sensing, by contrast, offers extensive spatial coverage and repeated temporal observations by measuring reflected or emitted electromagnetic radiation [7]. Although spectral information and vegetation indices are useful for distinguishing major vegetation types at large scales [8], they frequently fail to capture finer-grained vegetation structures and functional diversity.
In recent years, vegetation mapping in Xinjiang has progressed through combination of remote sensing data and machine learning techniques, improving both mapping efficiency and regional coverage [9,10]. However, capturing the full complexity of Xinjiang’s heterogeneous landscapes remains a significant hurdle.
To enhance vegetation classification, remote sensing data sources can expand beyond traditional spectral observations to include information related to habitat characteristics. Multi-source and multi-temporal remote sensing offer the potential to capture various environmental conditions, including those linked to climate, topography, and vegetation phenology. These habitat features are closely related to plant species composition and distribution [11,12], and their seasonal variation also contributes to differences in vegetation patterns across regions. Integrating such information can improve the ecological relevance and granularity of vegetation discrimination. However, the growing volume and complexity of these multi-source and multi-temporal data pose challenges for analysis. While cloud computing platforms facilitate data access and storage, extracting meaningful patterns from high-dimensional inputs still requires scalable and efficient processing methods.
Against this background, deep learning has emerged as a powerful approach for remote sensing applications [13,14,15]. Unlike shallow learning methods, deep neural networks (DNNs) with multiple layers can learn high-level and abstract representations of input data, capturing complex and nonlinear patterns. This characteristic renders them particularly suitable for extracting vegetation-relevant information embedded in remote sensing signals [16,17].
Accordingly, this study implements a method based on deep learning that integrates ecological field survey data with multi-source and multi-temporal remote sensing inputs to generate a detailed vegetation map in Xinjiang. This approach aims to boost both the accuracy and efficiency of vegetation classification, contributing to scalable and updatable ecosystem monitoring.

2. Materials and Methods

The overall workflow of this study is presented in Figure 1. The data utilized in this study can be categorized into two main types: ground survey point data, serving as labels, and remote sensing data, acting as features. These two sets of data are merged to form the training data for the DNN. The DNN undergoes iterative training on this dataset until accuracy and loss stabilize, achieving a strong first iteration. Upon completion of training, a well-trained classification model capable of distinguishing vegetation alliances using remote sensing data is obtained. Finally, this classification model is applied to the remote sensing data to generate the vegetation map.

2.1. Study Region

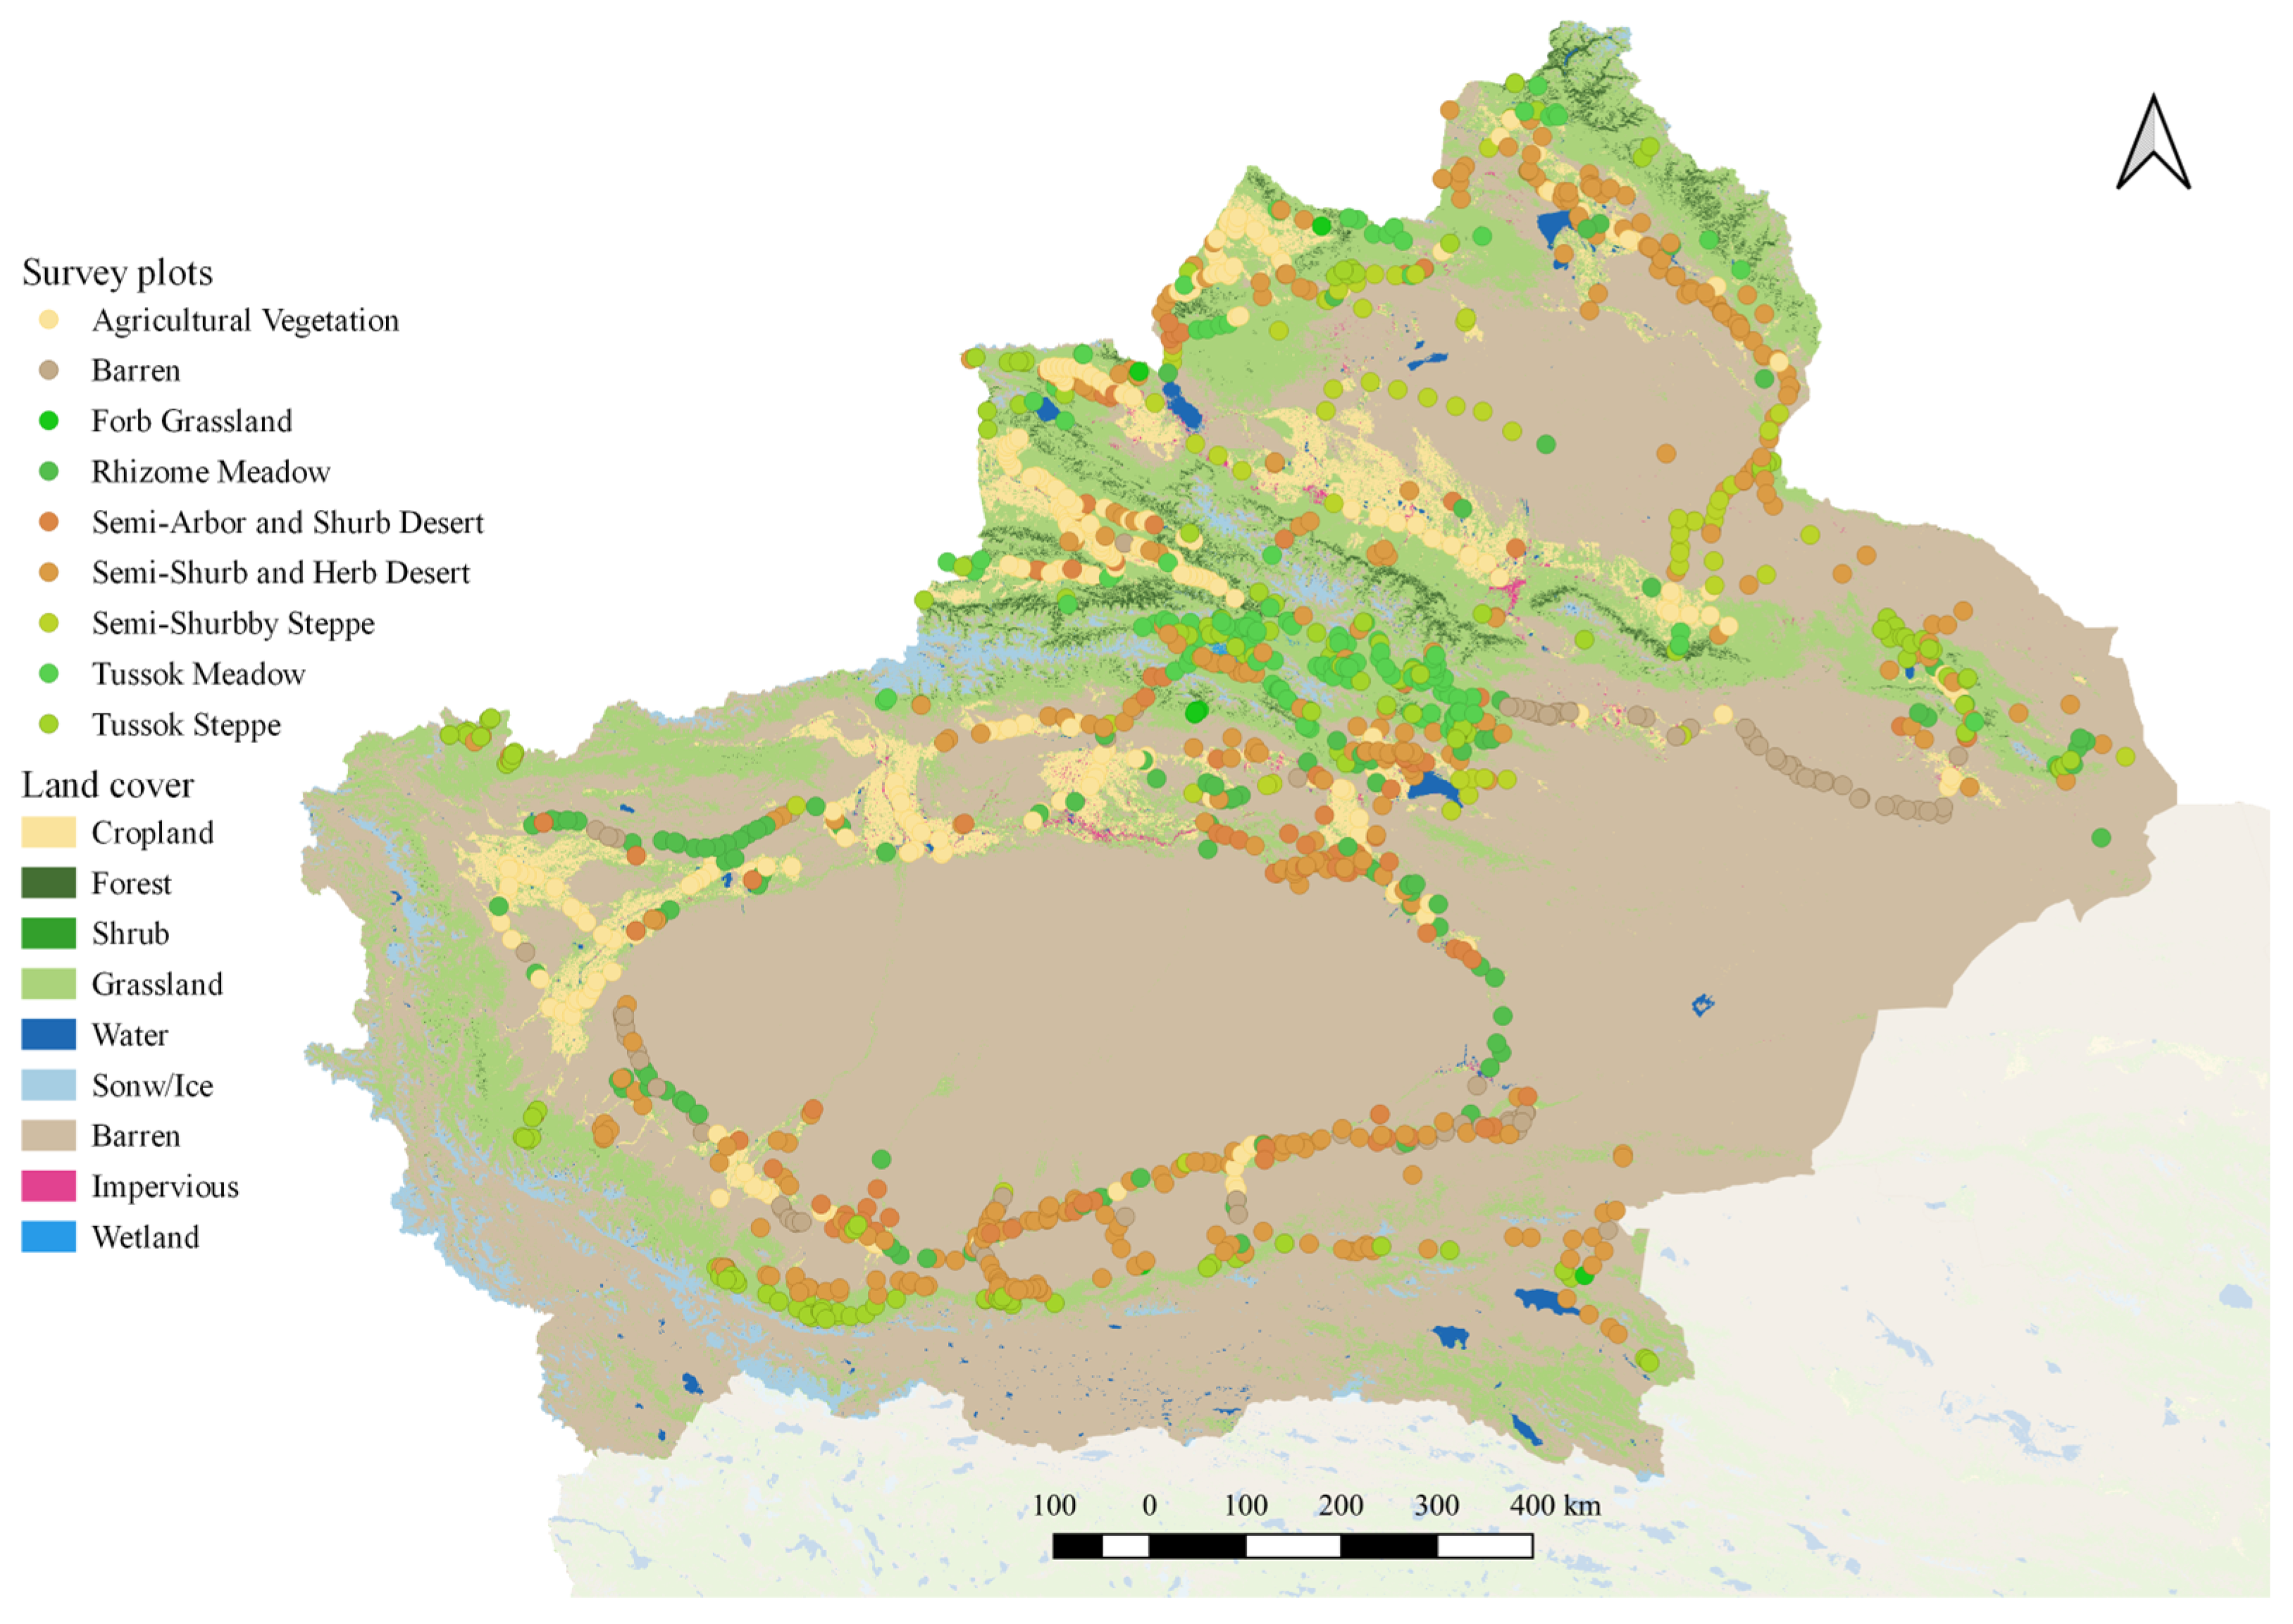
This study focuses on the vegetation on Xinjiang province of China, ranges from 73.2°E to 96.2°E and 34.2°N to 49.3°N, totaling area 1664.90 × 103 km2, average elevation 2436 m [18]. Xinjiang features a mean annual temperature of 9–12 °C, annual precipitation of 100–200 mm in the north and 16–85 mm in the south, and annual potential evaporation of 1500–2300 mm in the north and 2100–3400 mm in the south [19]. The landcover was masked using the China land cover dataset (CLCD) [20], as shown in Figure 2. In Xinjiang, natural vegetations are predominantly confined to mountainous areas, where pronounced altitudinal zonation driven by elevation gradients contributes to their spatial fragmentation and discontinuous distribution patterns.

2.2. Field Data Collection and Dataset Preparation

Field campaigns were conducted in 2023 across natural vegetation areas throughout the Xinjiang region. To address the fragmented distribution patterns of vegetation, we employed a dual sampling strategy: grid-based site selection in areas of concentrated grassland and stratified coverage sampling in fragmented zones. Within the Ili River Basin, survey grids were established at 10 km intervals, with site selection guided by considerations of accessibility and representativeness of vegetation types, enabling systematic documentation of species composition. In other parts of Xinjiang, supplementary surveys were conducted to achieve comprehensive coverage of all vegetation types. Within each sampling site, plots were laid out at intervals of no less than 50 m, ensuring fine-grained sampling that accounts for the spatial heterogeneity and unique characteristics of the regional vegetation.
Sampling design was informed by observed trends in species composition and abundance among dominant and constructive species across major vegetation types. For vegetation communities distributed along mountain vertical gradients, plots were positioned centrally within each altitudinal zone, with slope gradient, aspect, and position maintained as consistently as possible. In regions where vegetation exhibited sparse or scattered distributions, sampling was conducted in areas characterized by relatively homogeneous environmental conditions. In landscapes where vegetation occurs in a patchy mosaic, plot density was increased while individual plot size was correspondingly reduced. Distinct sampling plots were established for vegetation under different land-use regimes or varying intensities of anthropogenic utilization. Plots were generally avoided in transitional zones to minimize confounding edge effects.
At each sampling location, a 0.5 m × 0.5 m quadrat was established to document the dominant plant species present. Unidentified taxa were collected as voucher specimens, with corresponding specimen numbers recorded immediately in the survey datasheet. Plant specimens and photographic records were obtained for each site, with particular emphasis on photographing the dominant species individually. Concurrently, detailed metadata—including time, geographic coordinates (latitude and longitude), elevation, weather conditions, soil characteristics, topographic context, and vegetation land-use information, were systematically documented to ensure comprehensive site characterization.
Environmental photos, dominant species photos, quadrat photos, and other quadrat information are manually identified by botanists, and the corresponding sample points were classified into 75 types (alliances, based on Revised Scheme of Vegetation Classification System of China) [21]. Subsequently, the vegetation alliance category and location information are obtained. Using the recorded locations, values from remote sensing products were extracted at the corresponding pixels. By matching the ground truth data (vegetation alliance categories) with the remote sensing features, a labeled dataset was constructed for deep learning model training. In this dataset, the vegetation alliance category serves as the label, while the location and remote sensing information serve as the feature data, totaling 1830 entries. Due to the excessive number of categories, which hindered effective differentiation, we deleted and merged certain categories. First, categories with a sample size of fewer than 5 were removed. Second, similar categories were merged. For example, the Stipa glareosa desert steppe, Stipa caucasica subsp. glareosa desert steppe, Stipa caucasica desert steppe, and Stipa breviflora desert steppe were merged into a broader Stipa spp. desert steppe. Similarly, the Poa annua meadow, Poa annua and Alchemilla japonica meadow, and Poa spp. forb meadow were merged into a Poa spp. meadow, and so on. After deleted and merged categories, 32 alliance types with a total of 1391 entries remained. The detailed reduction rules mapping the original 75 alliances to the final 32 classes are provided in Table S1.

2.3. Time Series Multi-Source Plant Characteristics and Habitat Feature Data

Data processing and acquisition for remote sensing were conducted largely via the Google Earth Engine (GEE, Google LLC, Mountain View, CA, USA) platform. GEE serves as a high-performance cloud computing infrastructure tailored for the processing of vast geospatial datasets on a global scale, providing the computational resources necessary for advanced remote sensing inquiries [22].
To comprehensively characterize the habitat features of vegetation alliances, we constructed a multi-dimensional feature space that integrates four major data categories: topographic features, vegetation indices, climatic variables, and multispectral imagery. We specifically selected MODIS data products (250–500 m resolution) as the primary data source to effectively combine these diverse inputs, particularly given the coarse resolution of climatic drivers and the requirement for dense time-series analysis. This choice was guided by three main factors: (1) ecological scale matching, ensuring the resolution aligns with alliance patterns to minimize spectral noise; (2) temporal capacity, which allows for the construction of dense time-series to capture phenology; and (3) data compatibility, facilitating seamless fusion with coarse climatic datasets without introducing significant resampling uncertainties.
The specific variables utilized within these four categories are detailed as follows: Topographic data describe terrain conditions that influence vegetation distribution, including aspect, digital elevation model (DEM) and slope [18]. Vegetation indices capture vegetation productivity and health status, including enhanced vegetation index (EVI), normalized difference vegetation index (NDVI; Didan, K., 2021 [23]), gross primary productivity (GPP), net photosynthesis [24], leaf area index (LAI) and fraction of photosynthetically active radiation (FPAR; Myneni et al., 2021 [25]). Climatic data reflect the environmental conditions affecting plant growth, including day land surface temperature [26], precipitation accumulation, soil moisture, and actual evapotranspiration [27]. Multispectral imagery provides rich spectral information across different wavelengths [28]. A total of 315 images from different time periods were integrated to account for temporal variation and enhance the robustness of classification. The remote sensing data and resolution information used in this study are shown in Table 1. Given the complete spatial coverage of the multi-temporal images, they were directly stacked to provide time-series information without requiring temporal interpolation. Prior to model training, all remote sensing datasets were resampled and strictly co-registered to a unified spatial resolution of 250 m.

2.4. Model Architecture

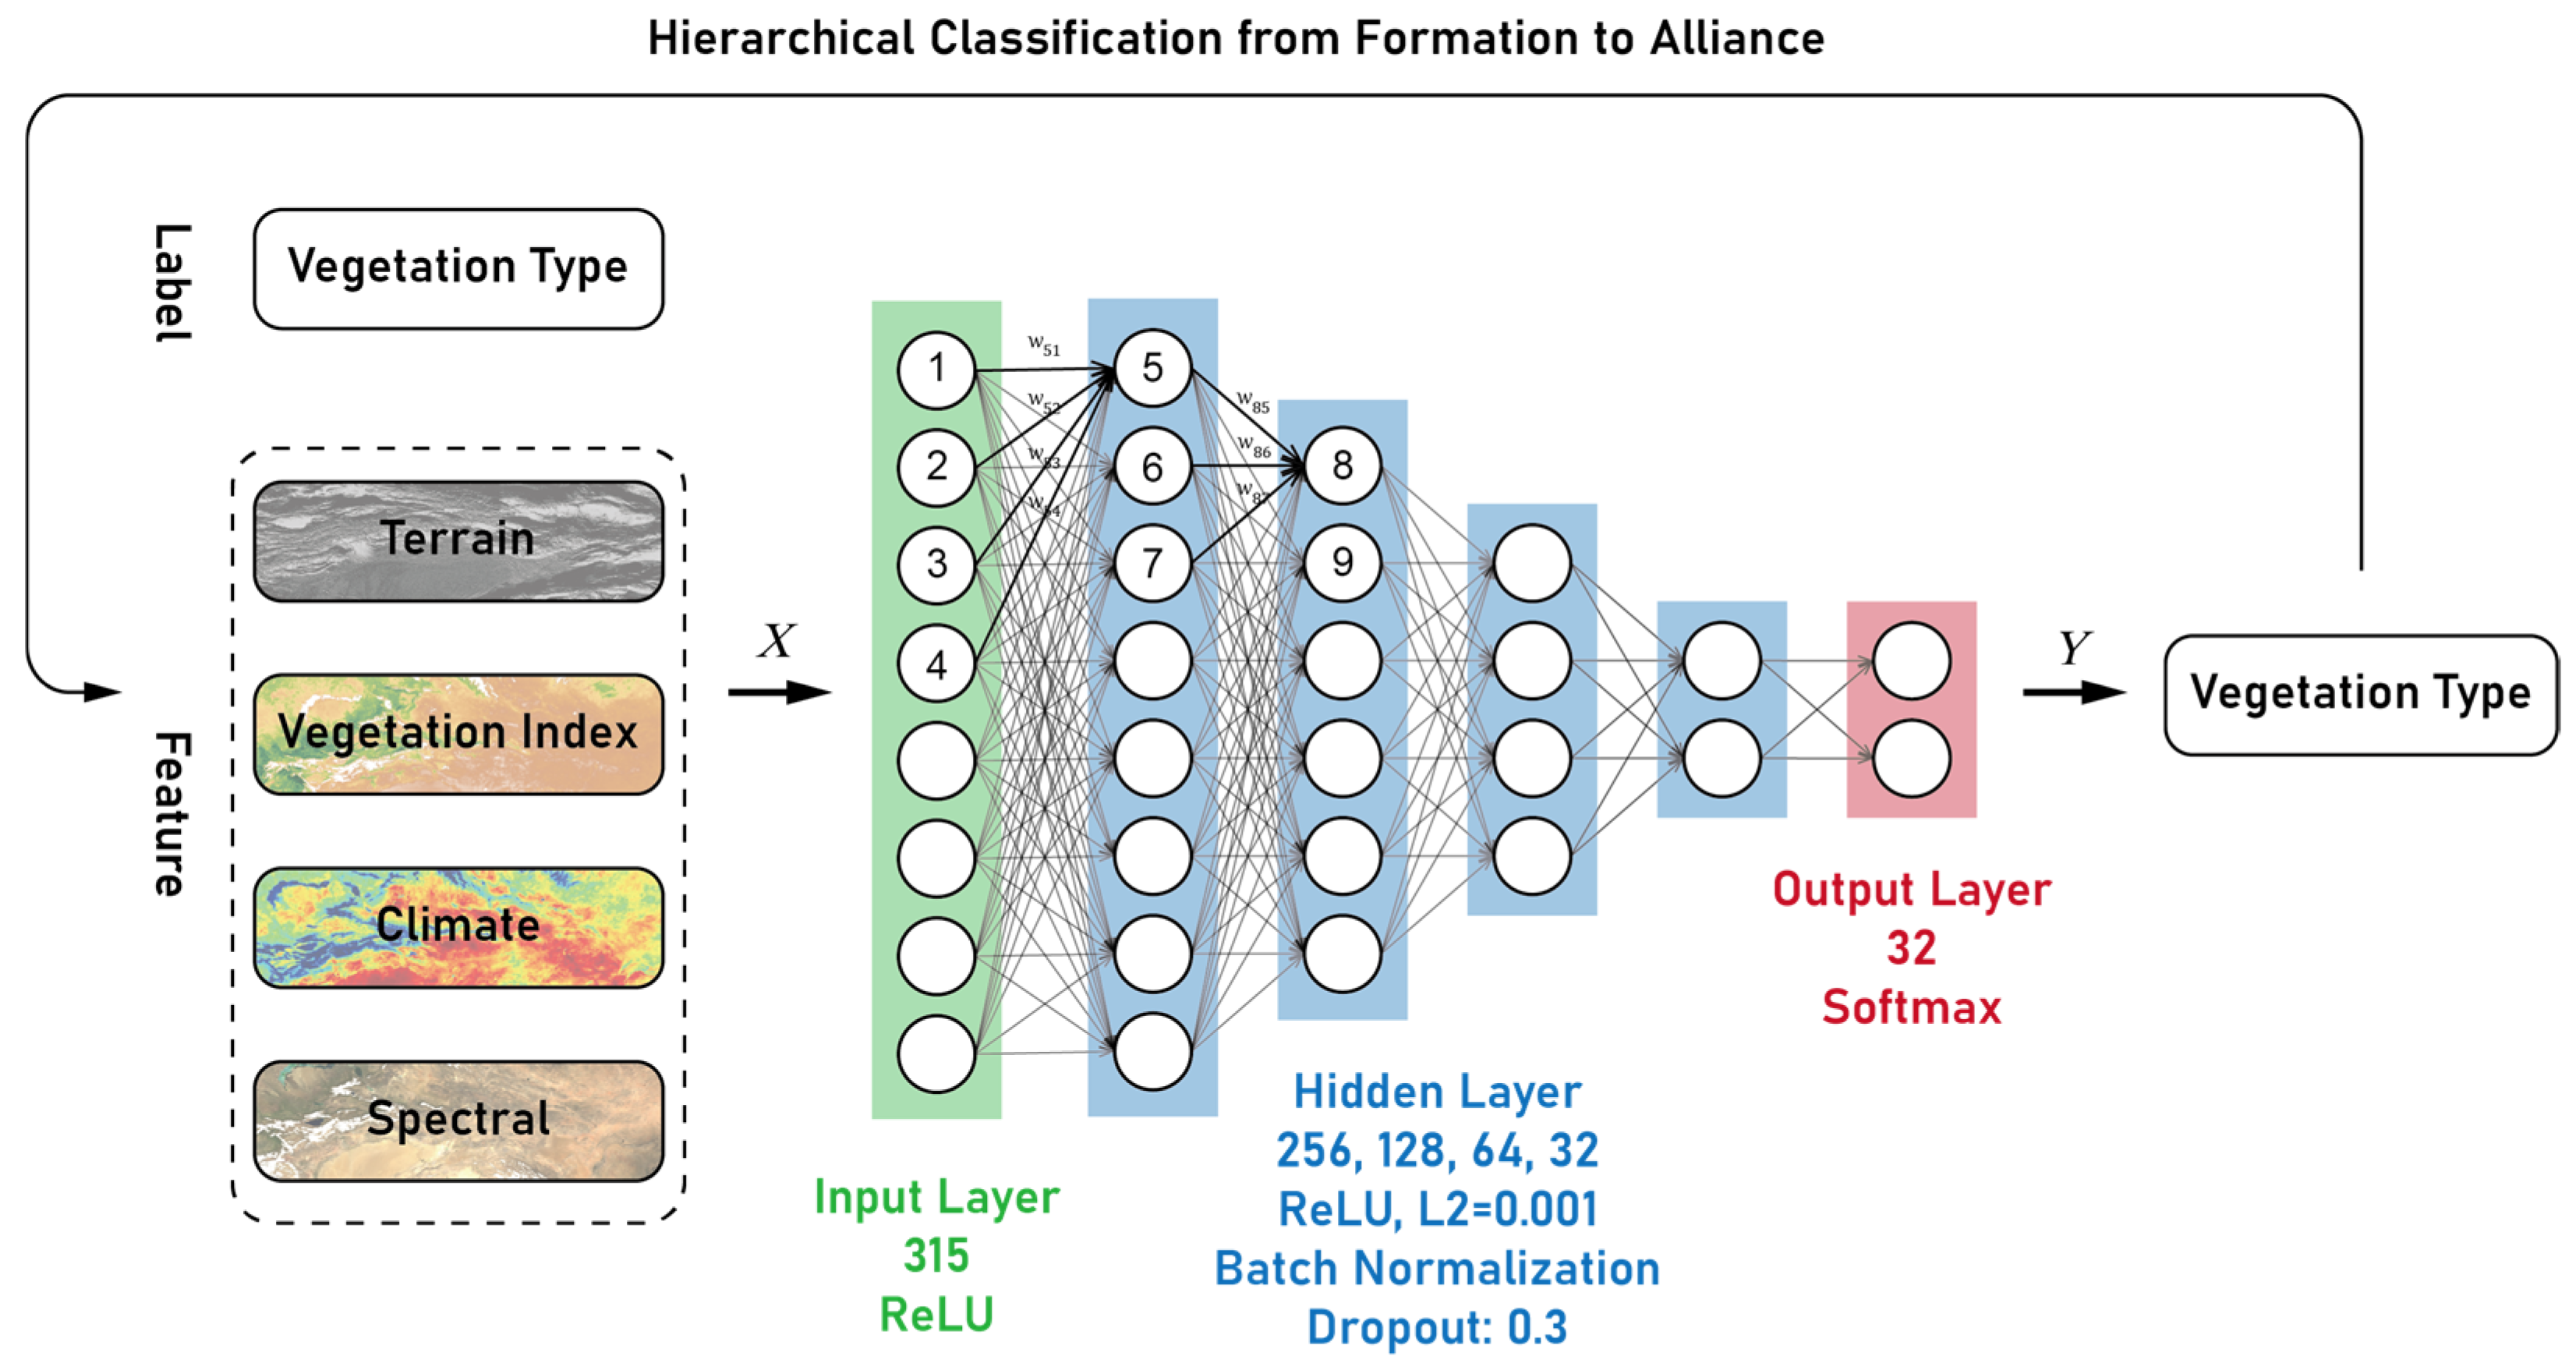
The DNN in this work was constructed using the TensorFlow (version 2.1, Google LLC, Mountain View, CA, USA) framework [29]. As a versatile open-source library, TensorFlow provides a robust ecosystem for numerical computation, facilitating the efficient design, training, and deployment of machine learning models across various research and production environments. After extensive testing and adjustment, and continuous optimization of the network architecture and hyperparameters, the current network structure has been formed:
Considering the complexity of the features, a DNN with strong learning capability was designed and utilized in this study. The DNN consists of 4 fully connected layers (FC layers), with the number of nodes in each layer being: 256, 128, 64, 32. The Rectified Linear Unit (ReLU; Hahnloser et al., 2000 [30]) activation function was applied to all hidden layers due to its robustness to noise and its effectiveness in avoiding vanishing and exploding gradient problems. Each FC layer is followed by a batch normalization layer (BN; Ioffe & Szegedy, 2015 [31]), which stabilizes and accelerates training by normalizing the input distributions, and a Dropout layer [32], which helps reduce overfitting and improve generalization. The overall architecture of the DNN is illustrated in Figure 3.
To mitigate the significant class imbalance in the dataset, a custom Focal Loss function [33] integrated with class-balanced weights was utilized, replacing the standard cross-entropy loss. Focal Loss enhances the training effect on minority classes by down-weighting easy examples. The objective function used in this study is mathematically defined as:
F L p t = α t 1 p t γ l o g ( p t )
where p t represents the model’s predicted probability for the ground-truth class. The focusing parameter γ smoothly adjusts the rate at which easy examples are down-weighted, which was empirically set to γ = 2.0 in our configuration. The weighting factor α t balances the importance of positive and negative examples, set to α = 0.25 . Furthermore, dynamically computed balanced class weights were integrated into this loss function to further calibrate the gradients across the heterogeneous vegetation alliances.

2.5. Baseline Model Comparison

To validate the effectiveness of the proposed deep learning architecture, we established a baseline model using the Random Forest (RF) algorithm on the Google Earth Engine (GEE) platform. RF was selected as the benchmark due to its proven stability and superior performance in handling high-dimensional remote sensing datasets compared to other traditional machine learning methods [34]. This baseline model utilized the same field survey labels and sampled the points at a 250 m spatial resolution. The input predictors consisted of nine static spectral features: a cloud-masked standard annual median composite of seven MOD09A1 surface reflectance bands (b01 through b07) alongside two derived vegetation indices (NDVI and EVI) from 2023. The dataset was randomly partitioned into an 80% training set and a 20% independent validation set. Specifically, the model was implemented utilizing the Smile Random Forest algorithm provided by the ee.Classifier.smileRandomForest() method, configured with 500 decision trees to ensure convergence. Its classification performance was comprehensively evaluated using Overall Accuracy (OA), the Kappa coefficient, and macro-averaged metrics (Precision, Recall, and F1-Score) derived from the validation partition.
Furthermore, a second RF baseline was introduced for a more comprehensive comparison. This additional baseline maintained the exact same algorithm configuration and evaluation approach, but utilized the identical multi-source and multi-temporal remote sensing datasets employed in our proposed model.

2.6. Experiment

In plant ecology, vegetation is systematically categorized into a nested hierarchy: Vegetation Formation Group, Vegetation Formation, Alliance Group, Alliance, Association Group, and Association. To accurately map complex vegetation distributions, our training pipeline was explicitly designed as a top-down hierarchical classification framework that mirrors this ecological logic. In the first stage, a global model is trained to distinguish the 9 broader Vegetation Formations. In the second stage, separate downstream models are developed for each predicted formation to further classify the vegetation into the 32 specific alliances. This hierarchical approach enabled the models to focus on finer-grained distinctions within ecologically similar groups, thereby reducing confusion among visually or structurally similar types and improving both classification accuracy and generalizability across heterogeneous landscapes.
All model training was conducted using an RTX 2070 Super GPU (NVIDIA Corporation, Santa Clara, CA, USA). To assess the robustness and practical effectiveness of the proposed approach, an independent validation was carried out, with the results presented in Section 3.1 Model Performance.
The neural network models were trained using a batch size of 64 for a maximum of 500 epochs. Network optimization was driven by the Adam optimizer [35] with an initial learning rate of 0.001. To prevent overfitting and ensure optimal convergence, an L2 regularization penalty of 0.001 was applied across the dense layers, in conjunction with the aforementioned dropout rate of 0.3. Furthermore, dynamic learning rate decay and early stopping mechanisms [36] were implemented: the learning rate was halved (factor = 0.5) if the training loss plateaued for 10 epochs, and training was completely halted after 30 epochs of no improvement to restore and retain the best model weights.
After model training and evaluating, the entire training dataset was passed through the models again, and the classification models were applied to remote sensing data covering the entire Xinjiang region. The resulting prediction was integrated, combined with existing land cover products [20] and subsequently post-processed (including administrative boundary clipping, specific color assignment, and the addition of map elements) to produce the 2023 vegetation alliance map of Xinjiang Province.

3. Results

3.1. Model Performance

To ensure the objectivity of the classification evaluation, the dataset was split prior to training. Specifically, 80% of the labeled data was used for training, while the remaining 20% was randomly sampled and reserved as an independent test set. This approach allowed for unbiased validation of model performance.
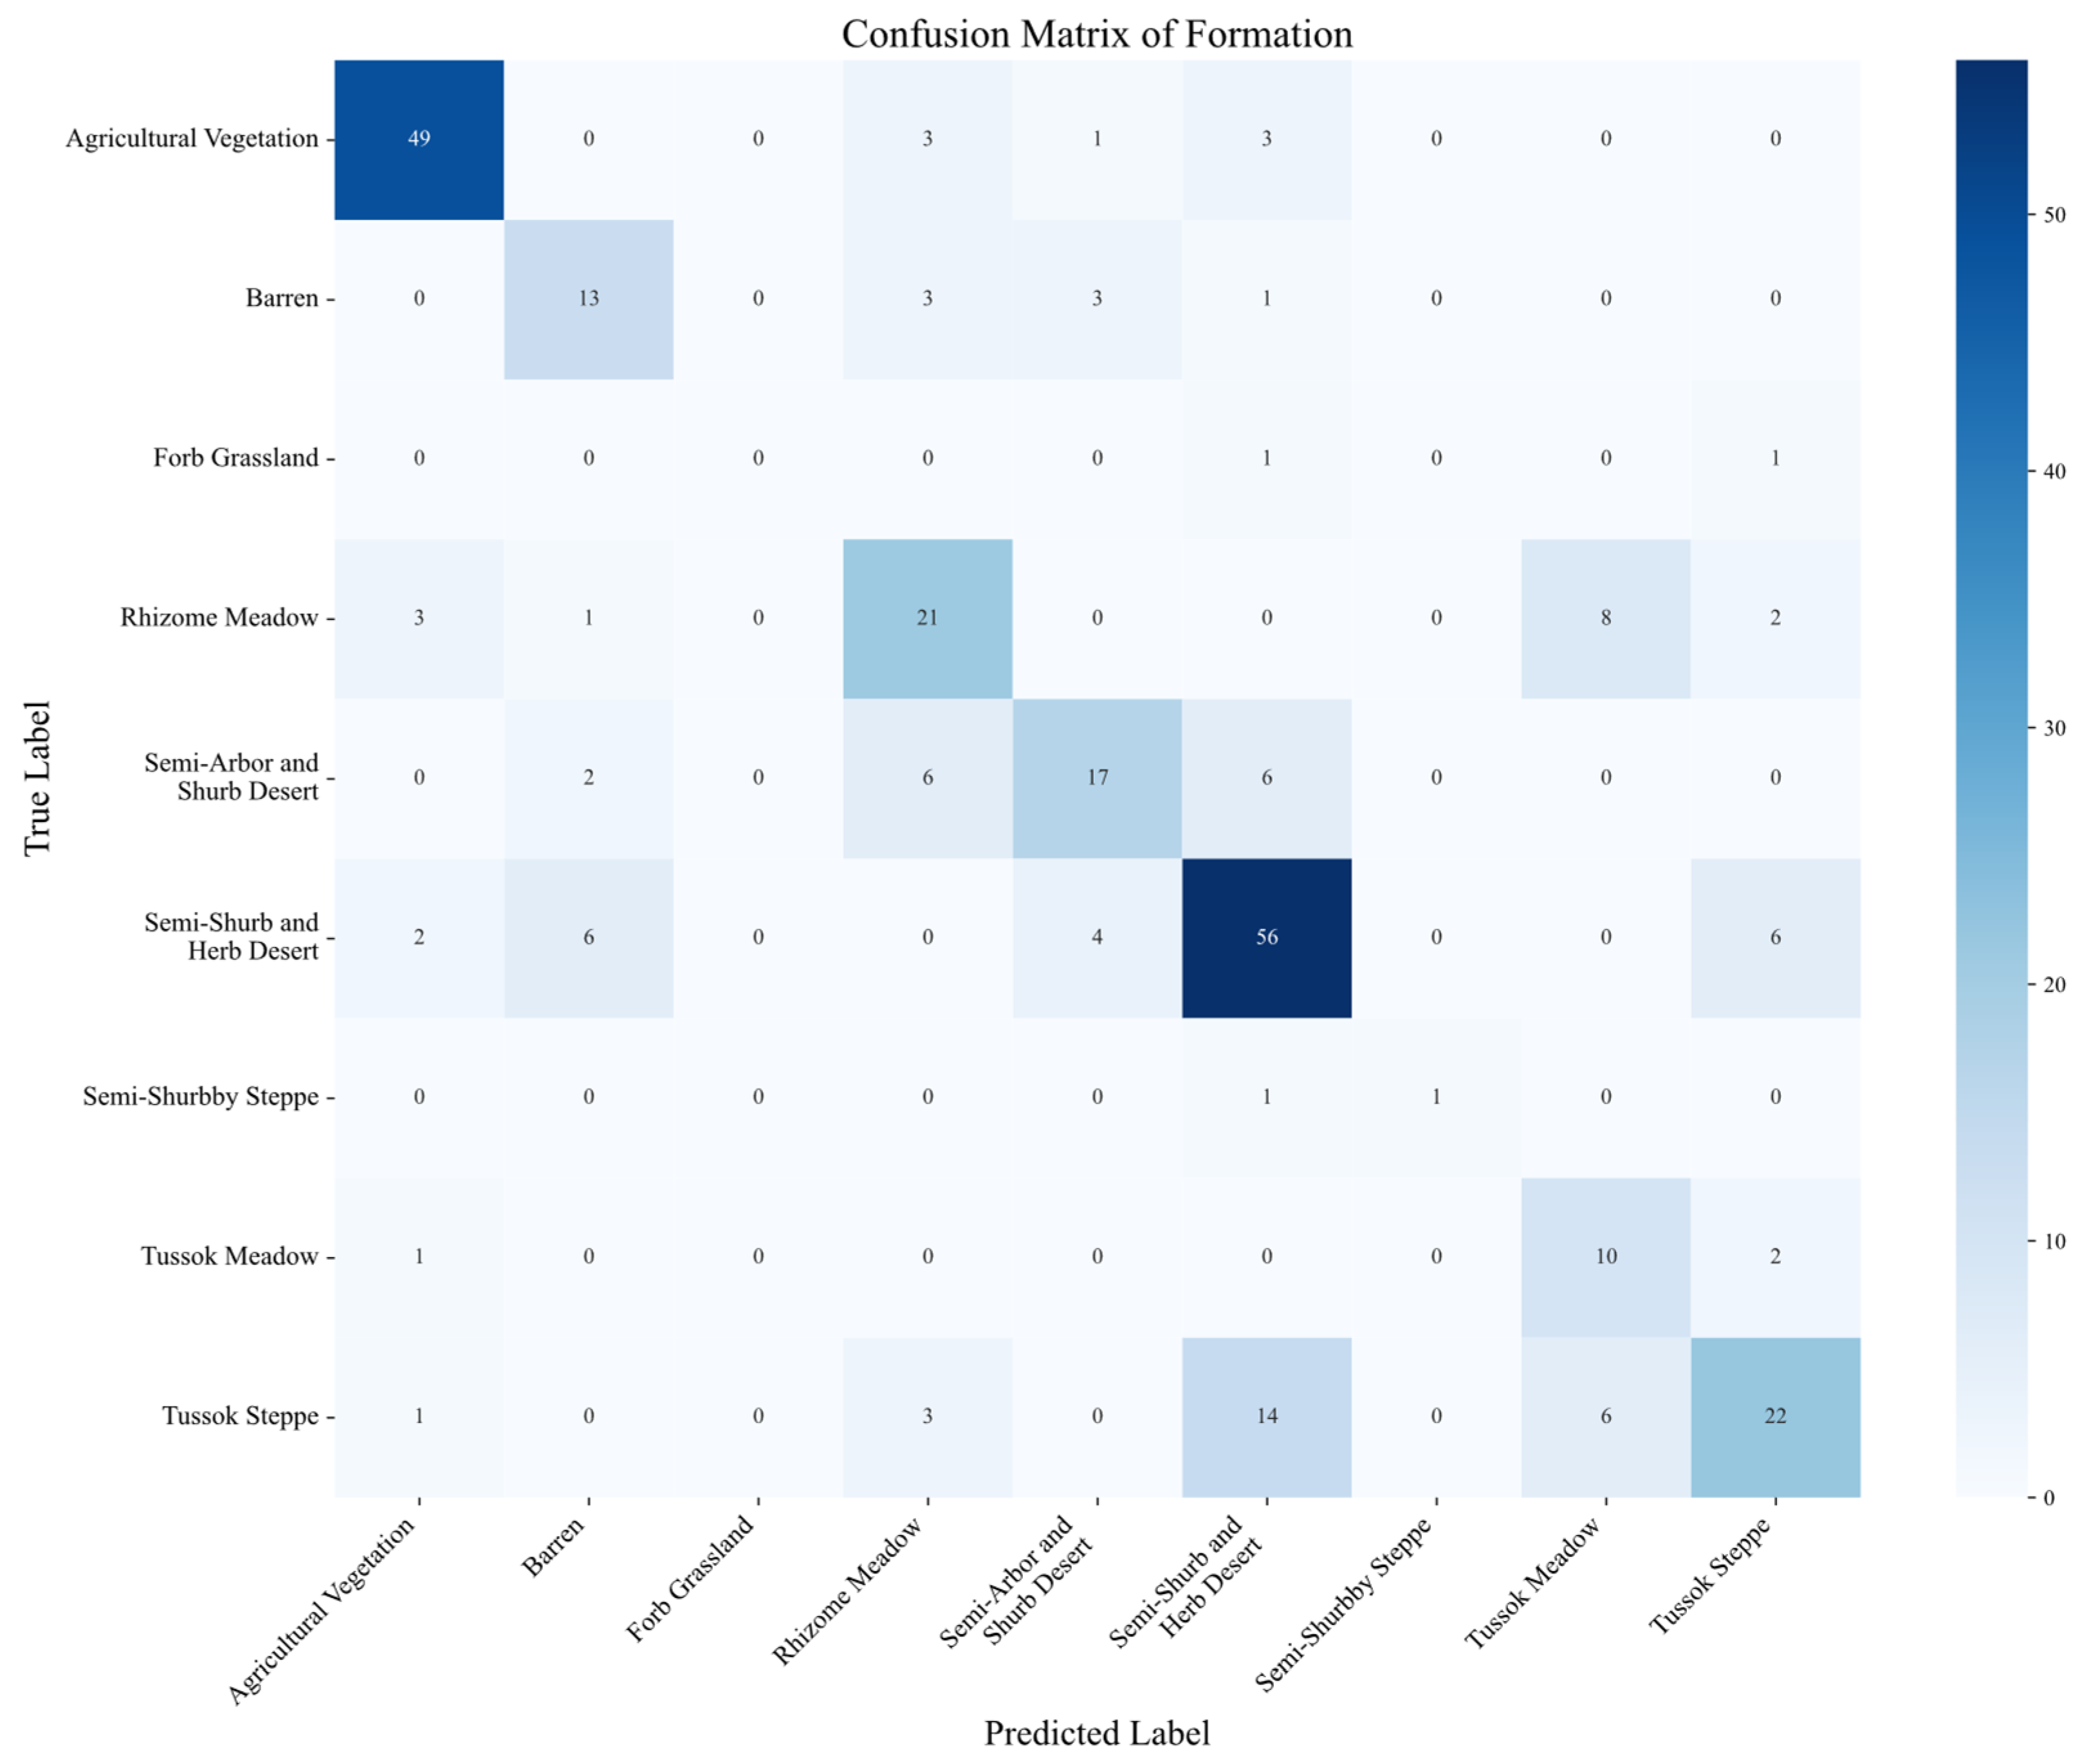
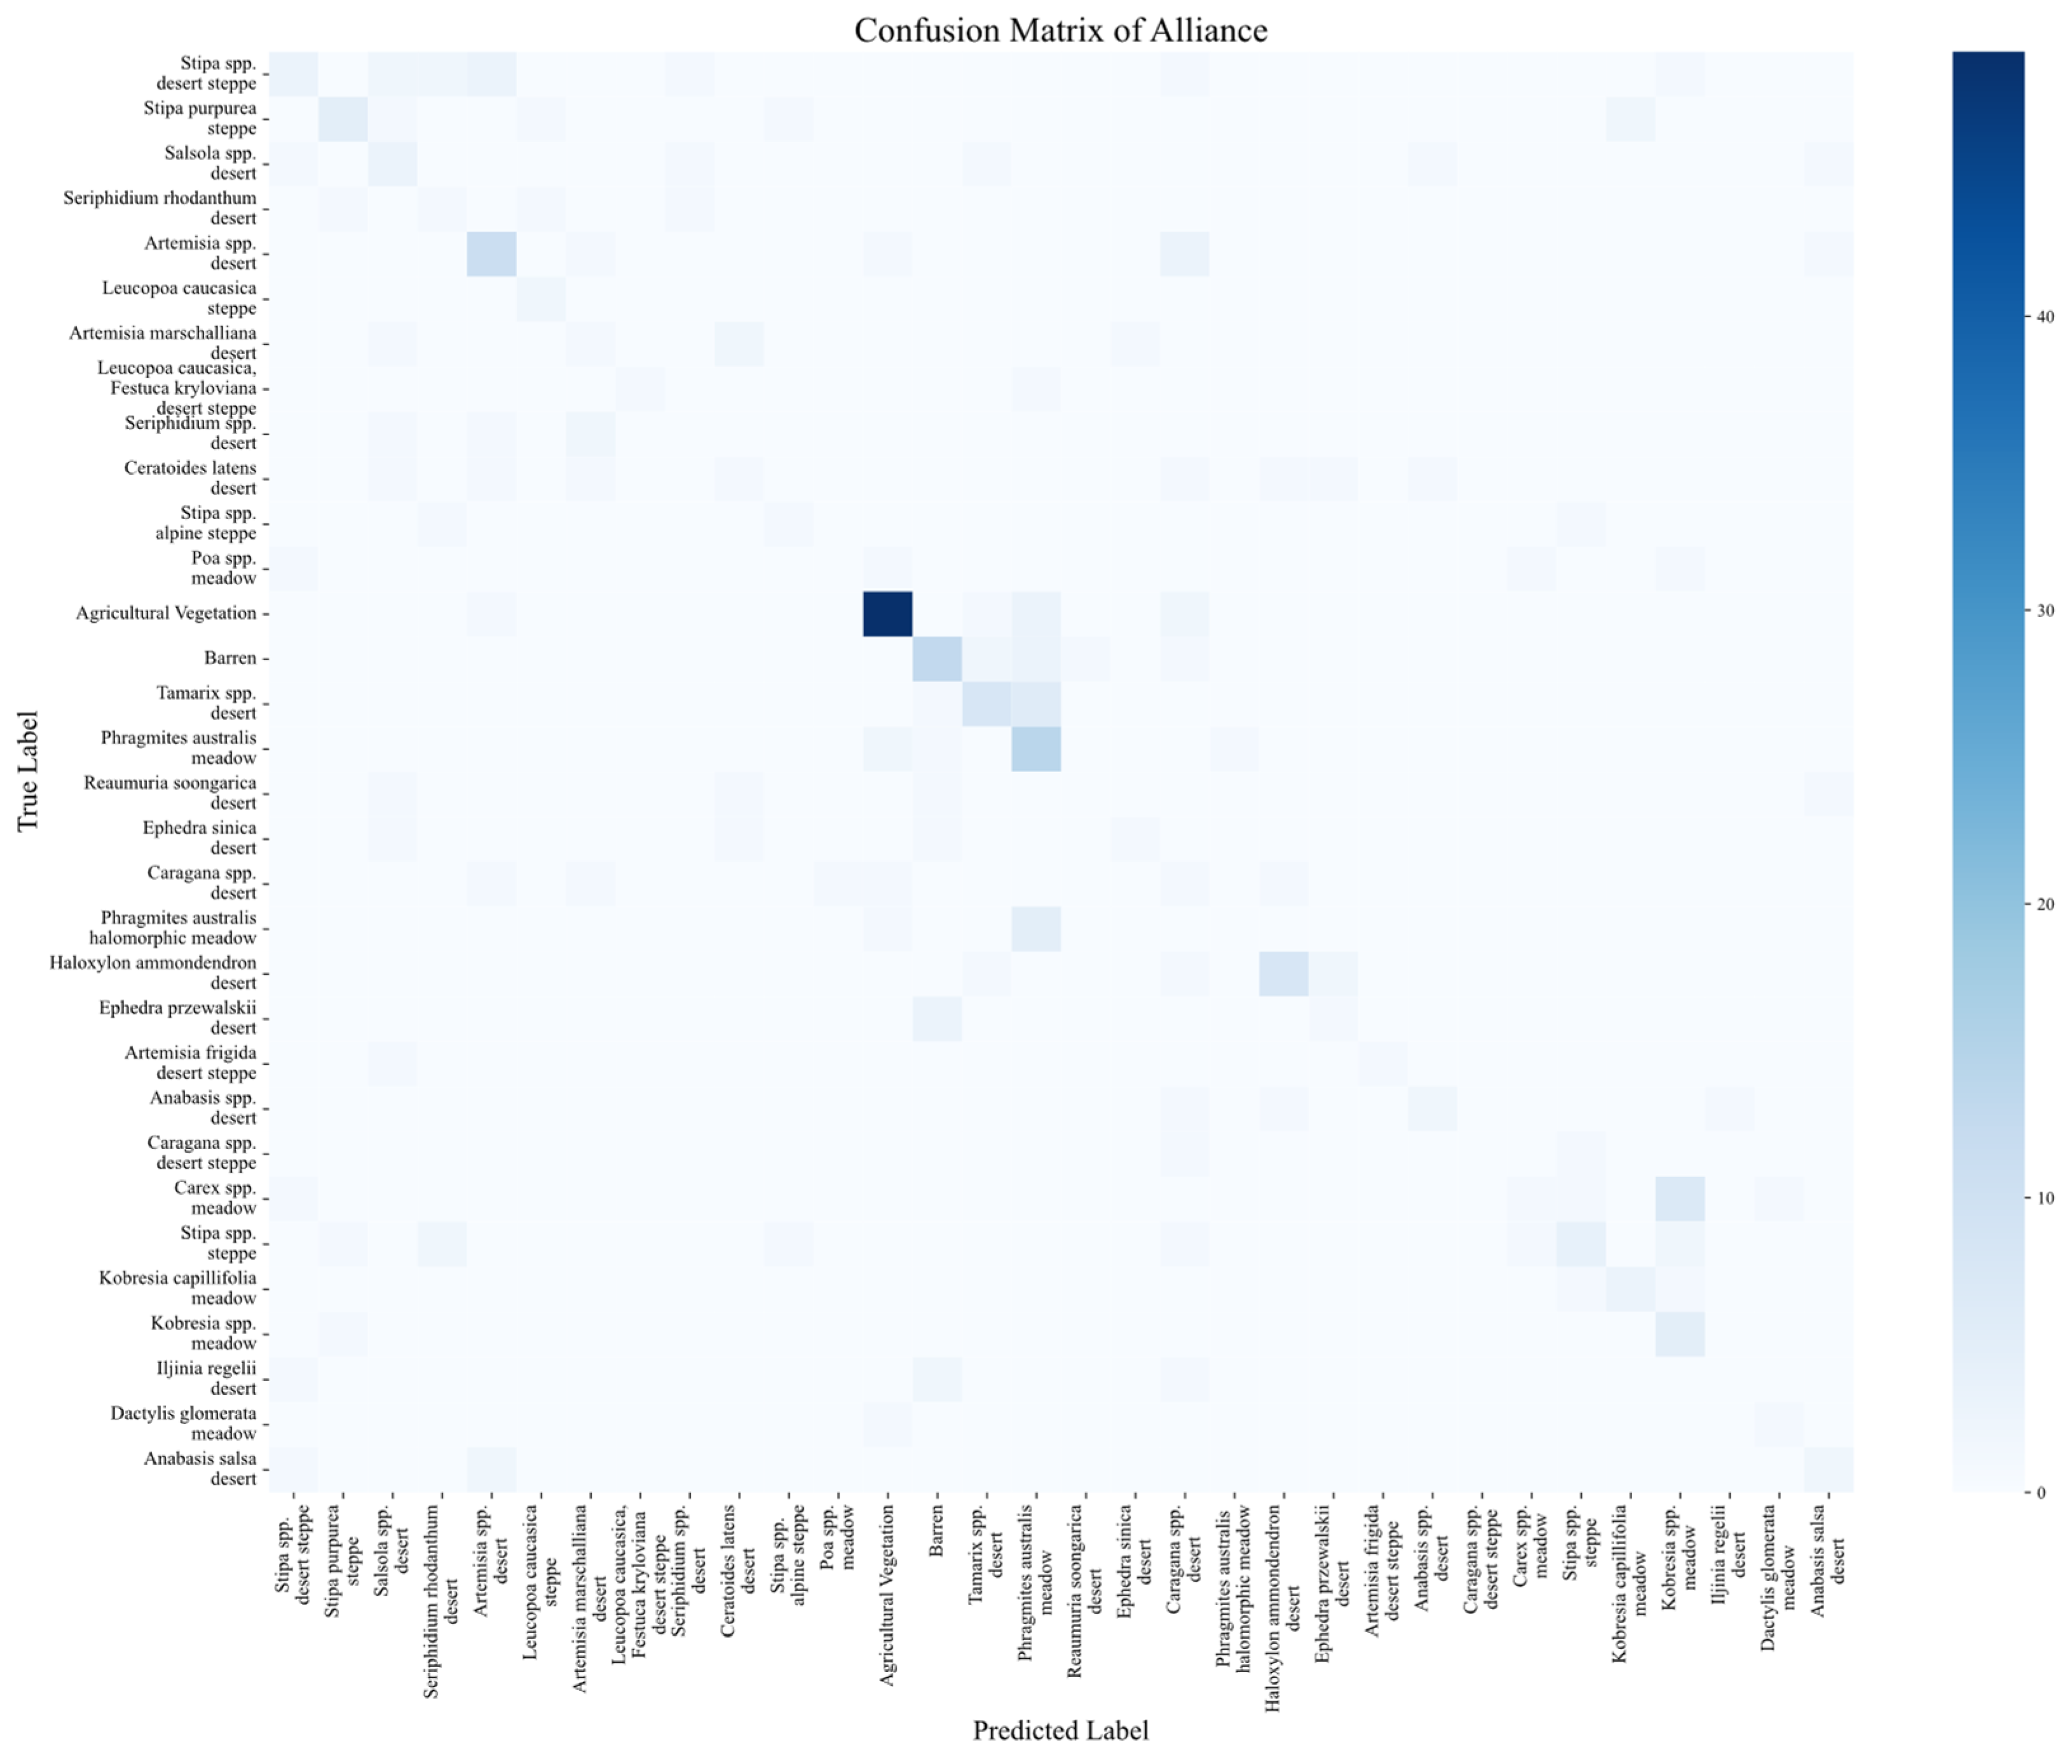
On this independent validation dataset, the model achieved an Overall Accuracy (OA) of 0.5125, a balanced accuracy of 0.3746, a Macro Precision of 0.5084, a Macro Recall of 0.5125, and a Macro F1 score of 0.4930. To evaluate sampling variability, a bootstrap analysis (1000 iterations) was conducted on the test set, yielding a mean OA of 0.5142 (95% CI: [0.4552, 0.5771]) and a mean weighted F1-Score of 0.4970 (95% CI: [0.4344, 0.5623]). To verify that the model learned meaningful features rather than merely guessing the most frequent class, a majority class baseline (the accuracy achieved by exclusively predicting the largest class in the dataset) was calculated. The baseline for all alliance categories was only 0.2007, confirming that the OA of 0.5125 represents genuine pattern extraction. Overfitting was observed after training, characterized by poor generalization ability and weak classification capability when confronted with previously unseen data. These metrics suggest that while the model was able to capture some underlying patterns in the data, its ability to make accurate and reliable predictions across all categories was limited. The relatively low F1 score further indicates imbalanced performance, with the model struggling particularly on minority classes or categories with subtle distinctions. To further investigate this per-class behavior, a detailed 32 × 32 confusion matrix is provided in Appendix A, and the specific class-level evaluation metrics alongside sample sizes are detailed in Table S2. The matrix confirms that while dominant alliances maintain stable predictions, the extreme lack of test samples for sparse categories in this long-tailed dataset leads to concentrated misclassifications among structurally similar alliances.
To investigate the effect of classification granularity, we first trained the model to classify vegetation at a higher taxonomic level (i.e., vegetation formation instead of alliance). As the taxonomic level increased, some categories were merged, reducing the total number of classes from 32 to 9. This coarser-level classification led to a noticeable improvement in model performance, with an OA of 0.6667, weighted precision of 0.6743, weighted recall of 0.6667, and weighted F1 score of 0.6684. Corresponding bootstrap evaluation at this formation level produced a mean OA of 0.6777 (95% CI: [0.6201, 0.7312]) and a mean weighted F1-Score of 0.6740 (95% CI: [0.6182, 0.7266]). Similarly, the majority class baseline for the formation level was calculated to be 0.2652, demonstrating that the model’s performance significantly exceeded baseline guessing. This finding suggests that the model performs more reliably when distinguishing broader vegetation groups, while finer-grained classification into alliances presents greater challenges.
The DNN achieved an OA of 0.5125, a balanced accuracy of 0.3746 and a weighted F1-Score of 0.4930 on the independent test set. To assess the performance gain, we compared these results with two RF baselines, as shown in Table 2, all tests used exactly the same training/test dataset. The initial RF model utilizing static features (RF-Static) yielded significantly lower metrics across the board, with the proposed deep learning approach outperforming it by 17.92 percentage points in OA. Notably, when the RF classifier was fed the same multi-source multi-temporal data (RF-MSMT), it achieved a marginally higher OA of 0.5595, but suffered a severe drop in macro-averaged metrics (e.g., yielding a macro F1-Score of only 0.2276). This extreme discrepancy between OA and the macro-averaged metrics indicates that the traditional RF classifier struggles with class imbalance and overfits the majority classes when processing high-dimensional temporal datasets. These results indicate that the DNN can extract complex, non-linear features from multi-source data to provide a significantly more balanced performance across all classes.
An ablation study was conducted to evaluate key architectural components (Table 3). First, replacing the hierarchical classification with a flat training approach decreased the fine-grained alliance-level overall accuracy from 0.5125 to 0.4552, confirming that stepwise classification effectively reduces confusion among ecologically similar alliances. Second, substituting the custom Focal Loss with a standard Categorical Cross-Entropy (CCE) loss reduced accuracy to 0.4373, demonstrating the necessity of Focal Loss in mitigating class imbalance. Finally, removing the Batch Normalization and Dropout layers caused severe model degradation (accuracy plummeted to 0.2007), proving these regularization techniques are indispensable for stable feature extraction.

3.2. Vegetation Alliance Mapping

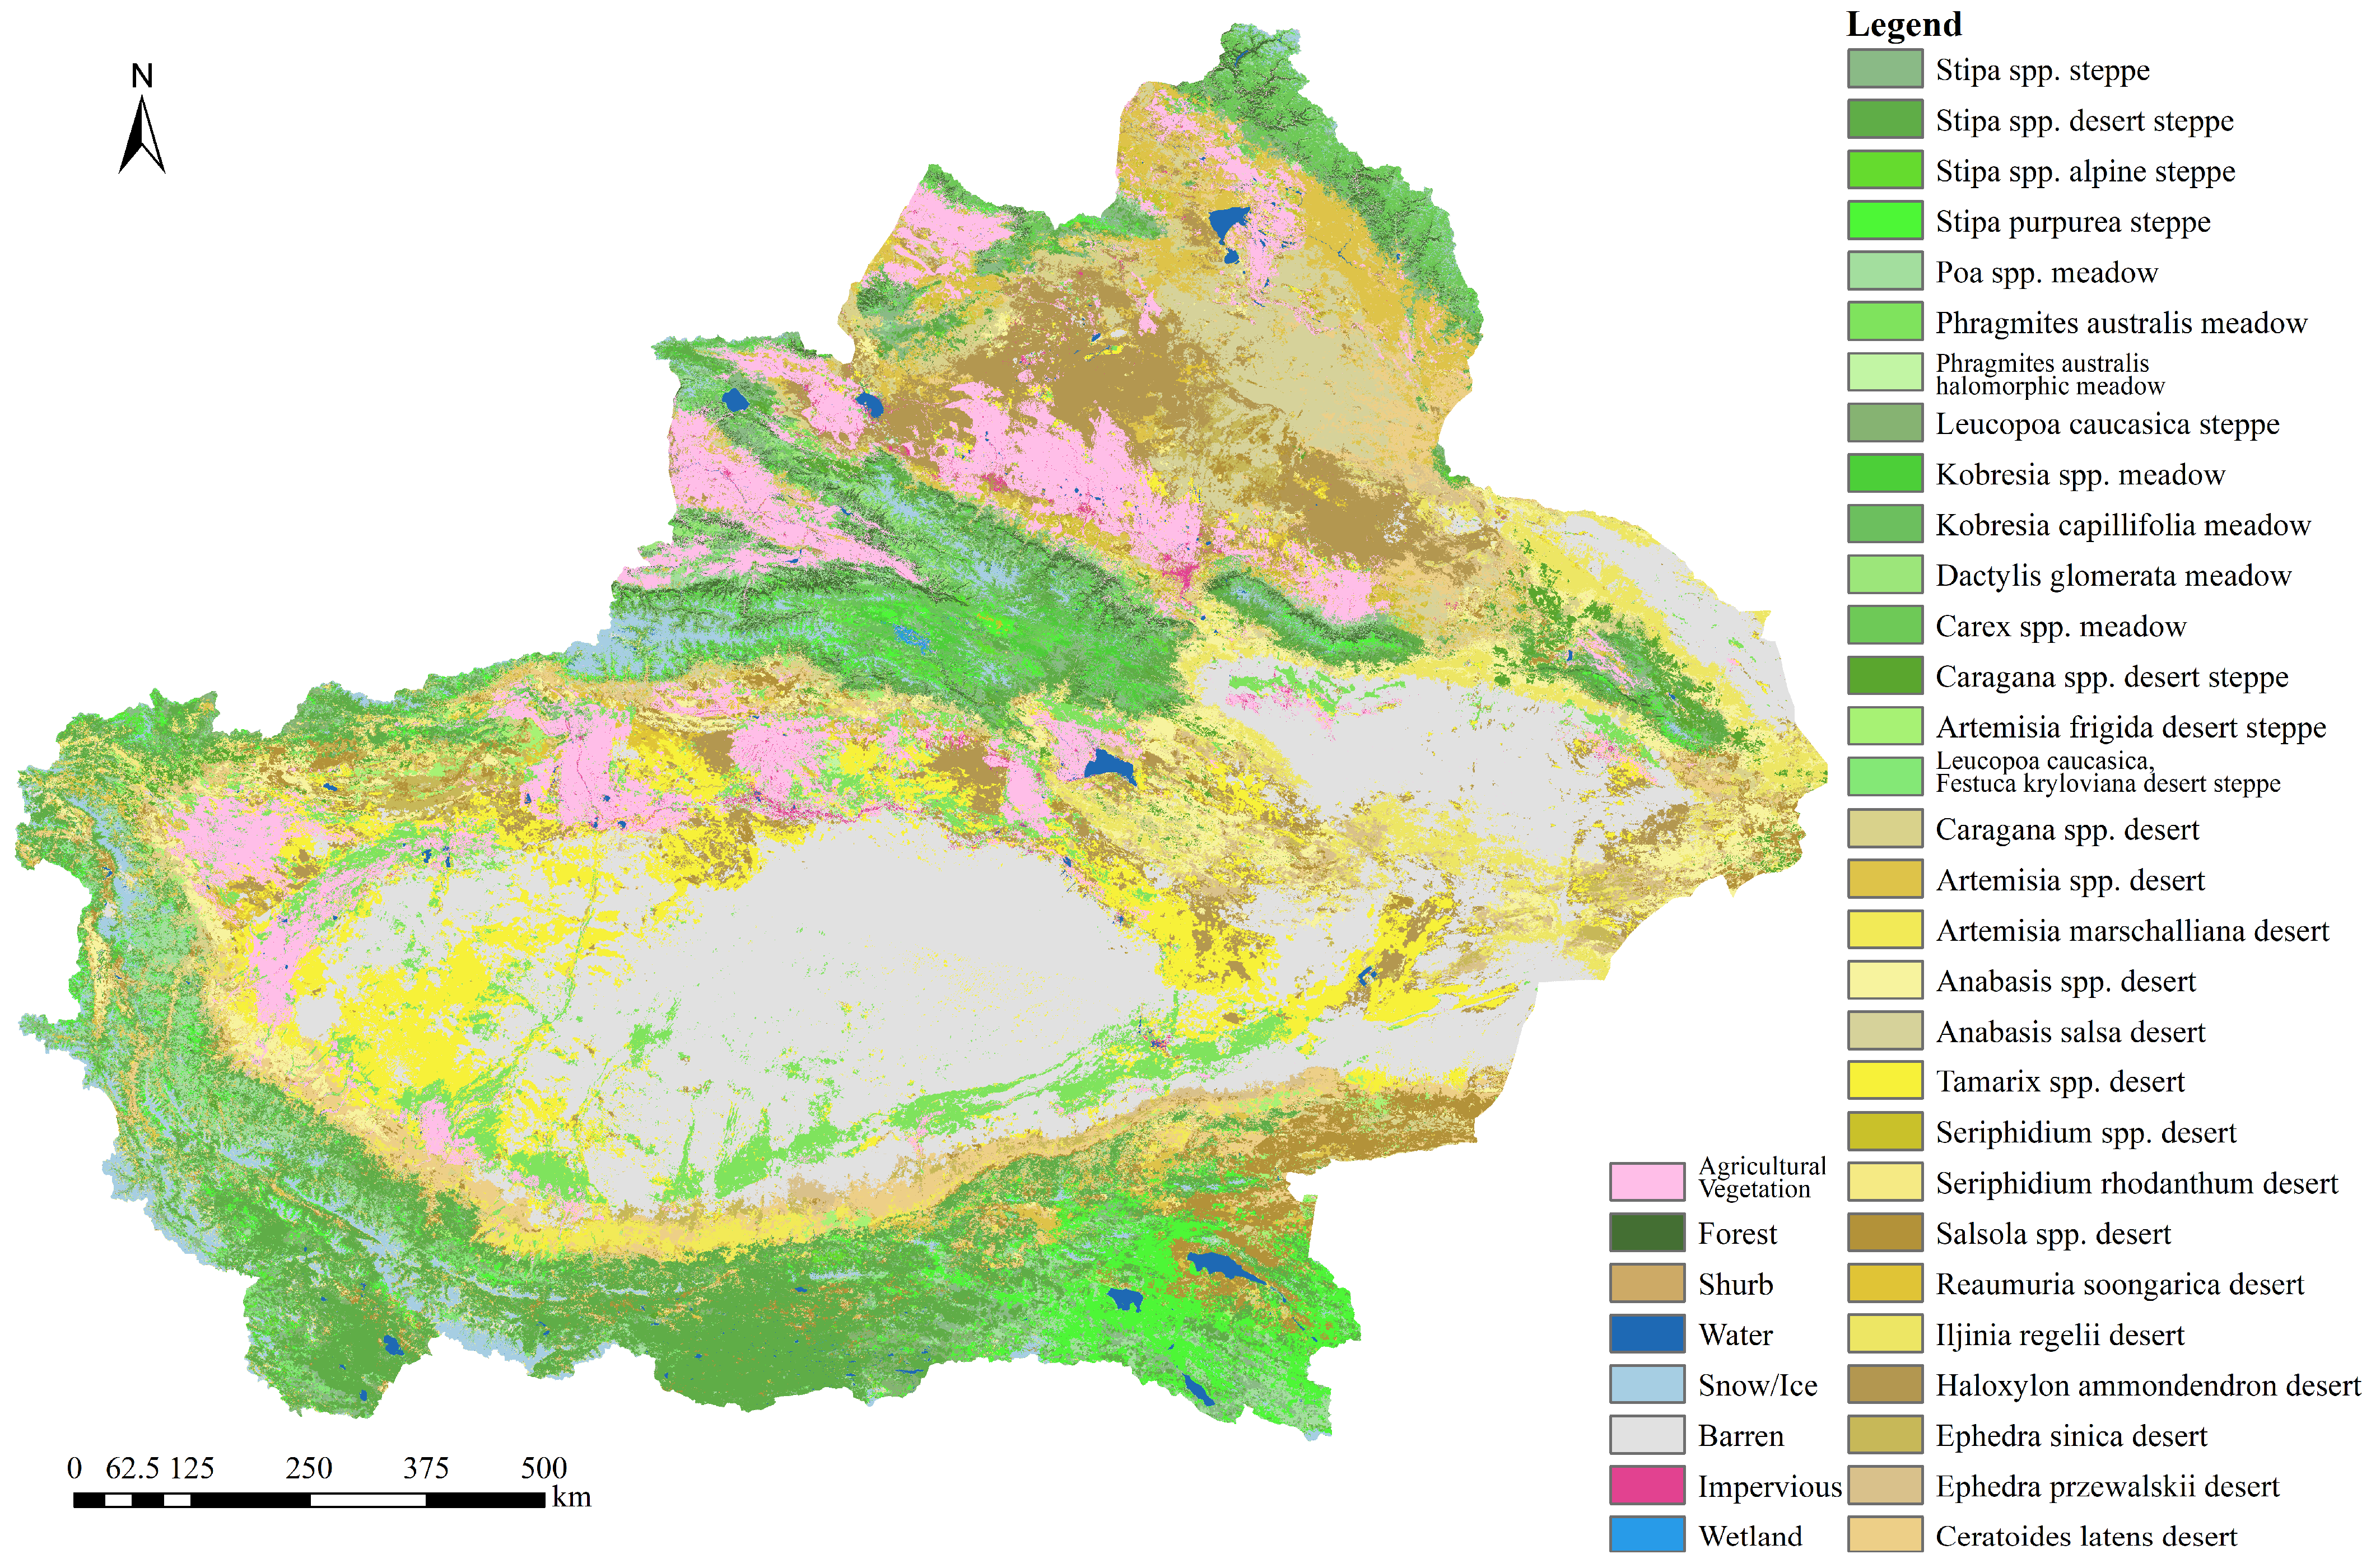
The primary outcome of this research is the Vegetation Alliance Map of Xinjiang, presented in Figure 4 (the original raster file and attribute table are provided in Data S1). A total of 32 vegetation alliances were identified and mapped. The five largest alliance types by area are: Stipa spp. desert steppe (65,944.71 km2, 17.53% of total vegetation area in Xinjiang), widely distributed in the mountainous regions of Xinjiang; Stipa spp. steppe (33,862.11 km2, 9.00%), primarily located in the Altai, Tianshan and Altun Mountains; Poa spp. meadow (27,948.18 km2, 7.43%) d found throughout the mountain areas of Xinjiang; Artemisia spp. desert (23,461.15 km2, 6.23%), primarily found in the Altun and Northern Tianshan Mountains, with scattered patches in the Tianshan and Kunlun Mountains; and Stipa purpurea steppe (227,46.37052 km2, 6.05%), distributed across the alpine regions of Xinjiang. As the most current classification of Xinjiang vegetation at the alliance level, this map offers valuable insights into the structure and spatial patterns of plant communities in arid and semi-arid regions.

3.3. Vegetation Formation Classification

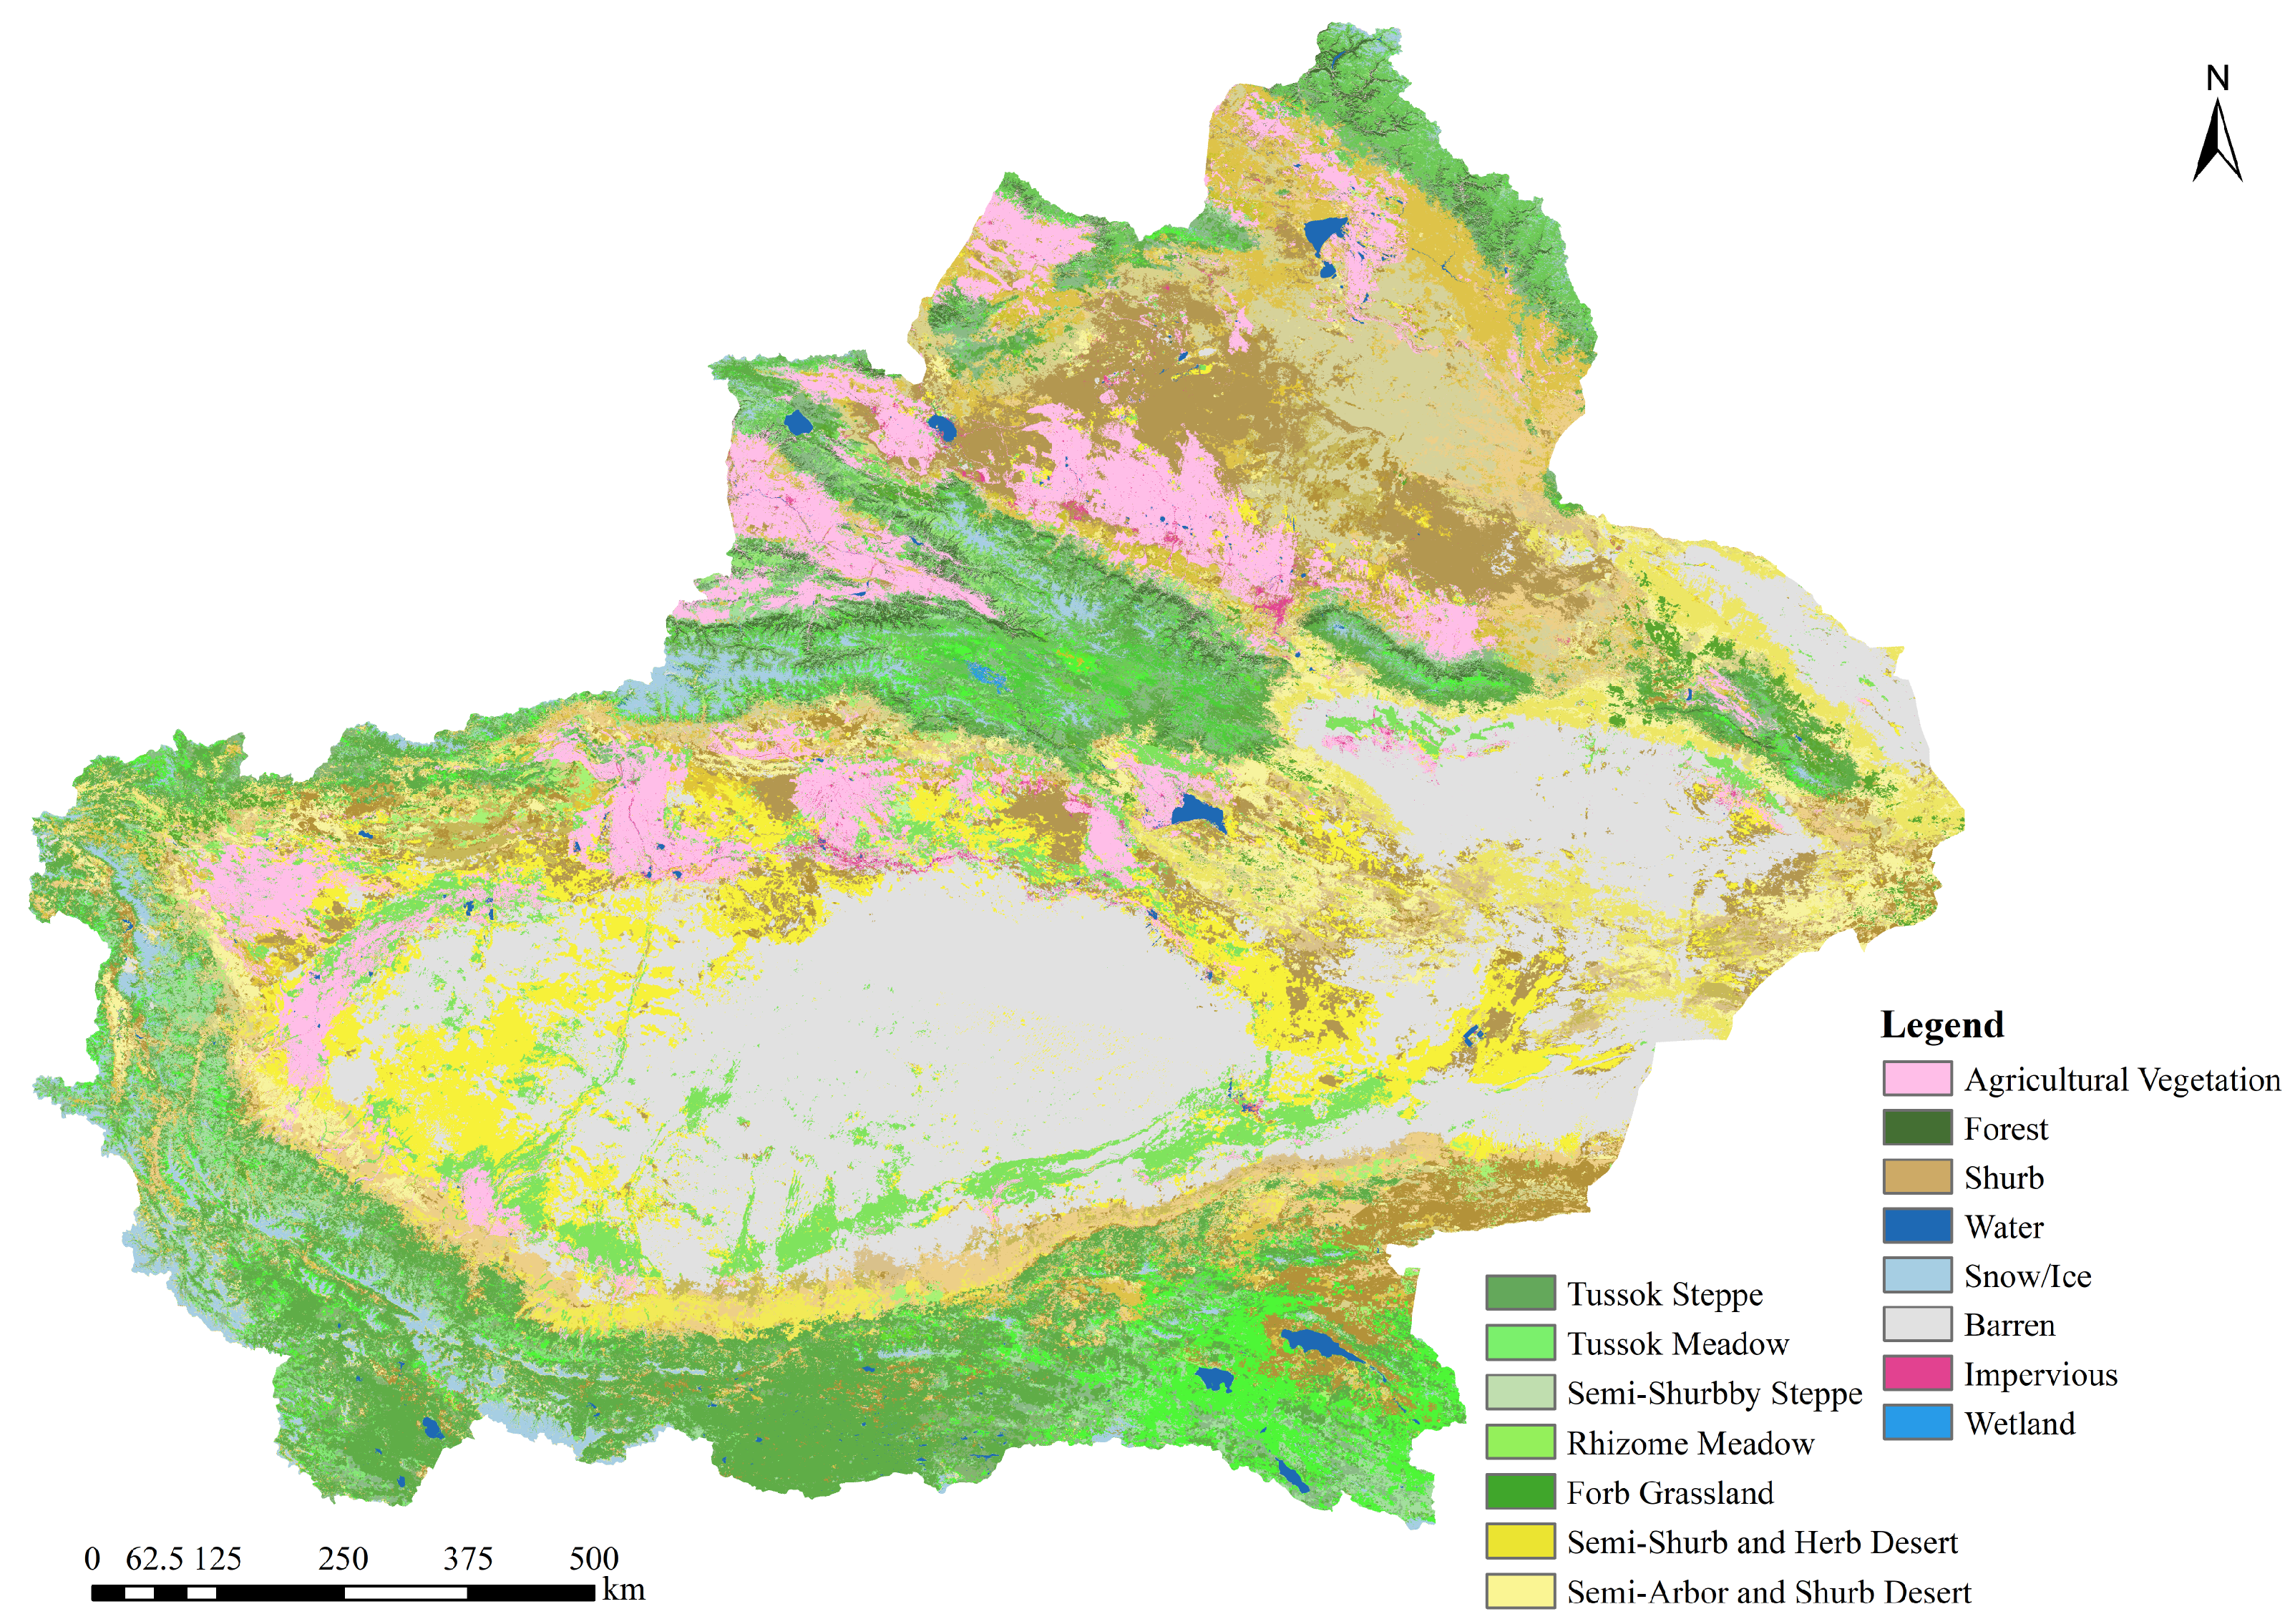
For a broader classification perspective, the corresponding vegetation formation map is shown in Figure 5. A total of nine vegetation formations were identified. Excluding two non-natural vegetation types (Agricultural Vegetation and Barren) that merely served for boundary delineation, the remaining seven natural vegetation formations are ranked by area from largest to smallest as follows: Tussock Steppe (163,216.66 km2), mainly found in the Tianshan and Kunlun Mountains, with scattered distribution in other mountain ranges; Semi-Shrub and Herb Desert (88,597.11 km2), widely distributed across Xinjiang; Rhizome Meadow (35,027.10 km2), distributed throughout various mountainous regions; Semi-Arbor and Shrub Desert (21,358.16 km2), primarily located around the Junggar and Tarim Basins; Tussock Meadow (18,042.79 km2), with a distribution pattern similar to the Rhizome Meadow; Forb Grassland (6642.46 km2), found in the Altun Mountains, Kunlun and Tianshan Mountains; and Semi-Shrubby Steppe (4027.02 km2), with a distribution similar to the previous type.
This higher-level classification reveals large-scale vegetation patterns. Moreover, classifying vegetation at broader hierarchical levels tends to yield better results, as class boundaries are more distinct and spectral confusion is reduced.

4. Discussion

4.1. Advantages of the Mapping Approach

This study represents a significant advancement in vegetation mapping by integrating multi-source remote sensing data with deep learning techniques, which is increasingly recognized as a paradigm shift in large-scale ecological mapping [37]. Compared with traditional approaches that often rely on manual interpretation or simpler classification algorithms, our method offers notable improvements in efficiency and scalability. By utilizing multi-source and multi-temporal remote sensing habitat data, including spectral information, vegetation indices, topographic features, and climatic variables; and employing deep learning to process complex, high-dimensional data, the study achieves fine-grained vegetation classification at the alliance level. A hierarchical classification strategy was adopted, which first distinguishes broader vegetation formations and then refines the classification to specific alliances. This stepwise approach reduces confusion among visually similar classes and improves overall classification accuracy, aligning with recent studies which demonstrate that hierarchical frameworks effectively mitigate spectral confusion in highly heterogeneous landscapes [38]. Despite relying on a limited number of training samples, the method delivers robust classification performance across diverse vegetation alliances. Moreover, the resulting map is designed to be updatable, allowing for continuous refinement as new data become available. This dynamic capability is essential for the effective monitoring and management of ecosystems in Xinjiang, particularly in the context of global environmental change and increasing anthropogenic pressures in arid regions [39]. To contextualize these advantages, compared to established alliance-level mapping programs like VegCAMP [40], which achieve high precision through resource-intensive manual interpretation, our methodology prioritizes spatial scalability. By automating feature extraction, this approach enables rapid mapping and continuous updating across the vast expanse of Xinjiang.
Furthermore, the comparison with the Random Forest baseline (OA: 33.3%) demonstrates the distinct advantage of deep learning in this specific task. Vegetation alliances in arid regions often exhibit subtle spectral and environmental separability. The hierarchical DNN architecture successfully extracted abstract feature representations that traditional classifiers failed to capture, thereby justifying the computational complexity of the deep learning approach, and corroborating broader findings that DNNs excel at modeling highly non-linear ecological gradients where shallow algorithms typically underperform [41].

4.2. Distribution Patterns of Vegetation on Xinjiang

Previous field-based studies have confirmed the localized presence of major vegetation alliances in Xinjiang, supporting the reliability of our mapping results. Specifically, Stipa spp. have been reported in the Shaertao Mountains, Tianshan Mountains, Altai Mountains, and Junggar Basin [42,43]; Poa annua has been documented in the Altai Mountains and the southern Tianshan Mountains [44,45]; Artemisia spp. have been verified in the Altai Mountains and around Sayram Lake (on the northern side of the Tianshan Mountains) [46,47]; and Stipa purpurea has been observed in the Kunlun Mountains [48]. These site-specific observations align well with the spatial patterns identified in our map.
The grassland alliance map generated in this study reveals distinct spatial distribution patterns that align well with known ecological gradients in Xinjiang and, in many cases, show consistency with the Vegetation Map of China [49]. We compared several typical vegetation alliances in Xinjiang’s arid regions and large-area alliances. Tamarix spp. desert, a typical shrub desert in arid regions [50,51], is similarly distributed as in the existing map, mainly distributed around the Tarim Basin, with occasional occurrences in the Junggar and Turpan Basins. Haloxylon ammodendron desert, a representative salt-tolerant shrub desert [52], is also primarily distributed in the Junggar Basin, unlike the previous map, our results show some presence in the northern part of Turpan and Tarim Basins well. Several field survey points located east of Bosten Lake further confirm its occurrence in this region. Stipa spp. desert steppe and Stipa spp. steppe, the two largest alliances by area, is widely distributed across the Altai Mountains, Tianshan Mountains, and Kunlun Mountains, reflecting its adaptation to semi-arid environments [53]. Similar to the existing map, Artemisia spp. desert is primarily distributed in the Altai Mountains, with scattered occurrences in the Tianshan and Kunlun Mountains. Overall, while our results exhibit a general trend consistent with the vegetation distribution from decades ago, they also capture shifts in the distributional ranges of specific alliances. Supported by both ground surveys and recent literature, the newly generated map effectively characterizes the current status and dynamic changes in the vegetation.
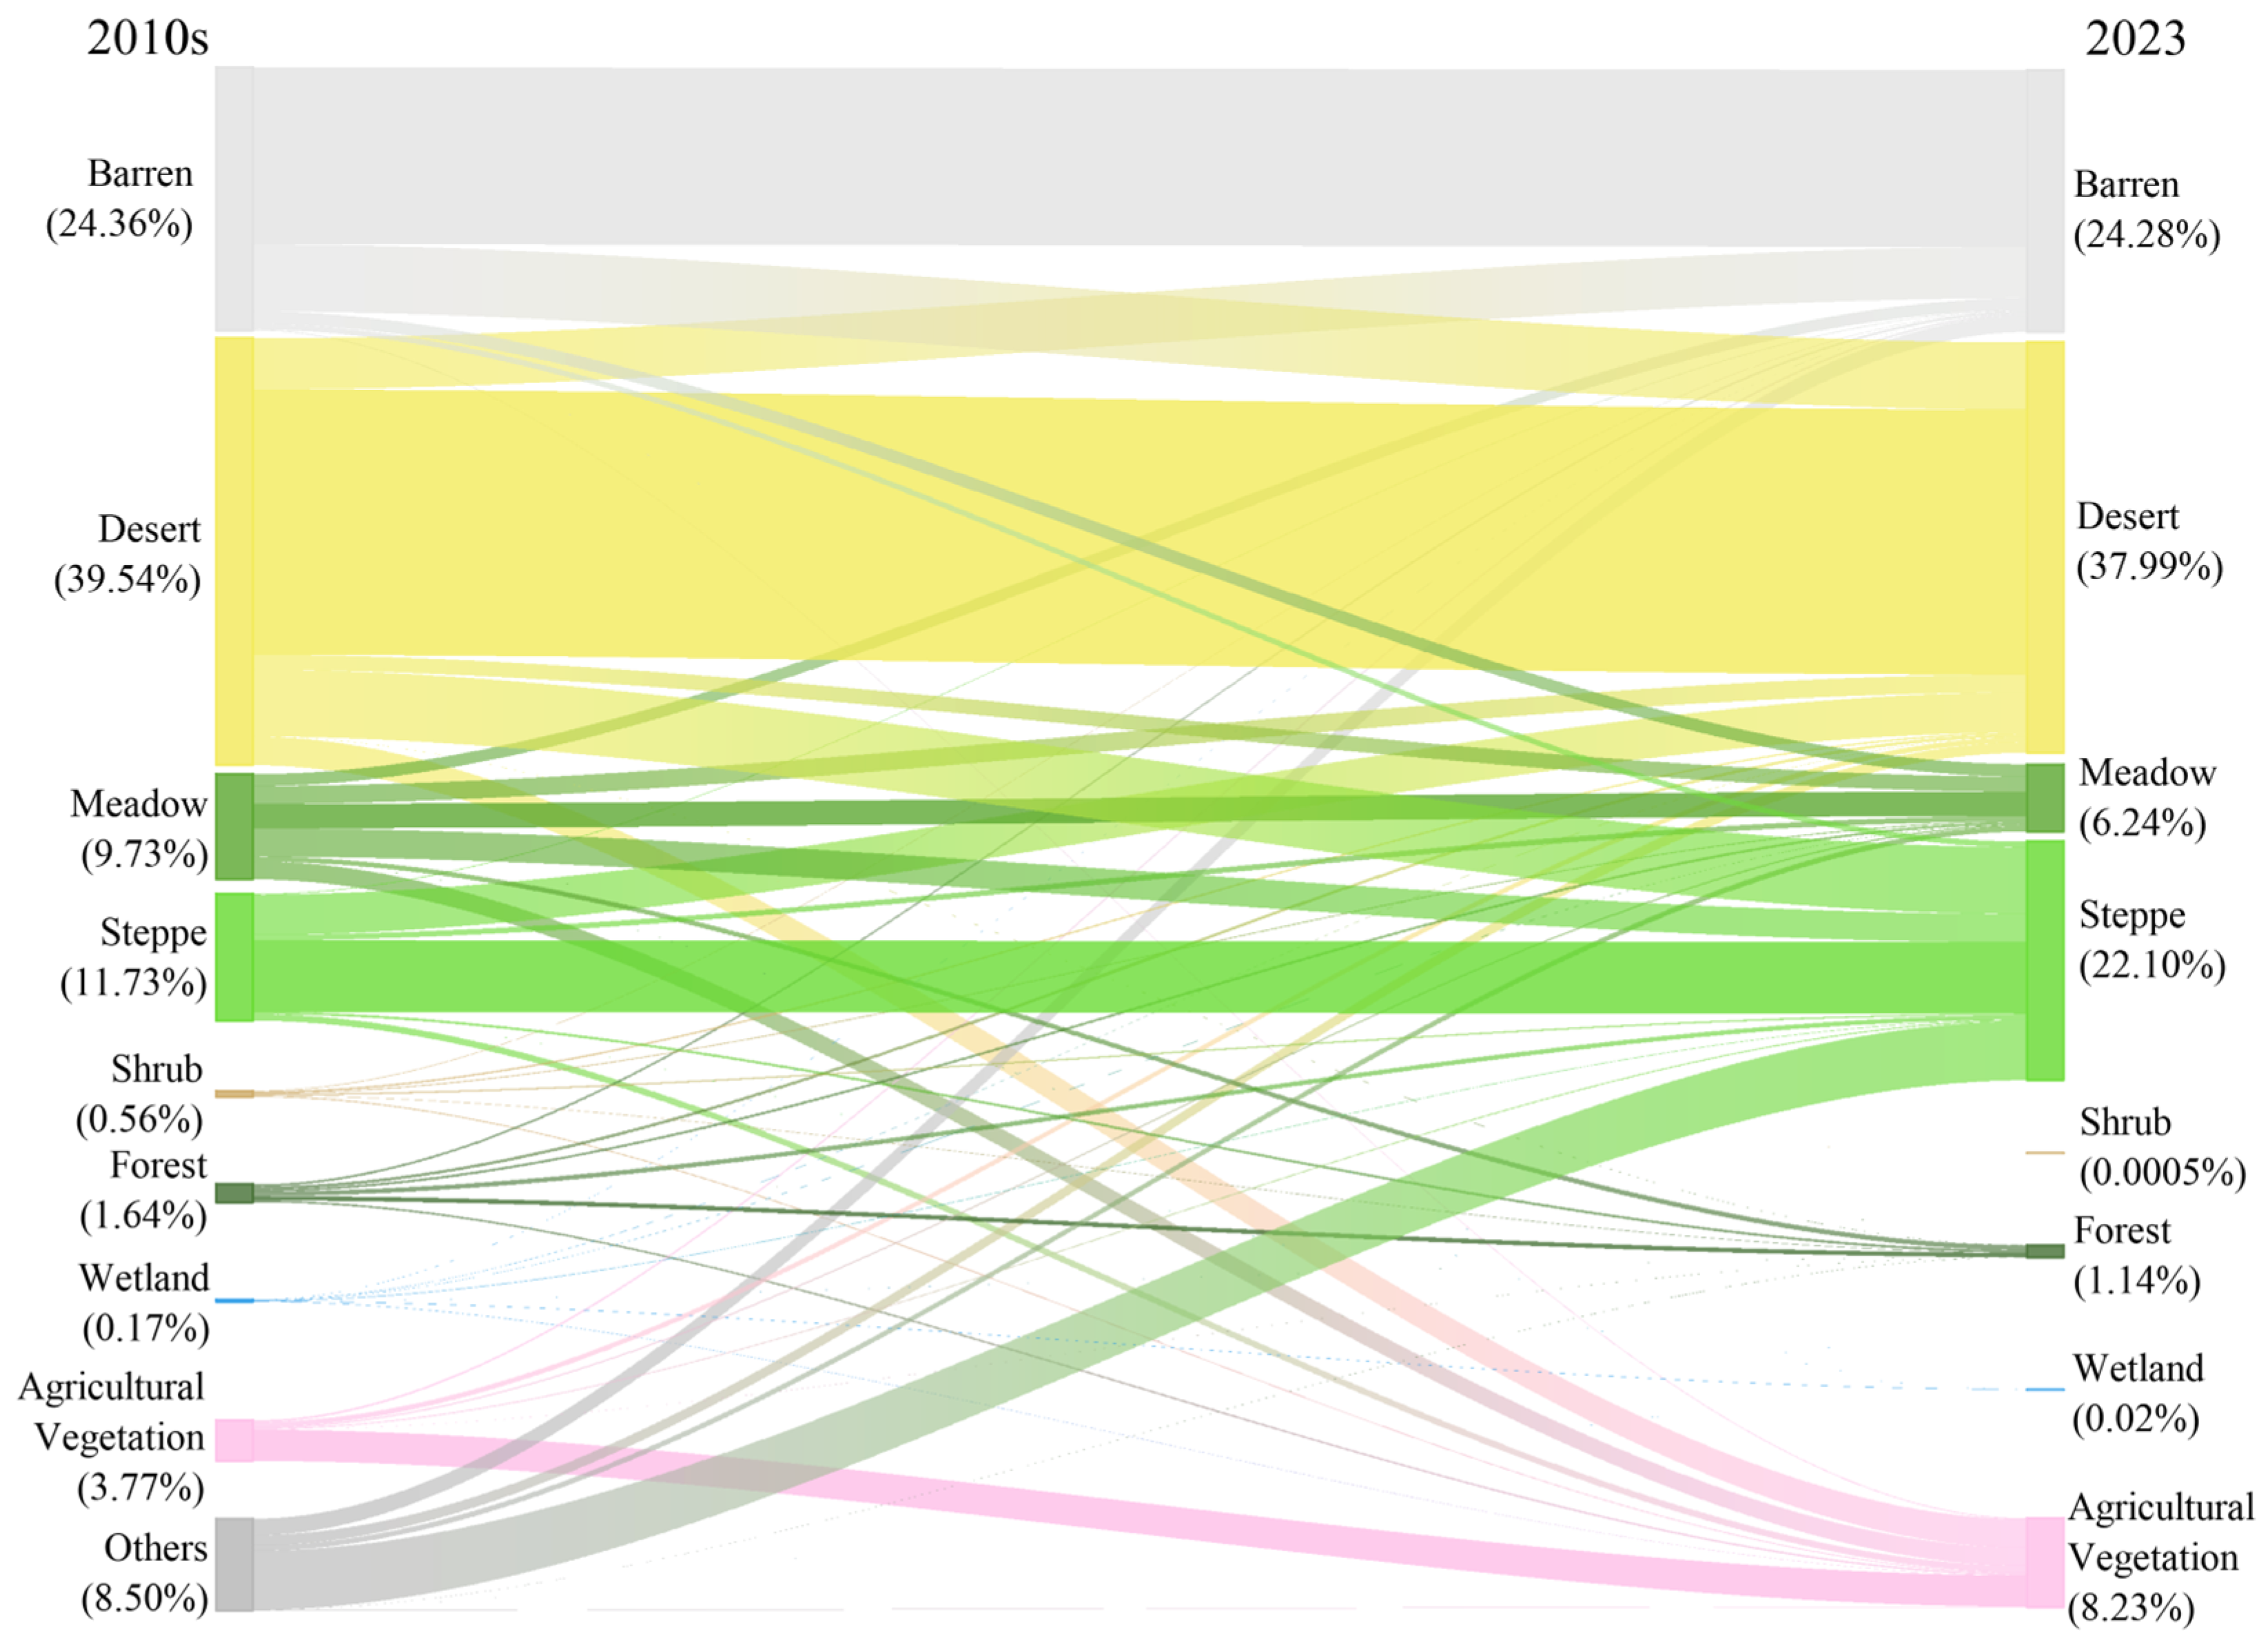
The vegetation type area changes from the 2010s (based on the Vegetation Map of China 1:1,000,000 [49]) to 2023 (derived from our mapping results) are presented in Figure 6, the primary changes include:
(1)
Overall Greening: Xinjiang exhibited an overall greening trend [54]. In areas where grassland growth improved, the contribution of climate change was slightly higher than that of human activities, whereas in areas of grassland reduction or degradation, human activities played the dominant role [55].
(2)
Minimal Change in Desert Area: The total desert area remained relatively stable. Although previous studies indicate a significant increase in NDVI within desert regions, the fundamental attributes of the desert ecosystem remain unchanged [54].
(3)
Significant Cropland Expansion: Cropland area expanded markedly, primarily driven by the conversion of large amounts of low-coverage grasslands into agricultural land [56].
Figure 6. Vegetation type changes from 2010s to 2023. (Left) based on the Vegetation Map of China (1:1,000,000 [49])) in the 2010s; (Right) our mapping results in 2023.
Remotesensing 18 02880 g006

4.3. Limitations and Future Directions

Despite achieving improved mapping accuracy, several limitations remain. The first concerns ground survey data, which serves as the foundation for mapping. We conducted a large-scale field campaign involving two expedition teams and approximately 30 researchers over two months. This effort yielded 1830 in situ ground survey points across Xinjiang, exceeding the number of field-collected samples in many comparable vegetation mapping studies [6,57,58]. However, the fine-grained classification of 32 vegetation alliances inevitably resulted in fewer samples for certain rare categories. This class imbalance constrained the accuracy of minority classes, even though the overall model performance was robust. Since significantly increasing the sample size is restricted by labor and time constraints, we designed this vegetation map as an updatable system. This design allows for iterative upgrades to the map as new field data becomes available.
The second aspect involves model development. We employed a modern deep learning framework and optimization techniques such as Focal Loss, which improved accuracy by 17.92% compared to the Random Forest baseline. Nevertheless, the field of artificial intelligence is evolving efficiently, with many newer and more powerful models constantly emerging. Future work will focus on testing and selecting these advanced models to further enhance classification precision.
Third, regarding data resolution, obtaining high-spatial-resolution coverage for the vast Xinjiang region remains challenging. Consequently, this study prioritized high-temporal-resolution data to capture phenological features. Future research aims to integrate higher spatial resolution imagery to reduce mixed-pixel effects and improve mapping detail.
Fourth, regarding classification errors, occasional misclassifications primarily stem from ecological transition zones and mixed pixels. For instance, Phragmites australis meadows and Phragmites australis halomorphic meadows are sometimes confused due to identical species composition and transitional soil conditions. While such confusion is an inherent challenge of fine-grained alliance level mapping, this granularity captures unprecedented ecological detail.
Ultimately, this study proposes a flexible framework where ground data, remote sensing features, and deep learning algorithms are treated as modular components. As ground sampling expands, model architectures evolve, and remote sensing capabilities improve, the resulting vegetation map can be continuously updated and upgraded.

5. Conclusions

This study presents a robust framework for fine-grained vegetation mapping in arid and semi-arid areas by integrating ecological field survey data with multi-source remote sensing variables using deep learning techniques. By constructing a hierarchical DNN, we successfully produced a vegetation map of Xinjiang at the alliance level, identifying 32 distinct vegetation alliances. This outcome represents a significant taxonomic refinement over traditional land cover products that typically rely on broad vegetation formation groups.
The proposed methodology demonstrates distinct advantages over existing approaches. First, regarding classification granularity, we employed a hierarchical classification strategy that progresses from broad formations to specific alliances. This multi-level approach effectively distinguished between visually and ecologically similar communities, successfully mapping dominant alliances such as Stipa spp. desert steppe and Tamarix spp. desert with high ecological relevance. Second, in terms of accuracy, the deep learning approach significantly outperformed the traditional Random Forest baseline by improving OA by 17.92% (0.5125 vs. 0.3333). This performance confirms that the DNN architecture is far more capable of capturing non-linear relationships and abstract feature representations from complex, high-dimensional habitat data, including phenology, topography, and climate, than conventional machine learning classifiers. Finally, this method offers superior efficiency and scalability. By automating the interpretation process and treating ground data and remote sensing features as modular components, the workflow overcomes the labor-intensive constraints of traditional field-based mapping, creating an updatable system that can be iteratively refined.
While the current model performance is constrained by the imbalance of field samples for rare categories, this study validates the feasibility of using deep learning for large-scale, high-resolution ecological monitoring. Future work will focus on expanding the field dataset, incorporating spatial contextual information, and exploring advanced model architectures to further elevate classification precision and support dynamic ecosystem management in Xinjiang.

Supplementary Materials

The following supporting information can be downloaded at: https://www.mdpi.com/article/10.3390/rs18172880/s1, Table S1: The detailed rules used to merge the original 75 alliances into 32 classes; Table S2: Class-level evaluation metrics (precision, recall, and F1-score), alongside training and test sample sizes (support), for the 32 vegetation alliances; Data S1: The original 2023 vegetation alliance map in .tif format and its corresponding attribute table.

Author Contributions

Conceptualization, B.D., R.H. and X.C.; methodology, B.D.; software, B.D. and R.H.; validation, B.D. and R.H.; formal analysis, B.D.; investigation, X.S., Z.P., C.L., B.D., R.L. and Z.Z.; resources, Y.W., X.S. and R.H.; data curation, Z.P., C.L., Z.Z., B.D. and R.L.; writing—original draft preparation, B.D.; writing—review and editing, R.H. and X.C.; visualization, B.D., R.L. and R.H.; supervision, Y.W., X.C., Y.H., K.X. and R.H.; project administration, Y.W., X.C., Y.H., K.X., X.S. and R.H.; funding acquisition, X.S. and R.H. All authors have read and agreed to the published version of the manuscript.

Funding

This work was supported by the Third Xinjiang Scientific Expedition Program Grant (2022xjkk0402); the Joint Research on Ecological Conservation and High-Quality Development of the Yellow River Basin program (2022-YRUC-01-0102); the Youth Innovation Promotion Association of the Chinese Academy of Sciences; and Xiaomi Young Scholar Program.

Data Availability Statement

The data supporting the conclusions of this article will be made available by the authors on request.

Acknowledgments

We acknowledge the ASTER GDEM data from Japan’s Ministry of Economy, Trade, and Industry (METI), Japan Aerospace Exploration Agency (JAXA) and National Aeronautics and Space Administration (NASA). We also thank the MODIS data provided by NASA. During the preparation of this work the authors used ChatGPT (version GPT-4o, OpenAI, San Francisco, CA, USA), Gemini (version 3.1 Pro, Google LLC, Mountain View, CA, USA) and DeepSeek (version V3, Hangzhou DeepSeek Artificial Intelligence Co., Ltd., Hangzhou, China) in order to improve clarity, grammar, and overall writing quality. After using this tool, the authors reviewed and edited the content as needed and take full responsibility for the content of the publication.

Conflicts of Interest

The authors declare no conflict of interest.

Abbreviations

The following abbreviations are used in this manuscript:
LULCLand Use and Land Cover
DNNDeep neural network
CLCDChina land cover dataset
GEEGoogle Earth Engine
DEMDigital elevation model
EVIEnhanced vegetation index
NDVINormalized difference vegetation index
GPPGross primary productivity
LAILeaf area index
FPARfraction of photosynthetically active radiation
FC layerfully connected layer
ReLURectified Linear Unit
BNbatch normalization
RFRandom Forest

Appendix A

This appendix provides the detailed confusion matrices for the vegetation classification models evaluated on the independent test set. Figure A1 illustrates the classification performance across the nine broader vegetation formations, demonstrating relatively stable and accurate predictions for the major categories. Figure A2 presents the comprehensive 32 × 32 confusion matrix for the fine-grained vegetation alliances. As discussed in the main text, while dominant alliances show strong diagonal clustering, the matrices clearly highlight the classification challenges associated with the long-tailed distribution of the field dataset, where minority classes with extremely limited test samples often exhibit concentrated misclassifications among ecologically and structurally similar communities in Xinjiang.
Figure A1. Confusion matrix for the nine vegetation formations evaluated on the independent test set.
Remotesensing 18 02880 g0a1
Figure A2. Confusion matrix for the 32 fine-grained vegetation alliances evaluated on the independent test set.
Remotesensing 18 02880 g0a2

References

  1. Xie, Y.; Sha, Z.; Yu, M. Remote Sensing Imagery in Vegetation Mapping: A Review. J. Plant Ecol. 2008, 1, 9–23. [Google Scholar] [CrossRef] [Scilit]
  2. Roy, P.; Behera, M.; Murthy, M.; Roy, A.; Singh, S.; Kushwaha, S.; Jha, C.; Sudhakar, S.; Joshi, P.; Reddy, C.; et al. New Vegetation Type Map of India Prepared Using Satellite Remote Sensing: Comparison with Global Vegetation Maps and Utilities. Int. J. Appl. Earth Obs. Geoinf. 2015, 39, 142–159. [Google Scholar] [CrossRef] [Scilit]
  3. Guo, Q.; Guan, H.; Hu, T.; Jin, S.; Su, Y.; Wang, X.; Wei, D.; Ma, Q.; Sun, Q. Remote Sensing-Based Mapping for the New Generation of Vegetation Map of China (1:500,000). Sci. Sin. Vitae 2021, 51, 229–241. [Google Scholar] [CrossRef] [Scilit]
  4. Michler, L.M.; Kaczensky, P.; Ploechl, J.F.; Batsukh, D.; Baumgartner, S.A.; Battogtokh, B.; Treydte, A.C. Moving Toward the Greener Side: Environmental Aspects Guiding Pastoral Mobility and Impacting Vegetation in the Dzungarian Gobi, Mongolia. Rangel. Ecol. Manag. 2022, 83, 149–160. [Google Scholar] [CrossRef] [Scilit]
  5. Muthoka, J.M.; Rowhani, P.; Salakpi, E.E.; Balzter, H.; Antonarakis, A.S. Classification of Grassland Community Types and Palatable Pastures in Semi-Arid Savannah Grasslands of Kenya Using Multispectral Sentinel-2 Imagery. Front. Sustain. Food Syst. 2025, 9, 1543491. [Google Scholar] [CrossRef] [Scilit]
  6. Yao, Y.; Suonan, D.; Zhang, J. Compilation of 1:50,000 Vegetation Type Map with Remote Sensing Images Based on Mountain Altitudinal Belts of Taibai Mountain in the North-South Transitional Zone of China. J. Geogr. Sci. 2020, 30, 267–280. [Google Scholar] [CrossRef] [Scilit]
  7. Erinjery, J.; Singh, M.; Kent, R. Mapping and Assessment of Vegetation Types in the Tropical Rainforests of the Western Ghats Using Multispectral Sentinel-2 and SAR Sentinel-1 Satellite Imagery. Remote Sens. Environ. 2018, 216, 345–354. [Google Scholar] [CrossRef] [Scilit]
  8. Foody, G. Status of Land Cover Classification Accuracy Assessment. Remote Sens. Environ. 2002, 80, 185–201. [Google Scholar] [CrossRef] [Scilit]
  9. Zhai, D.; Huang, Z.; Peng, N.; He, Q.; Yang, S.; Fan, W. Ecosystem Service Classification of Vegetation in North Tianshan Mountain, Xinjiang, China. In Proceedings of the IGARSS 2024—2024 IEEE International Geoscience and Remote Sensing Symposium, Athens, Greece, 7–12 July 2024; pp. 4744–4747. [Google Scholar]
  10. Zhang, J.; Wu, S.; Liu, M. Land Cover Remote Sensing Mapping in Xinjiang. Arid. Zone Res. 2015, 32, 791–796. [Google Scholar]
  11. Lim, Y.-K.; Cai, M.; Kalnay, E.; Zhou, L. Impact of Vegetation Types on Surface Temperature Change. J. Appl. Meteorol. Climatol. 2008, 47, 411–424. [Google Scholar] [CrossRef] [Scilit]
  12. Seneviratne, S.; Corti, T.; Davin, E.; Hirschi, M.; Jaeger, E.; Lehner, I.; Orlowsky, B.; Teuling, A. Investigating Soil Moisture-Climate Interactions in a Changing Climate: A Review. Earth-Sci. Rev. 2010, 99, 125–161. [Google Scholar] [CrossRef] [Scilit]
  13. Ayhan, B.; Kwan, C.; Budavari, B.; Kwan, L.; Lu, Y.; Perez, D.; Li, J.; Skarlatos, D.; Vlachos, M. Vegetation Detection Using Deep Learning and Conventional Methods. Remote Sens. 2020, 12, 2502. [Google Scholar] [CrossRef] [Scilit]
  14. Vali, A.; Comai, S.; Matteucci, M. Deep Learning for Land Use and Land Cover Classification Based on Hyperspectral and Multispectral Earth Observation Data: A Review. Remote Sens. 2020, 12, 2495. [Google Scholar] [CrossRef] [Scilit]
  15. Yuan, Q.; Shen, H.; Li, T.; Li, Z.; Li, S.; Jiang, Y.; Xu, H.; Tan, W.; Yang, Q.; Wang, J.; et al. Deep Learning in Environmental Remote Sensing: Achievements and Challenges. Remote Sens. Environ. 2020, 241, 111716. [Google Scholar] [CrossRef] [Scilit]
  16. Karra, K.; Kontgis, C.; Statman-Weil, Z.; Mazzariello, J.C.; Mathis, M.; Brumby, S.P. Global Land Use/Land Cover with Sentinel 2 and Deep Learning. In Proceedings of the 2021 IEEE International Geoscience and Remote Sensing Symposium IGARSS, Virtual, 11–16 July 2021; IEEE: Brussels, Belgium, 2021; pp. 4704–4707. [Google Scholar]
  17. Kussul, N.; Lavreniuk, M.; Skakun, S.; Shelestov, A. Deep Learning Classification of Land Cover and Crop Types Using Remote Sensing Data. IEEE Geosci. Remote Sens. Lett. 2017, 14, 778–782. [Google Scholar] [CrossRef] [Scilit]
  18. NASA/METI/AIST/Japan Spacesystems; U.S./Japan ASTER Science Team. ASTER Global Digital Elevation Model V003; NASA Land Processes Distributed Active Archive Center: Sioux Falls, SD, USA, 2019. [Google Scholar]
  19. Zhang, R.; Liang, T.; Guo, J.; Xie, H.; Feng, Q.; Aimaiti, Y. Grassland Dynamics in Response to Climate Change and Human Activities in Xinjiang from 2000 to 2014. Sci. Rep. 2018, 8, 2888. [Google Scholar] [CrossRef] [Scilit] [PubMed]
  20. Yang, J.; Huang, X. The 30 m Annual Land Cover Datasets and Its Dynamics in China from 1985 to 2023. Available online: https://zenodo.org/records/12779975 (accessed on 1 November 2024).
  21. Guo, K.; Fang, J.; Wang, G.; Tang, Z.; Xie, Z.; Shen, Z.; Wang, R.; Qiang, S.; Liang, C.; Da, L.; et al. A Revised Scheme of Vegetation Classification System of China. Chin. J. Plant Ecol. 2020, 44, 111–127. [Google Scholar] [CrossRef] [Scilit]
  22. Gorelick, N.; Hancher, M.; Dixon, M.; Ilyushchenko, S.; Thau, D.; Moore, R. Google Earth Engine: Planetary-Scale Geospatial Analysis for Everyone. Remote Sens. Environ. 2017, 202, 18–27. [Google Scholar] [CrossRef] [Scilit]
  23. Didan, K. MODIS/Terra Vegetation Indices 16-Day L3 Global 250m SIN Grid V061; NASA Land Processes Distributed Active Archive Center: Sioux Falls, SD, USA, 2021. [Google Scholar]
  24. Running, S.; Mu, Q.; Zhao, M. MODIS/Terra Gross Primary Productivity 8-Day L4 Global 500 m SIN Grid V061; NASA Land Processes Distributed Active Archive Center: Sioux Falls, SD, USA, 2021. [Google Scholar]
  25. Myneni, R.; Knyazikhin, Y.; Park, T. MODIS/Terra Leaf Area Index/FPAR 8-Day L4 Global 500 m SIN Grid V061; NASA Land Processes Distributed Active Archive Center: Sioux Falls, SD, USA, 2021. [Google Scholar]
  26. Wan, Z.; Hook, S.; Hulley, G. MODIS/Terra Land Surface Temperature/Emissivity 8-Day L3 Global 1 km SIN Grid V061; NASA Land Processes Distributed Active Archive Center: Sioux Falls, SD, USA, 2021. [Google Scholar]
  27. Abatzoglou, J.T.; Dobrowski, S.Z.; Parks, S.A.; Hegewisch, K.C. TerraClimate, a High-Resolution Global Dataset of Monthly Climate and Climatic Water Balance from 1958–2015. Sci. Data 2018, 5, 170191. [Google Scholar] [CrossRef] [Scilit] [PubMed]
  28. Vermote, E. MODIS/Terra Surface Reflectance 8-Day L3 Global 500m SIN Grid V061; NASA Land Processes Distributed Active Archive Center: Sioux Falls, SD, USA, 2021. [Google Scholar]
  29. Abadi, M.; Agarwal, A.; Barham, P.; Brevdo, E.; Chen, Z.; Citro, C.; Corrado, G.S.; Davis, A.; Dean, J.; Devin, M.; et al. Tensorflow: Large-Scale Machine Learning on Heterogeneous Distributed Systems. arXiv 2016, arXiv:1603.04467. [Google Scholar]
  30. Hahnloser, R.H.; Sarpeshkar, R.; Mahowald, M.A.; Douglas, R.J.; Seung, H.S. Digital Selection and Analogue Amplification Coexist in a Cortex-Inspired Silicon Circuit. Nature 2000, 405, 947–951. [Google Scholar] [CrossRef] [Scilit] [PubMed]
  31. Ioffe, S.; Szegedy, C. Batch Normalization: Accelerating Deep Network Training by Reducing Internal Covariate Shift. In Proceedings of the International Conference on Machine Learning, Lille, France, 7–9 July 2015; pp. 448–456. [Google Scholar]
  32. Srivastava, N.; Hinton, G.; Krizhevsky, A.; Sutskever, I.; Salakhutdinov, R. Dropout: A Simple Way to Prevent Neural Networks from Overfitting. J. Mach. Learn. Res. 2014, 15, 1929–1958. [Google Scholar]
  33. Lin, T.-Y.; Goyal, P.; Girshick, R.; He, K.; Dollár, P. Focal Loss for Dense Object Detection. In Proceedings of the IEEE International Conference on Computer Vision, Venice, Italy, 22–29 October 2017; IEEE: New York, NY, USA, 2017; pp. 2980–2988. [Google Scholar]
  34. Belgiu, M.; Dragut, L. Random Forest in Remote Sensing: A Review of Applications and Future Directions. ISPRS J. Photogramm. Remote Sens. 2016, 114, 24–31. [Google Scholar] [CrossRef] [Scilit]
  35. Kingma, D.P.; Ba, J. Adam: A Method for Stochastic Optimization. arXiv 2017, arXiv:1412.6980. [Google Scholar]
  36. Prechelt, L. Early Stopping—But When? In Neural Networks: Tricks of the Trade, 2nd ed.; Montavon, G., Orr, G.B., Müller, K.-R., Eds.; Springer: Berlin/Heidelberg, Germany, 2012; pp. 53–67. ISBN 978-3-642-35289-8. [Google Scholar]
  37. Ma, L.; Liu, Y.; Zhang, X.; Ye, Y.; Yin, G.; Johnson, B.A. Deep Learning in Remote Sensing Applications: A Meta-Analysis and Review. ISPRS J. Photogramm. Remote Sens. 2019, 152, 166–177. [Google Scholar] [CrossRef] [Scilit]
  38. Gong, P.; Wang, J.; Yu, L.; Zhao, Y.; Zhao, Y.; Liang, L.; Niu, Z.; Huang, X.; Fu, H.; Liu, S.; et al. Finer Resolution Observation and Monitoring of Global Land Cover: First Mapping Results with Landsat TM and ETM+ Data. Int. J. Remote Sens. 2013, 34, 2607–2654. [Google Scholar] [CrossRef] [Scilit]
  39. Huang, J.; Yu, H.; Guan, X.; Wang, G.; Guo, R. Accelerated Dryland Expansion under Climate Change. Nat. Clim. Change 2016, 6, 166–171. [Google Scholar] [CrossRef] [Scilit]
  40. Sawyer, J.O.; Keeler-Wolf, T.; Evens, J.M. A Manual of California Vegetation, 2nd ed.; California Native Plant Society Press: Sacramento, CA, USA, 2009. [Google Scholar]
  41. Maxwell, A.E.; Warner, T.A.; Fang, F. Implementation of Machine-Learning Classification in Remote Sensing: An Applied Review. Int. J. Remote Sens. 2018, 39, 2784–2817. [Google Scholar] [CrossRef] [Scilit]
  42. Peng, J.; Zhu, Z.; Liang, C.; Liu, Z. The Study Progress on the Phylogeny and Spatial Distribution of Stipa Genus in China. J. Arid. Land Resour. Environ. 2016, 30, 165–170. [Google Scholar]
  43. Zhao, W.; Li, J.; Qi, J. Changes in Vegetation Diversity and Structure in Response to Heavy Grazing Pressure in the Northern Tianshan Mountains, China. J. Arid. Environ. 2007, 68, 465–479. [Google Scholar] [CrossRef] [Scilit]
  44. Wang, J.; Liu, J.; Liu, C.; Ding, X.; Wang, Y. Species Niche and Interspecific Associations Alter Flora Structure along a Fertilization Gradient in an Alpine Meadow of Tianshan Mountain, Xinjiang. Ecol. Indic. 2023, 147, 109953. [Google Scholar] [CrossRef] [Scilit]
  45. Che, J.; Ye, M.; He, Q.; Zeng, G.; Li, M.; Chen, W.; Pan, X.; Qian, J.; Lv, Y. Elevation Gradient Effects on Grassland Species Diversity and Phylogenetic in the Two-River Source Forest Region of the Altai Mountains, Xinjiang, China. Front. Plant Sci. 2025, 16, 1487582. [Google Scholar] [CrossRef] [Scilit] [PubMed]
  46. Jiao, B.; Wei, M.; Niu, G.; Chen, X.; Liu, Y.; Huang, G.; Chen, C.; Zheng, J.; Shen, J.; Vitales, D.; et al. Global Phylogeny and Taxonomy of Artemisia. Nat. Commun. 2025, 16, 8648. [Google Scholar] [CrossRef] [Scilit] [PubMed]
  47. Jiang, Q.; Ji, J.; Shen, J.; Matsumoto, R.; Tong, G.; Qian, P.; Ren, X.; Yan, D. Holocene Vegetational and Climatic Variation in Westerly-Dominated Areas of Central Asia Inferred from the Sayram Lake in Northern Xinjiang, China. Sci. China Earth Sci. 2013, 56, 339–353. [Google Scholar] [CrossRef] [Scilit]
  48. Mamuti, T.; Zhu, X.; Zhao, Y. Vegetation Types and Distribution Characteristics of Alpine Steppes in Xinjiang. Grass-Feed. Livest. 2017, 06, 48–52. [Google Scholar] [CrossRef]
  49. Editorial Committee of Chinese Vegetation Map; Chinese Academy of Sciences. Vegetation Map of the People’s Republic of China (1:1,000,000); Geologica Publishing House: Beijing, China, 2007. [Google Scholar]
  50. Jiang, L.; Guo, S.; He, L.; Zhang, S.; Sun, Z.; Wang, L. Enhancing Root Water Uptake and Mitigating Salinity through Ecological Water Conveyance: A Study of Tamarix Ramosissima Ledeb. Using Hydrus-1D Modeling. Forests 2024, 15, 1664. [Google Scholar] [CrossRef] [Scilit]
  51. Yang, W.; Zhang, D.; Yin, L.; Zhang, L. Distribution and Cluster Analysis on the Similarity of the Tamarix Communities in Xinjiang. Arid. Zone Res. 2002, 19, 6–11. [Google Scholar]
  52. Song, C.; Li, C.; Halik, Ü.; Xu, X.; Lei, J.; Zhou, Z.; Fan, J. Spatial Distribution and Structural Characteristics for Haloxylon Ammodendron Plantation on the Southwestern Edge of the Gurbantünggüt Desert. Forests 2021, 12, 633. [Google Scholar] [CrossRef] [Scilit]
  53. Yan, D.; Fan, Y.; Jiang, X.; Ma, Y.; Lin, K.; Dang, Z.; Niu, J. Diversification and Differentiation of Stipa Species Shed Light on the Regional Evolutionary History of the Eastern Eurasian Steppe. Mol. Phylogenet. Evol. 2025, 213, 108449. [Google Scholar] [CrossRef] [Scilit] [PubMed]
  54. Ma, N.; Cao, S.; Bai, T.; Yang, Z.; Cai, Z.; Sun, W. Assessment of Vegetation Dynamics in Xinjiang Using NDVI Data and Machine Learning Models from 2000 to 2023. Sustainability 2025, 17, 306. [Google Scholar] [CrossRef] [Scilit]
  55. Rui, H.; Luo, B.; Wang, Y.; Zhu, L.; Zhu, Q. Quantitative Impacts of Climate Change and Human Activities on Grassland Growth in Xinjiang, China. Front. Plant Sci. 2025, 15, 1497248. [Google Scholar] [CrossRef] [Scilit] [PubMed]
  56. Zhang, S.; Wang, Y.; Xu, W.; Sheng, Z.; Zhu, Z.; Hou, Y. Analysis of Spatial and Temporal Variability of Ecosystem Service Values and Their Spatial Correlation in Xinjiang, China. Remote Sens. 2023, 15, 4861. [Google Scholar] [CrossRef] [Scilit]
  57. Liu, Y.; Lyu, Y.; Bai, Y.; Zhang, B.; Tong, X. Vegetation Mapping for Regional Ecological Research and Management: A Case of the Loess Plateau in China. Chin. Geogr. Sci. 2020, 30, 410–426. [Google Scholar] [CrossRef] [Scilit]
  58. Yeo, S.; Lafon, V.; Alard, D.; Curti, C.; Dehouck, A.; Benot, M.-L. Classification and Mapping of Saltmarsh Vegetation Combining Multispectral Images with Field Data. Estuar. Coast. Shelf Sci. 2020, 236, 106643. [Google Scholar] [CrossRef] [Scilit]
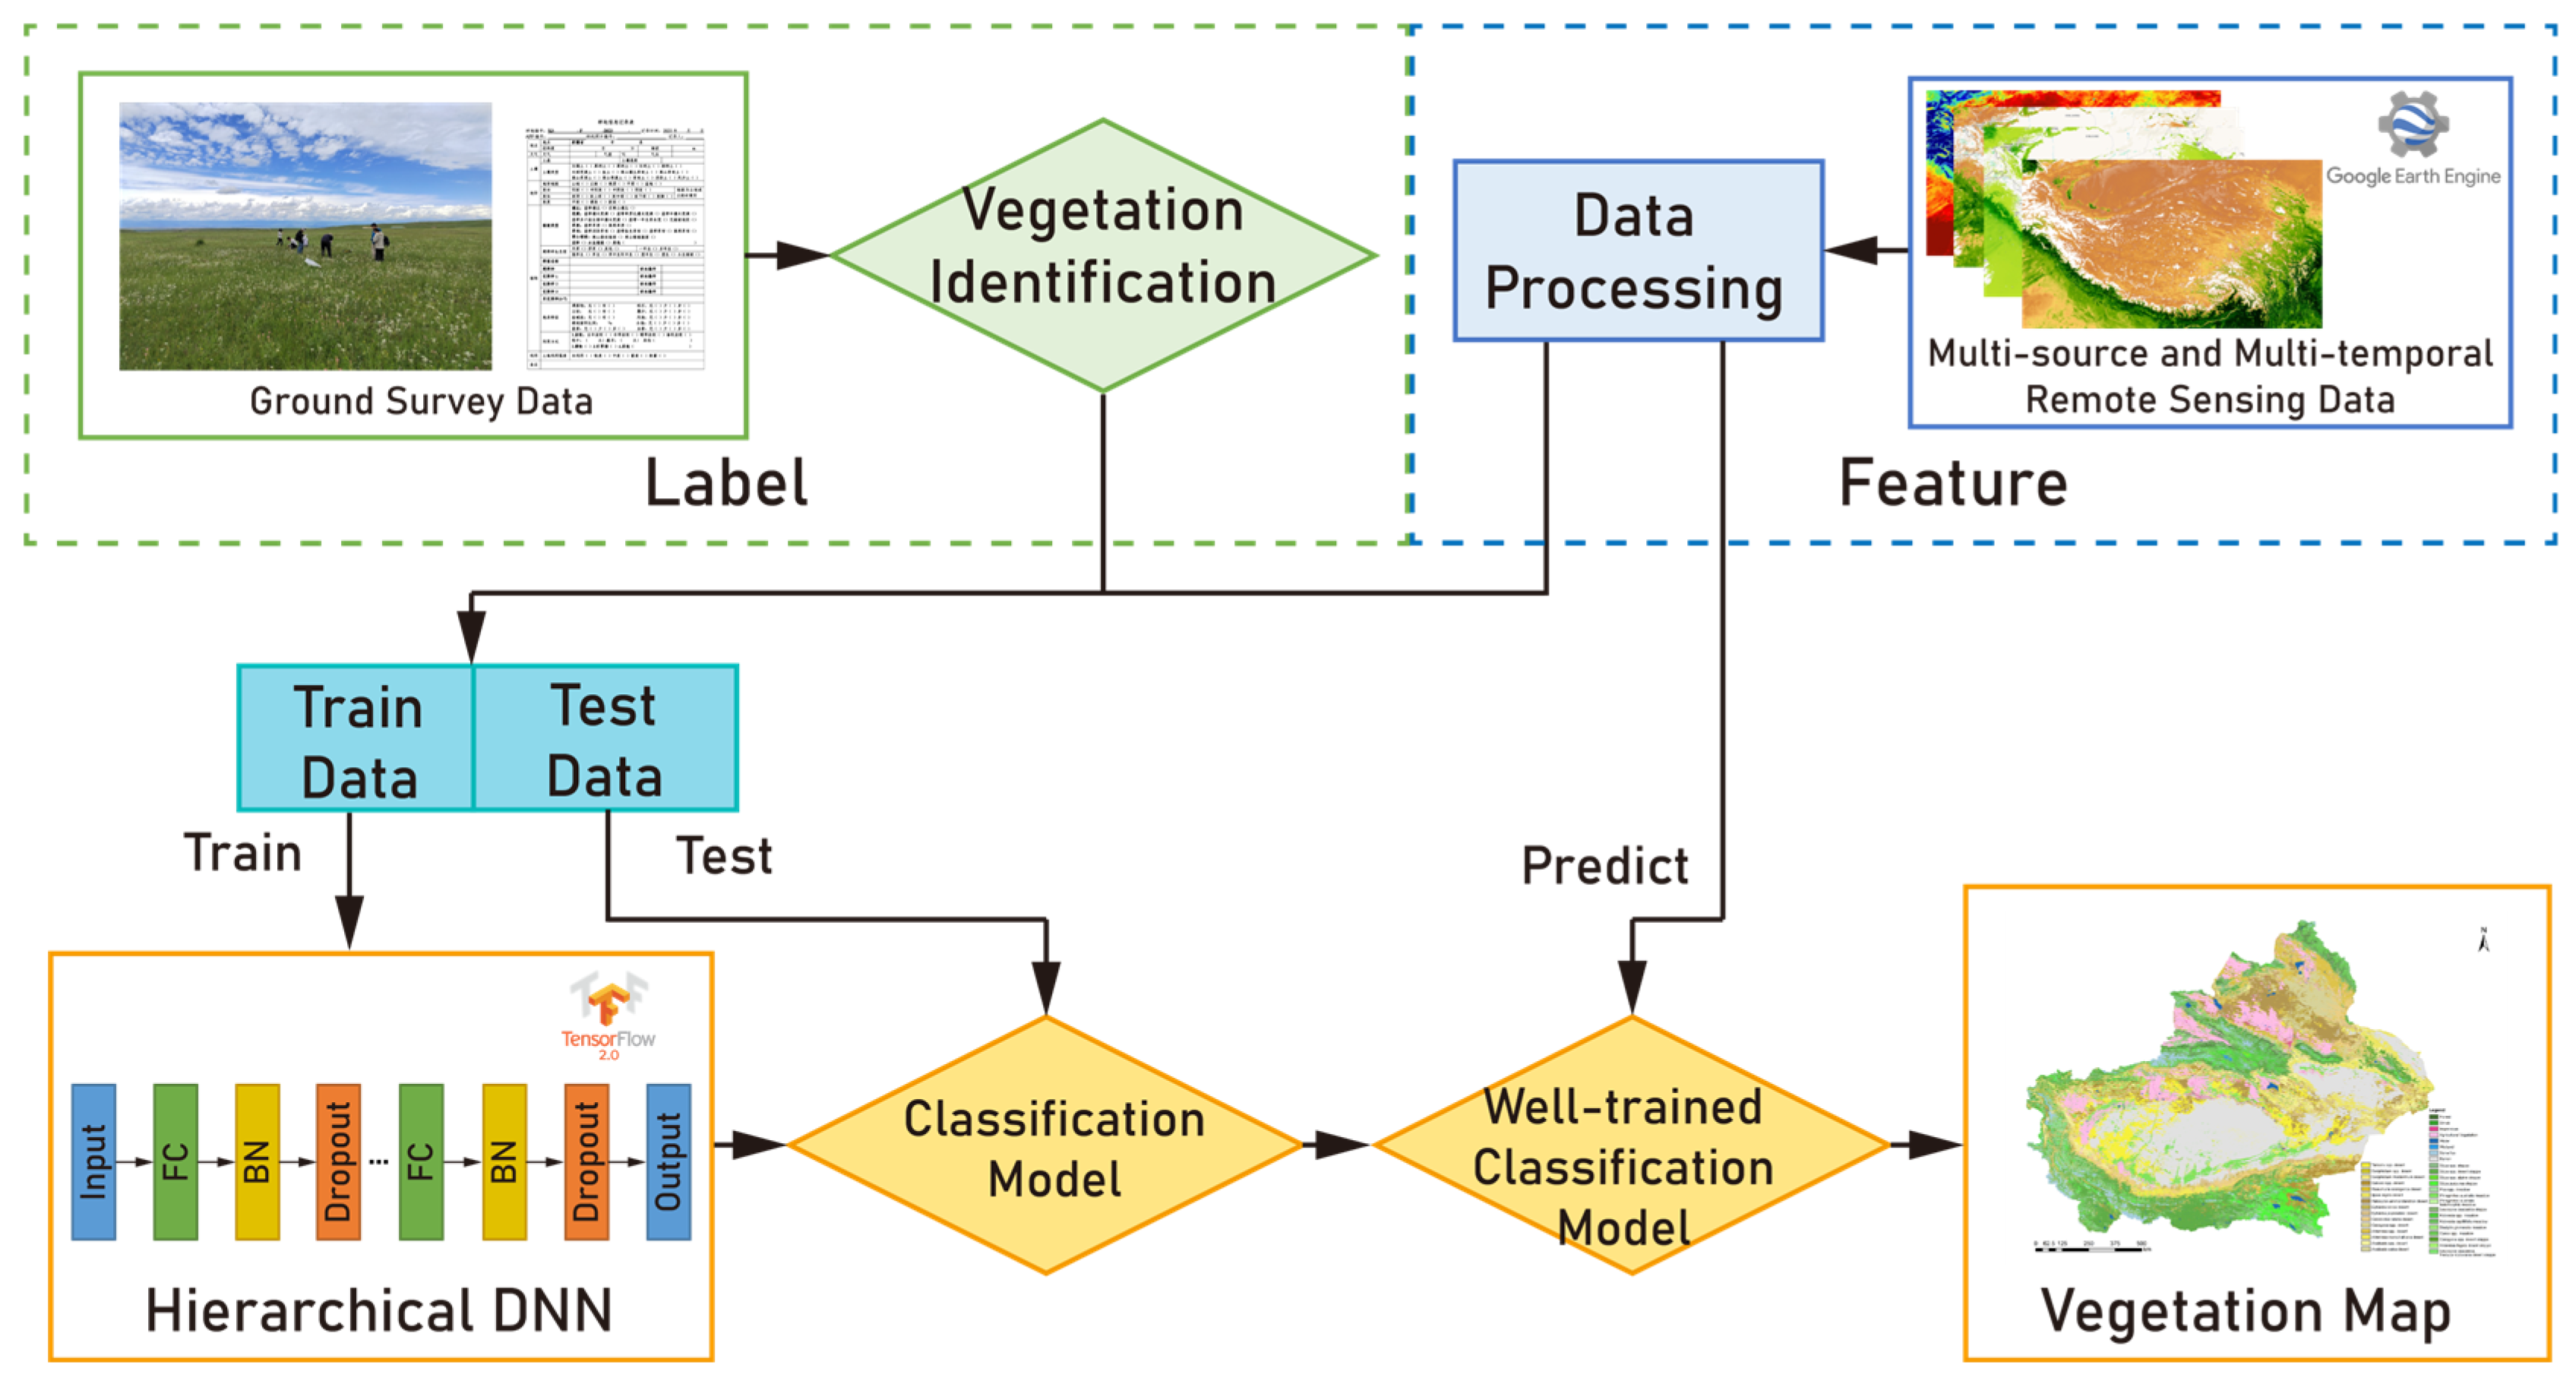
Figure 1. Flow chart of mapping vegetation alliances using DNN. Ground survey points (labels) and remote sensing data (features) are integrated to train the DNN. The well-trained model is subsequently applied to the remote sensing features to generate the final vegetation map.
Remotesensing 18 02880 g001
Figure 2. Map of study region and field survey point.
Remotesensing 18 02880 g002
Figure 3. DNN architecture for vegetation alliance classification. Hierarchical Classification: A top-down approach where models first classify vegetation formations (higher taxonomic level), and subsequently train individual models for each formation to classify their alliances. The numbers 1–9 in the figure indicate the neuron indices. w 51 denotes the weight between neuron 5 and neuron 1; similarly, w 52 is the weight between 5 and 2, etc.
Remotesensing 18 02880 g003
Figure 4. Vegetation alliance map on Xinjiang province in 2023.
Remotesensing 18 02880 g004
Figure 5. Vegetation formation map on Xinjiang province in 2023.
Remotesensing 18 02880 g005
Table 1. The remote sensing data used in the study.
TypeDataset NameSourceTemporal ResolutionSpatial ResolutionTemporal Scope
TerrainAspectASTER GDEM V3-30 m2019
DEMASTER GDEM V3-30 m2019
SlopeASTER GDEM V3-30 m2019
Vegetation structure and functionsEVIMOD13Q1 V616 d250 m2023
NDVIMOD13Q1 V616 d250 m2023
GPPMOD17A2H V68 d500 m2023
Net photosynthesisMOD17A2H V68 d500 m2023
LAIMOD15A2H V68 d500 m2023
FPARMOD15A2H V68 d500 m2023
ClimateDay land surface temperatureMOD11A2 V68 d/y1 km2019–2023
Precipitation accumulationTerraClimatem/y2.5′2019–2023
Soil moistureTerraClimatem/y2.5′2019–2023
Actual evapotranspirationTerraClimatem/y2.5′2019–2023
SpectralSurface ReflectanceMOD09A1 V68 d500 m2023
Table 2. The comparison of proposed DNN and RF baselines.
MethodOAMacro PrecisionMacro RecallMacro F1
Proposed DNN0.51250.50840.51250.4930
RF (Static)0.34340.26410.21120.2100
RF (MSMT)0.59380.38940.36180.3616
Table 3. Ablation study evaluating key components of the proposed deep learning architecture.
Model ConfigurationFormation OAAlliance OAAlliance Macro F1
Proposed DNN (Hierarchical + Focal Loss + BN & Dropout)0.67740.51250.4955
Flat training (w/o Hierarchical)0.64520.45520.4625
CCE Loss (w/o Focal Loss)-0.43730.4316
w/o BN & Dropout-0.20070.0671
Disclaimer/Publisher’s Note: The statements, opinions and data contained in all publications are solely those of the individual author(s) and contributor(s) and not of MDPI and/or the editor(s). MDPI and/or the editor(s) disclaim responsibility for any injury to people or property resulting from any ideas, methods, instructions or products referred to in the content.