Article

Enhanced 3D Lightning Localization for Low-Frequency Radio Observations over the Tibetan Plateau

1
Key Laboratory of Cryospheric Science and Frozen Soil Engineering, Northwest Institute of Eco-Environment and Resources, Chinese Academy of Sciences, Lanzhou 730000, China
2
University of Chinese Academy of Sciences, Beijing 100049, China
3
School of Electrical and Intelligent Manufacturing Engineering, Hexi University, Zhangye 734000, China
4
Qinghai Lake Comprehensive Observation and Research Station, Chinese Academy of Sciences, Gangcha 812300, China
5
Qinghai Lake Biodiversity Conservation Research Center, Xining 810000, China
6
Department of Atmospheric and Oceanic Sciences, Institute of Atmospheric Sciences, Fudan University, Shanghai 200433, China
*
Author to whom correspondence should be addressed.
Remote Sens. 2026, 18(17), 2881; https://doi.org/10.3390/rs18172881
Submission received: 18 May 2026 / Revised: 19 July 2026 / Accepted: 19 August 2026 / Published: 26 August 2026
(This article belongs to the Section Atmospheric Remote Sensing)

Highlights

What are the main findings?
  • Monte Carlo simulations of low-frequency lightning location radio data show that the proposed denoising method (WZ) reduces the time-of-arrival error to 0.3 μs and improves the signal-to-noise ratio by 10 dB, while preserving multi-station phase consistency.
  • For two intracloud flashes, for example, WZ recovers substantially more valid radiation sources (up to about 2.3 times) without degrading the localization fit quality, and enables the downward development of the channel to be tracked.
What are the implications of the main findings?
  • Denoising for lightning location should preserve the inter-station timing rather than merely maximize the signal-to-noise ratio at each station, since it is the inter-station timing that governs the location accuracy.
  • WZ could provide a software-only upgrade for long-running low-frequency lightning networks, improving both current and archived data without any hardware modification.

Abstract

Lightning discharges over the Tibetan Plateau are monitored by ground-based networks that locate radiation sources from their low-frequency radio emissions. This study uses the Qinghai Datong network in the northeastern Tibetan Plateau, which records the 50 kHz to 2.5 MHz band over a small area to locate lightning in three dimensions. In such networks, the accuracy of three-dimensional location depends critically on the consistency of the signals recorded across stations, which is progressively degraded by aging analog front-ends and by complex electromagnetic noise. To address this, we propose a phase-preserving denoising scheme, termed WZ, that suppresses both broadband and narrowband noise while keeping the relative timing between stations essentially unchanged, so that the arrival times used for location are preserved. The improvement is illustrated with both simulations and real data. In Monte Carlo simulations, WZ improves the signal-to-noise ratio by 10 dB and reduces the time-of-arrival error to 0.3 μs. Applied to two intracloud flashes of contrasting morphology, WZ recovers substantially more radiation sources and more continuous discharge channels than conventional filtering, at no cost to fit quality, allowing, for example, the downward development of the channel to be tracked quantitatively. The method requires no change to the existing hardware and can be applied to archived data, making it a practical way to improve both current and historical records from long-running low-frequency lightning networks.

1. Introduction

Long-term ground-based lightning observation networks constitute an irreplaceable component of the Earth observation infrastructure for atmospheric electricity. Unlike spaceborne lightning imagers, such as the Lightning Mapping Imager (LMI) aboard FY-4 [1] and the Geostationary Lightning Mapper (GLM) aboard GOES-16/17 [2], which provide broad spatial coverage, ground-based sensor networks offer high-temporal-resolution, three-dimensional (3D) channel structure information at the regional scale. The complementary use of these two observation modalities—cross-validation, data fusion, and joint analysis—has become an important direction in advancing the understanding of thunderstorm electrification processes and lightning climatology [3]. Among ground-based sensing technologies, low-frequency/very-low-frequency (LF/VLF) lightning localization networks are particularly valuable for long-term continuous operation owing to their relatively simple hardware architecture, low deployment cost, and sensitivity to both intracloud (IC) and cloud-to-ground (CG) discharges over large areas [4,5]. Sustaining and improving the data quality of these networks is therefore a matter of direct scientific importance for Earth observation.
The lightning discharge process generates electromagnetic radiation signals over a broad frequency spectrum, with different frequency bands corresponding to different physical processes of discharge. Therefore, lightning detection and localization technologies based on different frequency bands each has its own advantages in observational capabilities and application focus [4]. Among them, LF/VLF lightning radiation signals are characterized by long propagation distances and good responsiveness to both intracloud discharges and ground flashes, which have long played an important role in lightning monitoring, localization, and physical research [4,5].
In the LF/VLF bands, time-of-arrival (TOA)-based methods, due to their clear principles and relatively mature engineering implementations, have been widely applied in both 2D and 3D lightning localization systems [4,5,6]. Several observation systems have achieved 3D localization of lightning radiation sources in this frequency range [5,6,7,8,9]. As an early representative LF/VLF lightning detection array, the Los Alamos Sferic Array (LASA) system implemented 3D localization of lightning radiation sources based on the TOA difference method, laying an important foundation for the development of LF TOA lightning localization technology [5]. Subsequently, observation systems such as Huntsville Alabama Marx Meter Array (HAMMA) [7], the Position By Fast Antenna (PBFA) system [8], and the Broadband Observation network for Lightning and Thunderstorms (BOLT) in Japan [9] have been developed, further expanding the role of LF/VLF 3D lightning localization technology in lightning physics research and operational applications.
Beyond the broad deployment of these systems, LF/VLF observations also offer distinct signal-level advantages. Compared with very-high-frequency (VHF) localization systems such as the Lightning Mapping Array (LMA) [10,11] and fast-antenna mapping arrays [12], LF/VLF systems often record more abundant radiation information during the initial stages of lightning and the dense pulse activity phases, offering unique advantages in characterizing channel development, identifying discharge types and polarities, and inverting current parameters [9,13,14]. Recent advances in LF 3D lightning localization—through both hardware upgrades [15] and refined signal-processing methods [16]—have improved channel-continuity recovery and supported quantitative analysis of kinematic parameters such as channel propagation speed. Shi et al. [6] systematically introduced the array configuration, localization algorithms, and engineering implementation of the Low-frequency E-field Detection Array (LFEDA) and evaluated the system’s localization accuracy and detection efficiency through Monte Carlo simulations and triggered lightning experiments. On this basis, Fan et al. [16] further introduced empirical mode decomposition (EMD) [17] into the LF electric field signal analysis pipeline, improving TOA extraction accuracy, weak pulse recognition, and inter-station waveform matching under complex pulse conditions.
The Qinghai Datong seven-station lightning electric-field observation network, located at the northeastern edge of the Tibetan Plateau, is one of the earliest established and continuously operating plateau lightning observation systems in China [18,19]. Over more than fifteen years of continuous operation, this network has accumulated an extensive archive of broadband electric field data spanning multiple thunderstorm seasons. Based on this long-term dataset, previous studies have systematically investigated the evolution of charge structure in plateau thunderstorms [20,21,22,23,24,25], the physical processes of initial pre-breakdown and radiation pulses [26,27], intracloud dense discharges, and lightning interactions [28,29], demonstrating the network’s significant scientific value in observing and characterizing plateau thunderstorm electrical processes. However, aging analog front-end circuitry and the complex electromagnetic environment of the plateau have progressively elevated background noise levels in the broadband electric field data, degrading pulse recognition and TOA extraction accuracy. This deterioration not only restricts the 3D localization performance of current observations but also suppresses the retrievable scientific information embedded in the historical archive—limiting the network’s contribution to studies of long-term thunderstorm variability and lightning climatology over the Tibetan Plateau and the downstream Qinghai Lake basin. Improving the localization quality of both historical and newly acquired data through signal processing methods, without modifying the existing hardware system, therefore holds direct scientific and practical value.
The scientific motivation for reanalyzing long-term lightning observation archives through algorithmic improvement is well established. Sustained ground-based observation networks provide multi-decadal records that are uniquely positioned to reveal interannual and decadal variability in thunderstorm activity—including responses to regional warming, changes in lake–atmosphere interactions, and shifts in monsoon circulation [30,31]. Yet the scientific exploitation of such archives is contingent on maintaining consistent, high-quality localization performance across the entire record. When hardware degradation introduces time-varying noise characteristics, the resulting inhomogeneity in data quality can mask true geophysical trends or introduce spurious signals into long-term analyses. A software-based preprocessing framework that adaptively tracks noise statistics and preserves TOA fidelity offers a cost-effective path to homogenizing archive quality without requiring hardware replacement or retrospective recalibration campaigns—an approach that is directly transferable to other long-term in situ sensing networks facing similar degradation challenges.
Previous studies have shown that the main limiting factor in LF/VLF 3D lightning localization accuracy is not the array geometry or the inversion model itself, but the measurement and extraction accuracy of multi-station TOA data [5,16]. Under broadband LF/VLF observation conditions, high-frequency noise, background disturbances, and waveform superposition effects can lead to phase mismatches between stations, thereby amplifying TOA errors, increasing localization fitting residuals, and even significantly reducing the number of effective localization sources [16]. Therefore, signal processing methods for LF 3D localization should aim to integrate noise suppression, phase preservation, and multi-station timing consistency as unified goals.
Existing methods for LF electric field signal denoising include fixed band-pass filtering, Wiener filtering, wavelet denoising, and time-frequency analysis [32,33,34,35]. These methods have been widely used in lightning signal detection and amplitude enhancement, but their applicability in TOA 3D localization scenarios still varies. Fixed band-pass filtering may introduce systematic peak time offsets due to frequency-dependent group delay under broadband pulse conditions [36]. While Wiener filtering has theoretical advantages in the sense of minimum mean square error, its performance depends on accurate estimation of noise statistics. Under non-stationary or spatially inconsistent noise conditions, inconsistent phase responses may appear between different stations, affecting the stability of inter-station TOA matching [34,36]. Wavelet and other time-frequency methods are well-suited for non-stationary signals. However, basis function selection and multi-scale decomposition can disturb the instantaneous phase and time structure of the signal, introducing non-negligible timing errors in TOA localization [37,38]. In recent years, deep learning methods have shown considerable promise in LF lightning applications, including denoising, event detection [39,40], and end-to-end localization. However, their performance is highly sensitive to training sample representativeness, and their generalization ability, physical interpretability, and operational stability require further validation. Overall, existing methods still face a common challenge in LF 3D localization applications: how to effectively suppress noise while avoiding phase distortion and multi-station timing mismatches.
Against this background, this paper focuses on the Qinghai Datong seven-station lightning electric-field observation network and proposes Wiener plus zero-phase hybrid filtering (WZ), a phase-preserving preprocessing procedure for LF 3D lightning localization that requires no hardware modification. By integrating established short-time Fourier transform (STFT)-domain adaptive Wiener spectral shrinkage with zero-phase bandpass filtering, WZ simultaneously suppresses broadband random noise and narrowband radio-frequency interference (RFI) while preserving the phase structure and TOA consistency of multi-station waveforms. The method is validated on synthetic signals and on observational data from the 2024–2025 Datong thunderstorm seasons, covering two representative intracloud flash events with contrasting discharge morphologies—one with a predominantly linear, east–west channel (20250728204844) and one with a complex multi-branch structure (20250728205211). The results demonstrate that WZ provides a cost-effective software-based path for improving both current and archival localization quality in long-running LF observation networks.

2. Observational Data

2.1. Observation Network and System Configuration

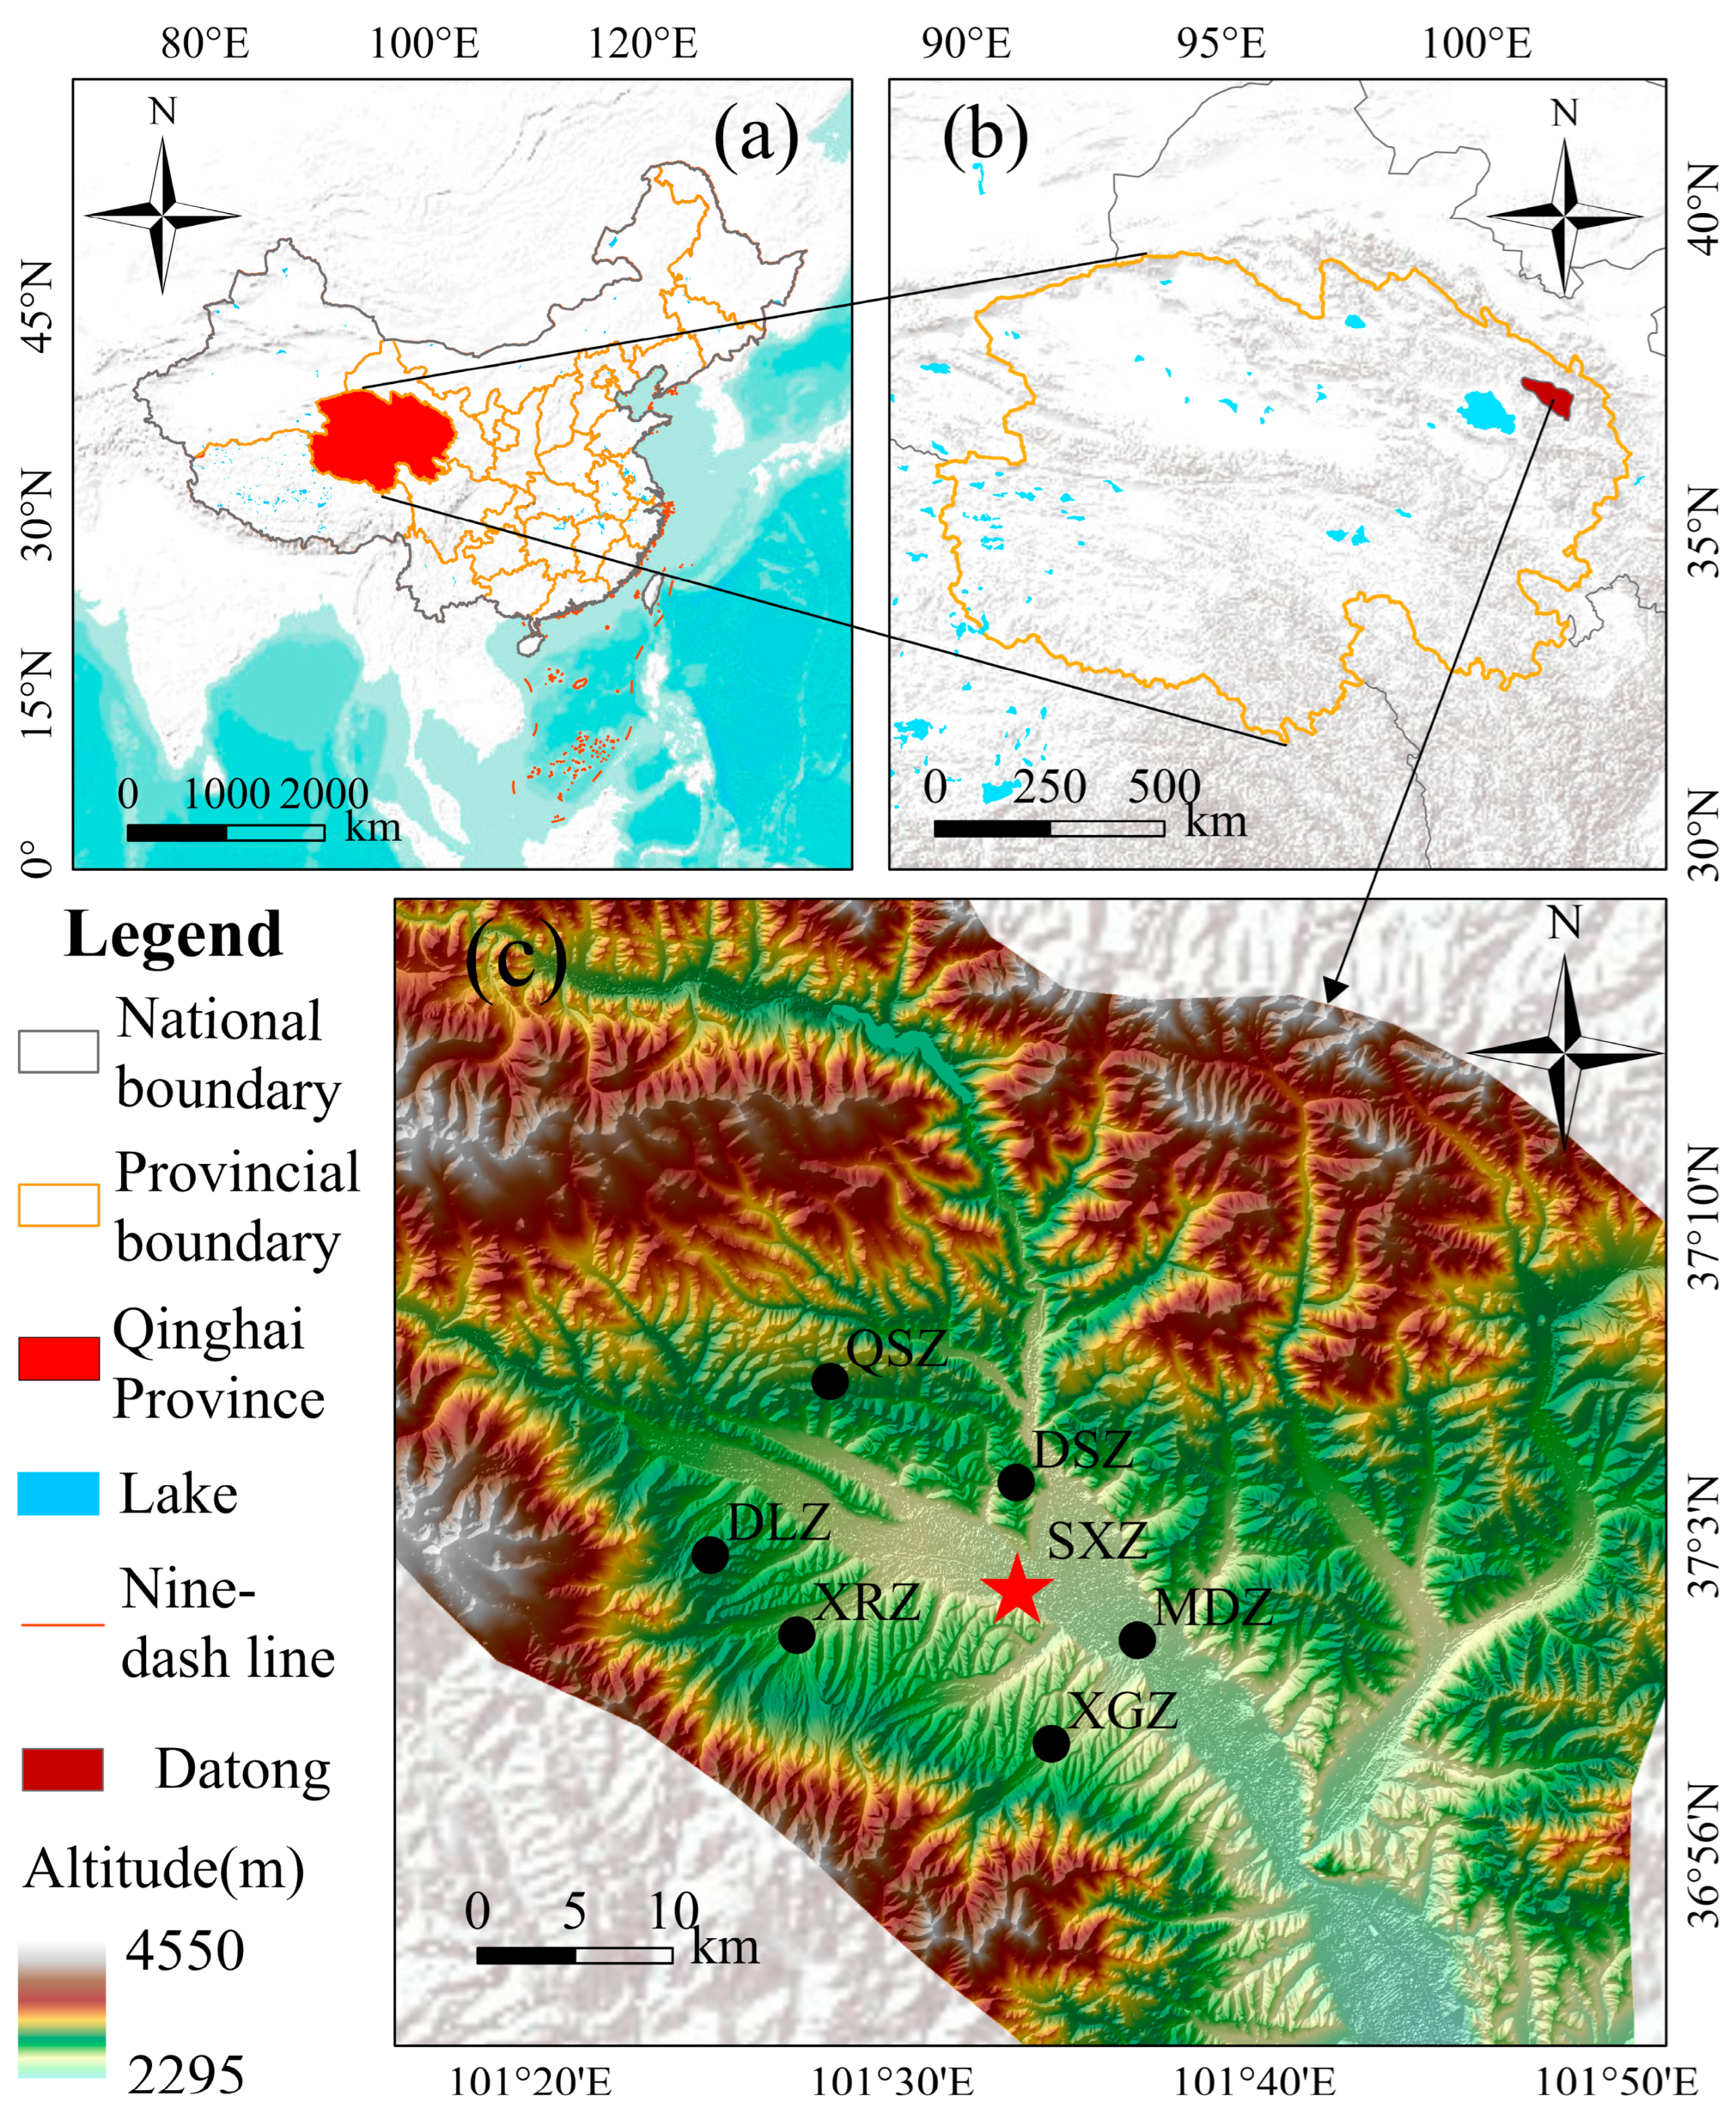
The Qinghai Datong lightning electric-field observation network consists of seven ground-based electric-field observation stations distributed over an area of approximately 18 km × 14 km in eastern Qinghai (Figure 1), forming a multi-station observation array that satisfies the requirements for 3-D TOA localization. The relative coordinates, altitudes, and place-name origins of the seven stations are listed in Table 1; the station codes are the initials of the corresponding place names. Station SXZ, located near the geometric center of the array, is taken as the central station and the coordinate origin, and the inter-station baselines range from approximately 4 km to 16 km, providing the spatial aperture required for 3-D localization. Each station is equipped with a broadband fast antenna, analog front-end amplification and limiting circuits, and a high-speed data acquisition system, enabling synchronous acquisition of broadband electric-field data in the 0–10 MHz band at a sampling rate of 40 MHz with an input dynamic range of ±10 V. Each station also records VHF radiation data, which are not used in the present study. All stations are synchronized using GPS, with a timing accuracy better than 50 ns, which satisfies the requirements of lightning TOA-based 3-D localization for arrival-time extraction. During thunderstorms, when the amplitude of the electric-field variation at the central station exceeds a preset trigger threshold (0.7 V, identical for all stations), the system triggers all stations to synchronously record 1 s of waveform data, while retaining both pre-trigger and post-trigger information. After alignment of multi-station waveforms to a unified time axis and consistent preprocessing, the data can be further used for 3-D lightning localization analysis.

2.2. Dataset and Event Selection

The observations were conducted during the summer thunderstorm seasons of 2024 (8 July to 15 August) and 2025 (15 July to 11 August). Acquisition was event-triggered, with each trigger producing a one-second dual-channel record sampled at 40 MHz; a pre-trigger interval—30% of the one-second record at the central station and 40% at the remaining six stations—precedes each trigger, and, being free of lightning pulses, it serves as the per-station noise-only interval for the noise power-spectral-density estimation described in Section 3. On active thunderstorm days, the network typically registered on the order of one to two thousand events. These events encompassed cloud-to-ground, intracloud, and mixed discharges, although they were archived on a per-event basis rather than catalogued by thunderstorm process or classified by discharge type; the cases analyzed in this study are intracloud flashes.
Events were retained for analysis when valid triggering was obtained simultaneously at all seven stations and when the source fell within the network coverage, so that an adequate localization geometry was ensured. The seven stations operated continuously and without interruption throughout both seasons, so that every analyzed event is supported by a complete seven-station dataset.

2.3. Noise Characteristics

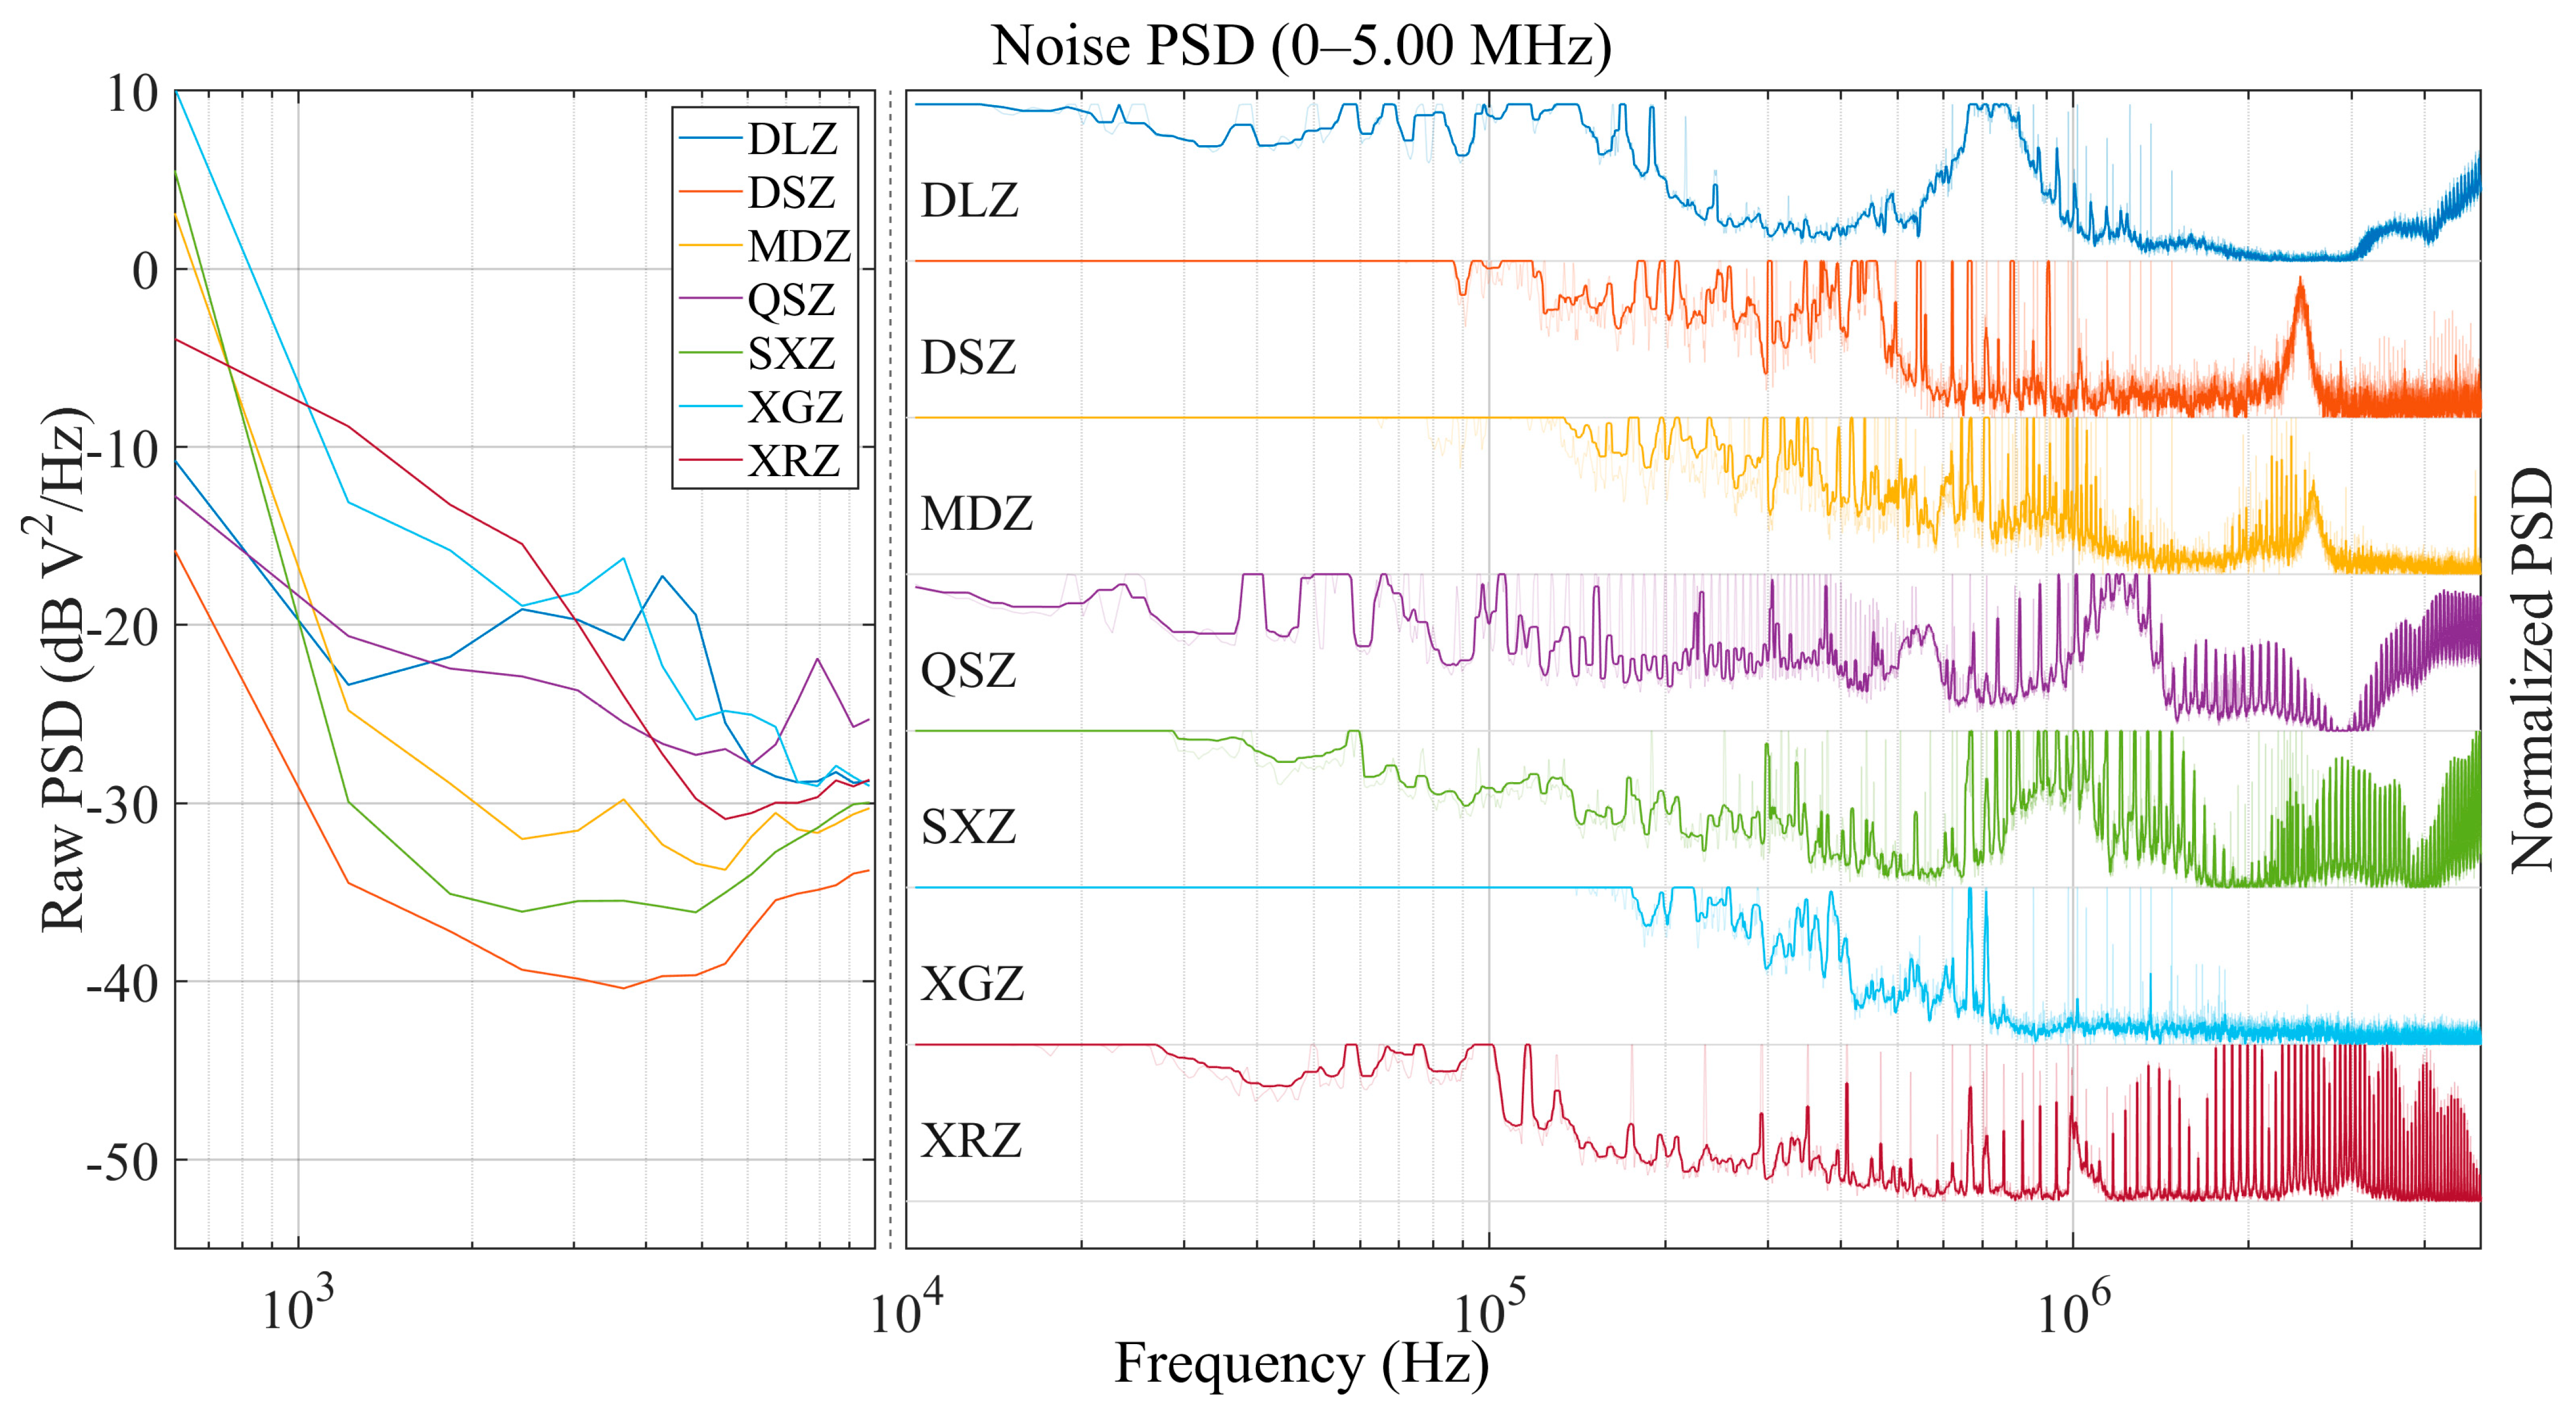
To quantitatively characterize the noise environment at each station, this study selected data from clear-sky periods to compute the power spectral density (PSD) and compared the noise spectra of the seven stations (Figure 2). To clearly present the noise characteristics across different frequency bands, two types of PSD plots are used in this study: the raw PSD retains the actual amplitude information, while the normalized PSD removes the differences in equipment gain and highlights the spectral shape variations, particularly the narrowband interference in the high-frequency range. In Figure 2, 10 kHz is chosen as the boundary frequency. The left panel shows the raw PSDs of the low-frequency noise in the 0 Hz to 10 kHz range, while the right panel presents the normalized PSDs of the high-frequency noise above 10 kHz. This boundary helps differentiate low-frequency and high-frequency noise and clearly reveals the noise characteristics in different bands.
Figure 2 shows the noise power spectral density (PSD) characteristics of the seven stations in the 0–5 MHz frequency range. The left panel presents the overlaid raw PSDs, revealing the baseline level of low-frequency noise (0–10 kHz). The PSD values at each station are generally higher in the low-frequency range, gradually decreasing and stabilizing as the frequency increases, exhibiting typical 1/f decay characteristics. There are significant differences in the absolute PSD values between stations: the noise level at the XGZ station is the highest (close to 10 dB V2/Hz), while the noise levels at DSZ and SXZ are the lowest (around −30 to −40 dB V2/Hz), reflecting clear differences in the electromagnetic environment and receiving chain conditions at each station.
The right panel shows the stacked normalized PSDs, with the frequency range extended to 10 kHz–5 MHz. The normalization process eliminates equipment gain differences, allowing for a more direct comparison of spectral features across stations. Overall, in the 10 kHz–100 kHz band, the spectra of most stations are relatively flat, while in the high-frequency range above 100 kHz, narrowband interference peaks gradually appear, particularly concentrated around 1 MHz. Spectral differences between stations are evident: the QSZ station shows more continuous spectral changes and dense peak structures in the mid-to-high-frequency bands, suggesting the presence of multiple periodic interference sources; the XRZ station exhibits prominent comb-like peak clusters in the high-frequency range with regular spacing; DLZ shows broader peaks in the 500 kHz–2 MHz range, indicative of wideband radio-frequency interference. The high-frequency spectra of XGZ are relatively smooth, indicating a cleaner electromagnetic environment, while DSZ, MDZ, and SXZ exhibit transitional characteristics between the two categories. These inter-station noise differences directly impact TOA estimation accuracy: high noise floors or strong narrowband interference can lead to missed detection of weak signals and misjudgment of timings, thus reducing 3-D localization accuracy, and motivating the differentiated adaptive preprocessing framework proposed in the present study.

3. Principles and Methods

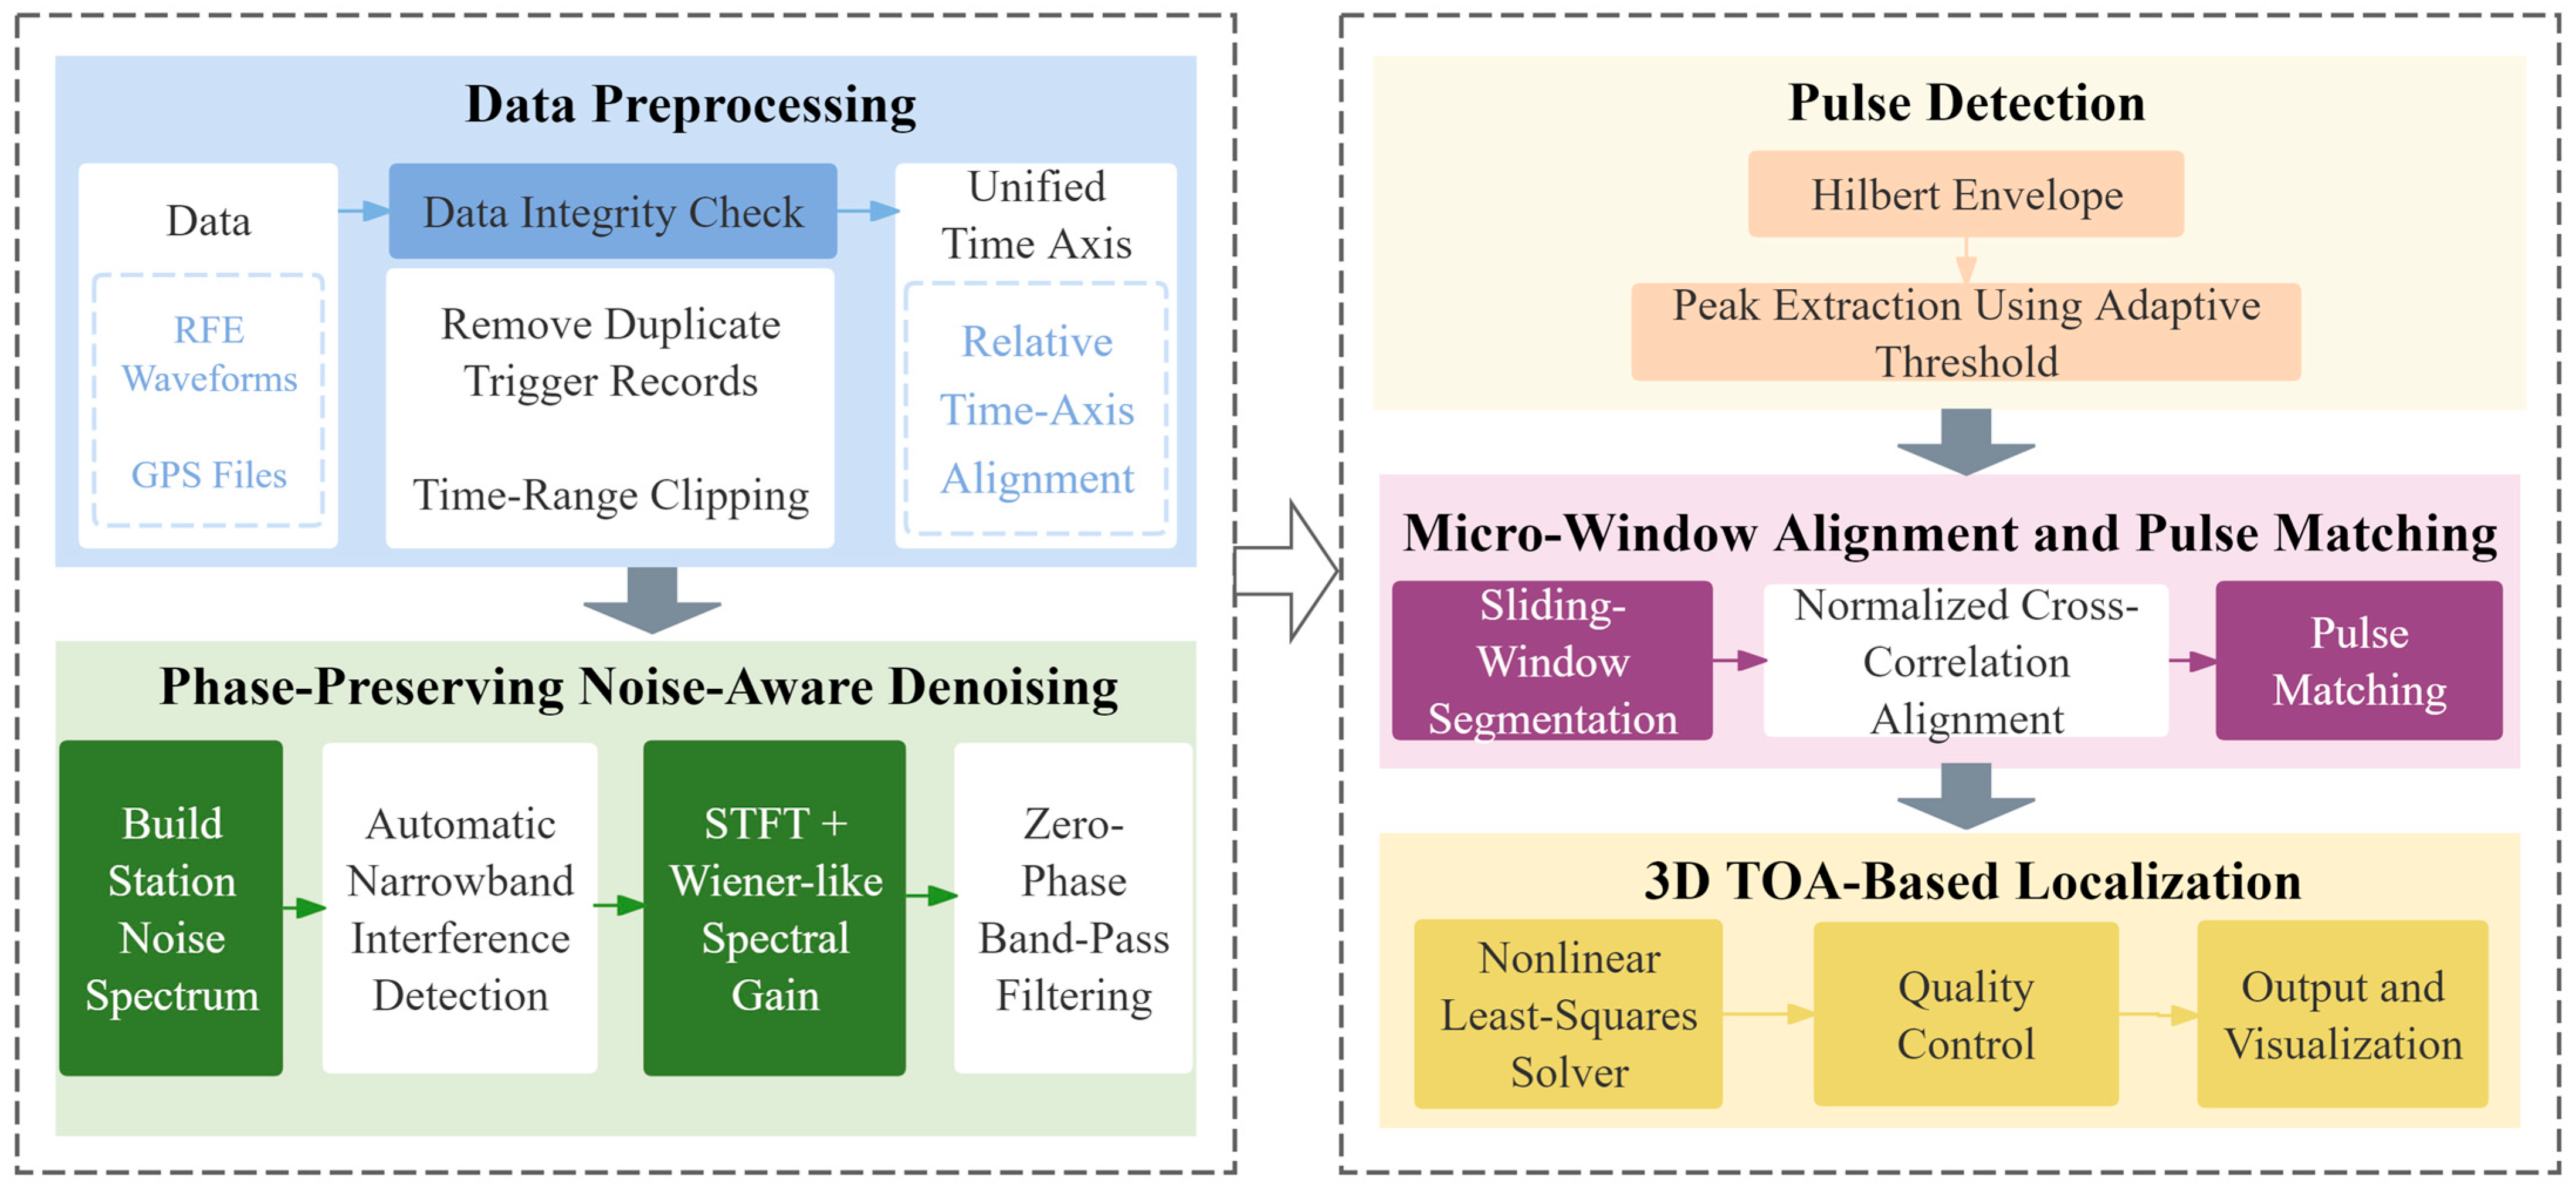
Based on the noise characteristics shown in Figure 2, this study adopts a software-based preprocessing strategy that simultaneously suppresses broadband random noise and stable narrowband interference in the time-frequency domain while preserving the phase structure required for accurate multi-station TOA matching. The complete workflow consists of three stages: (1) statistical modeling of the observed signal and noise, (2) STFT-domain adaptive Wiener spectral shrinkage with a station-specific RFI constraint, and (3) zero-phase bandpass filtering to remove residual interference without introducing group delay. The technical implementation is described in this section, and the overall 3D localization workflow is summarized in Figure 3.

3.1. Signal Model and Statistical Assumptions

The broadband electric-field signal observed at each ground station is modeled as:
y(t) = s(t) + n(t)
where s(t) is the lightning radiation signal—expressed as the linear convolution of the source term with the combined instrument and propagation impulse response and n(t) is the additive clutter noise. This model has been widely adopted in LF/VLF lightning localization [4,9].
Over the duration of a single triggered record (Section 2.1), the propagation path, the instrument response, and the average spectral profile of the background noise can be treated as time-invariant. Within each short-time STFT analysis frame (65,536 samples, i.e., 1.6384 ms at 40 MHz; Section 3.4), the signal and noise are further approximated as locally wide-sense stationary [4,11]. The noise term is decomposed into two physically distinct contributions: a broadband background component arising from receiver thermal noise and incoherent environmental fluctuations, and a narrowband line-interference component arising from communication or power-system emissions, which appears in the PSD as discrete spectral peaks with high amplitude and narrow bandwidth [4,41,42]. Impulsive components from electrostatic discharge or switching transients are not explicitly modeled; they are either sufficiently broadband to be absorbed into the background term or sufficiently sparse to affect only a small fraction of frames.
This two-component noise decomposition motivates the dual-mechanism preprocessing strategy adopted in this study: STFT-domain Wiener shrinkage targets the broadband component, while a station-specific frequency mask targets the narrowband component. Both operations are designed to act only on the amplitude spectrum so that the phase is preserved to within the GPS timing accuracy.

3.2. STFT-Domain Adaptive Wiener-like Spectral Shrinkage with an RFI Mask

Lightning electric-field signals are strongly non-stationary, with spectral content varying rapidly between different discharge phases (initial breakdown, dense pulse activity, return strokes) [43]. To handle this non-stationarity while retaining phase information, denoising is performed in the short-time Fourier transform (STFT) domain, where the observed signal is represented as a time-frequency map Y(f,t), and a real-valued, non-negative gain G ~ (f,t) is applied multiplicatively to obtain the denoised estimate.
Following the minimum mean square error principle of Wiener filtering [33,34] and accounting for finite-sample noise PSD estimation errors, a constrained spectral shrinkage form is adopted:
G ~ ( f , t ) = m a x ( 1 α S ^ n n ( f ) S ^ y y ( f , t ) , G m i n )
where S ^ n n ( f ) is the noise PSD estimated from a clear-sky pre-event interval, S ^ y y ( f , t ) is the smoothed local PSD of the observed signal, α ∈ (0, 1) controls the denoising strength, and Gmin is a lower-bound constraint preventing over-attenuation when PSD estimates are unstable. The shrinkage form attenuates frequency components where the local PSD is dominated by noise while preserving components where signal energy is present, providing soft suppression rather than hard cancellation.
Narrowband RFI components require separate treatment because their high amplitudes can cause them to be misclassified as high-SNR signal components by the Wiener gain. RFI bins are identified from S ^ n n ( f ) through a robust peak-detection procedure: (1) the log-domain noise PSD is referenced against a sliding-median baseline to obtain a residual spectrum; (2) candidate peaks are selected using a median absolute deviation (MAD) threshold; (3) connected candidate segments are grouped, peak centers and −3 dB bandwidths are estimated, and weak or closely spaced peaks are discarded; (4) accepted bands are extended by guard bins to suppress the spectral skirts. A station-specific frequency mask is then constructed as:
M ( f ) = d n o t c h ,   f d e t e c t e d   R F I   b a n d s   ( w i t h   g u a r d )       1 ,                                                     o t h e r w i s e
where dnotch ∈ (0, 1) controls the depth of narrowband suppression. The final STFT-domain gain combines the two mechanisms:
G ~ f i n a l ( f , t ) = M ( f ) G ~ ( f , t )
This combined gain imposes frequency-selective constraints on the Wiener gain without resorting to hard notch filtering, thereby reducing ringing artifacts and improving stability in complex interference environments [41,42]. Crucially, because G ~ f i n a l ( f , t ) is real-valued and non-negative, the operation acts only on the amplitude spectrum: the STFT phase ∠Y(f,t) is left unchanged, and the inverse STFT is performed with window and overlap parameters satisfying the constant overlap-add condition, ensuring that no systematic time shift is introduced during reconstruction.

3.3. Zero-Phase Filtering for TOA Preservation

In TOA-based 3D lightning localization, multi-station timing consistency is the dominant determinant of localization accuracy [4,5,16]. Any phase rotation or non-zero group delay introduced by signal processing translates directly into systematic TOA bias and increased inversion residuals.
To remove out-of-band energy and any residual narrowband interference after the STFT-domain stage—while avoiding group delay—a zero-phase bandpass filter is applied directly in the frequency domain. For any stable real-valued filter with frequency response H(e), the cascade of forward and time-reversed backward filtering yields:
H z f ( e jw )   =   H ( e jw )   H ( e jw )   =   H ( e j w ) 2
which is purely real and non-negative, giving zero overall phase and zero group delay [36,44]. Rather than realizing Equation (5) through two time-domain filtering passes, the present implementation constructs this real, non-negative response directly as an even-symmetric spectral mask (unity in the passband, raised-cosine transitions at both band edges, and zero elsewhere; parameter values are given in Section 3.4) and applies it to a single spectral transform of the full record. This frequency-domain implementation requires no boundary extension or edge-discarding, and the raised-cosine transitions suppress ringing at the band edges. The combination of STFT-domain phase-preserving Wiener shrinkage and the final zero-phase filtering forms the WZ framework, which is hereafter referred to simply as WZ.

3.4. Implementation and Parameter Selection

The WZ framework is applied uniformly to all seven stations of the Qinghai Datong network. The STFT uses a Hann window [45] with an FFT length of 65,536 and 50% overlap. The noise PSD and the RFI mask are estimated independently for each station from the pre-trigger segment of each record, which precedes the trigger time and thus represents the pre-lightning background; the robust sliding-median baseline used in the RFI detection makes this estimation insensitive to any weak transient occasionally present in the segment. The estimated PSD is then smoothed and interpolated onto the STFT frequency grid, and the RFI mask adapts to each station’s interference environment. Wiener shrinkage is applied within f ≤ 3 MHz, and the final zero-phase bandpass filter operates between 50 kHz and 3 MHz with a raised-cosine taper at both band edges (lower taper: 50 kHz; upper taper: 2.5–3.0 MHz) rather than hard cutoffs, minimizing transient ringing at the passband boundaries. As described in Section 3.3, this band-pass stage is realized as a frequency-domain spectral mask; it therefore has no filter order, and its zero-phase property follows from the real, symmetric frequency response. It is applied to the entire record in a single transform without boundary extension. A two-dimensional smoothing kernel of 5 frequency bins × 3 time frames is applied to the gain surface to suppress musical-noise artifacts; for the microsecond-scale pulses of the synthetic-signal experiments (Section 3.5), this kernel is reduced to 3 × 1 to avoid smearing the pulse across adjacent frames.
The default parameters for noise estimation, RFI detection, and gain control are summarized in Table 2. For station QSZ, which exhibits a denser comb-like RFI spectrum (Figure 2), station-specific parameters with tighter peak resolution and deeper notch suppression are used. The two-level minimum gain constraint (Gmin) allows aggressive suppression at interference-dominated frequencies while preventing over-attenuation in normal bands.
These parameter values have produced stable noise suppression and good TOA fidelity across multiple thunderstorm cases from the 2024–2025 seasons, making them suitable for downstream pulse matching and 3D localization. Their robustness is further confirmed by a sensitivity analysis of the two key RFI-detection parameters, the MAD threshold kMAD and the guard margin Ng (Supplementary Material, Figure S2), in which the denoising performance remains essentially unchanged under moderate variations in both parameters.

3.5. Synthetic Signal Validation Setup

To quantify the effect of WZ on time-domain pulse structure and TOA extraction accuracy under controlled conditions, a synthetic signal was constructed to replicate the composite noise environment observed at the Datong network. The clean pulse waveform consists of two Gaussian-enveloped cosine pulses with an additional asymmetric bipolar component approximating the broadband LF electric-field pulse morphology:
s ( t ) = i = 1 2 A i e x p ( ( t t 0 , i ) 2 τ 2 ) cos ( 2 π f 0 ( t t 0 , i ) ) + 0.35 i = 1 2 A i e x p ( ( t t 0 , i δ ) 2 τ 2 ) cos ( 2 π f 1 ( t t 0 , i δ ) )
with pulse centers t0,1 = 10 ms and t0,2 =10.015 ms, amplitudes A1 = 2.0 and A2 = 3.0, Gaussian envelope width τ = 6 μs, primary oscillation frequency f0 = 1.0 MHz, secondary frequency f1 = 1.2 MHz, and asymmetric tail offset δ = 2 μs. The two pulse centers are separated by 15 μs, comparable to the envelope width, so that the two pulses partially overlap and fall within a single STFT analysis frame, emulating the densely spaced successive pulses characteristic of real LF records. The total signal duration is 30 ms at a sampling rate of 40 MHz.
The composite noise term consists of (1) broadband 1/f colored noise with standard deviation σwb = 0.35, generated by spectral shaping of white Gaussian noise; (2) two amplitude-modulated narrowband sinusoids at 0.80 and 1.60 MHz with amplitudes 0.25 and 0.18, respectively; and (3) impulsive interference emulating electrostatic-discharge and switching transients. The narrowband components are modulated by a slowly varying envelope e ( t ) = 1 + a e n v sin ( 2 π f e n v t + φ 0 ) with modulation frequency fenv uniformly drawn from 10–80 Hz and modulation depth aenv from 0.10–0.30; the carrier phases are randomized over [0,2π) in each trial. The impulsive interference consists of three to five Gaussian-shaped transients per record, each with a width parameter of 2 μs, with amplitudes drawn uniformly from 0.5–1.5 × A2 and positions drawn uniformly over the record, excluding ±120 μs around either test pulse. This non-stationary noise design replicates the temporal variability of real RFI environments more faithfully than purely stationary sinusoids.
TOA is extracted from the Hilbert envelope peak within a ±6 μs search window centered on each pulse’s true arrival time, and the TOA error is defined as the deviation from the clean-pulse reference; the per-trial TOA RMSE is computed over the two pulses. The SNR is computed as the power ratio of the net signal energy within ±5 μs windows centered on the two true arrival times (total power minus the noise floor) to the noise-floor power estimated from the first 10% of the record. A total of 1000 Monte Carlo trials are performed, with the colored-noise realization, the modulation parameters and carrier phases, and the impulse count, times, and amplitudes independently randomized in each trial. All processing parameters follow the defaults in Table 2, with the gain-smoothing kernel set to 3 × 1 as described in Section 3.4. A fixed random seed is used so that the reported statistics are exactly reproducible. The same signal, noise, and evaluation protocol is applied identically to the three processing configurations compared in the ablation study of Section 4.1.

3.6. 3D Localization Workflow

For real observational data, the complete WZ-based 3D localization workflow proceeds in four stages, illustrated in Figure 3:
  • Preprocessing: data integrity check, removal of duplicate trigger records, and alignment of multi-station waveforms onto a unified time axis using GPS-stamped trigger metadata;
  • Phase-preserving denoising: per-station noise PSD estimation, automated RFI peak detection, STFT-domain Wiener shrinkage with the station-specific frequency mask, and final zero-phase bandpass filtering;
  • Pulse detection and multi-station matching: Hilbert envelope computation, adaptive-threshold peak extraction, sliding-window segmentation, and normalized cross-correlation alignment to identify common radiation pulses across stations;
  • 3D TOA-based localization: nonlinear least-squares inversion of multi-station arrival times for source position following the method of [16], with quality control on fitting residuals and station coverage.
This workflow is applied in Section 4 to both Monte Carlo simulations (Section 3.5) and real observational data from the 2024–2025 Datong thunderstorm seasons.

4. Results

This section is organized around three complementary validation tiers. First, Monte Carlo simulations (Section 4.1) provide a statistical quantification of SNR improvement and TOA accuracy under controlled noise conditions, and further assess multi-station TDOA consistency and three-dimensional localization accuracy against ground truth. Second, a representative 2024 thunderstorm case (20240804161442) is used in Section 4.2 and Section 4.3 to evaluate the spectral denoising performance, phase-preserving characteristics, and time-domain waveform fidelity of the WZ method on real observational data. Third, events from the 2025 Datong thunderstorm season—spanning two separate thunderstorm days and both intracloud and cloud-to-ground discharge types—are used in Section 4.4 to validate 3-D localization performance across contrasting discharge morphologies. Additional supporting figures—including synthetic signal construction and denoising sensitivity (Figures S1 and S2), per-station PSD comparisons (Figures S3–S9), and three-dimensional channel visualizations (Figures S10–S13)—are provided in the Supplementary Material.

4.1. Monte Carlo Ablation Analysis of Signal-to-Noise Ratio and TOA Performance

The Monte Carlo evaluation proceeds at two levels: Section 4.1.1 isolates the contribution of each processing component at the single-waveform level, and Section 4.1.2 assesses the resulting multi-station and three-dimensional performance.

4.1.1. Single-Waveform Ablation of SNR and TOA

To quantitatively characterize the contribution of each component within the WZ framework, an ablation study was conducted under the Monte Carlo framework described in Section 3.5. The synthetic signal consisted of a pair of closely spaced, partially overlapping radiation pulses superimposed on a 1/f colored broadband noise background, together with randomly generated narrowband and impulsive interference, so as to approximate the composite noise environment encountered in the plateau network observations (see Figure S1 for construction details). The three constituent operations of WZ—STFT-domain Wiener spectral shrinkage, the station-specific RFI mask, and the final zero-phase band-pass filter—were switched on and off to construct five configurations that isolate their individual and combined contributions: a zero-phase baseline (ZP) retaining only the zero-phase band-pass filter; a Wiener-only configuration (WO) retaining only the Wiener shrinkage; an RFI-mask-only configuration (RO) retaining only the RFI mask; a combined-gain configuration (WR) retaining both the Wiener shrinkage and the RFI mask but without the final zero-phase band-pass filter; and the full WZ. The RFI-mask-only configuration was realized by setting the estimated noise PSD to a negligible level, so that the Wiener gain reduces to unity and only the RFI notch remains active. All five configurations were compared under the same 1000 trials, with the SNR improvement and the time-of-arrival (TOA) root-mean-square error (RMSE) as evaluation metrics. The results are summarized in Table 3.
For the SNR improvement, the Wiener shrinkage and the RFI mask act on different parts of the noise spectrum and are mutually complementary. Applied alone, each yields a comparable and moderate improvement, 3.1 dB for WO and 3.1 dB for RO, reflecting the suppression of the in-band 1/f broadband background by the Wiener shrinkage and of the in-band narrowband interference by the RFI mask, respectively. Combining the two into WR raises the improvement to 6.7 dB, larger than either component alone and close to their sum, confirming that they suppress distinct, largely independent noise components. The zero-phase band-pass filter alone (ZP) yields only 2.7 dB, because the noise energy of the synthetic signal lies predominantly within the passband and the out-of-band residual it can remove is comparatively small. Once WR has removed the in-band noise, however, this out-of-band residual becomes the dominant remaining error; adding the zero-phase band-pass filter at this stage raises the improvement to 10.0 dB for the full WZ, the additional 3.3 dB corresponding to the removal of that out-of-band residual. The combined STFT-domain gain and the zero-phase band-pass filter thus act on the in-band and out-of-band regions, respectively, and contribute complementarily to the SNR.
The TOA RMSE reveals the distinct roles of the individual components and, in particular, identifies the RFI mask as the decisive factor for timing accuracy. The Wiener shrinkage applied alone (WO) does not improve the TOA RMSE but slightly raises it from 5.0 × 10⁻⁷ s to 5.3 × 10⁻⁷ s, and markedly broadens the error distribution, with the p95 increasing from 10.4 × 10⁻⁷ s to 26.7 × 10⁻⁷ s. This is because the Wiener gain, estimated from the noise PSD, treats the high-power narrowband lines as signal-like components and retains them; the residual narrowband interference then contaminates the Hilbert envelope and displaces its peak, occasionally producing large picking errors. By contrast, the RFI mask applied alone (RO) lowers the TOA RMSE to 3.7 × 10⁻⁷ s and narrows the p95 to 6.2 × 10⁻⁷ s, showing that it is the suppression of the narrowband interference, rather than the broadband shrinkage, that governs the TOA accuracy. Once the narrowband interference has been removed, adding the Wiener shrinkage becomes beneficial, and WR further reduces the TOA RMSE to 3.1 × 10⁻⁷ s. The final zero-phase band-pass filter contributes only marginally, lowering the TOA RMSE from 3.1 × 10⁻⁷ s at WR to 2.8 × 10⁻⁷ s at WZ; its principal role is to preserve the signal phase and avoid introducing timing bias. This property cannot be reflected in the present simulation, in which all configurations employ a zero-phase implementation, and is instead verified by the phase and group-delay analysis on real data (Section 4.2).
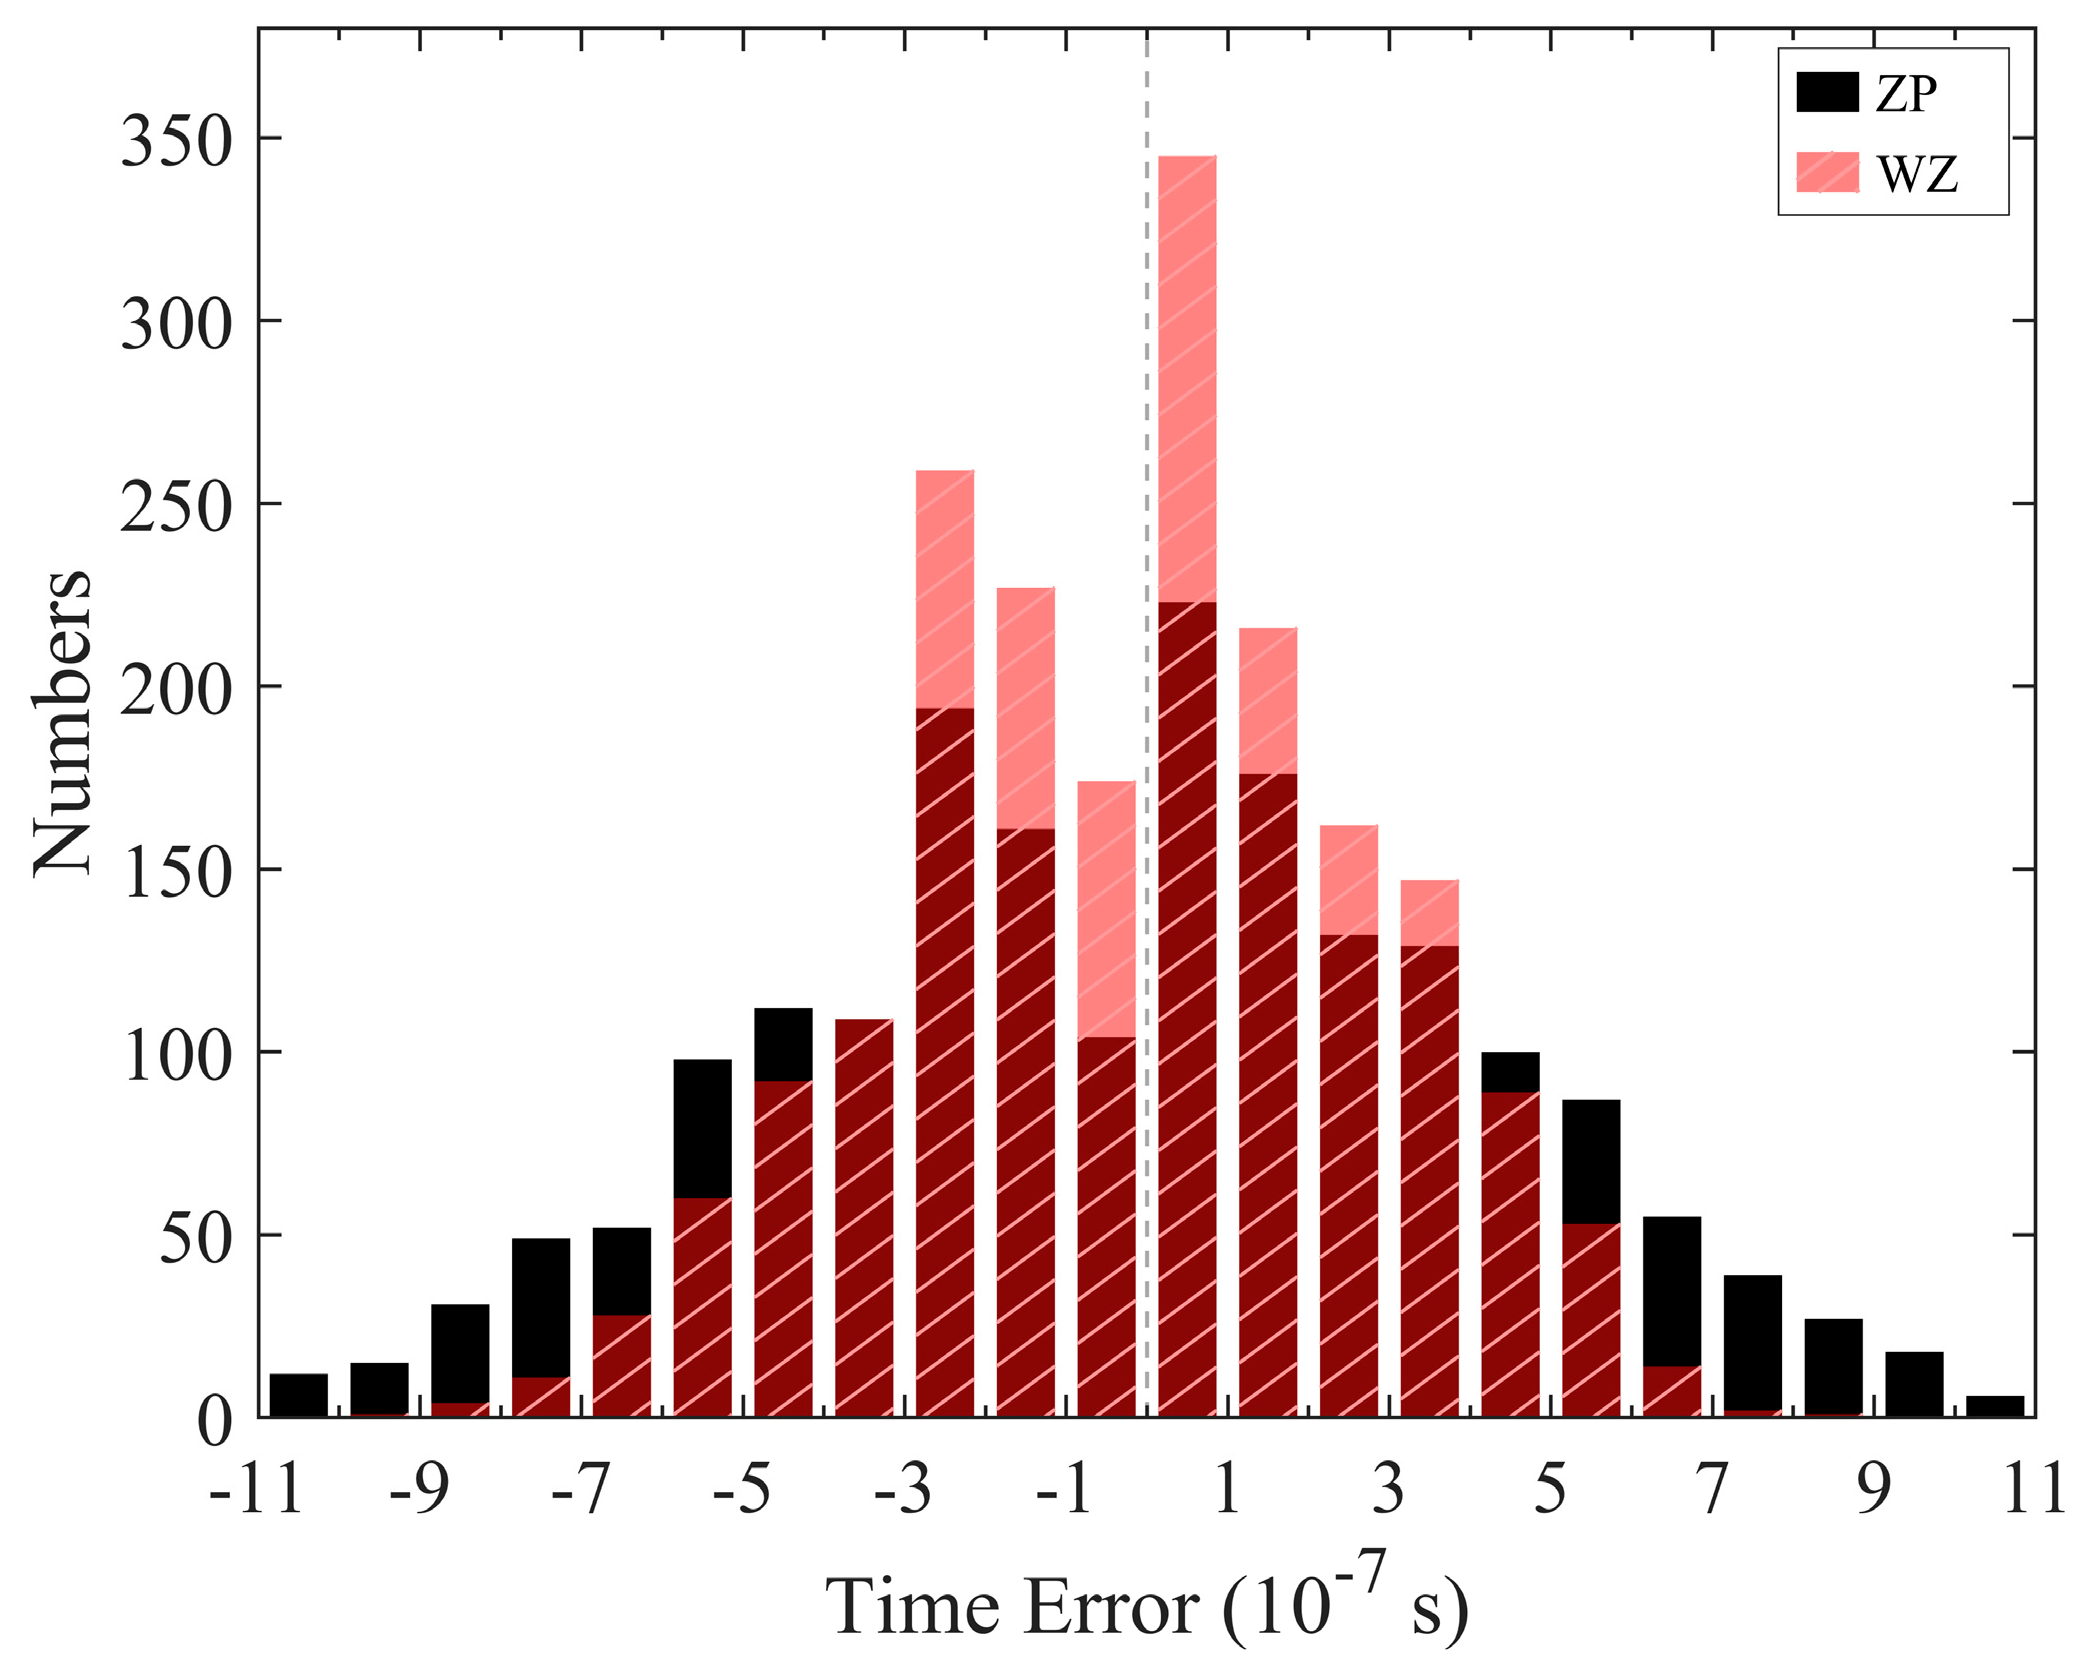
Figure 4 shows the TOA error distributions of the full WZ and the zero-phase baseline. For the full WZ (red), the errors are concentrated near zero and form a narrow, approximately symmetric peak, whereas the distribution of the zero-phase baseline (black) is markedly broader and more dispersed. This difference originates from the suppression of narrowband interference rather than from phase processing: the zero-phase baseline preserves the phase but does not suppress the in-band narrowband interference, so the envelope peak is contaminated and the error distribution broadens; in the full WZ, the combined STFT-domain gain suppresses the narrowband interference and removes the principal source of envelope-peak contamination, so the error distribution converges. This is consistent with Table 3, in which the p95 of the zero-phase baseline is 10.4 × 10⁻⁷ s, compared with 5.1 × 10⁻⁷ s for the full WZ. Moreover, 3.6% (71/2000) of the detections for the zero-phase baseline yield errors exceeding ±11 × 10−7 s, versus only 0.3% (6/2000) for the full WZ, further demonstrating the pronounced effect of narrowband-interference suppression in reducing the dispersion of the TOA error and in suppressing large-error events.
In summary, the five-configuration ablation isolates the role of each operation. The Wiener shrinkage and the RFI mask are complementary in the frequency domain—the former suppressing the in-band broadband background and the latter the in-band narrowband interference—and together account for the major part of the SNR improvement, while the zero-phase band-pass filter additionally removes residual out-of-band energy and preserves the phase. For the TOA accuracy, however, the contributions are not symmetric: the RFI mask is the decisive component, since narrowband interference is the principal source of envelope-peak contamination, whereas the Wiener shrinkage improves the TOA only after the narrowband interference has been removed. These results indicate that the value of WZ lies not in the single-station SNR gain per se, but in the suppression of narrowband interference that governs TOA accuracy, together with the phase preservation that avoids timing bias. Whether this single-waveform improvement translates into reduced inter-station inconsistency and higher three-dimensional accuracy is examined in Section 4.1.2.

4.1.2. Multi-Station TDOA Consistency and 3D Localization Accuracy

The ablation above evaluates single-waveform metrics. To test directly whether WZ reduces inter-station timing inconsistency and improves the three-dimensional accuracy that ultimately governs localization, a multi-station Monte Carlo experiment was performed using the true seven-station geometry of the Datong network (Section 2.1). In each trial a radiation source was placed at a prescribed position (horizontal offset within ±8 km, height 1–8 km), and its waveform was generated at every station with the corresponding propagation delay, superimposed on an independent realization of the composite noise (Section 3.5) whose per-station level follows the measured inter-station differences (Figure 2). Each station waveform was processed under two configurations, the zero-phase baseline (ZP) and the full WZ, and the arrival time was extracted with the same envelope-based picker used in the localization pipeline. The picked arrival times were then inverted for the source position using the same nonlinear least-squares solver applied to the real data. A total of 200 source positions × 200 noise realizations were evaluated; as the source positions are prescribed, the accuracy is assessed directly against ground truth.
Table 4 reports two quantities. The multi-station TDOA error characterizes the inter-station timing consistency and is defined as the deviation of the picked inter-station time differences, referenced to station SXZ, from their true values; the three-dimensional position error characterizes the final localization accuracy and is the deviation of the located position from the injected source. As both distributions are long-tailed, with their upper end dominated by a small fraction of geometrically ill-conditioned, divergent inversions, the median is used as a robust summary. Relative to the zero-phase baseline, WZ approximately halves all three error measures: the median TDOA error decreases by 49%, from 272 ns to 139 ns, and the median horizontal and vertical position errors by 52% and 47%, from 288 m and 367 m to 138 m and 194 m, respectively. This reduction is consistent across the full error distribution rather than confined to its centre, and both configurations remain essentially unbiased. WZ additionally yields a lower median fit residual, with a χ2 of 1.52 against 1.97 for ZP, while locating substantially more sources than ZP, consistent with the source-recovery gain observed on real data (Section 4.4). The absolute error magnitudes correspond to a deliberately demanding noise level chosen so that the two configurations remain distinguishable, and thus represent conservative bounds rather than the operational timing accuracy, which is more directly characterized by the real-data picked-TOA shift in Section 4.2, whose 95th-percentile |Δτ| is below 55 ns.
At the multi-station and three-dimensional level and against an independent ground-truth reference, WZ therefore reduces inter-station timing inconsistency and the resulting position error while remaining unbiased—a reduction governed by the processing itself and independent of the chosen noise level.

4.2. Spectral and Phase-Preserving Performance of the Filtering Method

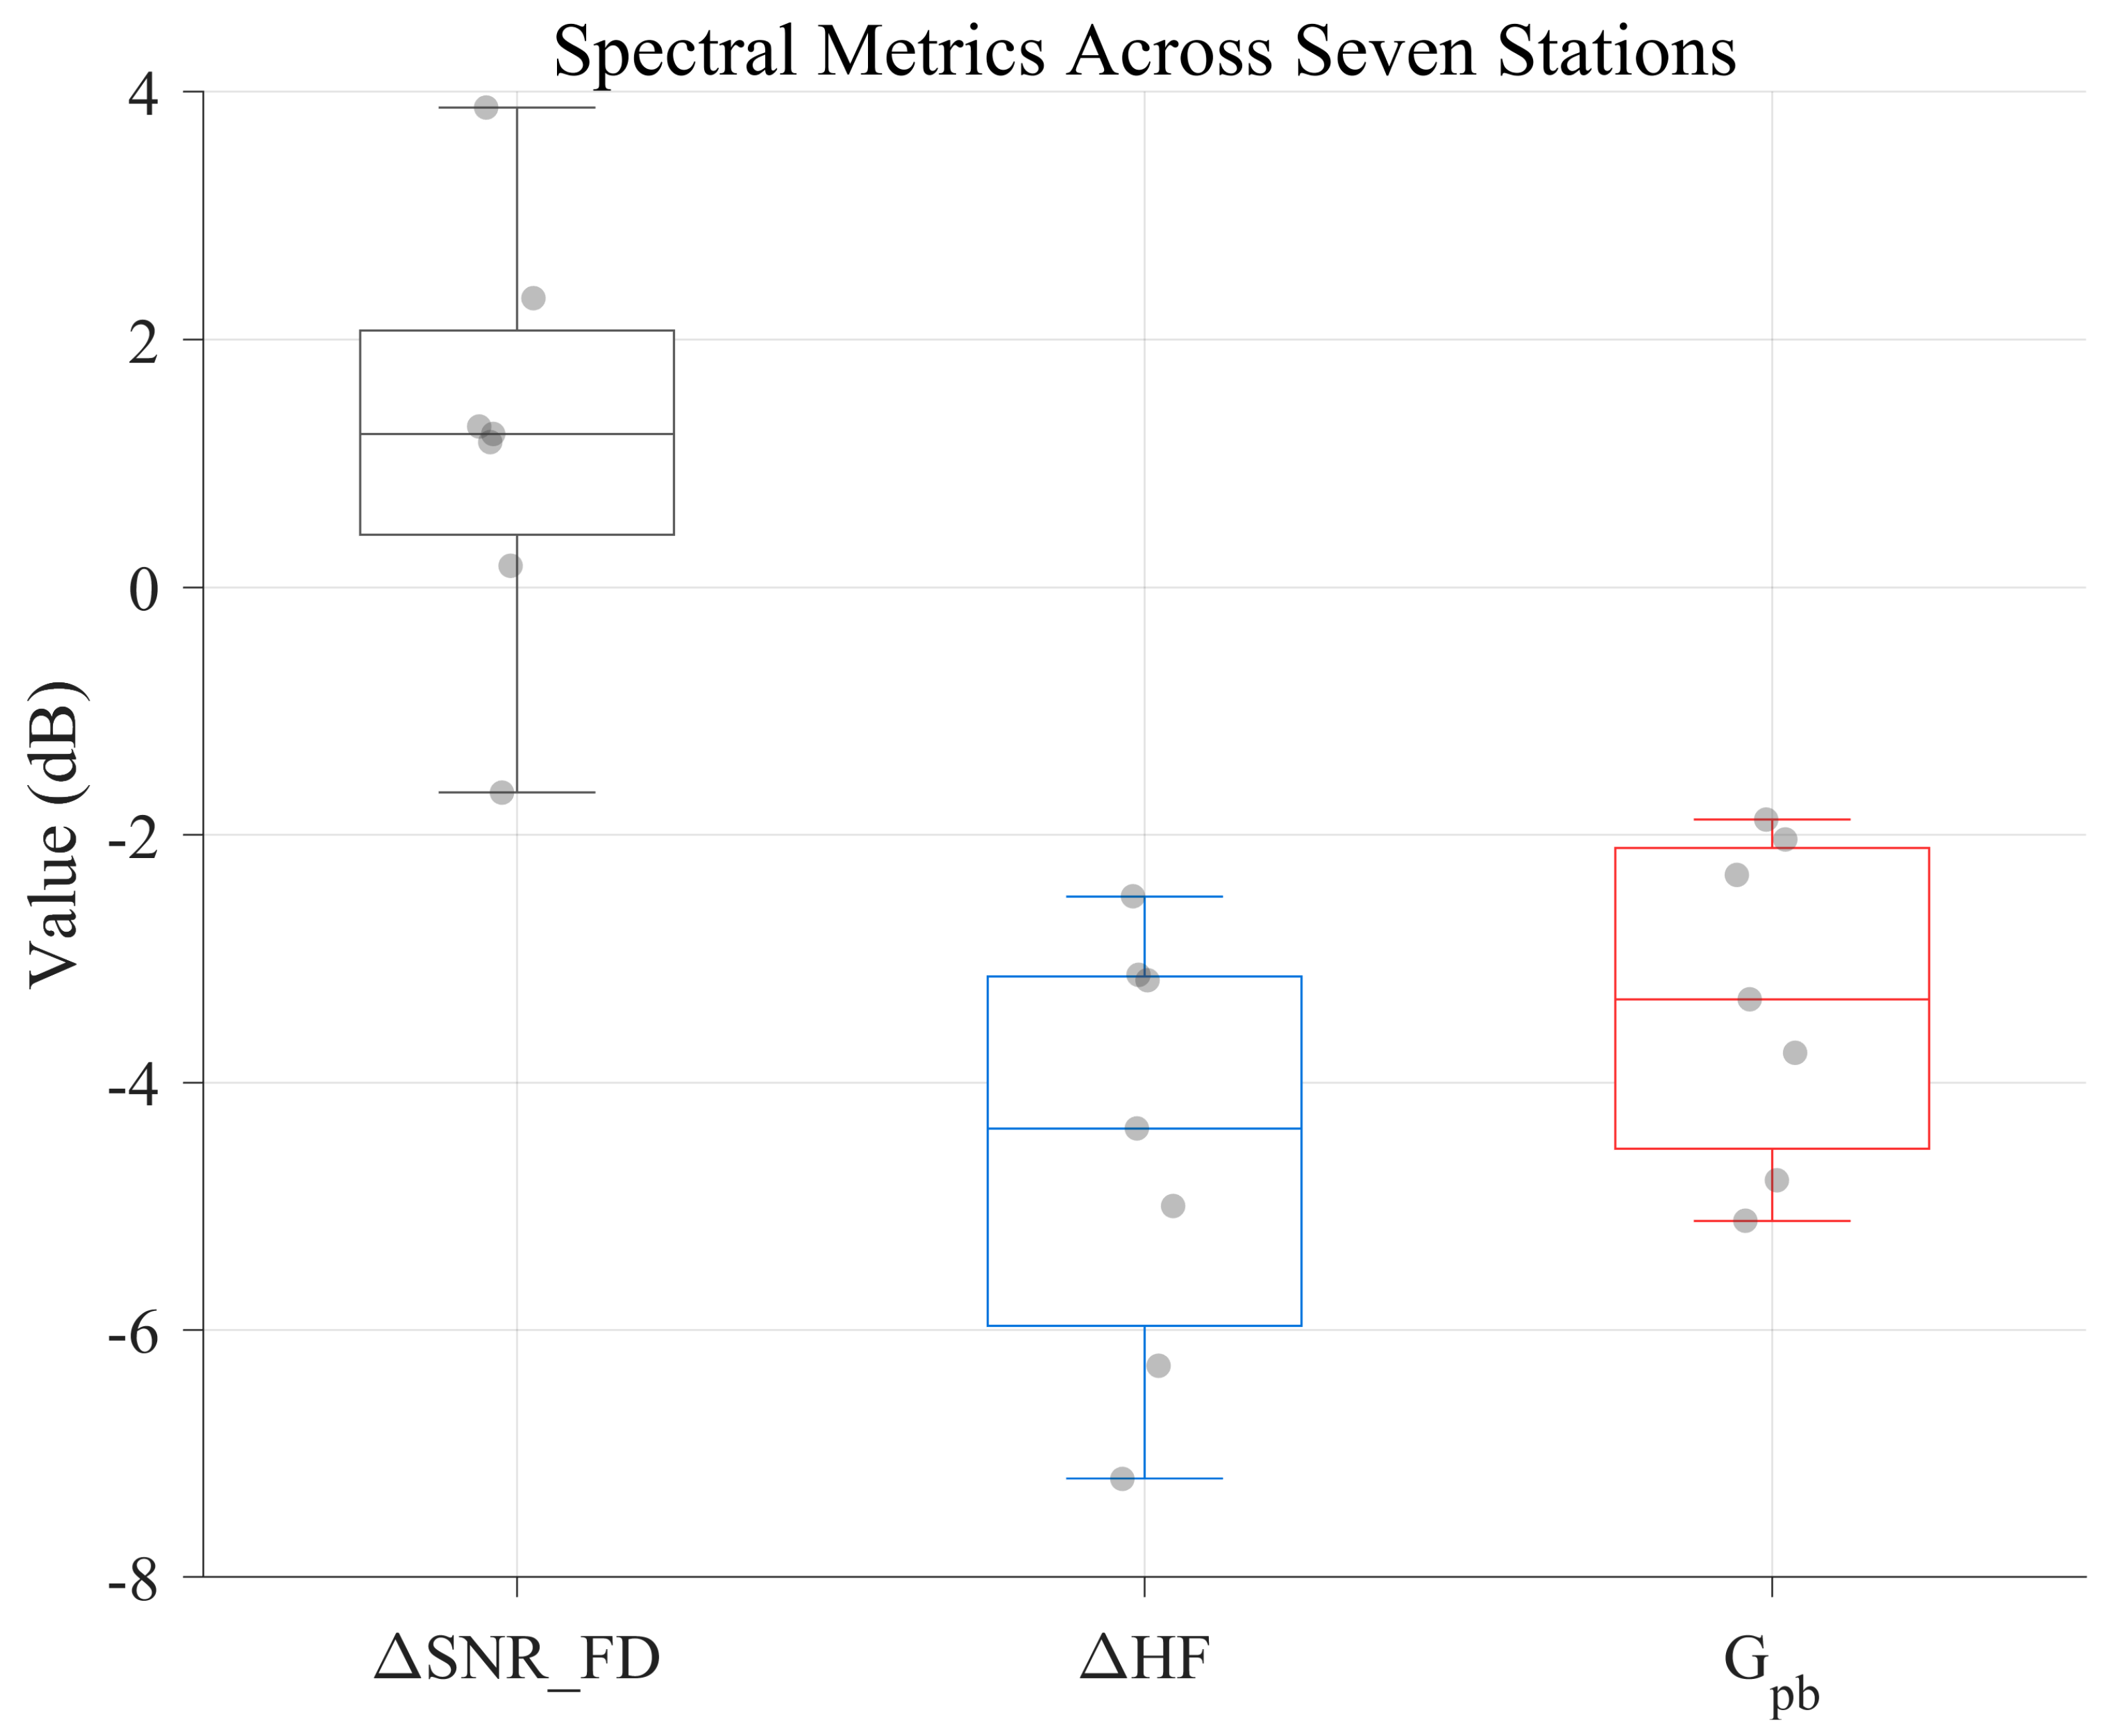
The proposed Wiener plus zero-phase filtering method is evaluated in two respects: its noise suppression in the spectral domain, and its preservation of phase and timing consistency across stations. To quantitatively evaluate the denoising performance of the proposed Wiener plus zero-phase filtering method, a representative case (20240804161442) was selected to compare the power spectral density (PSD) of the broadband electric-field waveforms recorded at the seven stations before and after filtering. The PSD was estimated using the Welch method [46], with a Hann window [45] applied to each segment, and the results are expressed in dB/Hz. Here, 50 kHz–2.5 MHz is defined as the main signal band, while 2.5–3.0 MHz is taken as the high-frequency reference band for evaluating the residual noise level. Three spectral-domain metrics are introduced:
  • SNR improvement (ΔSNR_FD): the increase in the power difference between the main signal band and the high-frequency reference band after filtering;
  • High-frequency attenuation (ΔHF): the change in the average power within the high-frequency reference band, where a more negative value indicates stronger suppression;
  • Passband level deviation (Gpb): the change in the average power within the main signal band relative to the original signal, where a negative value indicates slight passband attenuation.
It should be noted that two different definitions of SNR improvement are used in this study, and they are not directly comparable. In Table 3, the ΔSNR based on the Monte Carlo simulations is defined in the time domain using a power-ratio method: the SNR is defined as the ratio of the net power within the signal window (total power minus the noise floor) to the power in a noise-only segment, thus incorporating the energy over the entire frequency range. Under this definition, the mean ΔSNR of the WZ method is 10.0 dB. By contrast, in the PSD comparison for real data (Figure 5), because a clean reference signal is unavailable, ΔSNR_FD is defined using a frequency-domain proxy: the median PSD within the main radiation band (50 kHz–2.5 MHz) is taken as the signal proxy, and the median PSD within the high-frequency band is taken as the noise proxy; the change in the difference between the two before and after filtering is then calculated. Because the real signal still contains appreciable broadband energy outside the main band, which is included in the noise estimate, this definition yields a more conservative value, with a mean ΔSNR_FD of +1.2 dB across the stations. The time-domain metric is used for quantitative comparison with the simulations, while the frequency-domain metric characterizes in-band noise suppression.
To further demonstrate the consistency of the algorithm across stations, Figure 5 summarizes the three spectral metrics for all seven stations. The values of ΔSNR_FD range approximately from −1.7 to +3.7 dB (mean +1.2 dB), ΔHF ranges from −2 to −7 dB, and Gpb lies between −2 and −5 dB. The relatively narrow interquartile ranges of all three metrics indicate that the filtering performance is stable and consistent across different stations. These spectral comparisons confirm stable noise suppression across the stations while preserving the spectral shape and physical fidelity of the lightning radiation signal for the subsequent pulse-matching and localization steps.
The phase-preserving performance of the zero-phase filter was examined using the same representative case. Analysis of the phase spectrum and group delay before and after denoising shows phase differences close to zero across all frequency bands, with negligible group-delay offsets, and no significant systematic timing shift was observed between the raw and filtered waveforms in the tested cases. Table 5 summarizes the phase and group-delay statistics for all stations. For every station, the mean absolute phase difference φMean is below 0.13°, the maximum phase difference φMax does not exceed 1.4°, and the mean group delay τMean ranges from about 100 to 250 ps. These values are roughly two orders of magnitude smaller than the 50 ns GPS timing accuracy of the network, confirming that the WZ filter introduces no operationally significant timing bias. The zero-phase property of the band-pass mask follows by construction from its real-valued, even-symmetric frequency response (Section 3.3), so that no net group delay is introduced; the small non-zero τMean values in Table 5 are the mean group delay averaged across frequency bins within the passband, whose signed contributions cancel in aggregate. Any phase variations outside the passband occur in low-SNR ranges that lie outside the band retained for TOA extraction and do not affect the localization results. While the group-delay analysis characterizes the phase response of the filter itself, it does not directly quantify the shift in the picked arrival time that actually enters the localization; this is examined next.
The picked pulse arrival time is the quantity that actually enters the localization. To test directly whether WZ shifts it, the Hilbert-envelope peak of every strong, cleanly identifiable pulse was picked over the entire record and at all seven stations, on both the raw and the WZ-processed waveforms within the TOA-extraction band (50 kHz–2.5 MHz), and the picked-time difference Δτ = tWZ − traw was computed. Only pulses with a well-defined peak in both versions were retained (5575 pulses in total), since the shift is meaningful only where the arrival time can be reliably picked before and after processing. As summarized in Table 6, Δτ is centred at zero at every station: the per-station mean lies within ±3 ns and the median within ±6 ns, so WZ introduces neither a systematic timing bias nor a station-dependent one. The dispersion is likewise small—an overall standard deviation of 27 ns, a 95th percentile of |Δτ| of 54.8 ns, and a maximum of 74 ns—i.e., below the 80 ns arrival-time uncertainty budget of the inversion and comparable to the 50 ns GPS timing accuracy. The nanosecond-level dispersion reflects the statistical jitter of envelope-peak picking under finite SNR rather than any filter-induced phase distortion, consistent with the picosecond-level group delay in Table 5. Because localization depends on the differences in arrival times between stations rather than their absolute values, and the per-station shifts are zero-mean and mutually independent, the perturbation to any inter-station time difference is of order √2 × 27 ≈ 38 ns, well within the inversion budget. The picked-TOA shift therefore confirms directly what the group-delay analysis indicated indirectly: WZ preserves the picked arrival times, and in particular the inter-station timing, to a level that is negligible for three-dimensional localization.
Overall, these spectral and phase analyses show that the proposed Wiener plus zero-phase filtering method effectively suppresses both broadband and narrowband noise while preserving multi-station phase consistency, keeping the resulting shift in the picked arrival times—and hence in the inter-station timing—within the arrival-time uncertainty budget of the inversion.

4.3. Time-Domain Denoising and Multi-Station Pulse Matching

This section examines the filtering from the time-domain perspective, using the same representative case (20240804161442). It first considers whether the denoising preserves the waveform at a single station, and then whether the preserved pulses can be consistently matched across stations.
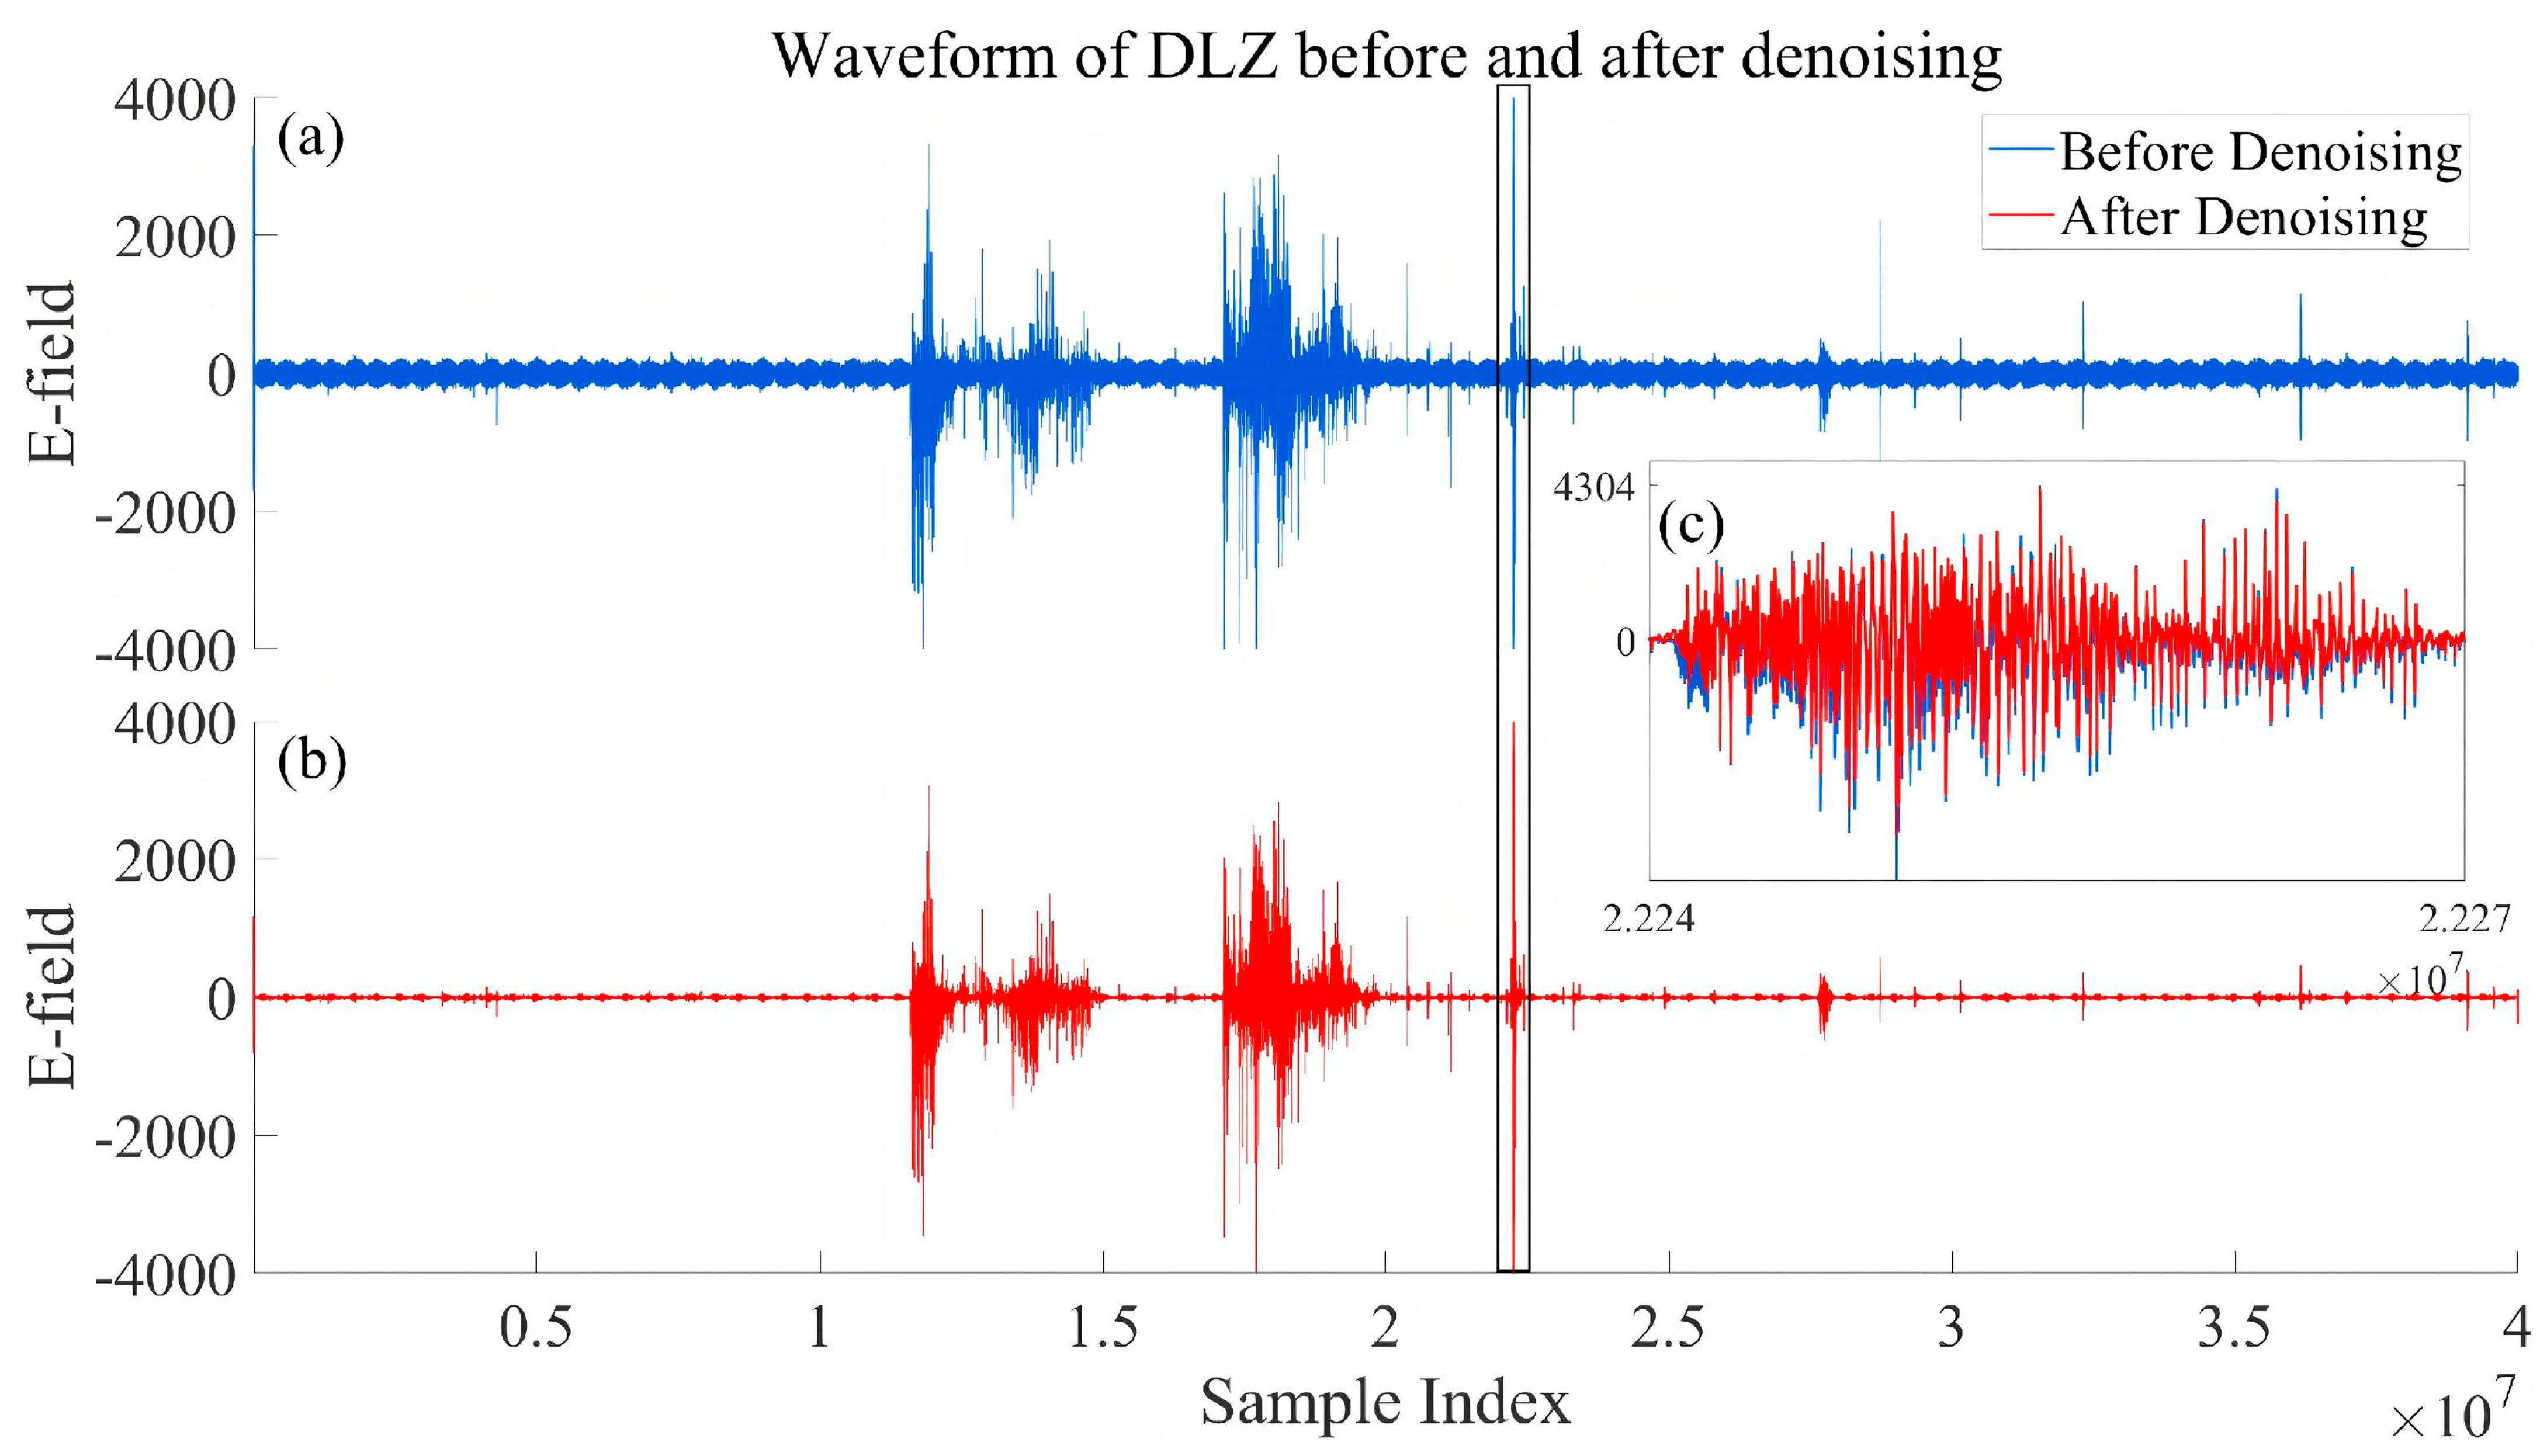
Figure 6 compares the full DLZ waveform before and after filtering. Before filtering (Figure 6a), the waveform shows pronounced high-frequency fluctuations and isolated spikes reaching ±4000 ADC counts, with an unstable baseline that can interfere with pulse extraction and cross-station matching. After filtering (Figure 6b), the background noise and spike-like interference are markedly suppressed and the main discharge pulse stands out, while the envelope shape, polarity variations, and baseline are preserved. The enlarged view (Figure 6c) shows that the oscillatory details of the pulses remain continuous and undistorted, with no trailing or peak clipping, and the denoised waveform follows the original closely. The filtering thus improves the signal-to-noise ratio while preserving the intrinsic waveform characteristics of the lightning electric-field signal.
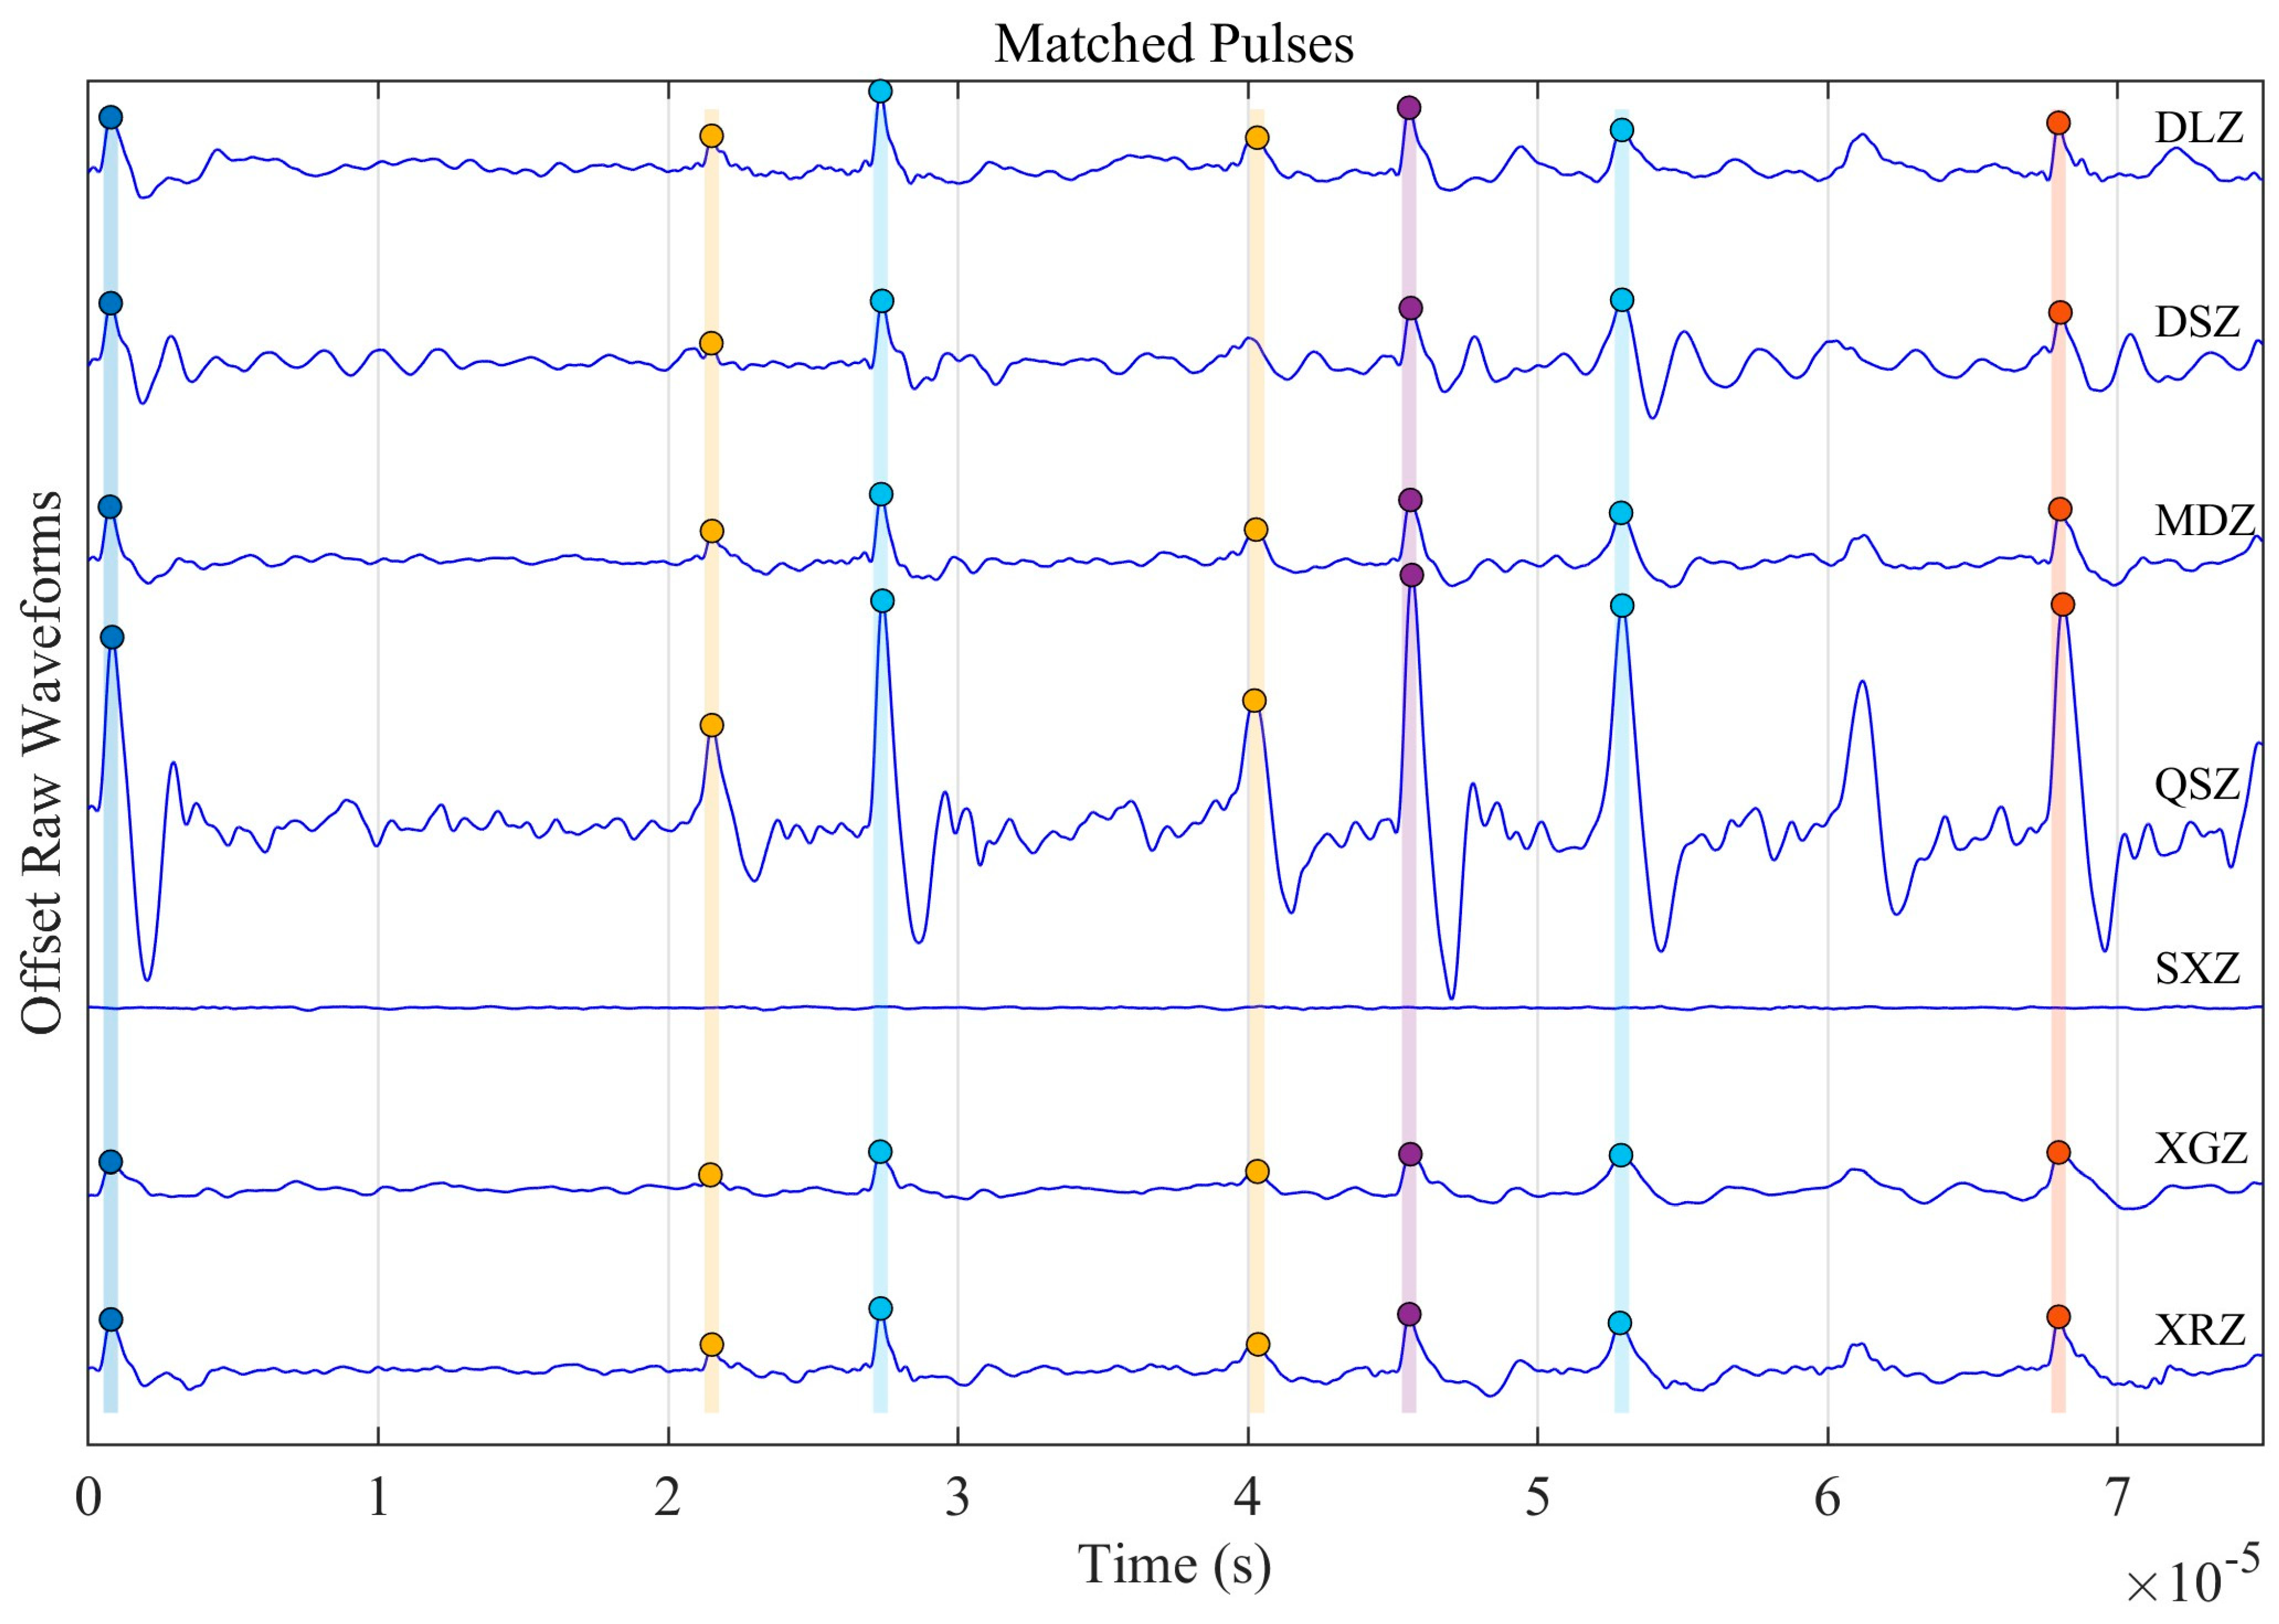
Building on this single-station fidelity, Figure 7 examines whether the same pulses can be matched across the seven stations within one time window, with the waveforms plotted at vertical offsets and matched groups marked by shaded bars and peak circles. Seven matched pulse groups are identified, and for most groups corresponding peaks are found at the majority of stations, with good consistency in their relative arrival times. Within each group, the peaks at different stations show small but systematic horizontal offsets that reflect the propagation-time differences from the source to each station, confirming that the method reliably extracts common radiation pulses from the multi-station observations. The response varies between stations: most show clear peak correspondences, whereas QSZ has notably larger amplitudes—suggesting it is closer to the source—and SXZ responds weakly for this event. Figure 7 thus confirms the physical plausibility of the matching at the denoised waveform level, and indicates that inter-station differences in signal strength and waveform complexity should be taken into account in the subsequent 3-D localization.

4.4. 3D Localization Validation

Events recorded during the 2025 Datong thunderstorm season are selected to validate the localization performance of the proposed preprocessing method, spanning two separate thunderstorm days and both intracloud and cloud-to-ground discharge types. Two intracloud flashes on 28 July are analyzed in detail: event 20250728204844 demonstrates the gains in channel structure recovery enabled by WZ preprocessing, with emphasis on source continuity and propagation speed estimation, while event 20250728205211, which exhibits a complex multi-branch discharge architecture, serves as a direct head-to-head comparison between BP and WZ, as its structural complexity places considerably higher demands on TOA accuracy and thus more clearly discriminates preprocessing performance. Two further events from 11 August are then used to examine generality across discharge types and observation days.
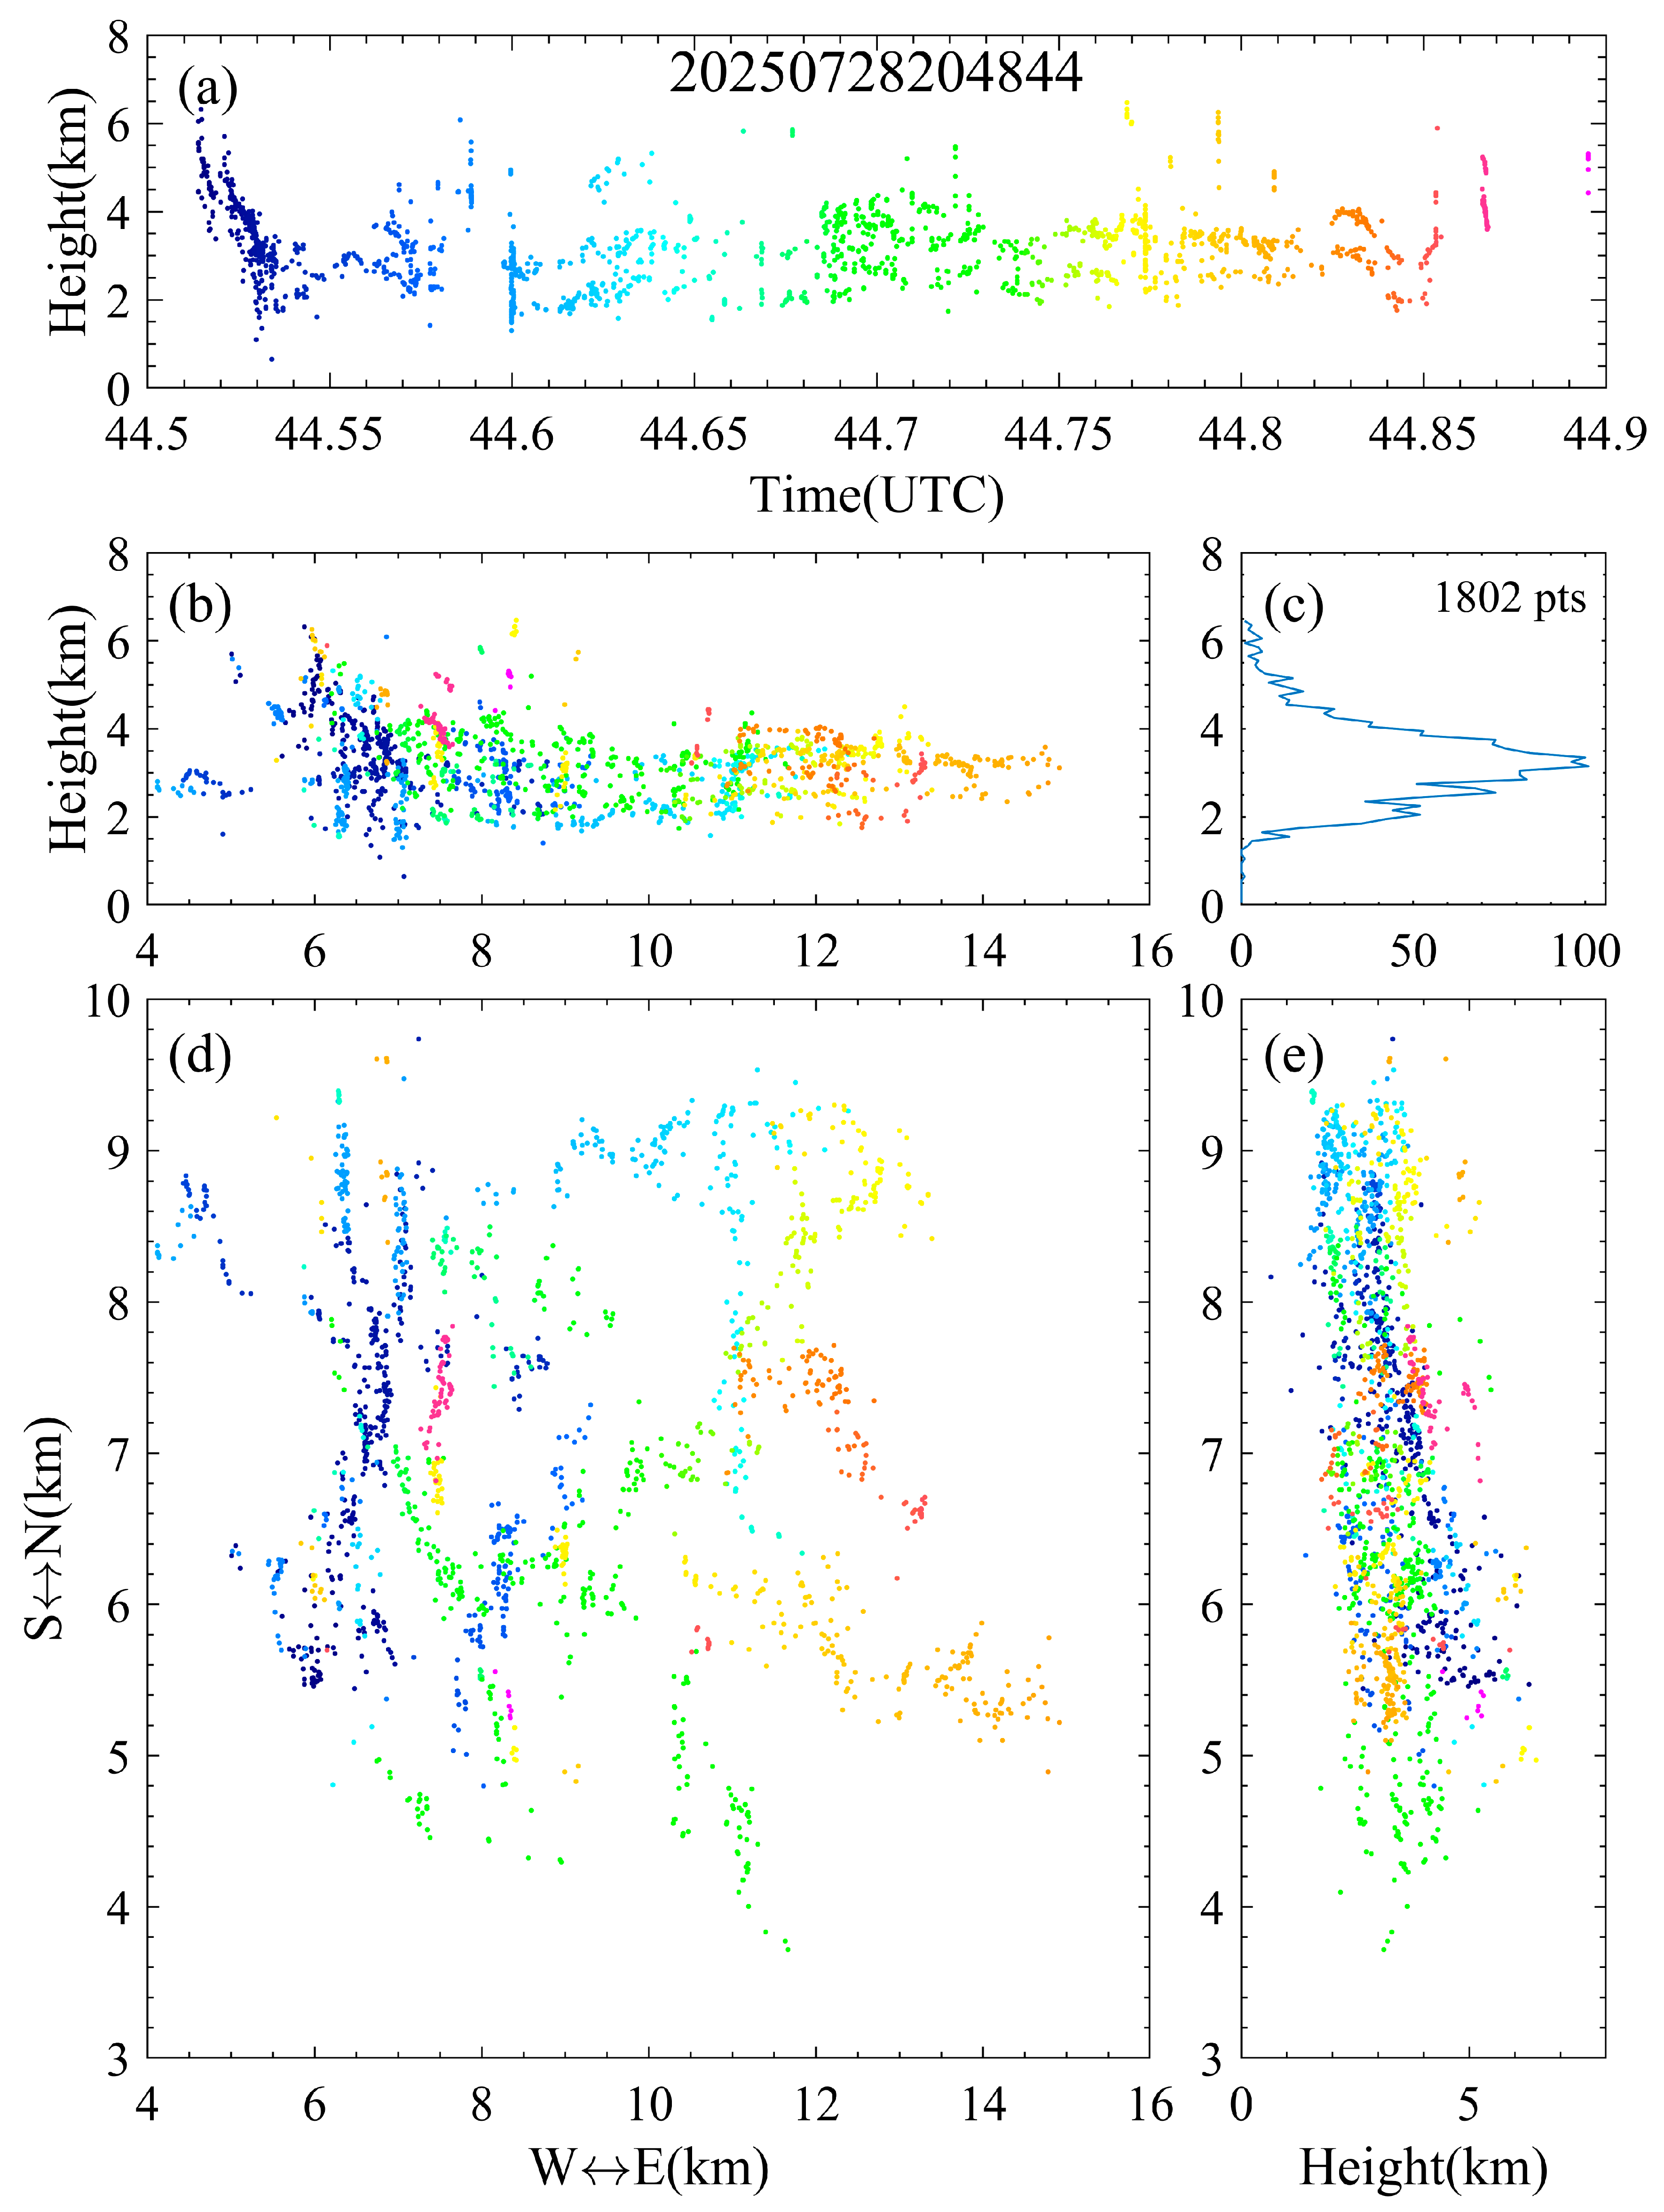
Figure 8 shows the 3-D localization of event 20250728204844 after WZ preprocessing, yielding 1802 valid radiation sources (Figure 8c). Throughout this study, source heights are referenced to the lowest station of the network (MDZ, 2489.56 m above sea level). Points are color-coded from blue (early) to magenta (late). The flash lasts ~0.4 s, with radiation concentrated at 2–5 km and a few scattered sources near 6 km in its later stage. The channel extends mainly east–west with a compact north–south span (Figure 8b,d), showing clear horizontal branching, while the vertical projection (Figure 8e) reveals a denser, more continuous mid-to-lower channel. The results are continuous and physically consistent in both time and space, confirming that WZ preserves channel detail and improves the interpretability of 3-D localization.
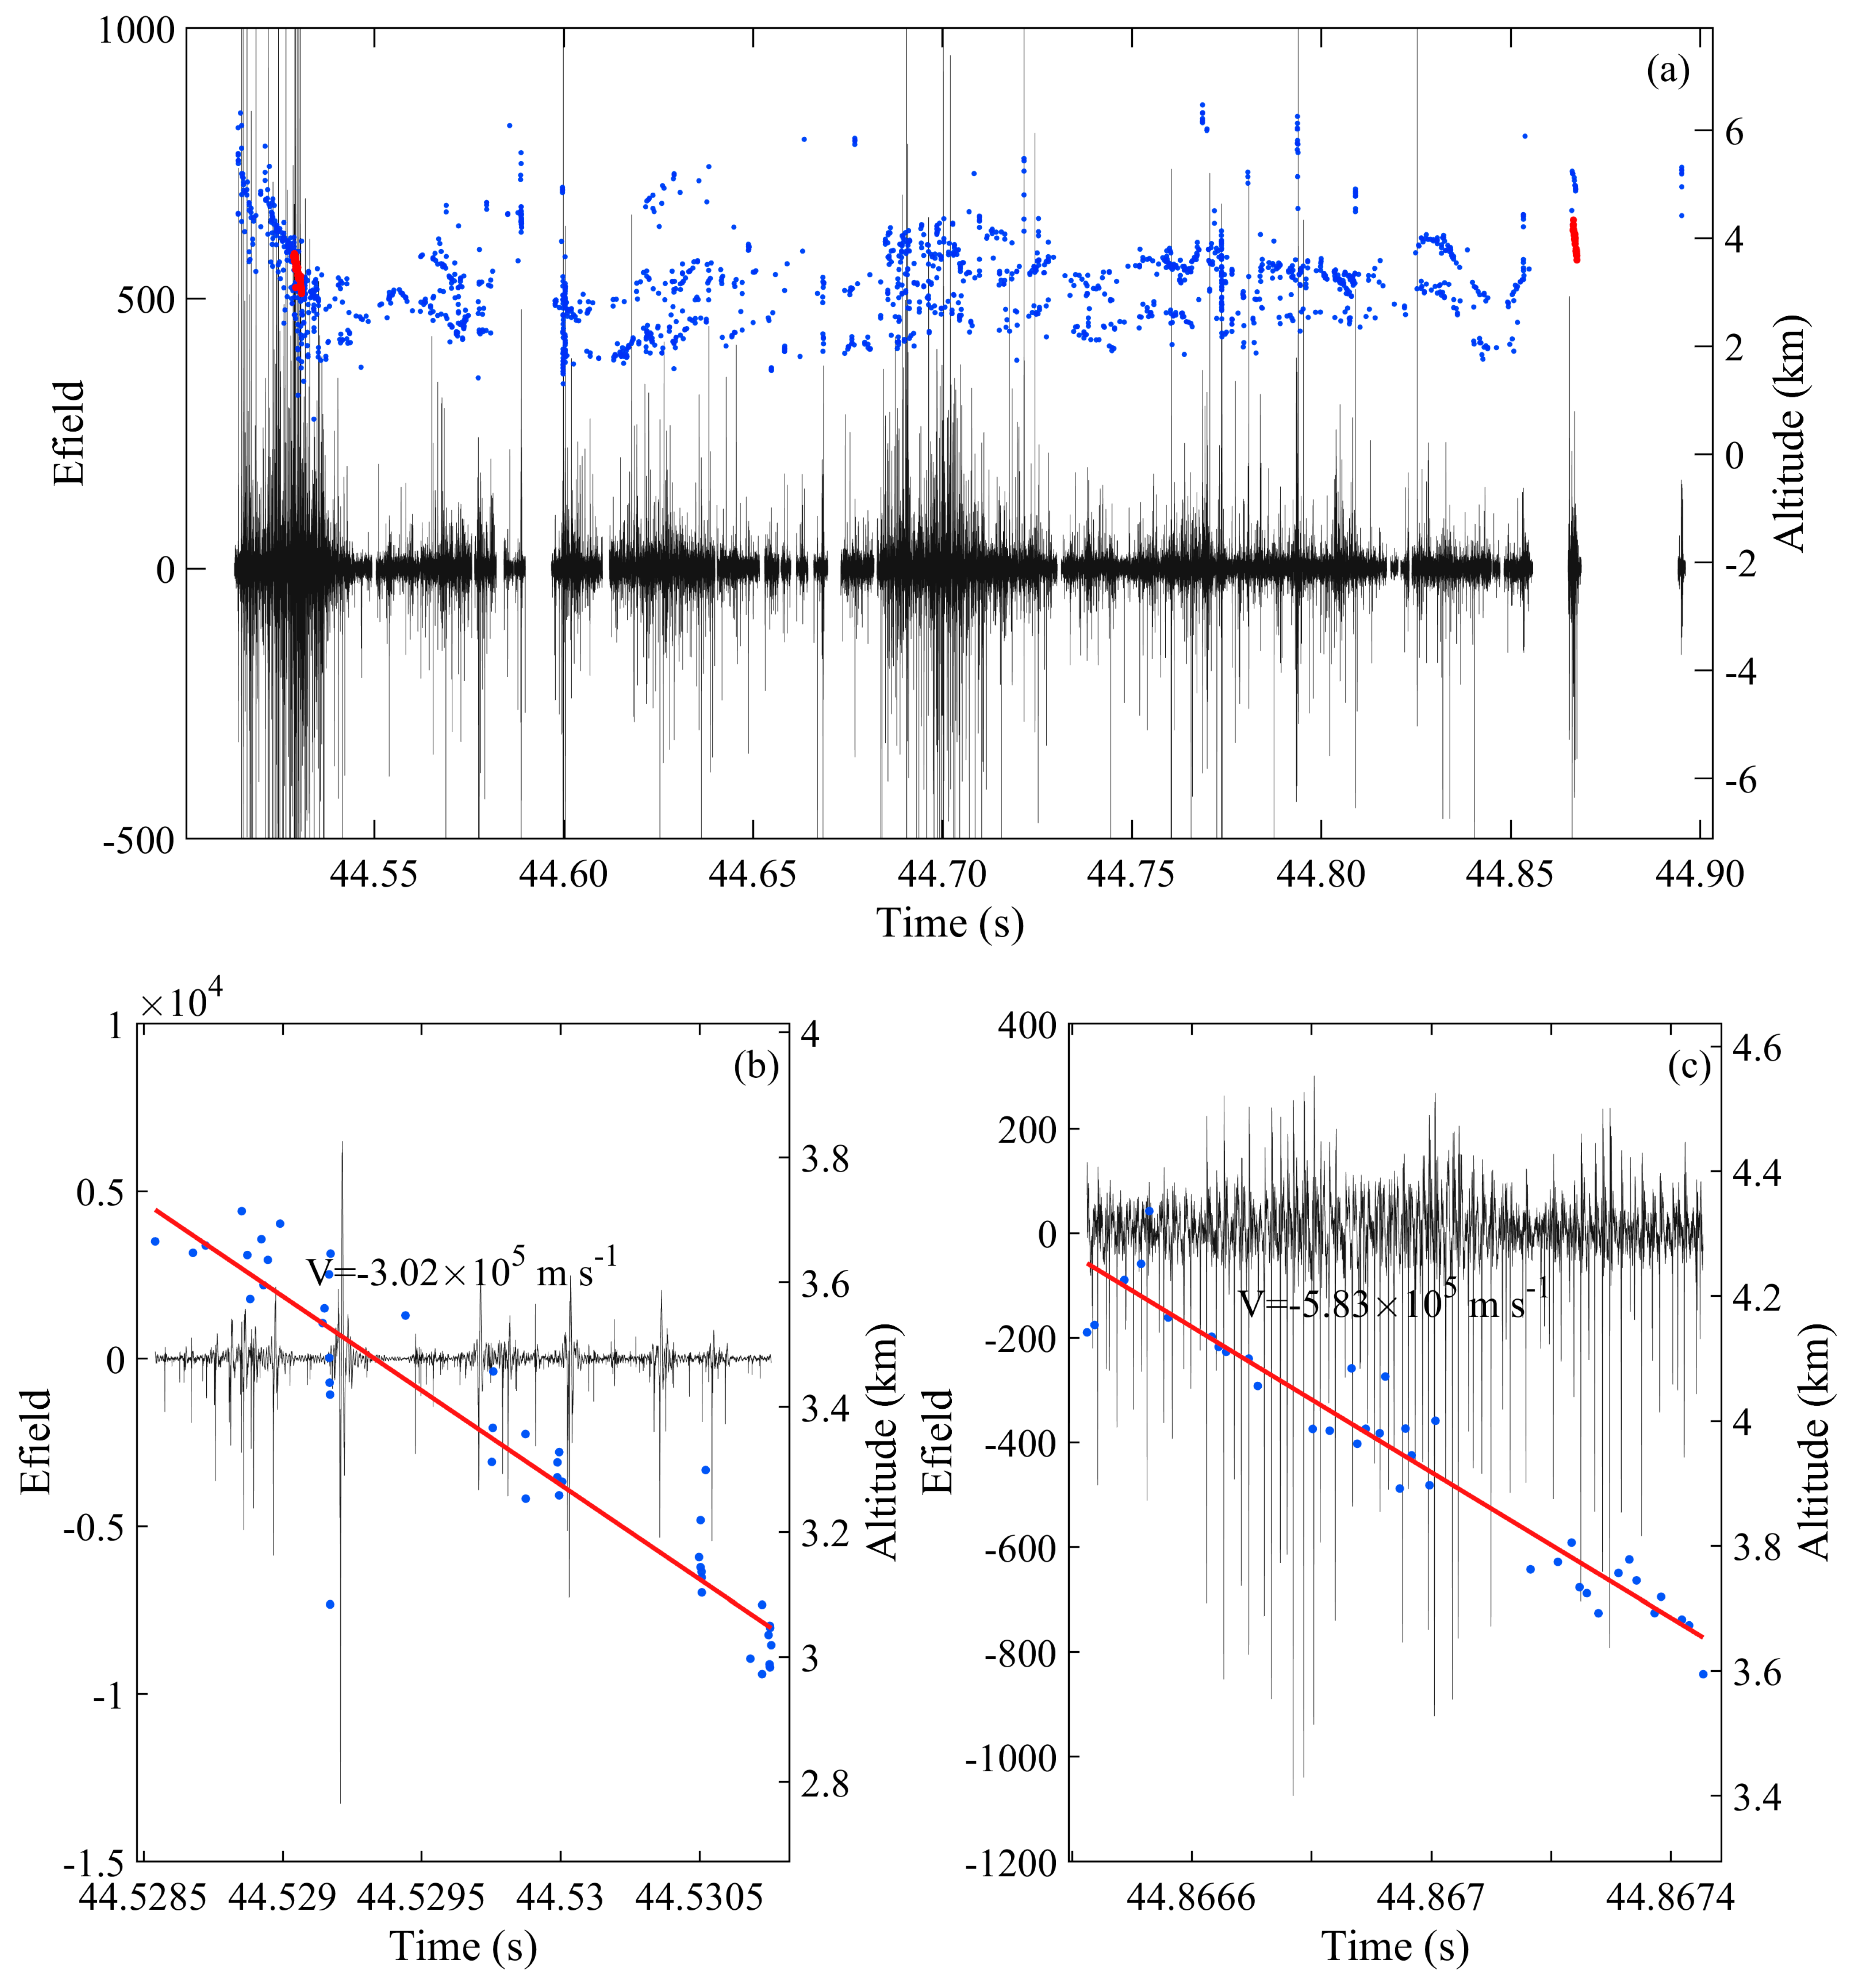
Figure 9 presents the synchronous DLZ electric field waveform and time–height source distribution. As shown in Figure 9a, periods of dense source activity correspond closely to enhanced pulse activity in the electric field record, confirming temporal consistency between the localization results and ground-based observations. The discharge exhibits distinct phases and intermittent features rather than continuous uniform development. Figure 9b,c show zoomed views of two representative channel segments with 46 and 37 source points, respectively, both exhibiting systematic downward propagation. Piecewise linear fitting yields speeds of −3.0 × 10⁵ m s−1 and −5.8 × 10⁵ m s−1. The two segments correspond, respectively, to the initial breakdown pulses during the initiation of the downward negative leader and to a regular pulse burst in the later stage of the flash [26,27,47]. Both segments coincide with notable electric field pulse variations. These results demonstrate that the WZ method enables not only improved channel continuity but also quantitative estimation of channel propagation speed from LF localization data.
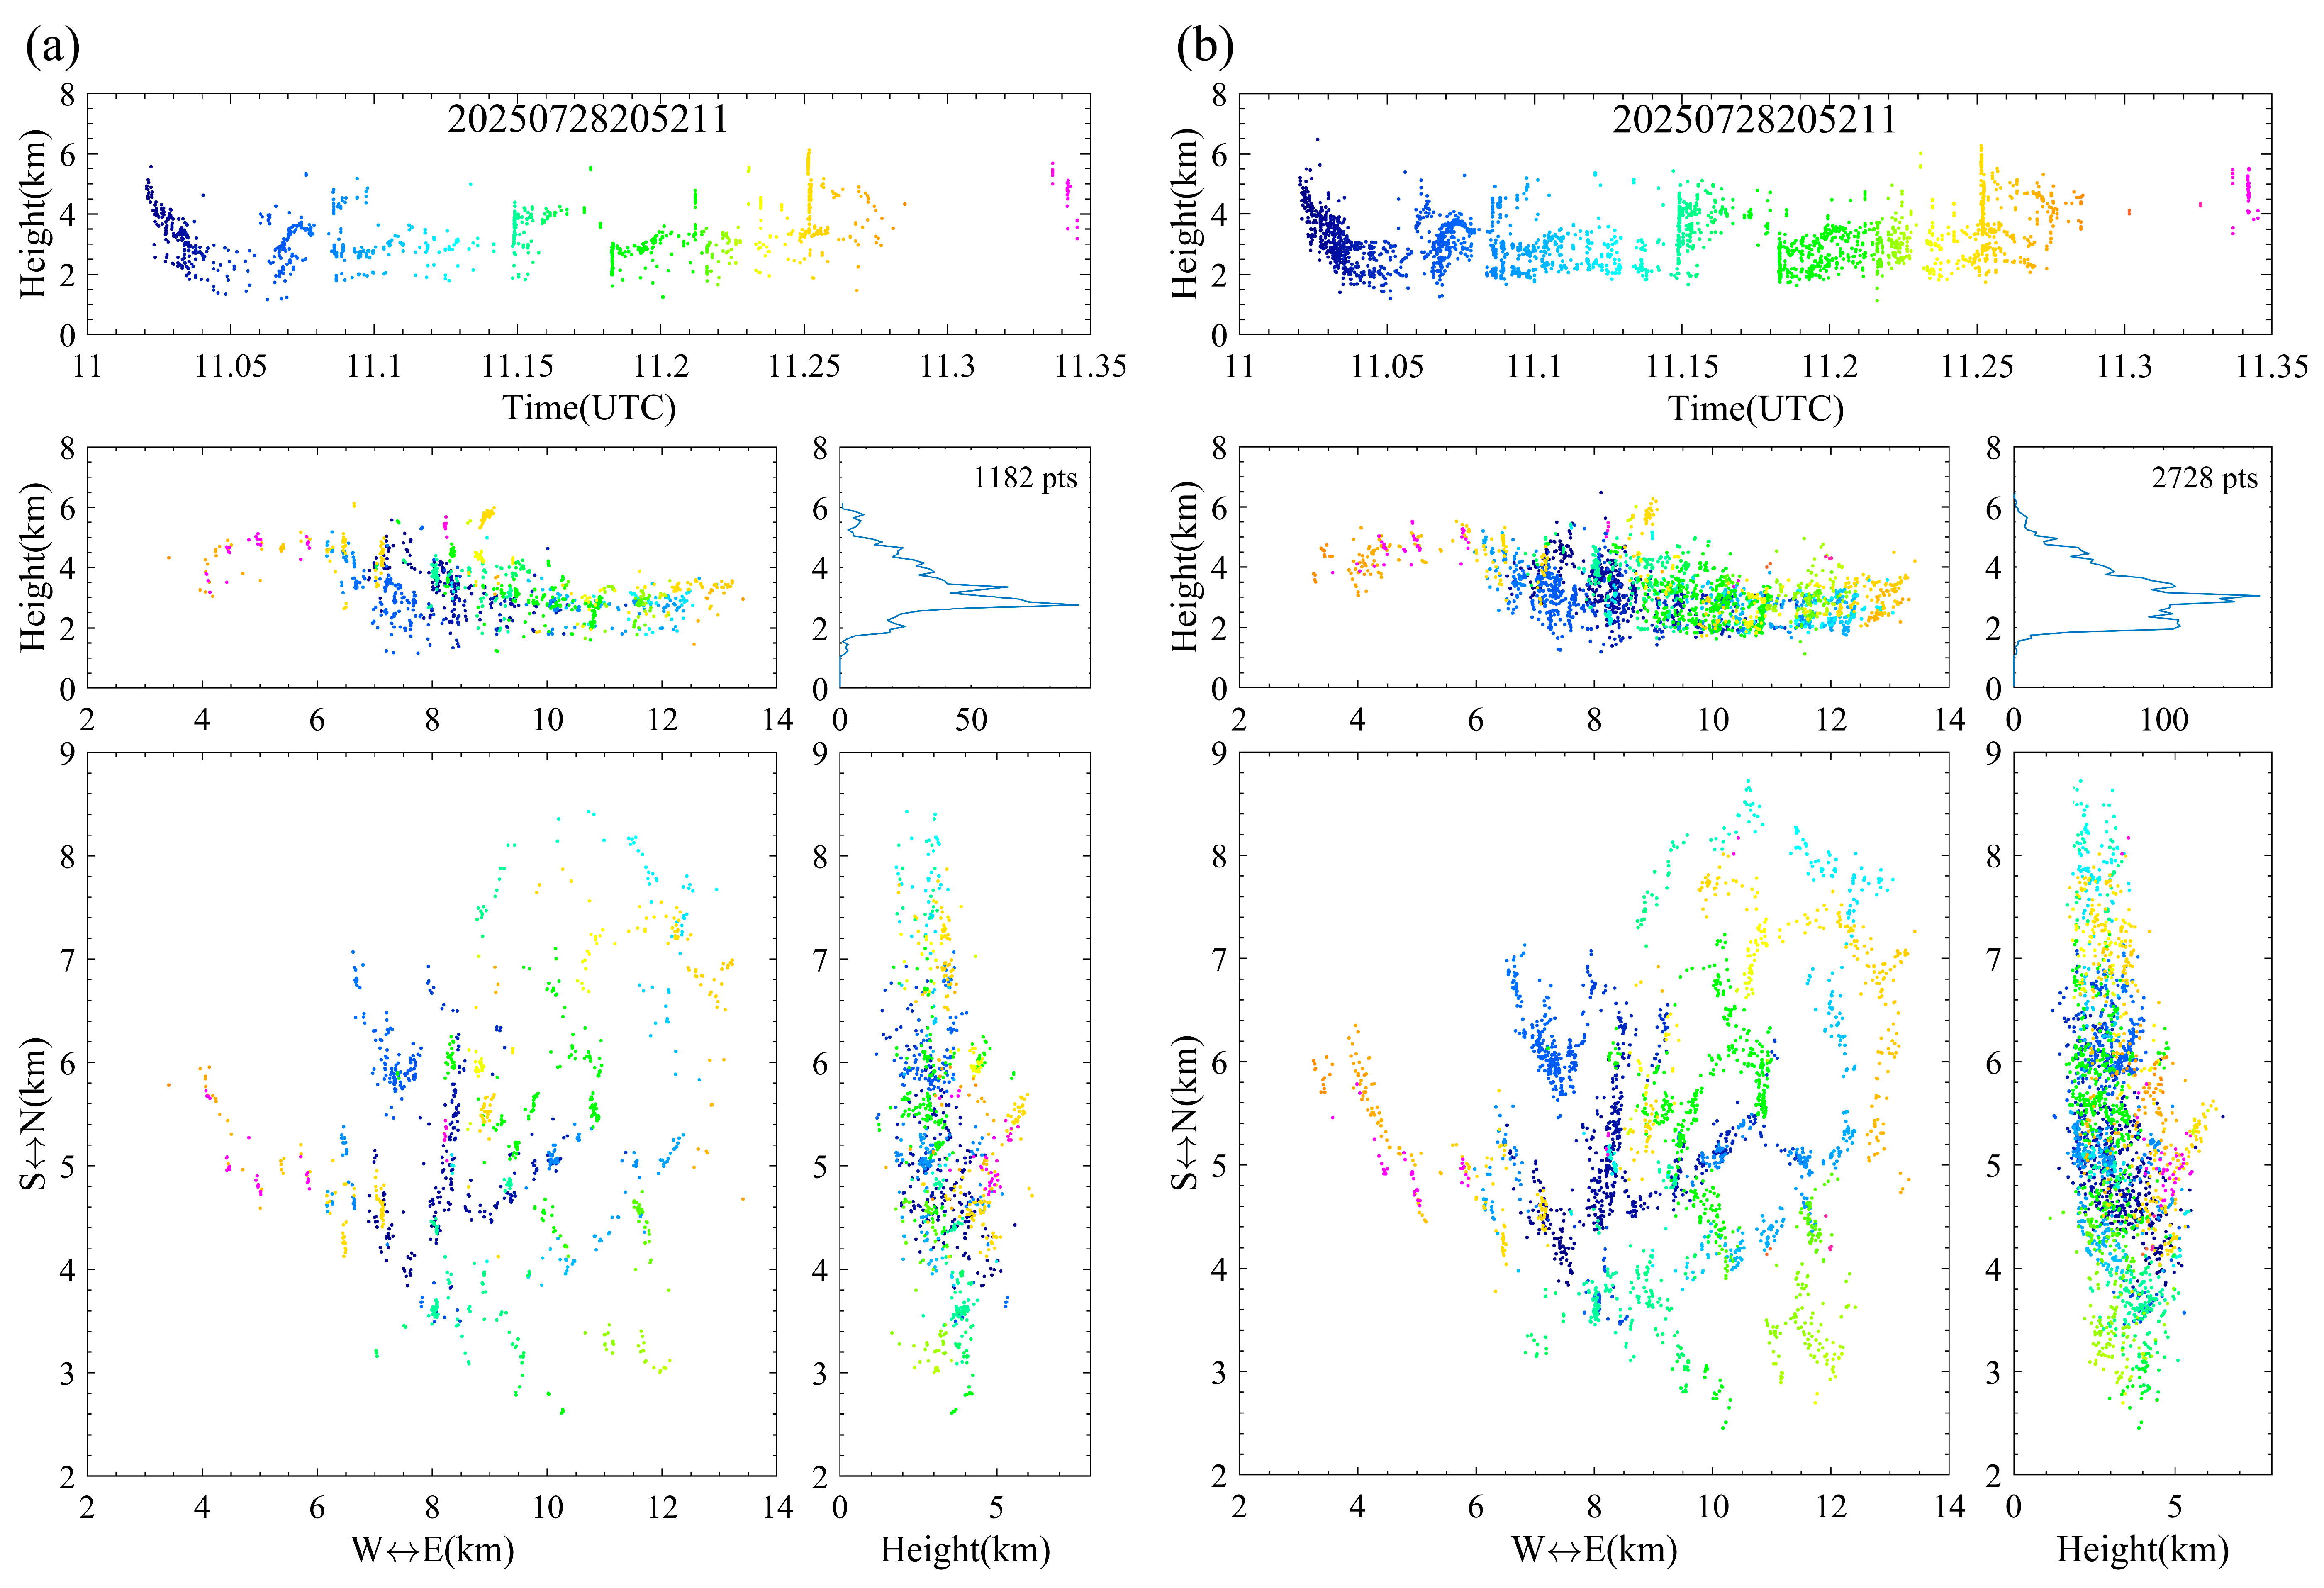
The second event (20250728205211), with its complex multi-branch architecture, places higher demands on TOA accuracy and thus serves as a more discriminating testbed for quantifying preprocessing gain. It is processed under both BP and WZ with otherwise identical localization settings. Under BP (Figure 10a, 1182 valid sources), channel traces are fragmented and the multi-branch structure is only partially resolved, with source density in the time–height projection insufficient to reconstruct continuous propagation during several active intervals. Under WZ (Figure 10b, 2728 valid sources, a 2.3-fold increase), the height histogram develops a pronounced secondary component near 2 km, the time–height projection reveals systematic descending and ascending phases largely obscured under BP, and the horizontal distribution resolves a multi-branch tree-like structure extending ~10 km east–west and ~6 km north–south. The comparison confirms that the localization improvement stems from WZ preprocessing rather than the inversion algorithm.
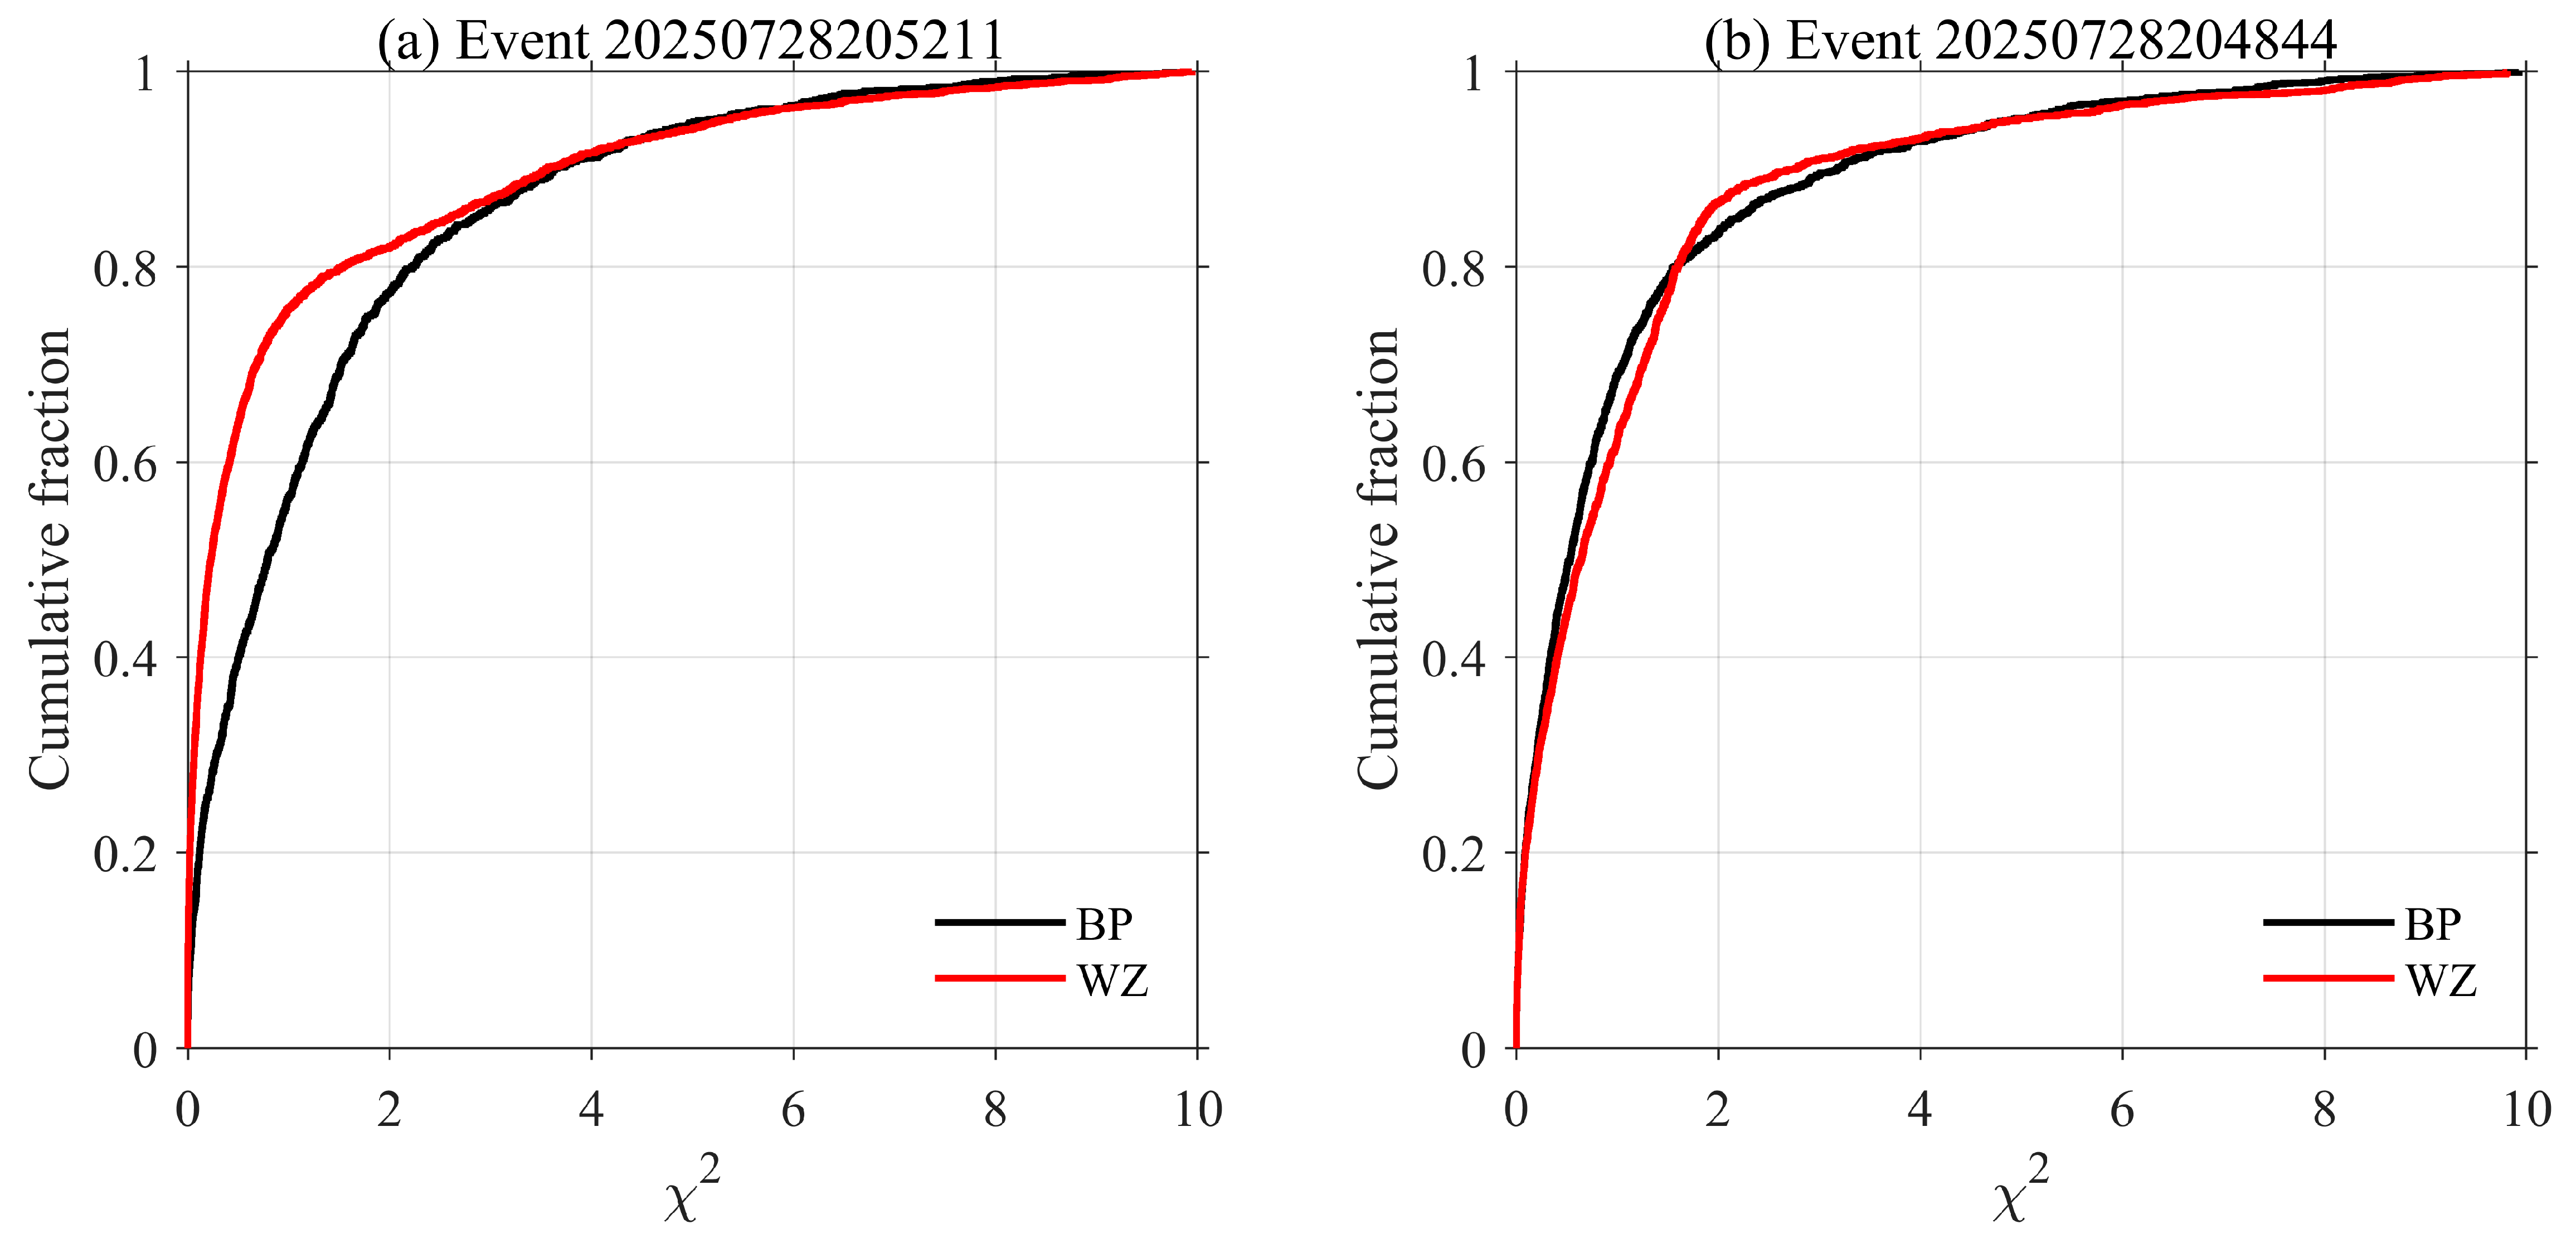
To confirm that the additional sources are genuine rather than low-quality mismatches, we compared the inversion fit quality under BP and WZ using χ2 = Σ(t_obs − t_model)22, retaining only sources with ≥5 stations and χ2 < 10 (Figure 11). Here σ = 80 ns is the arrival-time uncertainty budget of the inversion, covering GPS timing and waveform-matching errors, and is a different-level quantity from the 50 ns GPS floor in Section 2.1. For the multi-branch event 20250728205211, WZ raises the source count 2.3-fold while lowering the median χ2 from 0.79 to 0.23; for the linear event 20250728204844, the median χ2 is comparable (0.53 vs. 0.64) with a lower high-percentile residual (p90: 3.18 → 2.77). In both cases, the added sources improve rather than degrade fit quality, confirming that WZ recovers valid weak sources rather than introducing spurious points.
Despite substantial differences in discharge morphology between the two events—linear east–west extension in event 20250728204844 versus complex multi-branch architecture in event 20250728205211—WZ produces well-resolved, physically continuous 3-D results in both cases.
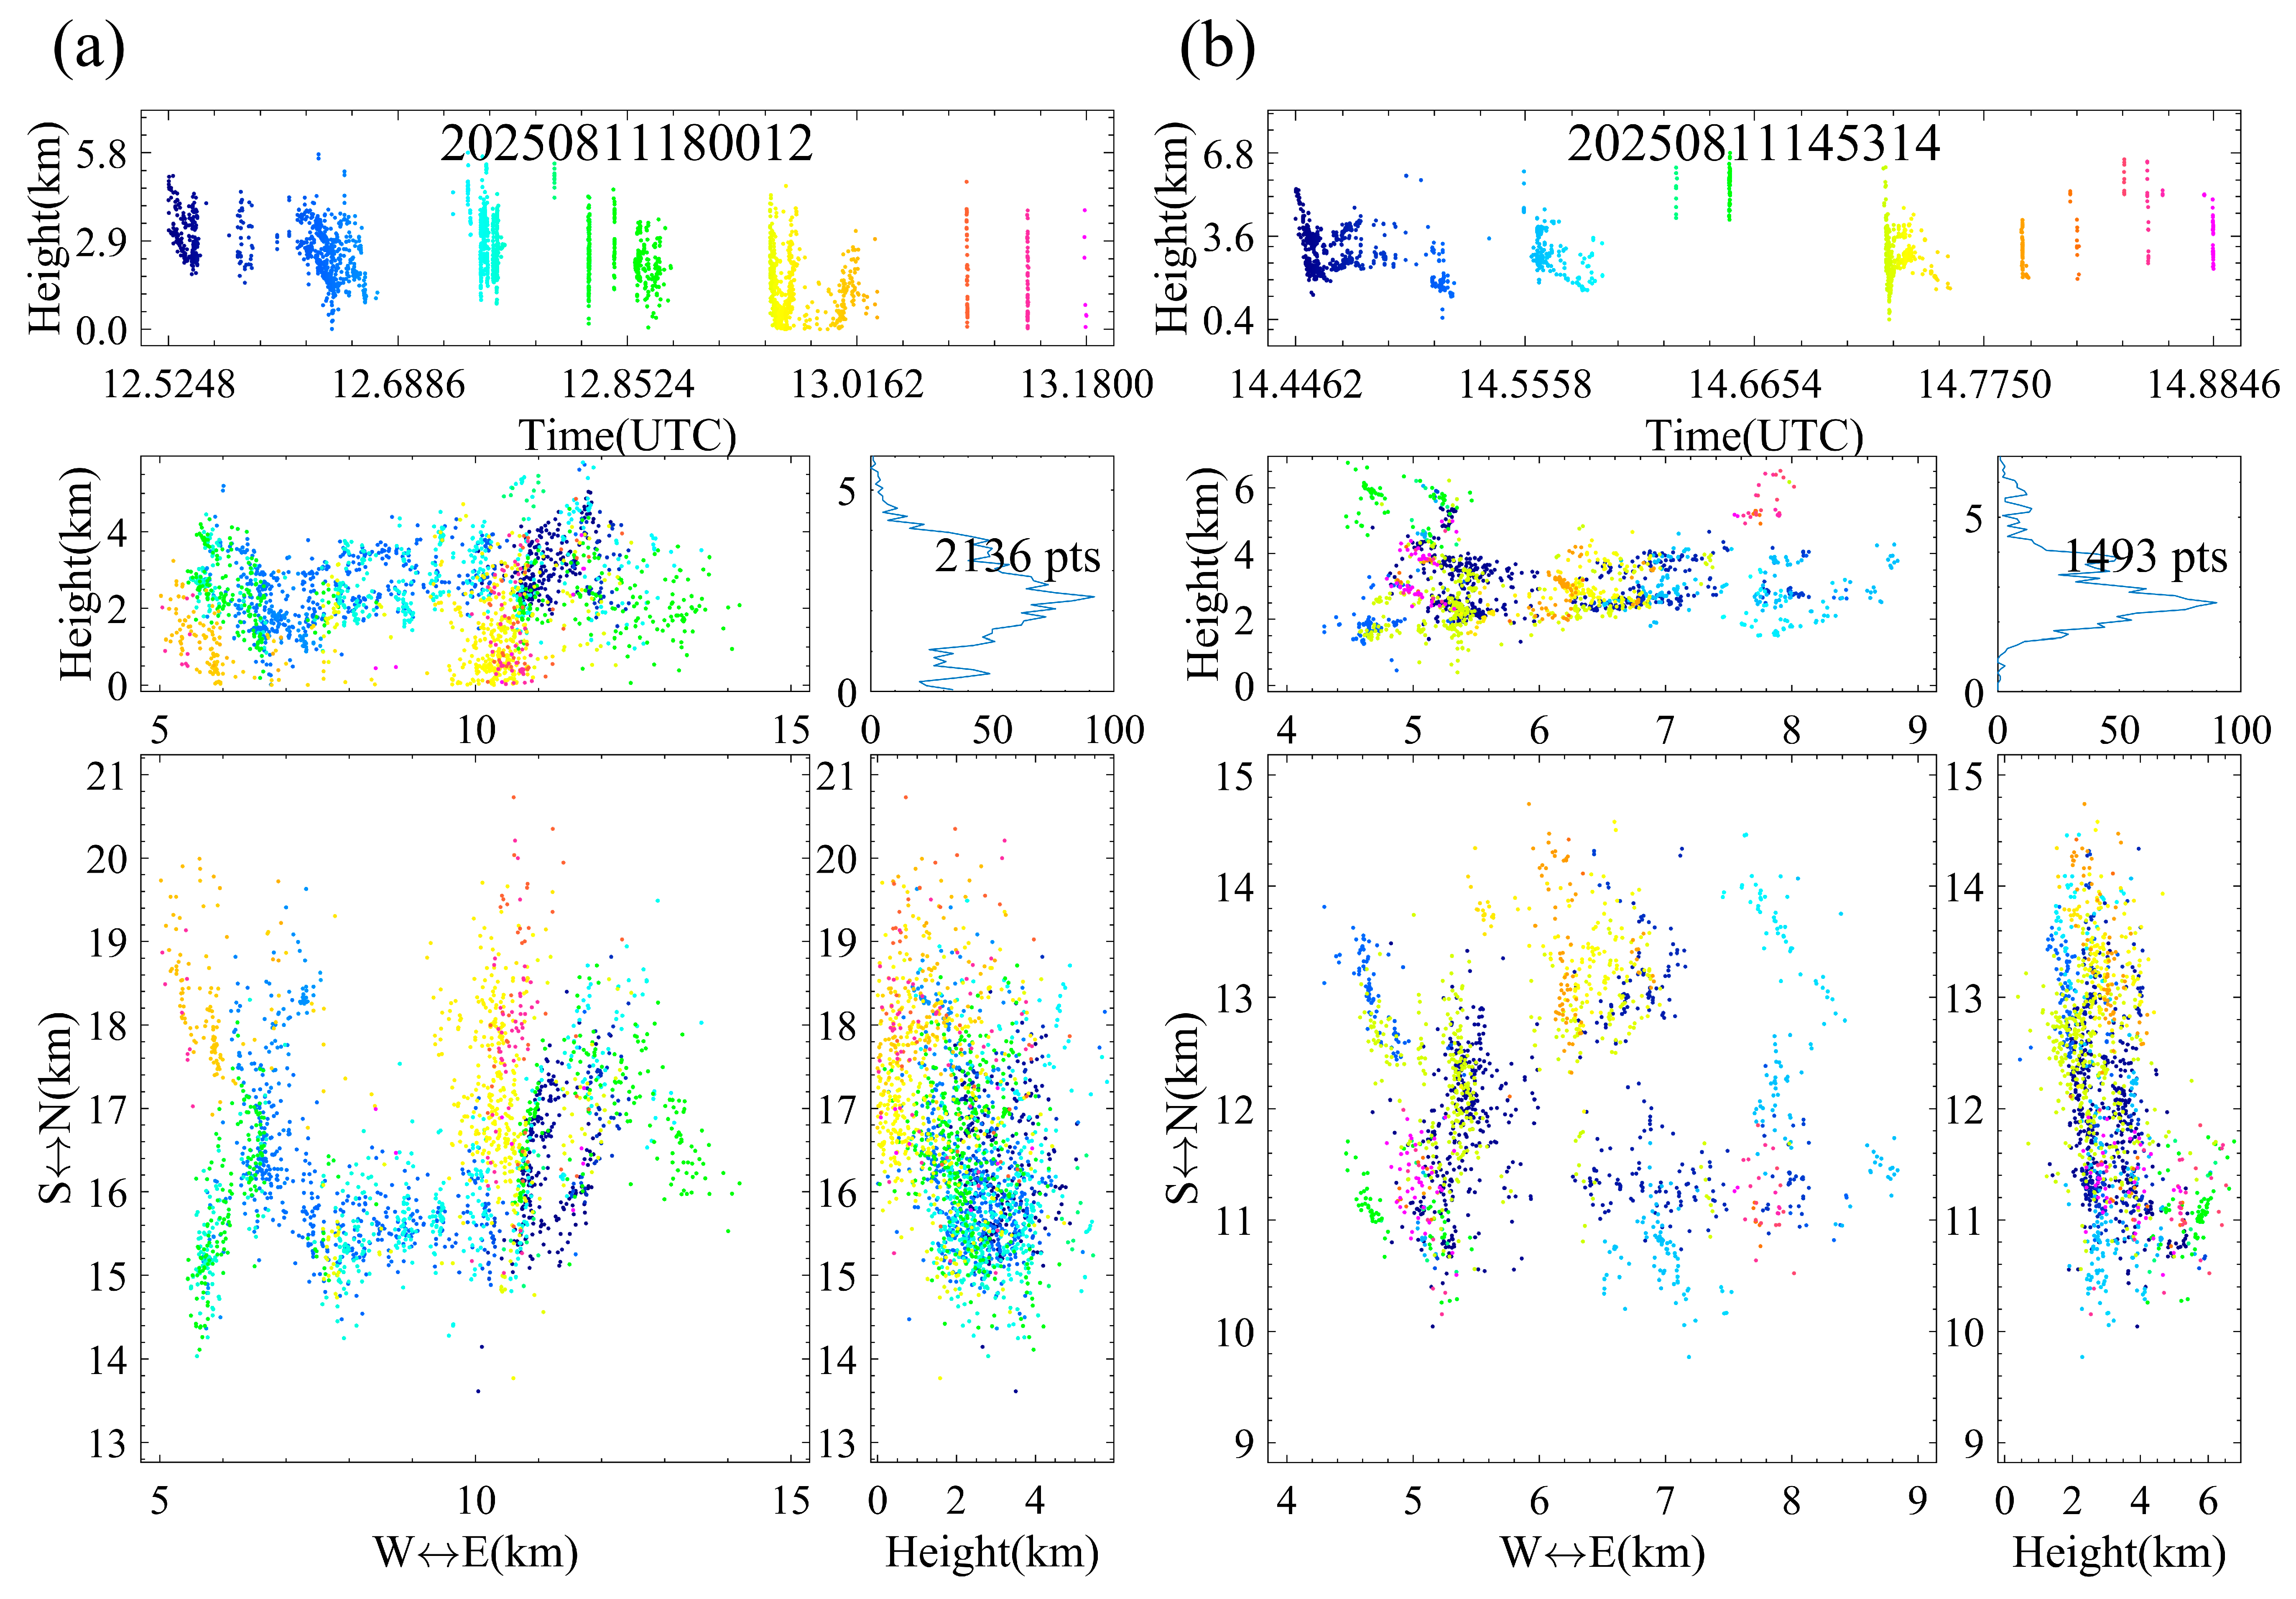
To further examine the generality of the method across discharge types and thunderstorm days, two additional events from a separate storm day, 11 August 2025, were processed with WZ: one flash developing to ground (20250811180012) and one intracloud flash (20250811145314). Figure 12 shows their three-dimensional localization results. For the ground-developing flash, shown in Figure 12a with 2136 located sources, 7.6% of the sources are located below 0.5 km and the channel extends downward to near the surface, consistent with a cloud-to-ground discharge. For the intracloud flash, shown in Figure 12b with 1493 located sources, the sources are concentrated between about 2 and 6 km in height, with only 0.1% reaching below 0.5 km, consistent with a discharge confined within the cloud. Both events yield continuous, physically coherent three-dimensional channels, with median fit residuals of χ2 = 1.80 and 0.30, respectively, both well within the χ2 < 10 quality threshold. Together with the two 28 July intracloud events analyzed above, these results span two separate thunderstorm days and both intracloud and cloud-to-ground discharge types, indicating that WZ preprocessing provides stable and physically consistent localization across different discharge morphologies and observation days.

5. Discussion

Under composite noise conditions, WZ achieves high and stable denoising gain through two complementary mechanisms: adaptive frequency-domain spectral shrinkage suppresses broadband random noise and narrowband RFI simultaneously, while zero-phase spectral masking minimizes filter-induced timing offsets at pulse arrival. Its primary contribution is therefore not the single-station SNR gain per se, but the reduction in inter-station timing inconsistency—the dominant bottleneck in LF 3D lightning localization [5,16]—yielding consistent multi-station TOA extraction and physically continuous 3D localization across structurally distinct discharge types. The two intracloud flashes analyzed, differing markedly in morphology yet both resolved into well-defined 3D channels, further enable quantitative estimation of channel propagation speed.
The effectiveness of WZ rests on two conditions: that the noise power spectral density can be stably estimated from pre-event silent intervals, and that the zero-phase filter maintains near-zero group delay within the passband. Where these hold, phase preservation and denoising gain are maintained; where non-stationarity is severe or inter-station response differences are large, gains may be reduced. The present results also constitute observational evidence of overall preprocessing gain rather than rigorous attribution to individual steps, since error coupling among TOA picking, pulse matching, and inversion is not systematically separated. Validation across a wider range of noise environments, station configurations, and discharge types remains an important direction for future work.
From an observational-systems perspective, WZ offers a cost-effective, software-based upgrade path for plateau lightning networks. Unlike hardware replacement or antenna reconfiguration—costly, slow, and unable to improve historical data—it enhances both current and archival data through algorithmic means alone. For the Qinghai Datong network, which has accumulated a multi-season archive of broadband electric-field data, this enables a consistent reanalysis of the entire archive without infrastructure modification. The problem is not unique to this network: the RELAMPAGO LMA in Córdoba, Argentina, reported station-availability fluctuations and local RFI [48], and the adjacent Datong VHF system shows GPS timing drift and oscillator aging [18,19]. Because WZ requires only clear-sky PSD estimation, STFT-domain gain control, and zero-phase masking—none hardware-specific—it is portable to other triggered-recording LF networks.
A quality-homogenized long-term archive from this network would support several research directions in the high-altitude domain: resolving the lightning signature of lake–atmosphere coupling over the expanding Qinghai Lake, previously precluded by hardware aging [49]; providing ground-based mesoscale verification of the satellite-observed increase in plateau lightning under regional warming [30], by decomposing the trend into thunderstorm frequency versus per-storm electrical intensity; and enabling event-level cross-validation of FY-4A/B LMI optical products, whose detection efficiency is lower over high terrain than over plains [1,3].

6. Conclusions

This study proposed Wiener plus zero-phase hybrid filtering (WZ), a phase-preserving preprocessing procedure for TOA-based 3D lightning localization in long-running LF observation networks. The main findings are summarized as follows:
  • WZ combines STFT-domain adaptive Wiener spectral shrinkage with zero-phase band-pass filtering, simultaneously suppressing broadband random noise and narrowband radio-frequency interference while preserving multi-station phase consistency to within the GPS timing accuracy.
  • Its primary contribution is not the single-station SNR gain per se, but the reduction in inter-station timing inconsistency, the dominant bottleneck in LF 3D lightning localization.
  • In Monte Carlo simulations, WZ reduced the TOA root-mean-square error to 2.8 × 10⁻⁷ s and improved the time-domain SNR by 10.0 dB relative to zero-phase band-pass filtering alone.
  • On real data from the Qinghai Datong seven-station network, WZ achieved in-band SNR improvements of up to 3.7 dB by a frequency-domain proxy metric, which is not directly comparable to the simulation-based value; the residual out-of-band phase variations fall outside the band used for TOA extraction and do not affect localization.
  • Applied to two intracloud flashes of contrasting morphology, WZ recovered 1802 and 2728 valid 3D radiation sources, with the multi-branch flash showing up to a 2.3-fold increase over conventional preprocessing; within the first event, two downward channel-propagation segments were quantitatively resolved at −3.0 × 10⁵ and −5.8 × 10⁵ m s−1.
  • The consistent performance across structurally distinct discharge types indicates that WZ, as a software-based workflow requiring no hardware modification, is applicable to long-running LF networks facing analogous degradation challenges.
Future work will pursue full-link joint optimization that integrates denoising, TOA picking, pulse matching, and inversion into a coordinated adaptive framework, and will incorporate multi-frequency observation and data fusion strategies to better address non-stationary noise in complex terrain. Building on this, the homogenized reanalysis of multi-decadal LF archives is expected to provide a more stable observational foundation for studying the long-term variability of plateau thunderstorm activity.

Supplementary Materials

The following supporting information can be downloaded at https://www.mdpi.com/article/10.3390/rs18172881/s1, Figures S1–S13, providing additional details on synthetic signal construction, per-station PSD analysis, and 3D channel reconstruction results.

Author Contributions

Conceptualization, J.S. and X.F.; methodology, J.S.; software, J.S.; validation, J.S., X.F. and Y.L.; formal analysis, X.F. and Y.L.; investigation, J.S.; resources, X.F. and Y.L.; data curation, J.S. and X.F.; writing—original draft preparation, J.S.; writing—review and editing, J.S. and X.F.; visualization, J.S., J.L. and X.L.; supervision, X.F., Y.L. and L.W.; project administration, X.F., L.H. and J.C.; funding acquisition, X.F. and Y.L. All authors have read and agreed to the published version of the manuscript.

Funding

This research was funded by the National Natural Science Foundation of China, grant numbers 42575102 and 42165006, and the Open Foundation of the Key Laboratory of Cryospheric Science and Frozen Soil Engineering, Chinese Academy of Sciences, grant number CSFSE-ZQ-2409. The APC was funded by grant number 42575102.

Data Availability Statement

The lightning electric-field observation data underlying this study are available from the corresponding author upon reasonable request, subject to institutional data-sharing policies of the Northwest Institute of Eco-Environment and Resources, Chinese Academy of Sciences. The MATLAB R2024a (The MathWorks Inc., Natick, MA, USA) implementation of the Wiener plus zero-phase (WZ) denoising algorithm will be made openly available in a public repository upon acceptance of this manuscript.

Acknowledgments

The authors thank the field engineers and technical staff who have maintained the Qinghai Datong seven-station lightning electric-field observation network, ensuring the continuous acquisition of broadband electric-field data on which this study is based.

Conflicts of Interest

The authors declare no conflicts of interest.

Abbreviations

The following abbreviations are used in this manuscript:
BOLTBroadband Observation network for Lightning and Thunderstorms
BPBand-Pass (filtering)
CGCloud-to-Ground
COLAConstant Overlap-Add
DEMDigital Elevation Model
EMDEmpirical Mode Decomposition
FFTFast Fourier Transform
GLMGeostationary Lightning Mapper
GPSGlobal Positioning System
HAMMAHuntsville Alabama Marx Meter Array
ICIntracloud
iSTFTinverse Short-Time Fourier Transform
LASALos Alamos Sferic Array
LFLow-Frequency
LFEDALow-Frequency E-field Detection Array
LISLightning Imaging Sensor
LMILightning Mapping Imager
MADMedian Absolute Deviation
MMSEMinimum Mean Square Error
OTDOptical Transient Detector
PBFAPosition By Fast Antenna
PSDPower Spectral Density
RFIRadio-Frequency Interference
RMSERoot-Mean-Square Error
SNRSignal-to-Noise Ratio
STFTShort-Time Fourier Transform
TOATime of Arrival
VHFVery-High-Frequency
VLFVery-Low-Frequency
WRFWeather Research and Forecasting
WZWiener plus Zero-phase hybrid filtering
WRWiener shrinkage with the RFI mask
ZPZero-phase band-pass filter only

References

  1. Yang, J.; Zhang, Z.; Wei, C.; Lu, F.; Guo, Q. Introducing the new generation of Chinese geostationary weather satellites, Fengyun-4. Bull. Am. Meteorol. Soc. 2017, 98, 1637–1658. [Google Scholar] [CrossRef] [Scilit]
  2. Goodman, S.J.; Blakeslee, R.J.; Koshak, W.J.; Mach, D.; Bailey, J.; Buechler, D.; Carey, L.; Schultz, C.; Bateman, M.; McCaul, E.; et al. The GOES-R Geostationary Lightning Mapper (GLM). Atmos. Res. 2013, 125–126, 34–49. [Google Scholar] [CrossRef] [Scilit]
  3. Ni, Z.; Wang, Z.; Yin, Q. Comparison of Lightning Detection Between the FY-4A Lightning Mapping Imager and the ISS Lightning Imaging Sensor. Earth Space Sci. 2021, 8, e2020EA001099. [Google Scholar] [CrossRef] [Scilit]
  4. Nag, A.; Murphy, M.J.; Schulz, W.; Cummins, K.L. Lightning locating systems: Insights on characteristics and validation techniques. Earth Space Sci. 2015, 2, 65–93. [Google Scholar] [CrossRef] [Scilit]
  5. Smith, D.A.; Eack, K.B.; Harlin, J.; Heavner, M.J.; Jacobson, A.R.; Massey, R.S.; Shao, X.M.; Wiens, K.C. The Los Alamos Sferic Array: A research tool for lightning investigations. J. Geophys. Res. Atmos. 2002, 107, 4183. [Google Scholar] [CrossRef] [Scilit]
  6. Shi, D.D.; Zheng, D.; Zhang, Y.; Zhang, Y.J.; Huang, Z.G.; Lu, W.T.; Chen, S.D.; Yan, X. Low-frequency E-field detection array (LFEDA)—Construction and preliminary results. Sci. China Earth Sci. 2017, 60, 1896–1908. [Google Scholar] [CrossRef] [Scilit]
  7. Bitzer, P.M.; Christian, H.J.; Stewart, M.; Burchfield, J.; Podgorny, S.; Corredor, D. Characterization and applications of VLF/LF source locations from lightning using HAMMA. J. Geophys. Res. Atmos. 2013, 118, 3120–3138. [Google Scholar] [CrossRef] [Scilit]
  8. Karunarathne, S.; Marshall, T.C.; Stolzenburg, M.; Karunarathna, N.; Vickers, L.E.; Warner, T.A.; Orville, R.E. Locating initial breakdown pulses using electric field change network. J. Geophys. Res. Atmos. 2013, 118, 7129–7141. [Google Scholar] [CrossRef] [Scilit]
  9. Yoshida, S.; Wu, T.; Ushio, T.; Kusunoki, K.; Nakamura, Y. Initial results of LF sensor network for lightning observation and characteristics of lightning emission in LF band. J. Geophys. Res. Atmos. 2014, 119, 12025–12042. [Google Scholar] [CrossRef] [Scilit]
  10. Rison, W.; Thomas, R.J.; Krehbiel, P.R.; Hamlin, T.; Harlin, J. A GPS-based three-dimensional lightning mapping system: Initial observations in central New Mexico. Geophys. Res. Lett. 1999, 26, 3573–3576. [Google Scholar] [CrossRef] [Scilit]
  11. Thomas, R.J.; Krehbiel, P.R.; Rison, W.; Hamlin, T.; Harlin, D.; Shown, R. Accuracy of the lightning mapping array. J. Geophys. Res. Atmos. 2004, 109, D14207. [Google Scholar] [CrossRef] [Scilit]
  12. Wu, T.; Wang, D.; Takagi, N. Lightning mapping with an array of fast antennas. Geophys. Res. Lett. 2018, 45, 3698–3705. [Google Scholar] [CrossRef] [Scilit]
  13. Yuan, S.; Qie, X.; Jiang, R.; Wang, D.; Sun, Z.; Srivastava, A.; Williams, E. Origin of an uncommon multiple-stroke positive cloud-to-ground lightning flash with different terminations. J. Geophys. Res. Atmos. 2020, 125, e2019JD032098. [Google Scholar] [CrossRef] [Scilit]
  14. Smith, D.A.; Shao, X.M.; Holden, D.N.; Rhodes, C.T.; Brook, M.; Krehbiel, P.R.; Stanley, M.; Rison, W.; Thomas, R.J. A distinct class of isolated intracloud lightning discharges and their associated radio emissions. J. Geophys. Res. Atmos. 1999, 104, 4189–4212. [Google Scholar] [CrossRef] [Scilit]
  15. Liu, M.Y.; Qie, X.S.; Sun, Z.L.; Jiang, R.B.; Zhang, H.B.; Chen, R.L.; Yuan, S.F.; Wang, Y.; Liu, X.K. Upgraded low-frequency 3D lightning mapping system in north China and observations on lightning initiation processes. Remote Sens. 2024, 16, 1608. [Google Scholar] [CrossRef] [Scilit]
  16. Fan, X.P.; Zhang, Y.J.; Zheng, D.; Zhang, Y.; Lyu, W.T.; Liu, H.Y.; Xu, L.T. A new method of three-dimensional location for low-frequency electric field detection array. J. Geophys. Res. Atmos. 2018, 123, 8792–8812. [Google Scholar] [CrossRef] [Scilit]
  17. Huang, N.E.; Shen, Z.; Long, S.R.; Wu, M.C.; Shih, H.H.; Zheng, Q.; Yen, N.C.; Tung, C.C.; Liu, H.H. The empirical mode decomposition and the Hilbert spectrum for nonlinear and non-stationary time series analysis. Proc. R. Soc. Lond. A 1998, 454, 903–995. [Google Scholar] [CrossRef] [Scilit]
  18. Zhang, G.S.; Wang, Y.H.; Qie, X.S.; Zhang, T.; Zhao, Y.X.; Li, Y.J.; Cao, D.J. Using lightning locating system based on time-of-arrival technique to study three-dimensional lightning discharge processes. Sci. China Earth Sci. 2010, 53, 591–602. [Google Scholar] [CrossRef] [Scilit]
  19. Zhang, G.S.; Li, Y.J.; Wang, Y.H.; Zhang, T.; Wu, B.; Liu, Y.X. Experimental study on location accuracy of a 3D VHF lightning-radiation-source locating network. Sci. China Earth Sci. 2015, 58, 2034–2048. [Google Scholar] [CrossRef] [Scilit]
  20. Li, Y.J.; Zhang, G.S.; Wen, J.; Wang, D.H.; Wang, Y.H.; Zhang, T.; Fan, X.P.; Wu, B. Electrical structure of a Qinghai–Tibet Plateau thunderstorm based on three-dimensional lightning mapping. Atmos. Res. 2013, 134, 137–149. [Google Scholar] [CrossRef] [Scilit]
  21. Li, Y.J.; Zhang, G.S.; Wang, Y.H.; Wu, B.; Li, J. Observation and analysis of electrical structure change and diversity in thunderstorms on the Qinghai–Tibet Plateau. Atmos. Res. 2017, 194, 130–141. [Google Scholar] [CrossRef] [Scilit]
  22. Li, Y.J.; Zhang, G.S.; Lyu, W.T.; Zhao, Y.X. Analysis of inverted charge structure and lightning activity during the 8.14 local hailstorm on the Qinghai–Tibet Plateau. Atmosphere 2023, 14, 1795. [Google Scholar] [CrossRef] [Scilit]
  23. Li, Y.J.; Fan, X.P.; Zhao, Y.X. Analysis of the charge structure accompanied by hail during the development stage of thunderstorm on the Qinghai–Tibet Plateau. Atmosphere 2025, 16, 906. [Google Scholar] [CrossRef] [Scilit]
  24. Li, Y.J.; Zhang, G.S.; Zhang, Y.J. Evolution of the charge structure and lightning discharge characteristics of a Qinghai–Tibet Plateau thunderstorm dominated by negative cloud-to-ground flashes. J. Geophys. Res. Atmos. 2020, 125, e2019JD031129. [Google Scholar] [CrossRef] [Scilit]
  25. Fan, X.P.; Zhang, G.S.; Wang, Y.H.; Li, Y.J.; Zhang, T.; Wu, B. Analyzing the transmission structures of long continuing current processes from negative ground flashes on the Qinghai-Tibetan Plateau. J. Geophys. Res. Atmos. 2014, 119, 5407–5424. [Google Scholar] [CrossRef] [Scilit]
  26. Wu, B.; Zhang, G.S.; Wen, J.; Zhang, T.; Li, Y.J.; Wang, Y.H. Correlation analysis between initial preliminary breakdown process, the characteristic of radiation pulse, and the charge structure on the Qinghai–Tibetan Plateau. J. Geophys. Res. Atmos. 2016, 121, 12434–12459. [Google Scholar] [CrossRef] [Scilit]
  27. Wu, B.; Zhang, G.S.; Wen, J.; Zhang, T.; Li, Y.J.; Wang, Y.H. The characteristic and current model of radiation impulse in lightning initial preliminary breakdown process. J. Appl. Meteor. Sci. 2017, 28, 555–567. [Google Scholar] [CrossRef]
  28. Wang, Y.H.; Zhang, G.S.; Qie, X.S.; Wang, D.H.; Zhang, T.; Zhao, Y.X.; Li, Y.J.; Zhang, T.L. Characteristics of compact intracloud discharges observed in a severe thunderstorm in northern part of China. J. Atmos. Sol.-Terr. Phys. 2012, 84–85, 7–14. [Google Scholar] [CrossRef] [Scilit]
  29. Wang, Y.H.; Zhang, G.S.; Zhang, T.; Li, Y.J.; Wu, B.; Zhang, T.L. Interaction between adjacent lightning discharges in clouds. Adv. Atmos. Sci. 2013, 30, 1106–1116. [Google Scholar] [CrossRef] [Scilit]
  30. Qie, X.S.; Qie, K.; Wei, L.; Zhu, K.X.; Sun, Z.L.; Yuan, S.F.; Jiang, R.B.; Zhang, H.B.; Xu, C. Significantly increased lightning activity over the Tibetan Plateau and its relation to thunderstorm genesis. Geophys. Res. Lett. 2022, 49, e2022GL099894. [Google Scholar] [CrossRef] [Scilit]
  31. Albrecht, R.I.; Goodman, S.J.; Buechler, D.E.; Blakeslee, R.J.; Christian, H.J. Where are the lightning hotspots on Earth? Bull. Am. Meteorol. Soc. 2016, 97, 2051–2068. [Google Scholar] [CrossRef] [Scilit]
  32. Fan, X.P.; Zhang, Y.J.; Krehbiel, P.R.; Zhang, Y.; Zheng, D.; Yao, W.; Xu, L.T.; Liu, H.Y.; Lyu, W.T. Application of ensemble empirical mode decomposition in low-frequency lightning electric field signal analysis and lightning location. IEEE Trans. Geosci. Remote Sens. 2021, 59, 86–100. [Google Scholar] [CrossRef] [Scilit]
  33. Wiener, N. Extrapolation, Interpolation, and Smoothing of Stationary Time Series; MIT Press: Cambridge, MA, USA, 1949. [Google Scholar]
  34. Kay, S.M. Fundamentals of Statistical Signal Processing: Estimation Theory; Prentice Hall: Upper Saddle River, NJ, USA, 1993. [Google Scholar]
  35. Boashash, B. Estimating and interpreting the instantaneous frequency of a signal. I. Fundamentals. Proc. IEEE 1992, 80, 520–538. [Google Scholar] [CrossRef] [Scilit]
  36. Oppenheim, A.V.; Schafer, R.W. Discrete-Time Signal Processing, 3rd ed.; Pearson: Upper Saddle River, NJ, USA, 2010. [Google Scholar]
  37. Mallat, S. A theory for multiresolution signal decomposition: The wavelet representation. IEEE Trans. Pattern Anal. Mach. Intell. 1989, 11, 674–693. [Google Scholar] [CrossRef] [Scilit]
  38. Addison, P.S. The Illustrated Wavelet Transform Handbook; CRC Press: Boca Raton, FL, USA, 2002. [Google Scholar]
  39. Wang, J.X.; Zhang, Y.; Tan, Y.D.; Chen, Z.F.; Zheng, D.; Zhang, Y.J.; Fan, Y.F. Fast and fine location of total lightning from low frequency signals based on deep-learning encoding features. Remote Sens. 2021, 13, 2212. [Google Scholar] [CrossRef] [Scilit]
  40. Tian, C.Q.; Wu, X.M.; Qiu, S.; Li, Y.; Shi, L.H. A graph neural network based workflow for real-time lightning location with continuous waveforms. J. Geophys. Res. Atmos. 2025, 130, e2024JD042426. [Google Scholar] [CrossRef] [Scilit]
  41. An, T.; Chen, X.; Mohan, P.; Lao, B.-Q. Radio frequency interference mitigation. Acta Astron. Sin. 2017, 58, 20–41. (In Chinese) [Google Scholar] [CrossRef]
  42. Cucho-Padin, G.; Bastidas, J.M.T.; Rodriguez, R.A. Radio frequency interference detection and mitigation using compressive statistical sensing. Radio Sci. 2019, 54, 987–1002. [Google Scholar] [CrossRef] [Scilit]
  43. Sharma, S.R.; Ismail, M.M.; Hittiarachhi, P.; Cooray, V.; Miranda, F.J. Frequency spectra of various events pertinent to lightning cloud flashes obtained from wavelet transform technique and ratified by narrow band measurement technique. J. Atmos. Sol.-Terr. Phys. 2021, 220, 105664. [Google Scholar] [CrossRef] [Scilit]
  44. Gustafsson, F. Determining the initial states in forward-backward filtering. IEEE Trans. Signal Process. 1996, 44, 988–992. [Google Scholar] [CrossRef] [Scilit]
  45. Harris, F.J. On the use of windows for harmonic analysis with the discrete Fourier transform. Proc. IEEE 1978, 66, 51–83. [Google Scholar] [CrossRef] [Scilit]
  46. Welch, P. The use of fast Fourier transform for the estimation of power spectra: A method based on time averaging over short, modified periodograms. IEEE Trans. Audio Electroacoust. 1967, 15, 70–73. [Google Scholar] [CrossRef] [Scilit]
  47. Fan, X.; Zhang, Y.; Krehbiel, P.R.; Zheng, D.; Yao, W.; Zhang, Y.; Xu, L.; Liu, H.; Lyu, W. Channel Development and Electric Parameter Characteristics of Regular Pulse Bursts in Lightning. Geophys. Res. Lett. 2024, 51, e2023GL106582. [Google Scholar] [CrossRef] [Scilit]
  48. Lang, T.J.; Ávila, E.E.; Blakeslee, R.J.; Burchfield, J.; Wingo, M.; Bitzer, P.M.; Carey, L.D.; Deierling, W.; Goodman, S.J.; Medina, B.L.; et al. The RELAMPAGO Lightning Mapping Array: Overview and initial comparison with the Geostationary Lightning Mapper. J. Atmos. Ocean. Technol. 2020, 37, 1411–1428. [Google Scholar] [CrossRef] [Scilit]
  49. Luo, Z.R.; Liu, J.H.; Zhang, S.H.; Shao, W.W.; Zhang, L. Research on climate change in Qinghai Lake Basin based on WRF and CMIP6. Remote Sens. 2023, 15, 4379. [Google Scholar] [CrossRef] [Scilit]
Figure 1. Geographic location and station distribution of the Qinghai Datong seven-station lightning electric-field observation network. (a) Location of Qinghai Province within China; (b) location of the Datong study area within Qinghai Province; (c) station layout overlaid on a digital elevation model, with color shading representing terrain elevation (m). Black dots indicate the six outer stations (DLZ, XRZ, QSZ, DSZ, MDZ, XGZ); the red star denotes SXZ (the central station).
Remotesensing 18 02881 g001
Figure 2. Comparison of PSD for the seven stations. The left panel shows the overlaid raw PSDs in absolute scale (dB V2/Hz), while the right panel displays the stacked normalized PSDs (dark curves denote smoothed spectra and light curves represent mapped raw spectra), highlighting inter-station spectral-shape differences and narrowband interference peaks, with 10 kHz as the dividing frequency.
Remotesensing 18 02881 g002
Figure 3. Flowchart of the 3D lightning location procedure based on the WZ preprocessing framework. RFE waveforms denote the recorded broadband electric-field waveforms.
Remotesensing 18 02881 g003
Figure 4. Statistical comparison of TOA error distributions over 2000 pulse detections (1000 Monte Carlo trials, 2 pulses per trial). Black bars denote the zero-phase baseline and red hatched bars denote the full WZ. The bin width is 1 × 10⁻⁷ s, with integer values as bin edges. Errors beyond the displayed range of ±11 × 10−7 s are omitted (71 detections for the zero-phase baseline and 6 for the full WZ).
Remotesensing 18 02881 g004
Figure 5. Statistical distribution of ΔSNR_FD, ΔHF, and Gpb across the seven-station lightning observation network.
Remotesensing 18 02881 g005
Figure 6. Comparison of DLZ waveforms before and after denoising. (a) Raw waveform before denoising; (b) waveform after denoising; (c) enlarged view of a local interval (sample index from 2.224 × 10⁷ to 2.227 × 10⁷), with the raw and denoised waveforms superimposed.
Remotesensing 18 02881 g006
Figure 7. Alignment of lightning radiation pulse waveforms from seven observation stations. Denoised waveforms are shown with vertical offsets. Shaded bars and circles denote matched pulse groups and corresponding peaks, respectively. Most pulse groups show good temporal consistency across stations.
Remotesensing 18 02881 g007
Figure 8. 3-D lightning localization results for event 20250728204844 after WZ preprocessing. (a) Time–height distribution of located sources; (b) height vs. W–E distance; (c) source count histogram (1802 valid sources); (d) horizontal spatial distribution (S–N vs. W–E); (e) S–N vs. height projection. Scatter points are color-coded from blue (early) to magenta (late).
Remotesensing 18 02881 g008
Figure 9. Synchronous DLZ electric field waveform and time–height source distribution for event 20250728204844. (a) Full-event overview with synchronous electric field waveform; red markers indicate the segments enlarged in (b,c). (b,c) Zoomed views of two representative channel segments; blue dots: located sources; black curves: electric field waveform; red lines: piecewise linear fits.
Remotesensing 18 02881 g009
Figure 10. Comparison of 3-D lightning localization for event 20250728205211 under (a) conventional BP preprocessing (1182 valid sources) and (b) WZ preprocessing (2728 valid sources). Within each column, from top to bottom: the time–height distribution of located sources (top); the height versus W–E distance together with the corresponding source-count histogram (middle); and the horizontal spatial distribution (S–N versus W–E) together with the S–N versus height projection (bottom). Scatter points are color-coded from blue (early) to magenta (late). Compared with WZ, BP yields more fragmented channel traces and lower source density.
Remotesensing 18 02881 g010
Figure 11. Cumulative distribution of the localization fit χ2 for the two events under BP (black) and WZ (red) preprocessing, for qualified sources (≥5 stations, χ2 < 10). (a) Event 20250728205211; (b) Event 20250728204844. For the multi-branch event, the WZ distribution lies clearly to the upper left of BP, indicating consistently smaller χ2 despite a larger source count.
Remotesensing 18 02881 g011
Figure 12. Three-dimensional localization results after WZ preprocessing for two events from 11 August 2025: (a) a flash developing to ground (20250811180012, 2136 sources) and (b) an intracloud flash (20250811145314, 1493 sources). Each panel shows the time–height distribution, the height histogram, and the horizontal and vertical projections of the located sources. Scatter points are color-coded from blue (early) to magenta (late).
Remotesensing 18 02881 g012
Table 1. ΔE and ΔN are eastward and northward offsets from SXZ; station codes are the initials of the corresponding place names (Chinese pinyin).
StationPlace NameΔE (km)ΔN (km)Altitude (m)
SXZShangxiashan0.000.002542.68
DLZDuolin−12.55+1.332868.20
DSZDongshan−0.04+4.262784.36
MDZMinde+4.93−2.142489.56
QSZQingshan−7.66+8.382926.53
XGZXiegou+1.40−6.352734.52
XRZXunrang−9.01−1.932722.01
Table 2. Default and station-specific parameters of the WZ preprocessing framework. Station-specific values are listed only where they differ from the default; the other six stations use the default column.
CategoryParameterDefaultQSZ
Wiener shrinkageDenoising strength α0.650.65
Minimum gain (normal bands) Gmin0.120.12
Minimum gain (RFI bands) Gmin0.030.03
RFI detectionBaseline window W (bins)101151
MAD threshold kMAD55
Minimum peak prominence ΔPmin (dB)32.5
Minimum peak separation Δfsep (kHz)21
Guard margin Ng (bins)24
Notch weight dnotch0.20 (≈−14 dB)0.08 (≈−21 dB)
STFTWindowHannHann
FFT length/overlap65,536/50%65,536/50%
Zero-phase band-pass filterPassband (kHz–MHz)50–300050–3000
Edge taperRaised-cosineRaised-cosine
Table 3. Ablation results for the individual components of the WZ framework (1000 Monte Carlo trials). ZP: zero-phase band-pass filter only; WO: STFT-domain Wiener shrinkage only (no RFI mask, no final zero-phase band-pass); RO: RFI mask only (no Wiener shrinkage, no final zero-phase band-pass); WR: combined STFT-domain gain (Wiener shrinkage with the RFI mask), without the final zero-phase band-pass filter; WZ: full WZ.
MetricMethodMeanStdp5p50p95
SNR Improvement (dB)ZP2.70.71.72.63.9
WO3.10.72.13.04.4
RO3.10.92.03.04.7
WR6.70.95.56.68.2
WZ10.00.98.89.911.5
TOA RMSE (10−7 s)ZP5.05.60.93.610.4
WO5.36.50.93.626.7
RO3.74.31.03.06.2
WR3.12.90.82.75.4
WZ2.82.50.72.55.1
Table 4. Multi-station TDOA and three-dimensional localization accuracy under the multi-station Monte Carlo experiment (200 sources × 200 noise realizations), for the zero-phase baseline (ZP) and the full WZ. Errors are reported as the median over all trials. The last column is the fractional change in WZ relative to ZP, where a negative value denotes a reduction.
MetricZPWZChange
TDOA error, median (ns)272139−49%
Horizontal error, median (m)288138−52%
Vertical error, median (m)367194−47%
Fit χ2, median1.971.52−23%
Table 5. Statistical summary of phase and group delay for all stations.
StationφMean (°)φMax (°)τMean (ps)
DLZ0.050.69121
DSZ0.060.82124
MDZ0.050.77109
QSZ0.131.36245
SXZ0.080.71156
XGZ0.050.56116
XRZ0.060.79144
Table 6. Picked-TOA shift Δτ = tWZ − traw between the raw and WZ-processed waveforms, evaluated over the entire record for all strong, cleanly identifiable pulses at each station (case 20240804161442).
StationNMean (ns)Std (ns)p50 (ns)p95 |Δτ| (ns)Max |Δτ| (ns)
DLZ1337−2.122.4−2.949.571.3
DSZ3150.727.70.055.568.2
MDZ810−2.025.4−3.251.471.3
QSZ10651.031.52.058.570.3
SXZ530−2.624.3−2.850.868.9
XGZ504−2.734.1−5.759.571.7
XRZ1014−0.225.8−0.853.274.0
Disclaimer/Publisher’s Note: The statements, opinions and data contained in all publications are solely those of the individual author(s) and contributor(s) and not of MDPI and/or the editor(s). MDPI and/or the editor(s) disclaim responsibility for any injury to people or property resulting from any ideas, methods, instructions or products referred to in the content.