1. Introduction
Flooding is among the most damaging environmental hazards in the United States, producing direct losses, infrastructure disruption, displacement, health consequences, and persistent socioeconomic effects. National-scale analyses also show that flood exposure is extensive, dynamic, and unevenly distributed across communities [
1,
2,
3]. These challenges are acute in Louisiana, where low-relief topography, the Mississippi River and its distributaries, extensive wetlands, coastal processes, subsidence, tropical cyclone exposure, and rapid land-cover change create strongly heterogeneous flood environments [
4]. Reliable spatial hazard information is therefore essential for land-use planning, emergency management, infrastructure investment, insurance, and community resilience.
The Federal Emergency Management Agency (FEMA) National Flood Hazard Layer (NFHL) is the principal national regulatory source for mapped flood zones. Its Special Flood Hazard Area (SFHA) generally represents land subject to at least a 1% annual-chance flood under the mapped regulatory study, and it supports floodplain management and insurance decisions [
5]. Because the NFHL is a deterministic regulatory product, a location is classified as either inside or outside the mapped SFHA, without providing a predictive distribution for the proportion of an administrative unit covered by the SFHA. In addition, spatial analyses derived from these regulatory layers may contain areas with unresolved flood classifications due to incomplete service responses, geometric inconsistencies, temporal differences among map studies, or overlay limitations. Consequently, missing or unresolved coverage should not be interpreted as evidence of zero SFHA coverage. In this study, spatial completion refers specifically to estimating unresolved FEMA-derived SFHA-area shares from the spatial structure of the available FEMA reference data and environmental predictors. It does not imply reconstruction of physical flood occurrence, annual flood probability, flood depth, or event-specific inundation.
Environmental predictors provide complementary information for characterizing spatial variation in SFHA-area shares. Standardized land-cover products, such as the National Land Cover Database, provide one component of this information [
6], while Earth-observation and other national geospatial products can additionally characterize terrain, hydrographic connectivity, wetland context, soil drainage, and climate. Machine learning flood susceptibility studies have widely used terrain, drainage, land-cover, precipitation, topographic wetness, soil, impervious surface, and water proximity variables. However, the most influential predictors differ across study areas, flood inventories, spatial scales, sampling designs, and explanation methods [
7,
8,
9]. Thus, flood predictor importance should not be assumed to follow a fixed universal ranking, motivating attribution methods that evaluate whether predictors reliably affect multiple properties of the predicted SFHA-share distribution.
Against this background, three linked methodological gaps remain. First, regulatory flood products can contain unresolved spatial units, and unresolved coverage must not be interpreted as zero SFHA coverage. Second, random or otherwise nonspatial train–test partitions can place environmentally similar neighboring observations in both model development and evaluation sets. Under spatial dependence, such designs primarily assess local interpolation and may yield optimistic estimates of performance when the intended application is prediction in geographically separated locations [
10,
11]. This concern is directly relevant to flood mapping, for which generalization to unseen regions and case studies remains a recognized challenge [
12].
Third, flood-mapping models have predominantly been developed and evaluated as deterministic classifiers or point-prediction systems [
13,
14,
15], although probabilistic flood-susceptibility approaches have begun to provide explicit probability-based outputs [
16]. Existing approaches therefore provide important advances in uncertainty quantification, but comparatively limited attention has been given to predictive uncertainty, zero-inflated bounded outcomes, full conditional response distributions, and explanation of distribution-level effects. For decision-making and planning, locations with similar median predictions may differ substantially in exceedance probability, prediction interval width, upper-tail behavior, or model variability. Binary exceedance probabilities should therefore be evaluated for discrimination, calibration, and overall probabilistic accuracy, while continuous predictive distributions should be assessed for empirical coverage, sharpness, and proper distribution-sensitive scores such as the Continuous Ranked Probability Score and interval score [
17,
18].
These considerations motivate a more comprehensive distributional framework. Bayesian formulations provide one approach through explicitly specified probabilistic models. Conditional diffusion offers a generative alternative by learning a sampleable conditional response distribution through iterative denoising [
19,
20]. Because SFHA-area share contains an exact point mass at zero and a bounded positive component, we embed diffusion within a hurdle formulation that separates zero occurrence from positive-share modeling [
21]. The advantage sought is not universal superiority in point prediction but a flexible sample-based representation of the positive SFHA-share distribution from which medians, quantiles, exceedance probabilities, prediction intervals, calibration, and distribution-level perturbation effects can be derived within one framework. This advantage is evaluated against conventional probabilistic and machine learning benchmarks rather than assumed from model complexity alone.
Because conventional explanation methods primarily characterize point predictions, Distributional Reliability Explanation Attribution (DREA) evaluates whether predictor perturbations consistently alter multiple properties of the generated distribution, including displacement, spread, exceedance probability, and probabilistic skill [
22]. DREA is interpreted as a predictive attribution framework rather than a causal estimator.
Accordingly, the principal aim of this study is to develop a calibrated hurdle conditional diffusion framework for spatial completion of FEMA-derived SFHA coverage across Louisiana census block groups. This aim is addressed through four objectives: (1) evaluate geographic transfer under strict nested spatial blocking; (2) estimate continuous SFHA-area share, the calibrated probability that coverage is at least 10%, and prediction intervals for all census block groups; (3) identify physical predictors with reliable distribution-level effects; and (4) characterize population and neighborhood deprivation in the highest predicted-share areas. The 10% endpoint is a pre-specified screening threshold used only to derive the secondary binary exceedance outcome and associated probability calibration metrics. It is not a FEMA regulatory threshold, is not an estimate of annual flood probability, and does not affect the primary continuous SFHA-share target, prediction intervals, parish-level agreement, statewide median-share estimates, or DREA analysis. The resulting products are intended to complement, rather than replace, authoritative flood maps or site-specific hydraulic studies.
The methodological advance therefore lies not in conditional diffusion alone but in its integration with leakage-safe spatial-transfer evaluation, probabilistic calibration, explicit separation of verified and prediction-only census block groups, and distribution-level explanation. Together, these components enable uncertainty-aware spatial completion while preserving independent evaluation of geographic transfer and interpretable attribution of distributional effects. The resulting outputs support hazard screening and prioritization of locations requiring updated mapping or additional hydraulic review.
2. Materials and Methods
2.1. Study Area and Spatial Unit
Louisiana was selected because its low-relief terrain, extensive wetland systems, dense river and drainage networks, coastal exposure, and heterogeneous urban and agricultural landscapes create a complex setting for spatial flood hazard analysis. Census block groups were used as the primary spatial unit because they provide a relatively fine geographic scale for integrating physical predictors with post-model population and socioeconomic indicators. This administrative aggregation necessarily summarizes finer-scale hydrological variability within each census block group; localized terrain depressions, drainage pathways, levees, channels, and abrupt floodplain transitions may therefore be smoothed when represented as block-group-level means, proportions, or distances. The final statewide domain contained 4294 census block groups distributed across 64 parishes. All spatial datasets were harmonized to the census-block-group geometries and a common projected coordinate reference system. Raster variables were summarized by zonal statistics, while vector datasets were represented by area proportions, nearest-feature distances, or line densities. All maps and graphical figures presented in this study were generated programmatically in Python 3.10, using GeoPandas 0.14 for geospatial data handling and Matplotlib 3.8 for visualization.
Census block groups with sufficiently resolved FEMA reference information were eligible for model development and evaluation. Units with unresolved reference information were excluded from training, calibration, threshold selection, and reported performance metrics but retained as prediction-only units. This separation prevented unresolved reference status from being encoded as zero SFHA coverage.
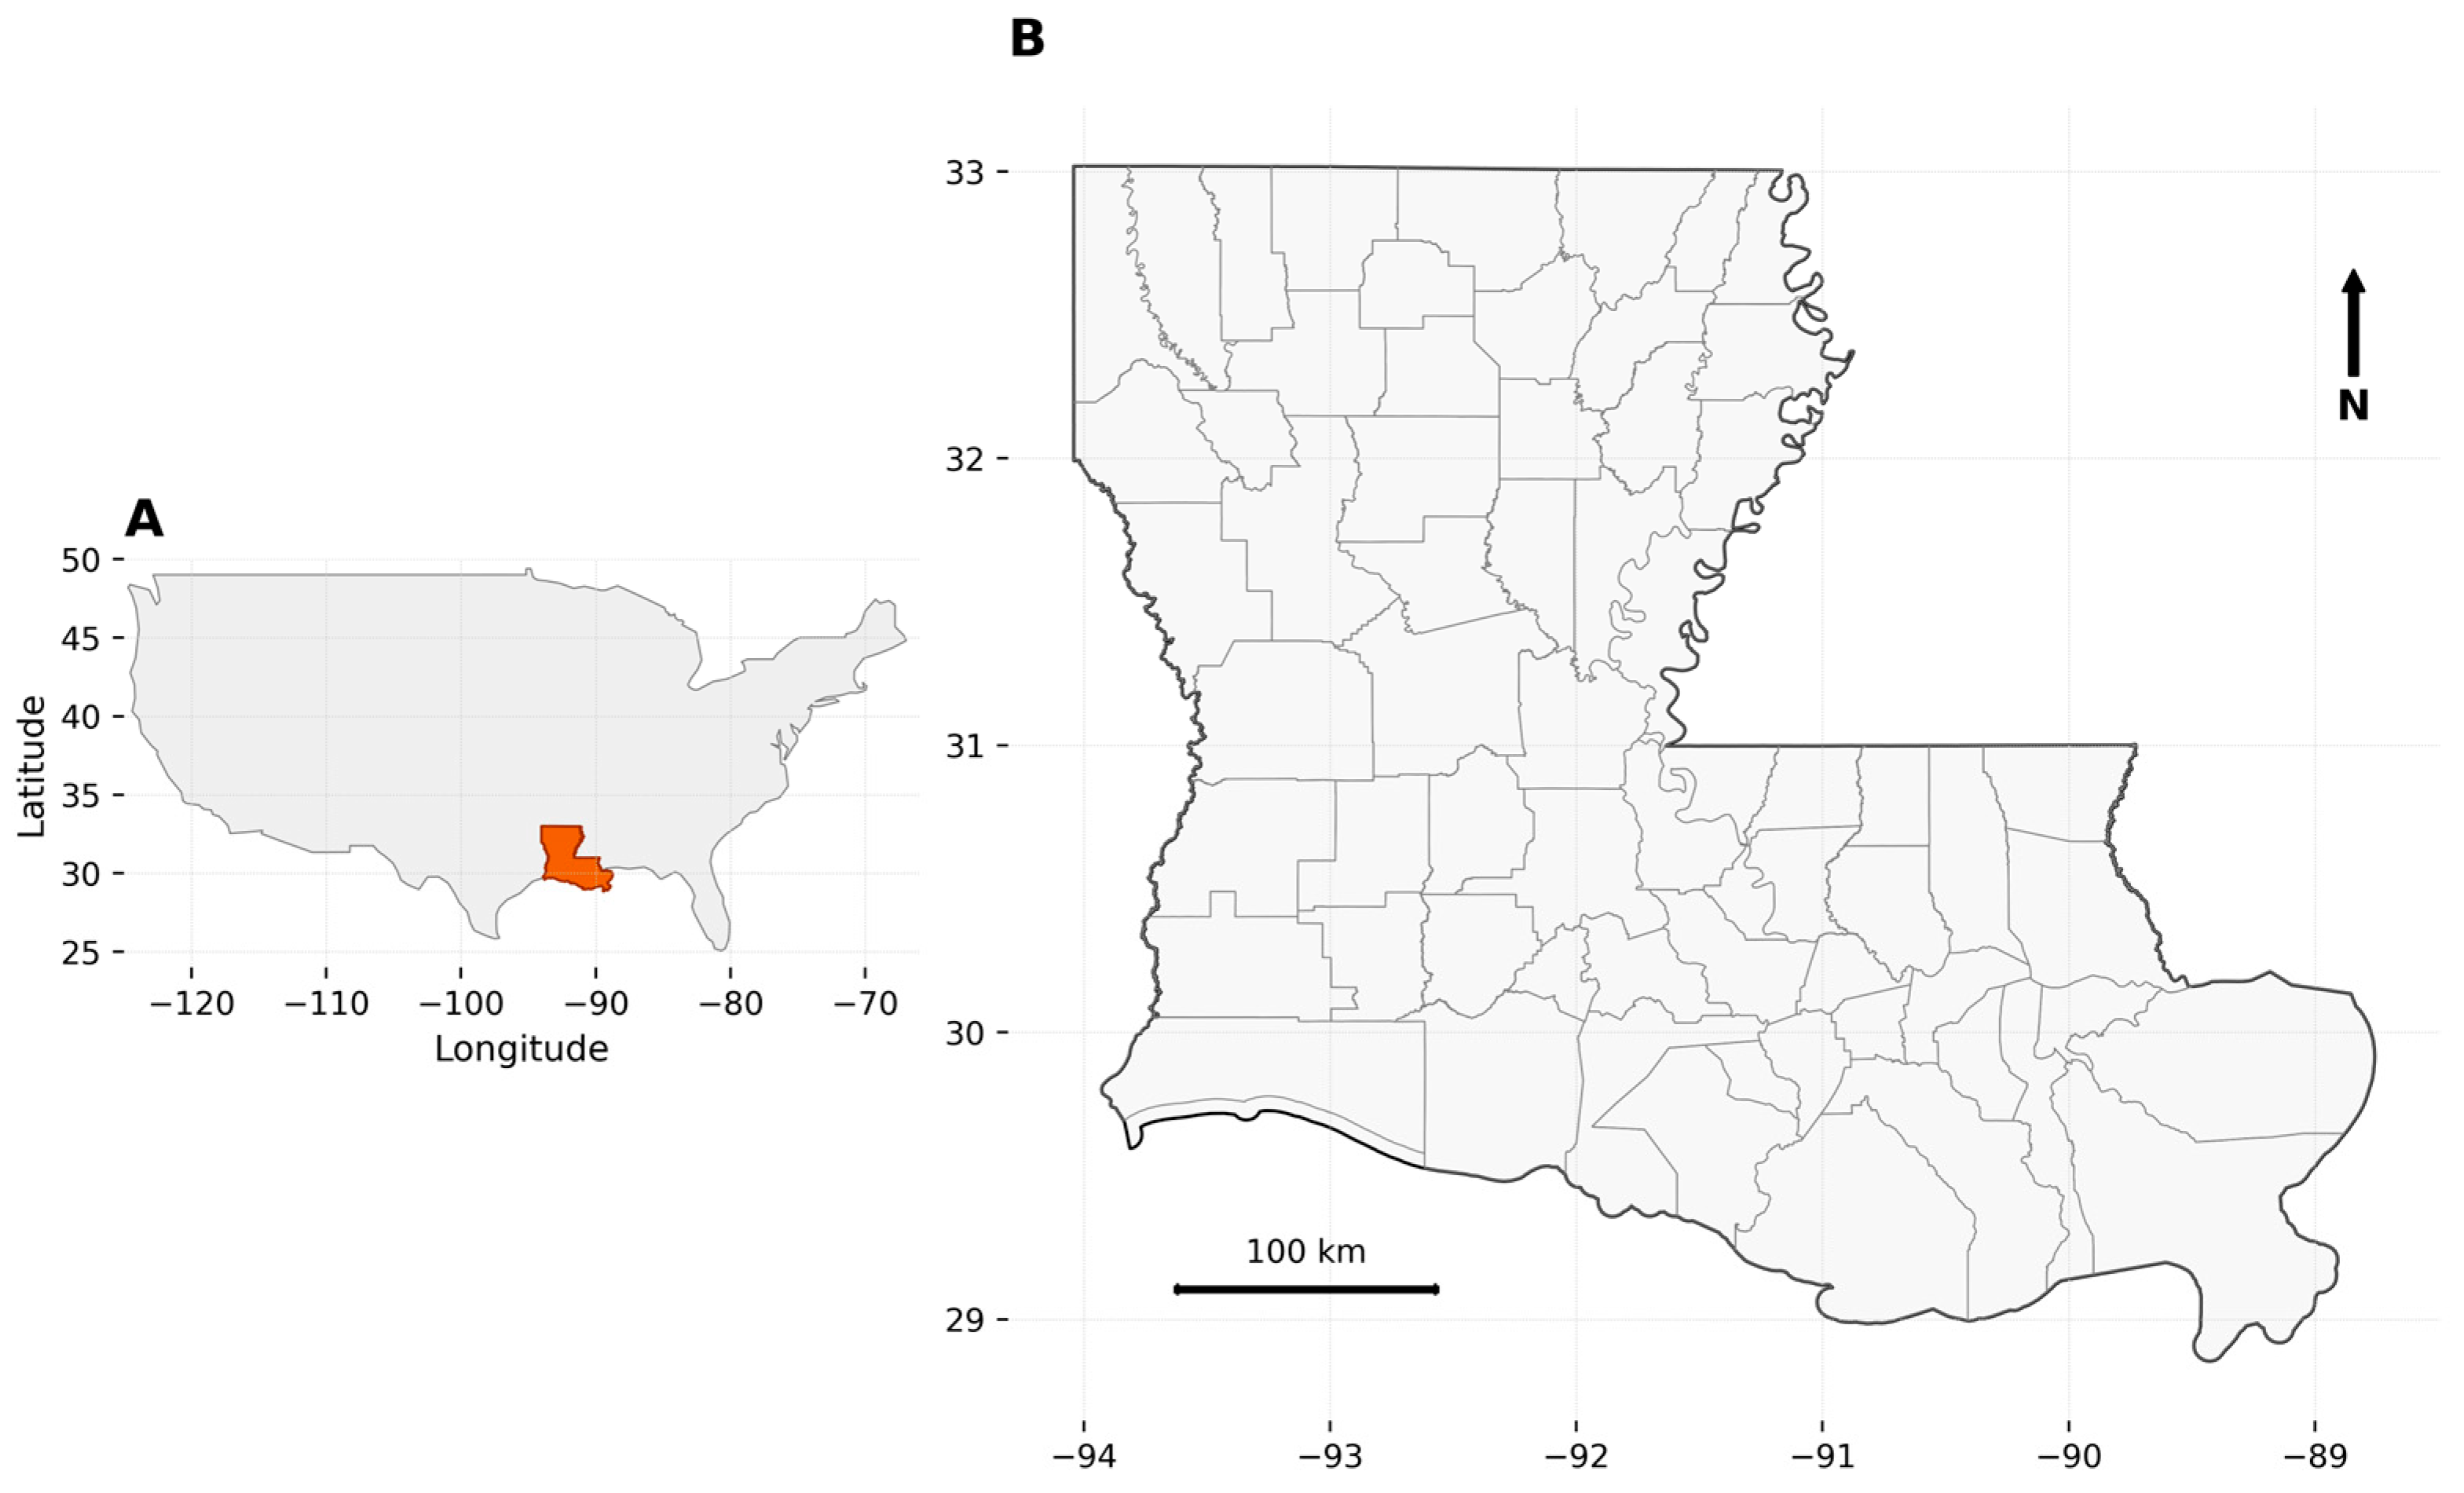
Figure 1 shows the geographic context and Louisiana study domain, while
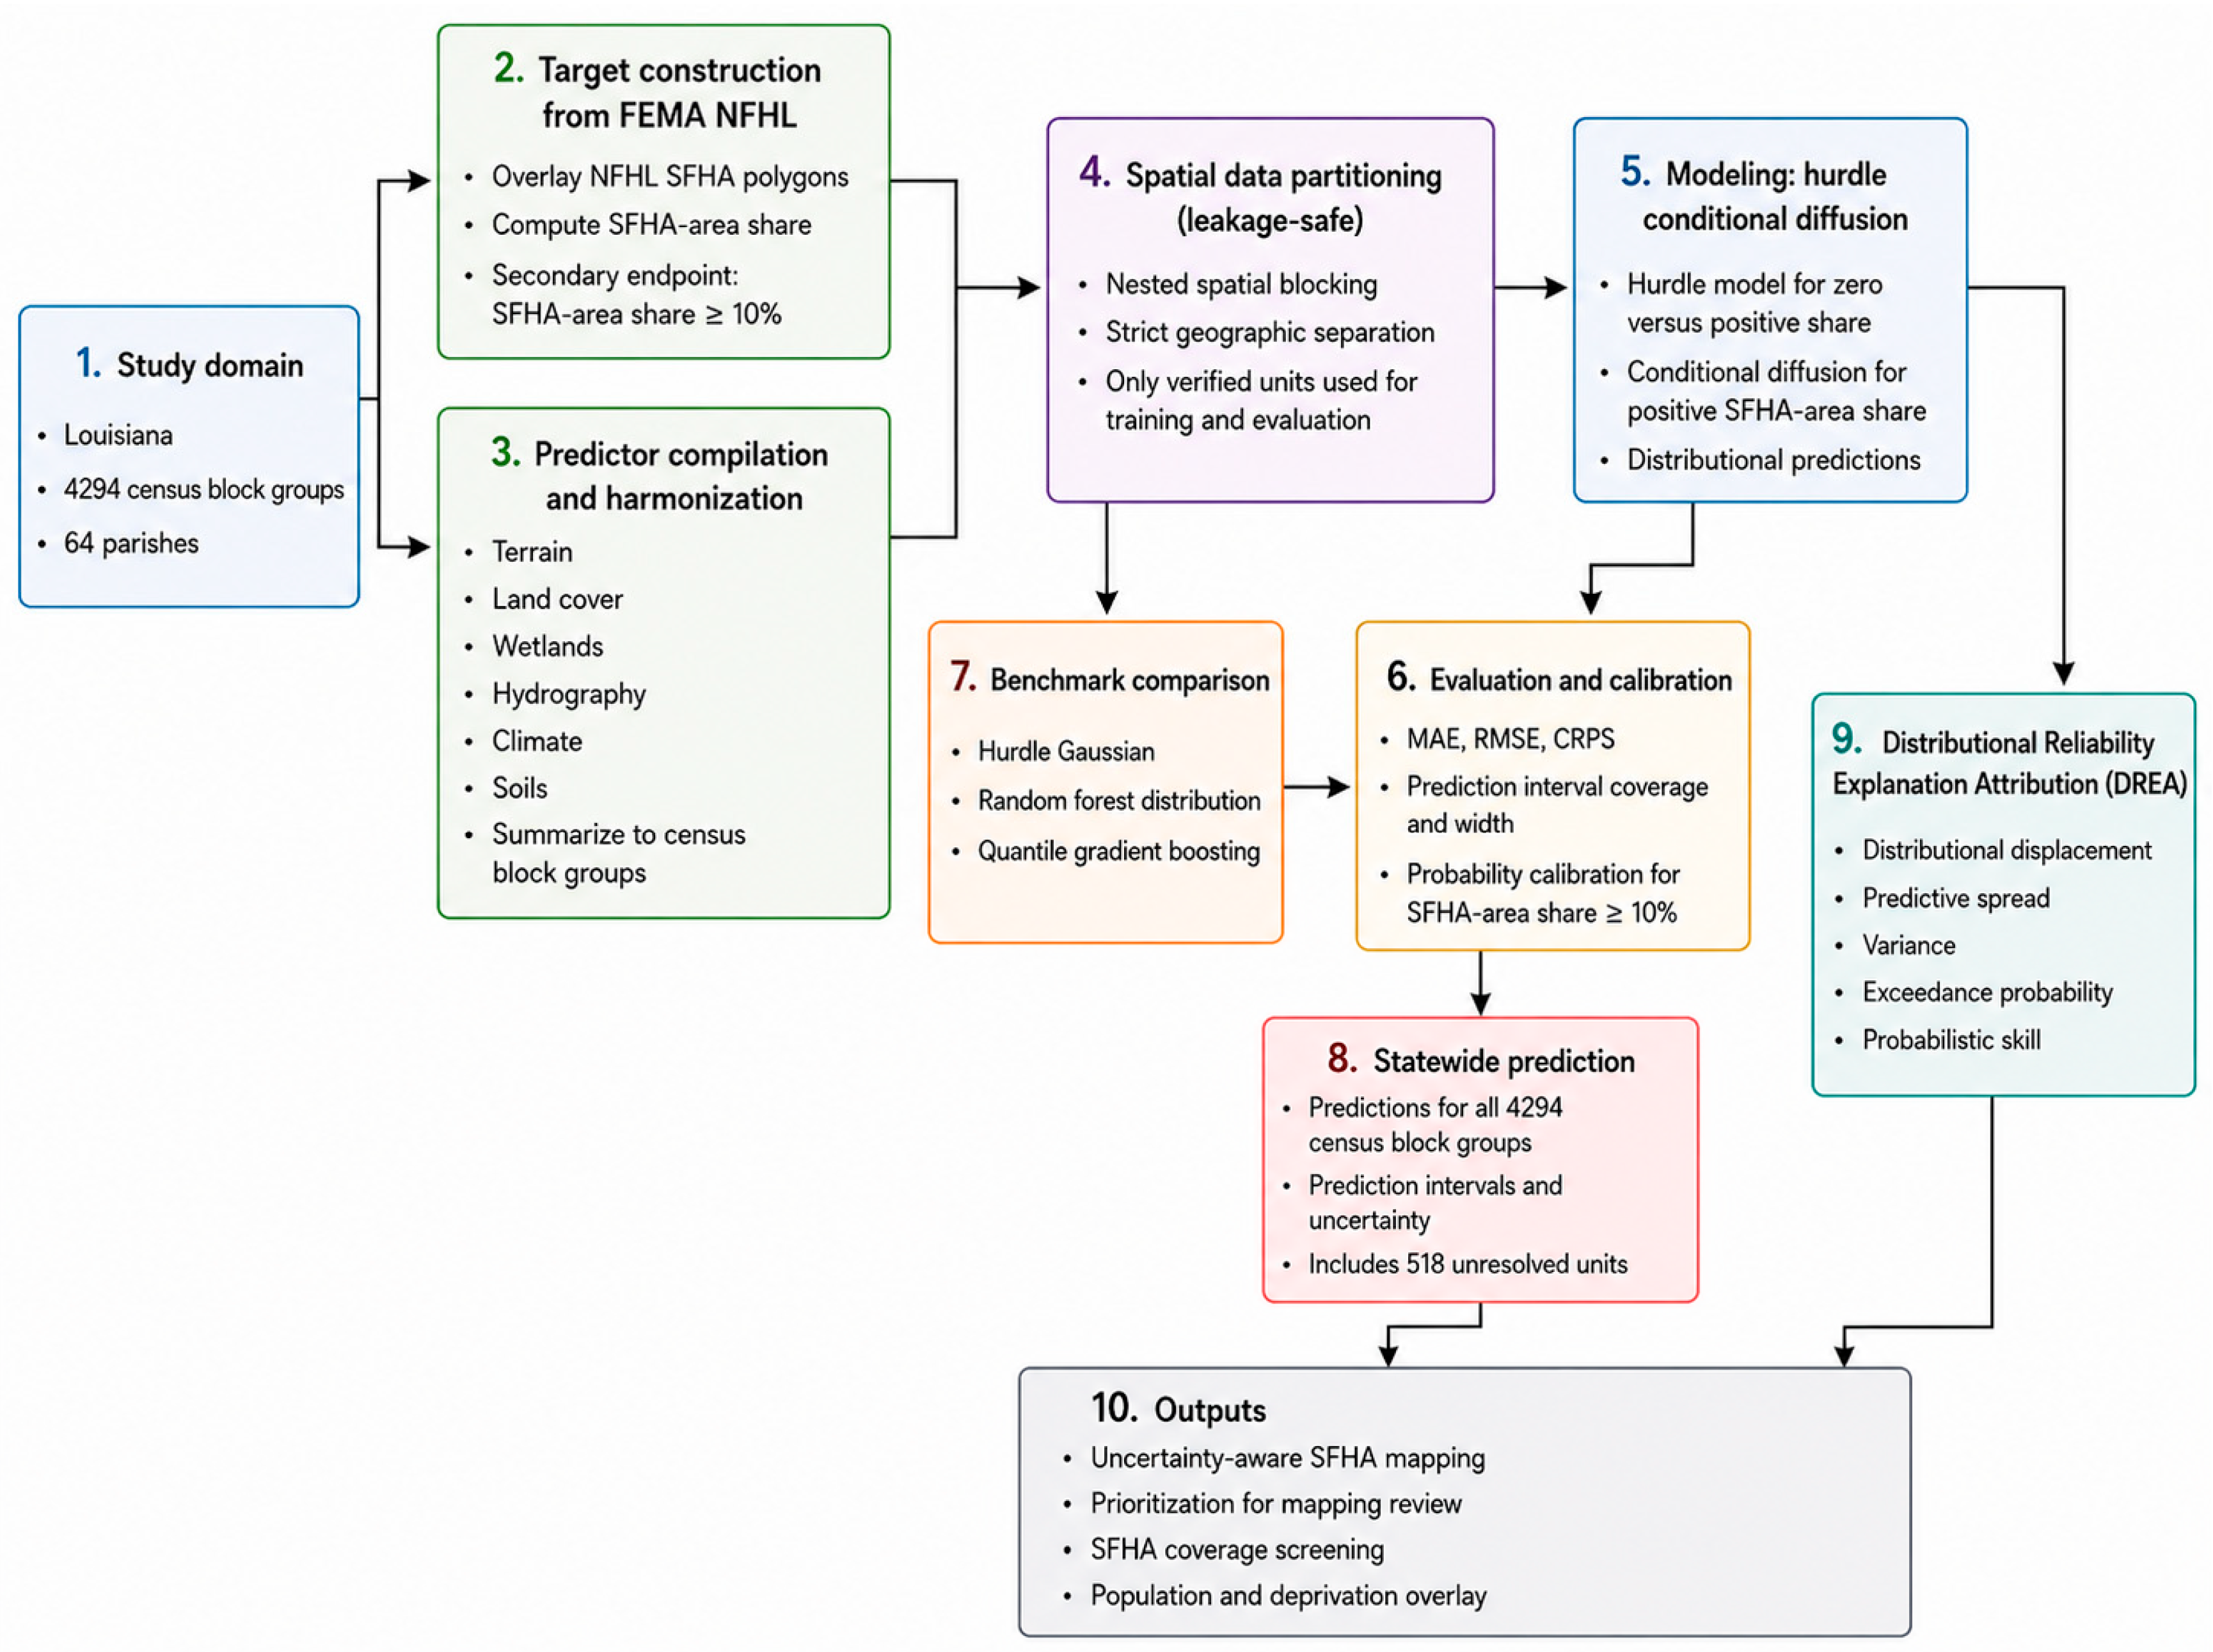
Figure 2 summarizes the analytical workflow followed in this study.
2.2. Data Sources
The analysis integrated the FEMA NFHL, remotely sensed terrain and land-cover products, national wetland and hydrography inventories, climate surfaces, soil characteristics, and post-model population and deprivation indicators (
Table 1). The response variable (i.e., the proportion of each administrative unit covered by the SFHA) was derived exclusively from the NFHL. FEMA-derived flood-zone attributes, reference-resolution fields, coordinates, and identifiers were used only to construct the SFHA-share response variable, audit reference completeness, map dominant flood-zone classes, and separate verified from unresolved census block groups. These fields were excluded from the predictor matrix to prevent information leakage during model training and evaluation. Remote sensing products characterized topography, land cover, impervious surface, tree canopy, and agricultural context, while inventories and modeled surfaces supplied wetlands, hydrography, climate, and soils.
These source datasets were not required to have identical native spatial resolutions. Rather than resampling all inputs to a common raster grid, each source was harmonized to the census-block-group analytical unit. Raster predictors were summarized within census block groups using zonal statistics or class proportions, whereas vector datasets were represented using polygon coverage, feature density, or nearest-feature distance. Consequently, all model predictors entered the analysis at a common census-block-group support despite differences in their native spatial representation. Geographic transferability under this harmonized representation was assessed using strict spatially blocked out-of-fold evaluation.
2.3. Target Construction and Reference-Resolution Audit
SFHA polygons were obtained from the FEMA NFHL and intersected with the original census-block-group geometries in Louisiana. SFHA coverage was defined as the union of all FEMA A-series (A, AE, A1–A30, AH, AO, A99, AR, and AR combination zones) and V-series (V, VE, and V1–V30) flood zones, which delineate areas subject to the base (1% annual-chance) flood. The A-series primarily represents riverine and shallow-flooding hazards, whereas the V-series represents coastal high-hazard areas exposed to wave action. Including both groups was necessary to represent Louisiana’s combined riverine, deltaic, and coastal flood settings. Overlapping polygons were spatially unioned before area calculation to prevent double counting. All areas were calculated in the EPSG:5070 equal-area coordinate reference system.
For census block group
, the continuous target was defined as
where
denotes projected polygon area. The continuous target represents the proportion of the census-block-group polygon mapped within the SFHA. This formulation preserves variation in the spatial extent of mapped hazard across Louisiana’s heterogeneous riverine, coastal, and wetland environments.
A binary screening endpoint was derived as
The 10% threshold was specified before model evaluation to distinguish census block groups with material SFHA coverage from those affected only by very small or boundary intersections. It is an analytical screening threshold, not a FEMA regulatory threshold or an estimate of annual flood probability.
Each census block group was first assessed to determine whether its FEMA reference information was sufficiently complete for target construction. A positive observation was accepted only after complete retrieval and verification of the relevant FEMA hazard polygons. A below-threshold observation was classified as a verified negative only when the hazard query was complete and the FEMA data availability layer covered at least 95% of the census block group. Failed or incomplete retrievals, invalid geometries, and units with insufficient FEMA availability were assigned unresolved status rather than being coded as zero.
Across the statewide domain of 4294 census block groups, the reference-resolution audit classified 3776 units as verified, of which 2619 met the 10% criterion and 1157 did not. An additional 518 census block groups with unresolved SFHA coverage were retained as prediction-only units and excluded from model training, calibration, threshold selection, and performance evaluation. Duplicate identifiers, missing values, invalid area shares, and incomplete query results were also identified and removed before modeling. Accordingly, the continuous SFHA-area share was used as the primary response variable for distributional modeling, while a derived binary indicator based on a 10% coverage threshold was retained for screening and classification analyses.
2.4. Predictor Construction and Transformation
Eighty-two physical predictors were retained after removing target variables, FEMA-derived fields, identifiers, parish labels, and centroid coordinates. Predictor families represented topography; land cover; impervious surfaces; tree canopy; agriculture; climate; wetlands; hydrography; and soils and drainage (
Table 1). Continuous rasters were summarized using means, standard deviations, ranges, and selected upper quantiles; categorical rasters were converted to percentage coverage.
Table S2 provides the complete list of predictors used for modeling.
Potential predictor redundancy was evaluated using pairwise Spearman rank correlations across the 3776 census block groups retained for model development. Of 3321 unique predictor pairs, 159 had |ρ| ≥ 0.70, 68 had |ρ| ≥ 0.80, and 30 had |ρ| ≥ 0.90, with the strongest correlations occurring mainly among alternative summaries derived from the same environmental data products (
Figure S6). Correlation-based feature removal was not applied because the analysis sought to retain physically distinct representations of terrain, wetland, hydrographic, climatic, and soil conditions. Instead, the correlation analysis was used to qualify subsequent attribution result interpretation.
2.5. Spatially Blocked Nested Cross-Validation for Geographic Transfer Evaluation
Because the intended application was prediction of unresolved SFHA-area shares in geographically distinct locations, model performance was assessed using nested spatial cross-validation designed to mimic geographic transfer. First, projected census-block-group centroids were overlaid with a 20 km spatial grid. Census block groups falling within the same grid block were kept together so that nearby observations were not split randomly across training and testing sets. The 20 km blocks were then grouped into five compact outer spatial folds, each representing a geographically contiguous test region.
Each outer fold was withheld once as an independent geographic test region. The remaining four outer folds were used for model development, including model training and inner spatial validation. Within the non-test data, an inner spatial validation subset supported early stopping, probability calibration, conformal interval calibration, and decision threshold selection. A 15 km exclusion buffer was applied between training and validation/test locations to reduce residual spatial dependence and minimize information leakage caused by spatial autocorrelation. The 20 km block size and 15 km exclusion buffer were prespecified as conservative spatial separation parameters to reduce proximity-based information leakage rather than derived from a formal autocorrelation range or tuned using outer-test performance. The 20 km grid defined spatial units for fold construction and block bootstrap, while the 15 km buffer imposed additional separation between training and validation/test locations. Sensitivity to the exclusion buffer specification was evaluated separately as a robustness analysis.
Consequently, every verified census block group received exactly one strict out-of-fold prediction from a model that had not used that observation during training, calibration, or threshold selection. This evaluation strategy aligns model assessment with the intended spatial-transfer problem and avoids the optimistic bias associated with random partitioning [
11].
2.6. Hurdle Conditional Diffusion Model
The empirical target contained a mixed distribution with an exact point mass at zero and a bounded continuous distribution for positive SFHA shares. We therefore modeled the conditional response using a hurdle formulation:
where
is the probability of positive SFHA coverage and
is the conditional distribution of the positive share. A histogram gradient boosting classifier was used to estimate
, while a conditional diffusion model was used to characterize
. Because SFHA-area shares are bounded between 0 and 1, positive values were slightly adjusted away from the boundaries of this interval and transformed using the logit function. This transformation converts the bounded proportions into an unconstrained scale, allowing the diffusion model to generate realistic continuous predictions without producing impossible values below 0 or above 1. Conditional diffusion was selected not to maximize point-prediction accuracy alone but to represent the full conditional distribution of the positive SFHA share. This allows the same model to support predictive sampling, prediction intervals, exceedance probabilities, probabilistic calibration, and distribution-level attribution through DREA.
Let
denote the logit-transformed positive SFHA share. At diffusion step
, Gaussian noise
was progressively added according to
where
is the cumulative noise schedule coefficient. It controls the balance between the retained original SFHA share and the added Gaussian noise at diffusion step
. A feed-forward multilayer perceptron [
31] was trained as the conditional denoising network to recover the added noise. The multilayer perceptron architecture was specified as a compact, regularized network for the 82-dimensional tabular conditioning input and was held fixed across all outer folds and model realizations. An exhaustive hyperparameter search was not performed against the outer test folds. Instead, model state selection was based exclusively on the inner spatial validation denoising loss, with dropout, weight decay, gradient clipping, and early stopping used to limit overfitting. This design maintained a common reproducible architecture throughout the spatial-transfer evaluation while preventing test-fold information from influencing model selection.
The conditional network used an 82 → 192 → 192 feed-forward conditioning encoder. The 82 standardized physical predictors were passed through two fully connected layers with 192 units per layer and SiLU activations, with dropout of 0.05 after the first layer. The resulting 192-dimensional conditioning representation was concatenated with the one-dimensional noisy target and a 32-dimensional sinusoidal time-step embedding, producing a 225-dimensional input to the denoising network. The denoising network then followed the dimensional sequence 225 → 192 → 192 → 192 → 1, with SiLU activations and dropout after the first two hidden layers. The final scalar output estimated the Gaussian noise added at the corresponding diffusion step. The denoiser was trained by minimizing the mean squared error between the generated noise, ε, and the predicted noise, .
The diffusion process used 80 steps and a linear variance schedule ranging from to . Model parameters were optimized using AdamW with a learning rate of , weight decay of , a batch size of 256, and gradient-norm clipping at 1.0. Training continued for a maximum of 100 epochs, with the best parameter state selected according to the inner-validation denoising loss. Early stopping was applied after 15 epochs without an improvement of at least .
The complete architecture and training configuration is summarized in
Table S4 to facilitate reproducibility. The modeling workflow was implemented in Python 3.10 using PyTorch 2.2, with GPU acceleration on an NVIDIA-equipped Lenovo Legion workstation. Exact wall-clock training time was not retained; however, the complete architecture, optimization, and sampling configuration, including the 170,689 trainable parameters, is provided in
Table S4, and the full modeling code is publicly available in the accompanying Zenodo archive.
To capture uncertainty associated with limited training data and model variability, each outer fold included ten independently trained model realizations generated from spatial block bootstrap samples. The bootstrap used the same 20 km spatial block structure as the outer-fold construction but was applied only within the non-test training data. For each realization, training blocks were sampled with replacement, and all census block groups within selected blocks were retained together. This preserved local spatial structure during resampling while ensuring that no observations from the withheld outer test fold entered model training or calibration. For each trained realization, 100 independent reverse-diffusion trajectories were generated for each census block group by initializing the sampling process with different Gaussian noise states. The generated latent values were returned to their original scale, transformed through the inverse-logit function to obtain positive SFHA shares in , and combined with Bernoulli draws based on the estimated hurdle probability. Samples from the ten realizations were then pooled to form the complete predictive distribution for each census block group, capturing uncertainty from response variability, spatial sampling variation, and model stochasticity while maintaining the spatially blocked evaluation design.
2.7. Calibration and Statewide Prediction
The diffusion-hurdle model produces a predictive distribution rather than a single deterministic estimate. However, generated predictive distributions may be miscalibrated such that their quantiles may not match observed frequencies, their exceedance probabilities may be systematically over- or underestimated, and their nominal prediction intervals may fail to achieve the intended coverage. To improve probabilistic reliability while preventing information leakage, all calibration procedures were learned exclusively from the inner spatial validation data and then applied unchanged to the held-out outer test fold.
Three complementary calibration steps addressed different aspects of this problem. First, probability integral transform (PIT) remapping adjusted the generated cumulative distribution functions so that predictive quantiles better matched observed validation frequencies. Second, isotonic regression calibrated the derived exceedance probability
, aligning predicted probabilities with observed frequencies while preserving their rank ordering. Third, split-conformal residual calibration adjusted the lower and upper predictive quantiles to form nominal 90% prediction intervals with improved empirical coverage [
32,
33]. The predictive median served as the principal continuous estimate, and no calibration parameters were estimated from the outer test fold.
For the 3776 verified census block groups with resolved reference information, the statewide layer retained each unit’s strict outer-fold prediction. For the 518 unresolved units, samples were ensembled across independently trained outer-fold models. Accordingly, the completed map combines leakage-safe out-of-fold estimates in the verified domain with prediction-only ensemble estimates in the unresolved domain. The primary continuous output was the predicted SFHA-area share with nominal 90% prediction intervals. The secondary probabilistic output was the calibrated probability that the FEMA-mapped SFHA share was at least 10%; this probability describes uncertainty in the predicted SFHA-area share and should not be interpreted as annual flood probability.
A supplementary calibration sensitivity evaluated whether interval undercoverage reflected limited geographic representativeness of a single inner calibration subset. The same 15 km buffered outer spatial evaluation was retained, but calibration information was pooled across spatially cross-fitted predictions from all non-test folds. The sensitivity compared PIT remapping alone with symmetric additive, asymmetric additive, asymmetric normalized, and Mondrian asymmetric normalized cross-conformal interval corrections. Asymmetric normalized corrections estimated separate lower- and upper-tail adjustments scaled by the uncalibrated interval width. As in the primary calibration workflow, all sensitivity calibration parameters were derived exclusively from non-test observations and applied to the untouched outer test fold.
2.8. Evaluation and Benchmark Models
Binary performance was evaluated using the area under the receiver operating characteristic curve (AUROC), area under the precision–recall curve (AUPRC), Brier score, log loss, calibration intercept and slope, expected calibration error, F1 score, sensitivity and specificity. Precision–recall performance was emphasized because it directly characterizes positive predictive ranking and is informative when outcome frequencies are uneven [
34]. Decision thresholds for threshold-dependent metrics were selected within the corresponding validation data, never from an outer test fold.
Continuous prediction was evaluated using mean absolute error, root mean squared error, Pearson correlation, Spearman rank correlation, Continuous Ranked Probability Score, empirical 90% interval coverage, mean interval width, and interval score [
18]. Parish-level observed and predicted means were compared to assess recovery of broader spatial gradients. The hurdle diffusion model was compared under the same outer spatial folds with a hurdle Gaussian model [
35], a random forest tree distribution [
36], quantile gradient boosting [
37], and a direct calibrated histogram gradient boosting classifier [
38].
2.9. Distributional Reliability Explanation Attribution
DREA evaluated whether perturbing a predictor produced a material change in the full predictive distribution across independently trained model realizations [
22]. DREA was previously benchmarked against SHAP and permutation importance in its methodological validation [
22], including controlled synthetic experiments with known mean, variance, tail, correlated proxy, and noise predictors. Because those comparisons were designed specifically to establish the distinction between conventional point-attribution importance and distributional reliability attribution, they were not repeated here. To keep the present application focused and computationally manageable, we instead applied DREA to characterize how physical predictors influence multiple properties of the SFHA-share predictive distribution.
For each predictor, physically bounded positive and negative one-standard-deviation perturbations were applied while other predictors were held at their observed values. Baseline and perturbed diffusion samples used common random numbers to reduce avoidable Monte Carlo noise. A marginal-shuffle perturbation served as a secondary sensitivity mode.
Following Ref. [
22], five complementary distributional effects were evaluated: Wasserstein displacement between the baseline and perturbed predictive distributions; absolute change in nominal 90% prediction interval width; absolute change in predictive variance; absolute change in the probability that the SFHA share was at least 50%; and change in the Continuous Ranked Probability Score. The 50% threshold represents majority SFHA coverage within a census block group and approximately corresponds to the upper quartile of the observed SFHA-share distribution. It was therefore used as a secondary substantial coverage diagnostic distinct from the primary 10% screening endpoint.
For predictor
, distributional component
, and model realization
, the effects from the positive and negative one-standard-deviation perturbations were averaged to obtain the directional effect summary
. A material effect was defined as one exceeding
, the 60th percentile of the pooled effect distribution for component
. The DREA probability was then calculated as
where
is the number of independently trained model worlds and
is the indicator function. Thus,
represents the proportion of model realizations in which predictor
produced a material effect on distributional component
. The code used a default material effect threshold at the 60th percentile, following the sensitivity analysis in Ref. [
22].
The five component probabilities were retained as a distributional attribution profile. Their arithmetic mean was used only as an exploratory summary for ordering the heatmap and was not interpreted as a theoretically privileged overall importance score. The exhaustive analysis evaluated all 82 physical predictors across 10 model realizations in the spatially held-out fold. DREA values are predictive attributions and do not establish causal effects.
2.10. Population and Deprivation Overlay
American Community Survey (ACS) and Area Deprivation Index variables were excluded from physical model training and added only after statewide prediction. Census block groups were ranked by predicted median SFHA share, and the upper 20% and upper 10% were summarized. Population totals represent residents living in selected census block groups; they are not direct estimates of residents located within the predicted SFHA portion. National Area Deprivation Index percentiles range from 1 (least deprived) to 100 (most deprived) [
30]. Selected ACS indicators were compared descriptively across statewide, upper-20%, and upper-10% groups. These comparisons serve as an equity overlay.
3. Results
3.1. FEMA Reference Coverage and Unresolved Census Block Groups
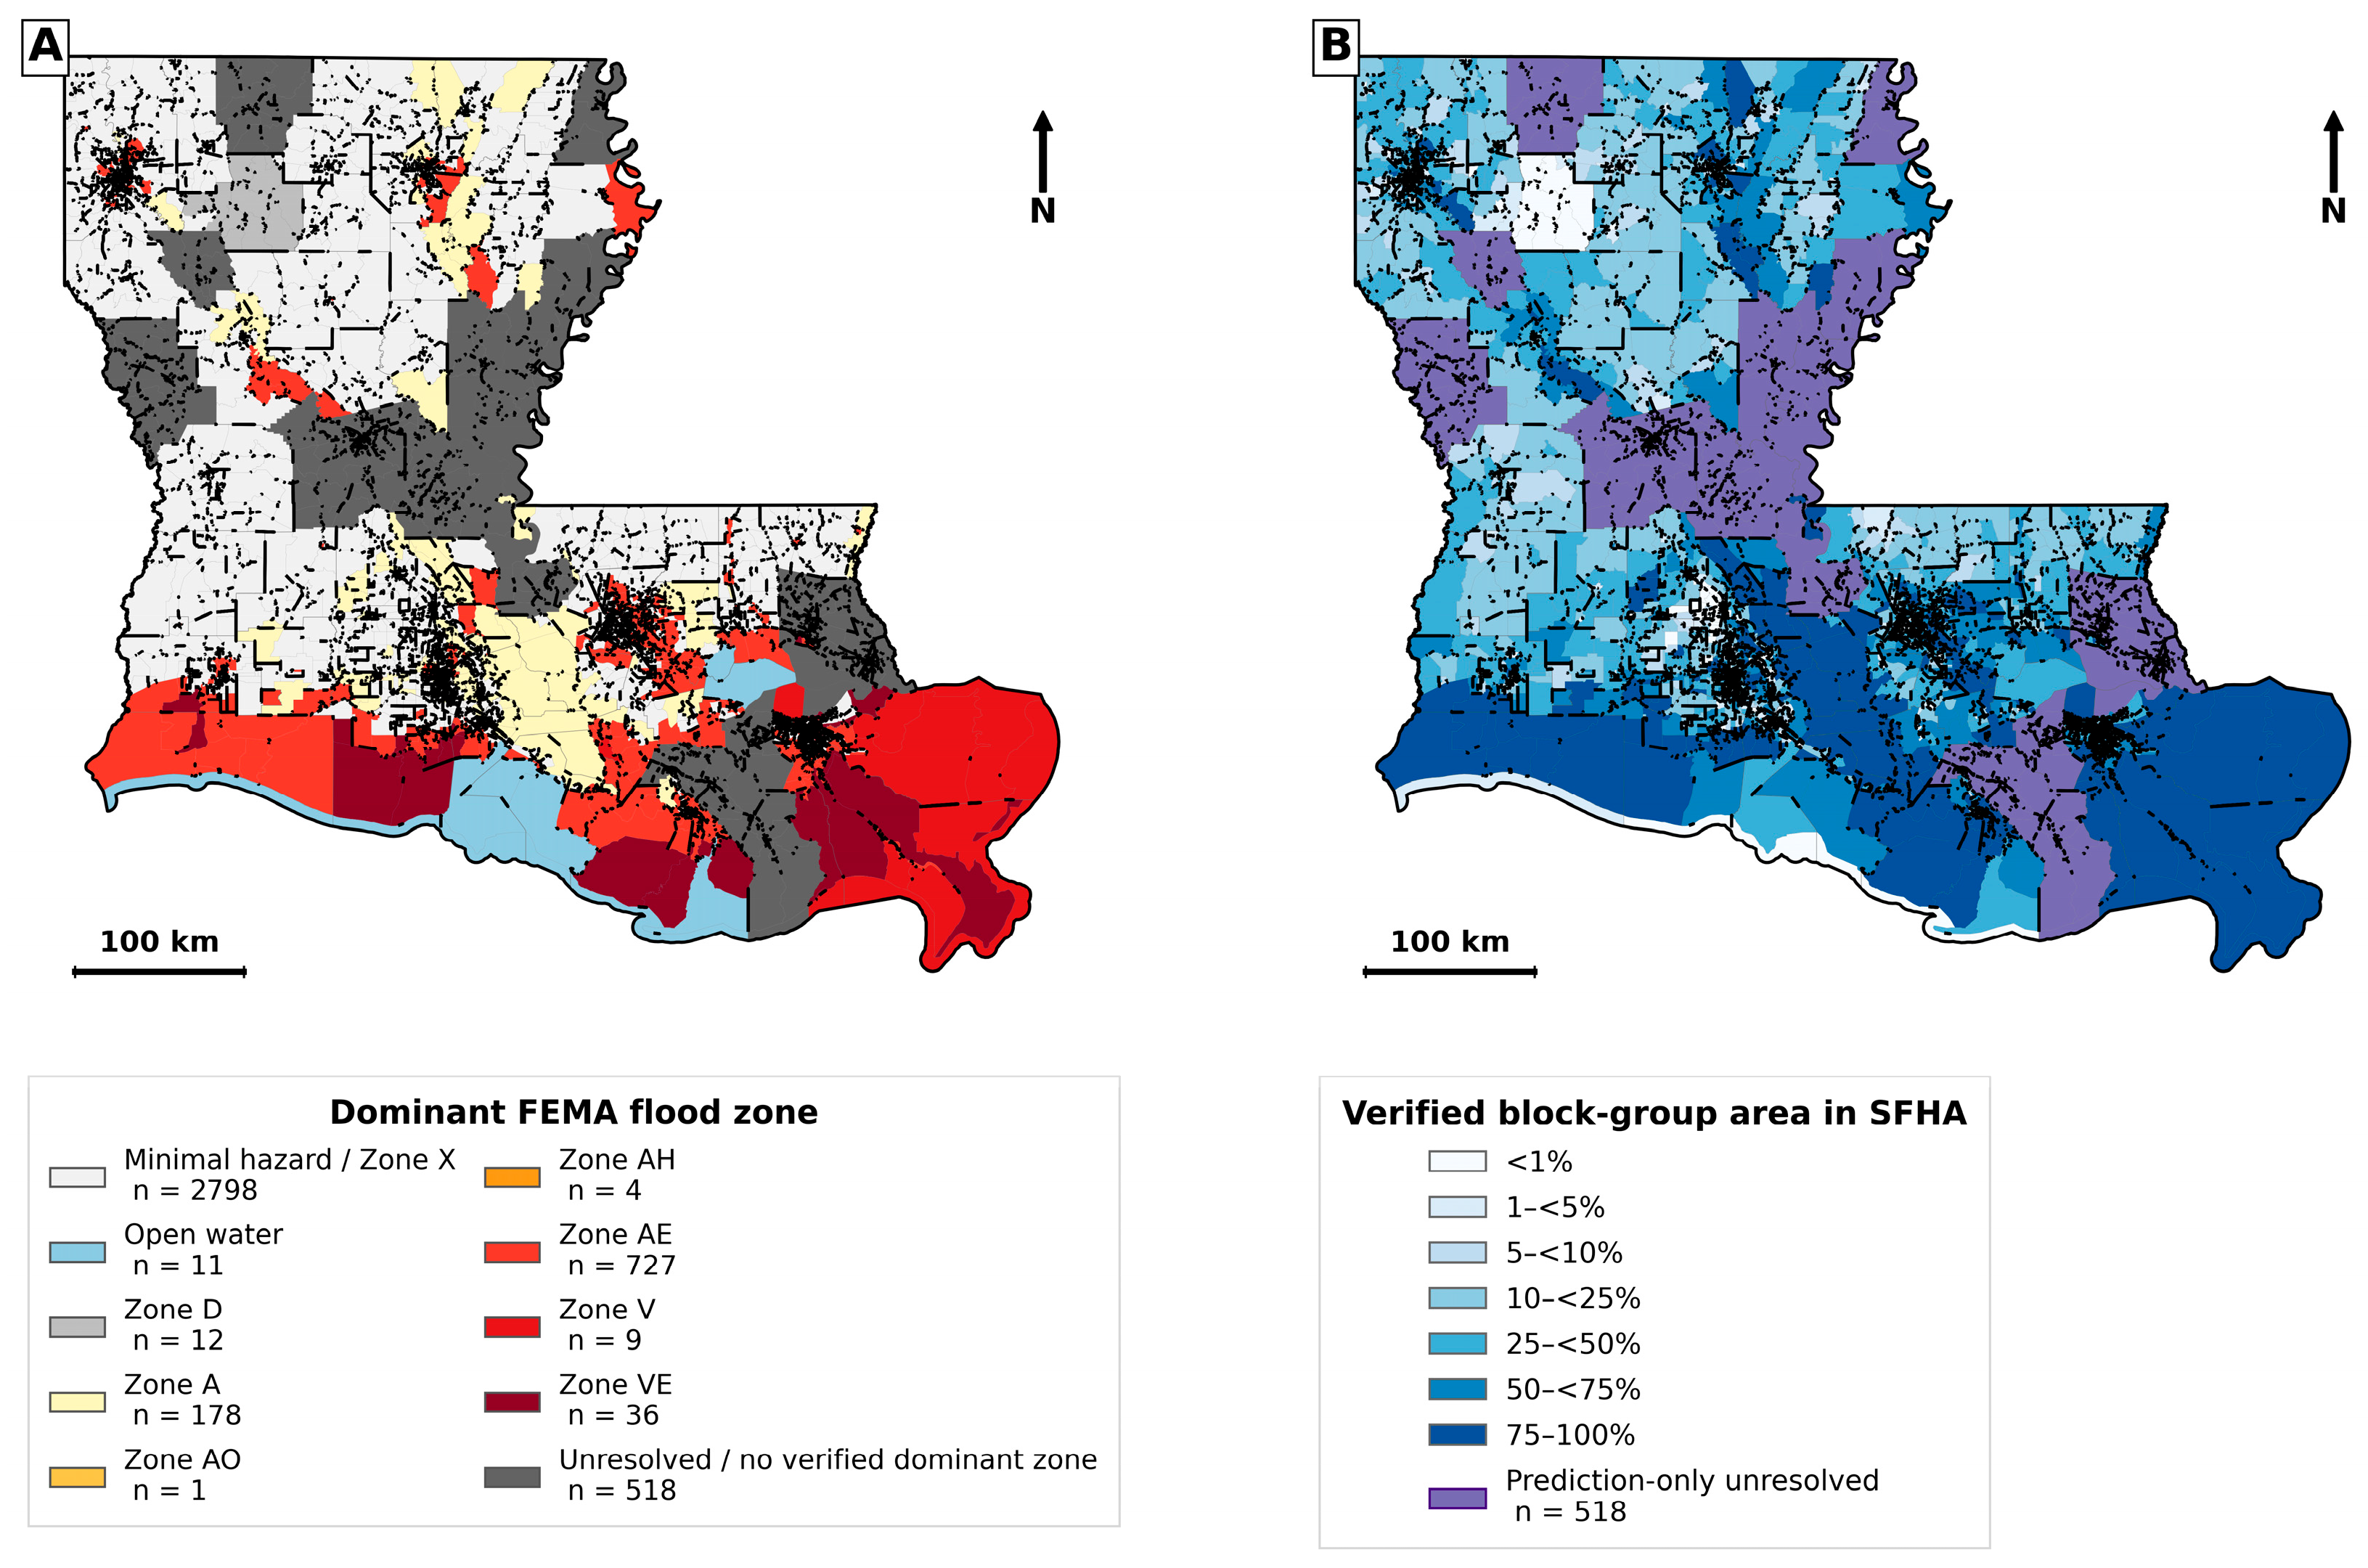
Figure 3 shows that FEMA flood-zone classes and verified SFHA shares varied markedly across Louisiana. Coastal and southern census block groups were dominated by riverine, coastal, and storm-surge-related flood zones, whereas minimal-hazard or lower-hazard classes occurred more frequently in parts of northern and interior Louisiana (
Figure 3A). The continuous reference surface showed high SFHA shares in coastal, deltaic, low-elevation, and major river landscapes, with pronounced within-parish variation (
Figure 3B).
A total of 518 census block groups lacked sufficiently resolved FEMA reference information and were designated prediction-only units (
Figure 3). These units occurred in spatially contiguous clusters rather than as isolated random omissions. They were visually separated from verified low-share units and excluded from all model fitting and performance calculations.
3.2. Statewide Spatial Completion
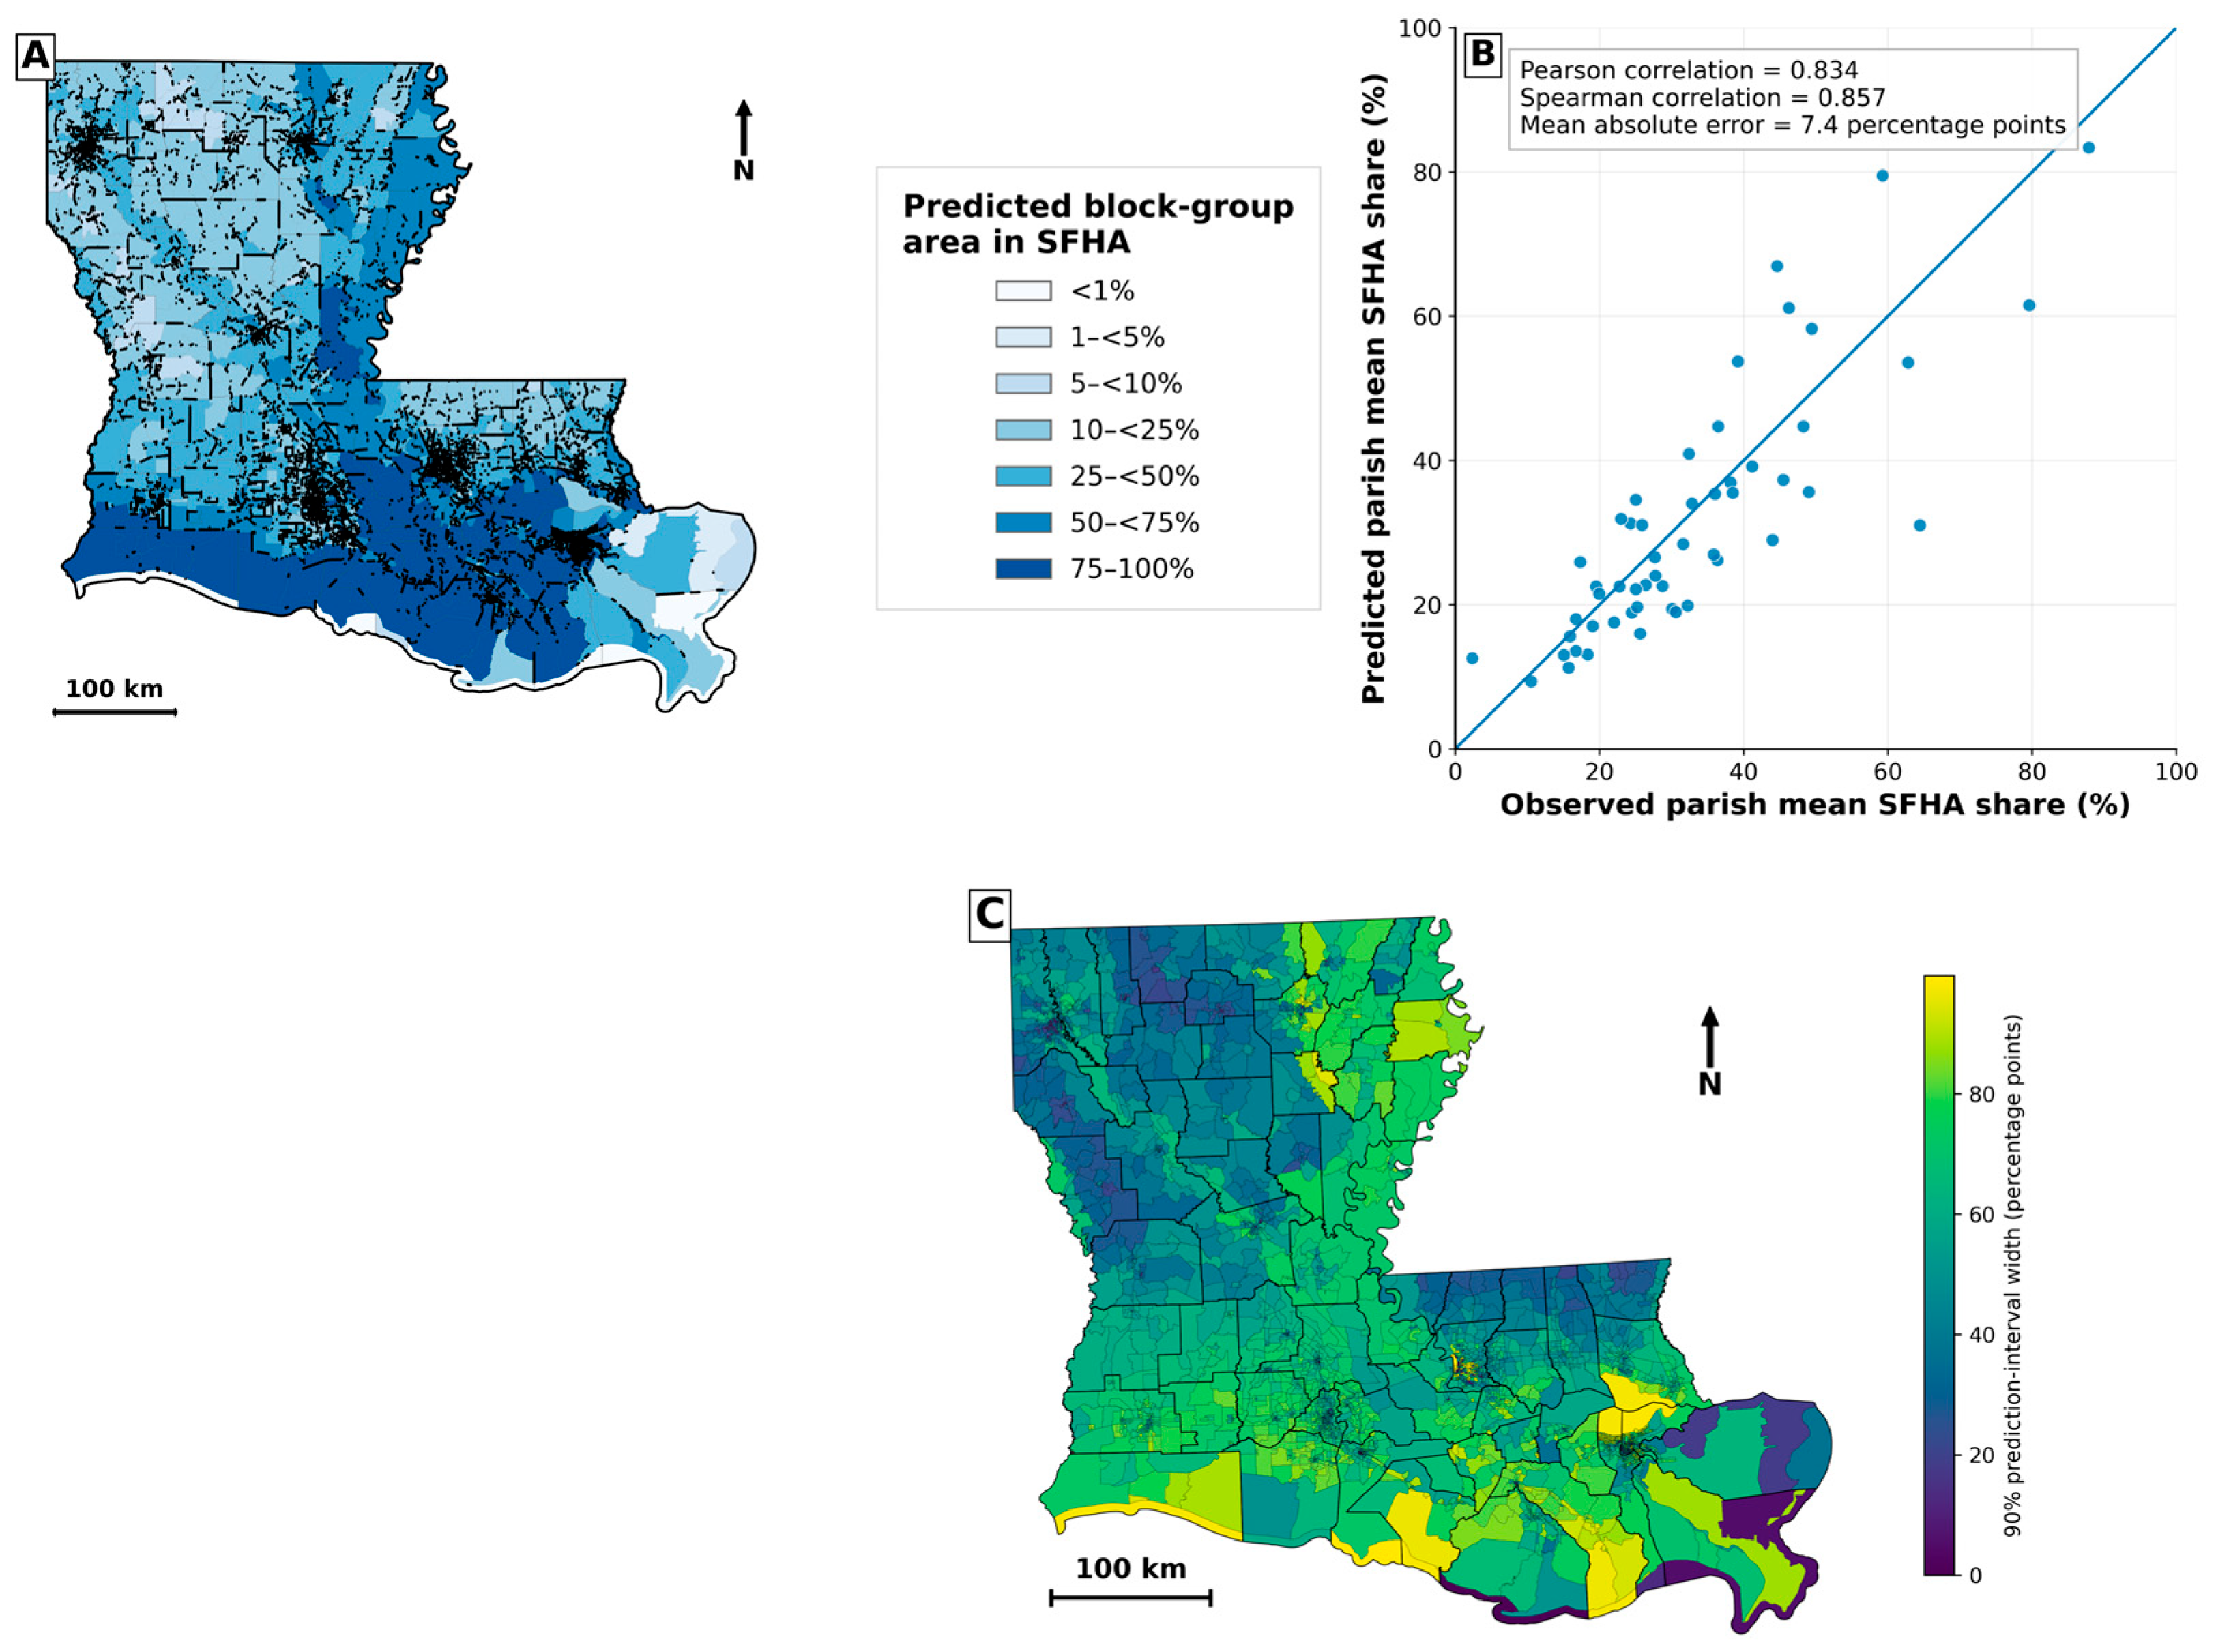
The calibrated framework generated a predicted median SFHA share for every census block group (
Figure 4A). The completed surface retained the broad geographic structure of the verified FEMA map in
Figure 3B while removing reference data gaps. Predicted shares were generally highest across coastal and southern Louisiana, including low-lying wetland and deltaic landscapes and major river corridors. Lower shares were more common in parts of northern and northwestern Louisiana, although local heterogeneity remained substantial.
The calibrated probability that SFHA share exceeded 10% was high across much of the state (
Figure S2). Predictive uncertainty also varied spatially, as shown by the width of the nominal 90% prediction interval (
Figure 4C). Narrower intervals indicate greater predictive precision, whereas wider intervals identify locations where the completed estimates should be interpreted more cautiously. For the 518 unresolved units, the mean probability was 0.797, the median probability was 0.900, and the mean predicted SFHA share was 33.3%. Their mean nominal 90% prediction interval width was 0.597, indicating an average uncertainty span of 59.7 percentage points in predicted SFHA share. Because these units lacked verified reference values, interval coverage could not be evaluated directly; therefore, the interval widths should be interpreted as model-estimated predictive uncertainty associated with spatial completion rather than validated coverage.
Practically, these results suggest that the completed estimates can identify unresolved areas warranting further mapping or hydraulic review, but the wide intervals caution against treating the model estimates as substitutes for verified FEMA delineations.
3.3. Spatially Blocked Predictive Performance
For the primary continuous SFHA-share target, the calibrated hurdle diffusion model achieved a mean absolute error of 0.172, a root mean squared error of 0.248, and a Spearman correlation of 0.634 under pooled strict outer-fold evaluation. Parish-level aggregation produced stronger agreement, with a Pearson correlation of 0.834, a Spearman correlation of 0.857, and a mean absolute error of approximately 7.4 percentage points (
Figure 4B). These results indicate that local prediction errors partly averaged out while the major regional gradients in SFHA coverage were preserved.
The nominal 90% prediction intervals achieved 80.4% empirical coverage with a mean width of 0.575. Benchmark results clarified this trade-off (
Table 2). The random forest distribution produced slightly lower point error but lower interval coverage, whereas quantile gradient boosting achieved coverage closest to 90% by producing wider intervals. Among the three models that generated complete sample-based predictive distributions, diffusion achieved the lowest Continuous Ranked Probability Score, the highest empirical 90% interval coverage, and the lowest interval score (
Table 2). Quantile gradient boosting, retained as a quantile-only benchmark, achieved coverage closest to the nominal 90% level and a slightly lower interval score but produced substantially wider intervals and did not generate a complete predictive distribution. Nevertheless, the diffusion model’s remaining undercoverage indicates that inner-fold uncertainty calibration did not transfer fully across all geographically separated outer folds.
A supplementary spatial cross-conformal sensitivity analysis substantially improved geographic transfer of interval calibration under the same strict outer-fold design (
Table S3). Empirical 90% coverage increased from 80.4% in the primary workflow to approximately 92% under the asymmetric cross-conformal formulations. For the asymmetric normalized formulation, lower- and upper-tail miss rates were 3.6% and 4.4%, respectively, indicating relatively balanced residual miscoverage. The mean interval width increased from 0.575 to 0.766, while the interval score improved from 0.922 to 0.856. The improved coverage was achieved primarily through wider prediction intervals, whereas point and distributional accuracy changed only modestly. Parish-level agreement also remained similar, indicating that the calibration adjustment primarily improved uncertainty reliability rather than materially altering the statewide prediction surface. The largest local median shifts occurred in southeastern coastal and deltaic census block groups (
Figure S4).
For the secondary 10% screening endpoint, diffusion achieved an area under the receiver operating characteristic curve of 0.852 and an area under the precision–recall curve of 0.923. The Brier score was 0.141, the log loss was 0.489 and the expected calibration error was 0.020 (
Table 2). At the validation-selected decision threshold, the F1 score was 0.861, sensitivity was 0.953, and specificity was 0.407. Diffusion achieved the highest precision–recall performance and sensitivity and the lowest expected calibration error among the evaluated models, whereas the random forest distribution achieved slightly stronger receiver operating characteristic discrimination and a relatively more balanced sensitivity–specificity profile (
Table 2).
This pattern is expected because tree-based ensemble models are highly optimized for structured tabular prediction and often perform strongly on deterministic discrimination and point-accuracy metrics. In contrast, the diffusion model was trained to generate a full conditional response distribution rather than to optimize a single classification or regression objective. Its advantage in this study therefore lies less in uniformly outperforming traditional machine learning models on point metrics and more in providing competitive prediction together with calibrated exceedance probabilities, prediction intervals, and distribution-level attribution. More extensive architecture tuning or feature conditioning may improve deterministic performance, but the present implementation was intentionally evaluated as a probabilistic distributional framework rather than as a point-prediction-only model.
Accordingly, the benchmark results support different use cases: conventional tree-based models remain appropriate when point prediction or direct quantile estimation is sufficient, whereas conditional diffusion is most relevant when a complete sample-based predictive distribution, calibrated exceedance probabilities, and distribution-level attribution are required.
3.4. Environmental Structure of the Predicted Surface
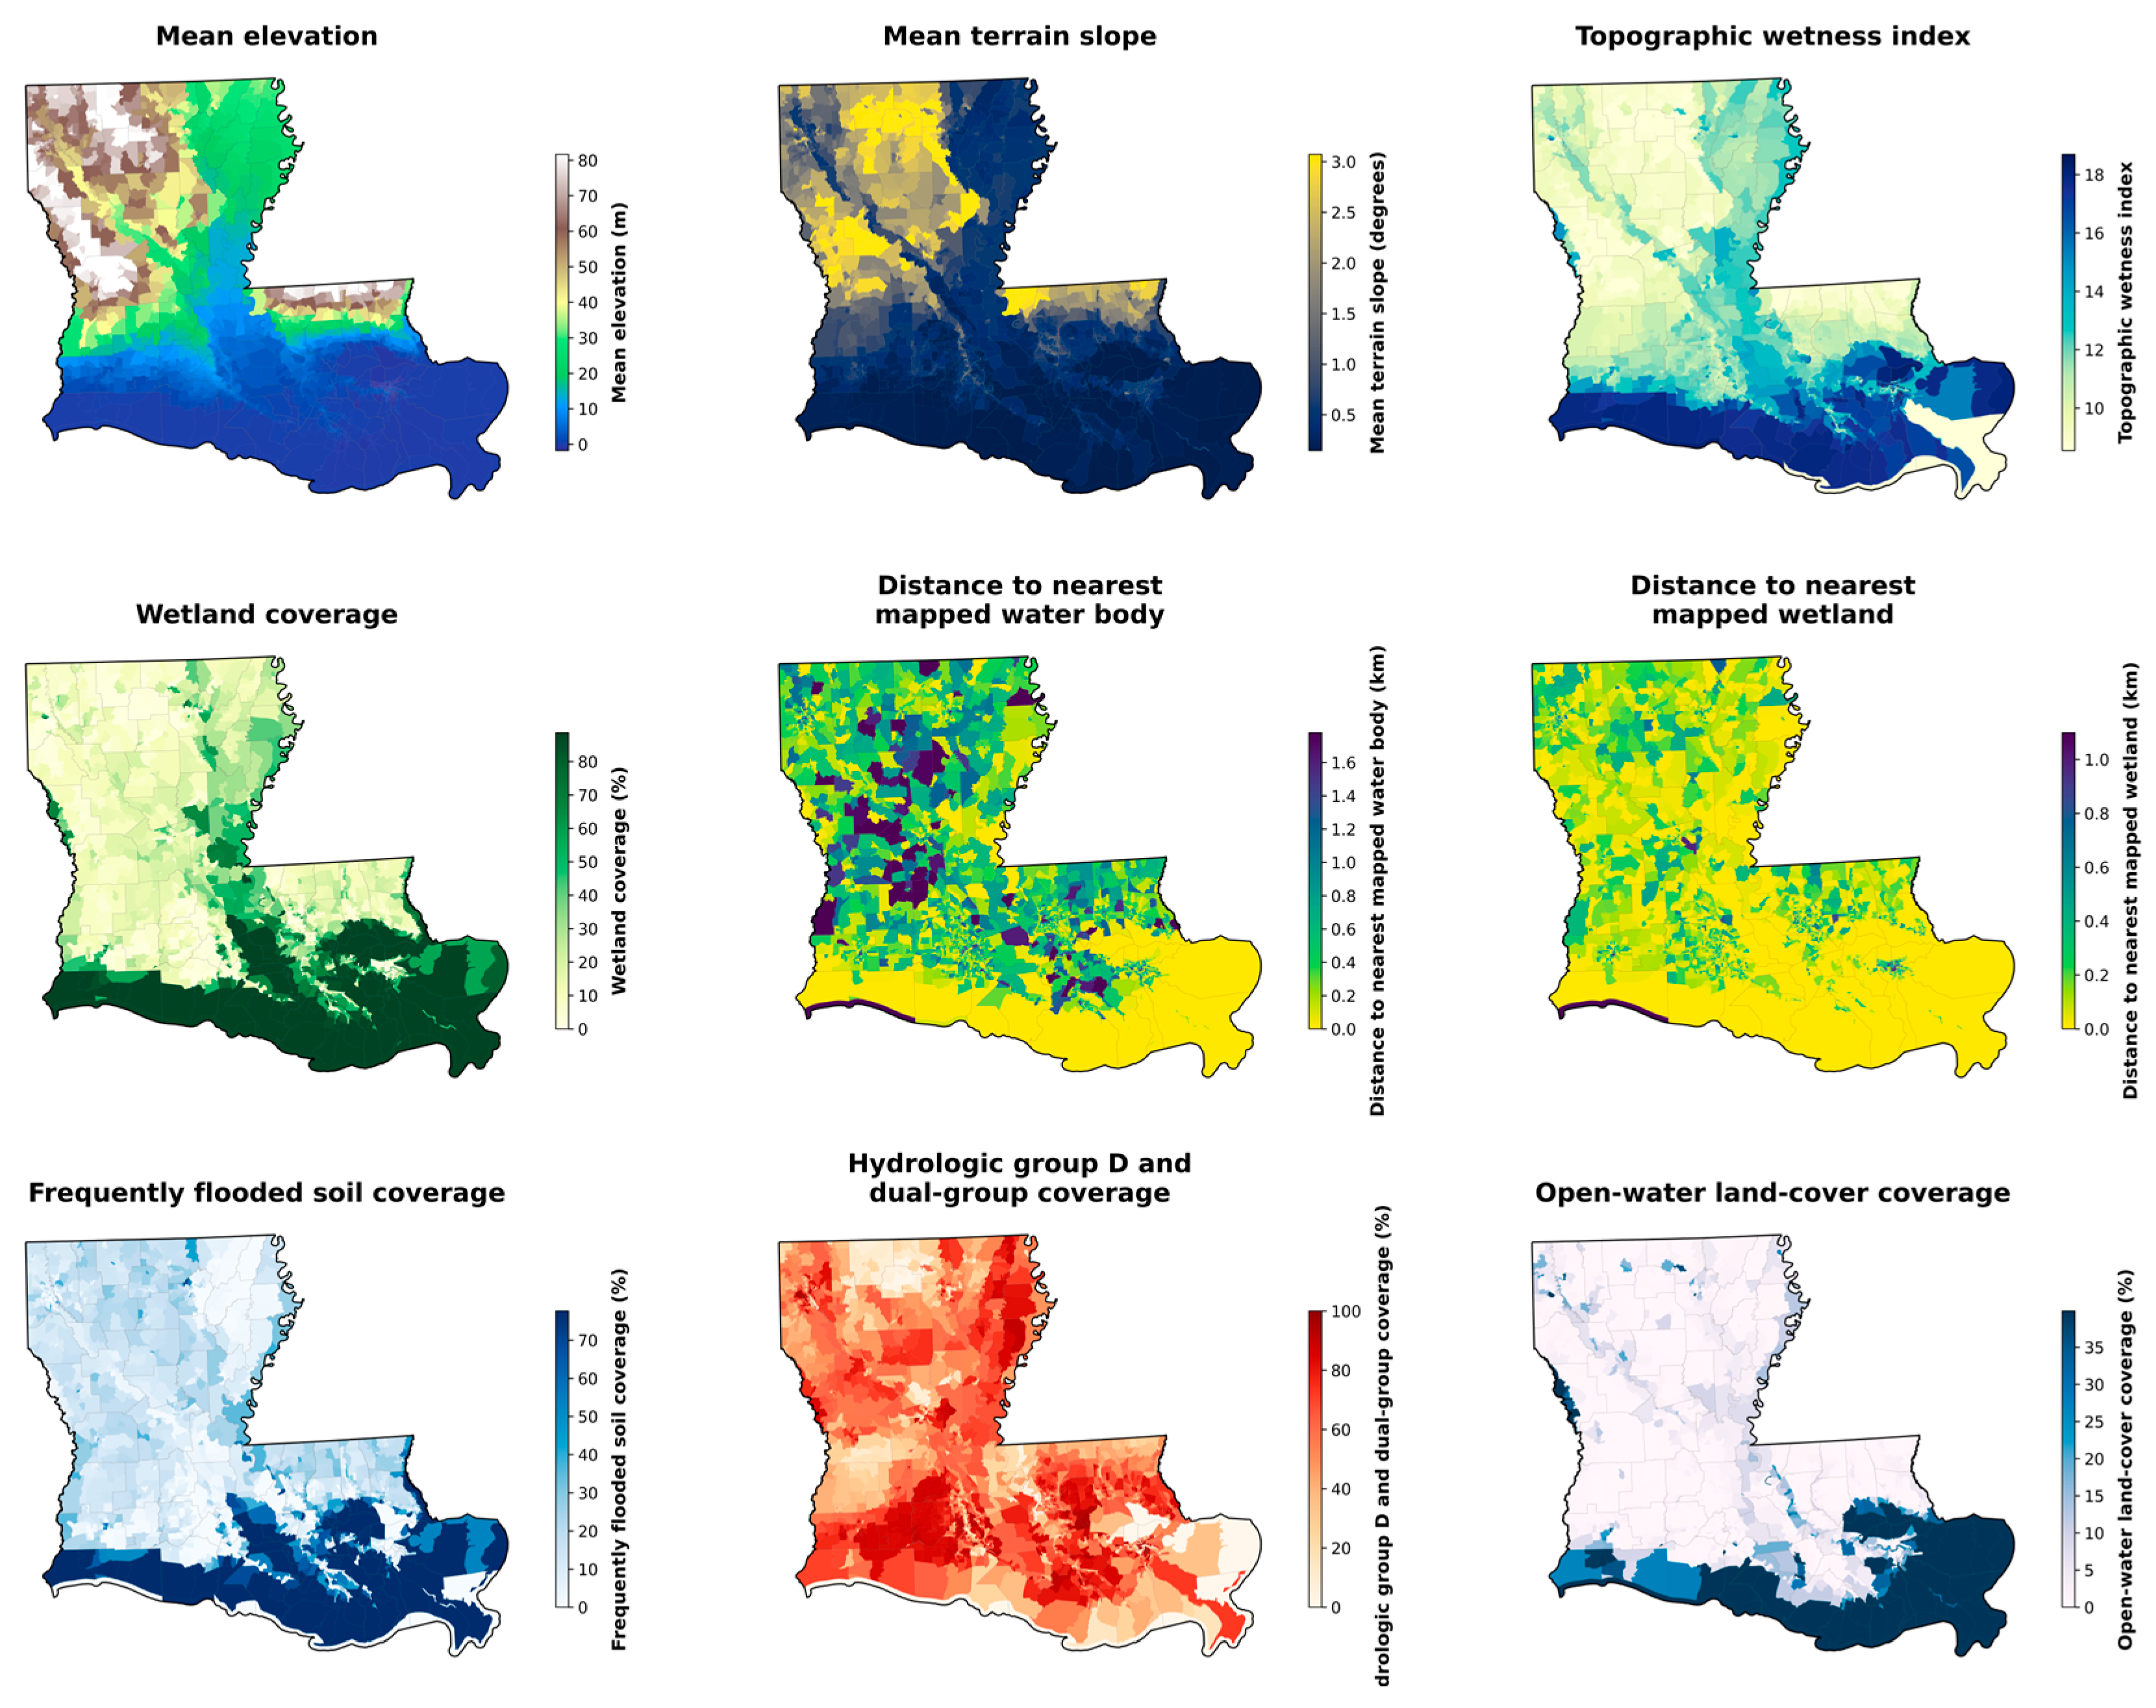
The mapped predictors showed distinct environmental gradients across Louisiana (
Figure 5). Elevation and terrain slope were generally lowest in coastal and southern Louisiana, where wetland, open-water, and frequently flooded soil coverage were also most prominent. High topographic wetness values occurred across several low-relief landscapes, particularly within coastal, riverine, and floodplain environments.
Distances to the nearest mapped wetland and water body were generally shortest in the coastal zone and other hydrographically connected areas (
Figure 5). Frequently flooded soils and open-water land cover showed similar southern concentrations. Hydrologic group D soils, which typically have slow infiltration and greater runoff potential when wet, together with dual groups such as A/D, B/D, and C/D, which behave differently depending on drainage conditions, were more spatially heterogeneous. High values therefore indicate areas where a larger share of soils may retain water or generate runoff more readily, but this pattern did not follow the same simple coastal gradient as elevation, wetlands, and frequently flooded soils.
Overall, the maps indicate that higher SFHA coverage is most consistently associated with low-elevation, wetland-rich, open-water, and flood-prone environments. This interpretation is supported by the bivariate correlations in
Table S1: wetland coverage showed the strongest association with SFHA share (Spearman ρ = 0.508), followed by frequently flooded soil coverage (ρ = 0.422), while hydrologic group D and dual-group coverage showed the weakest association (ρ = 0.028). These relationships are descriptive and do not establish independent or causal effects; distribution-level multivariable effects were evaluated separately using DREA.
3.5. Distributionally Trustworthy Explanation
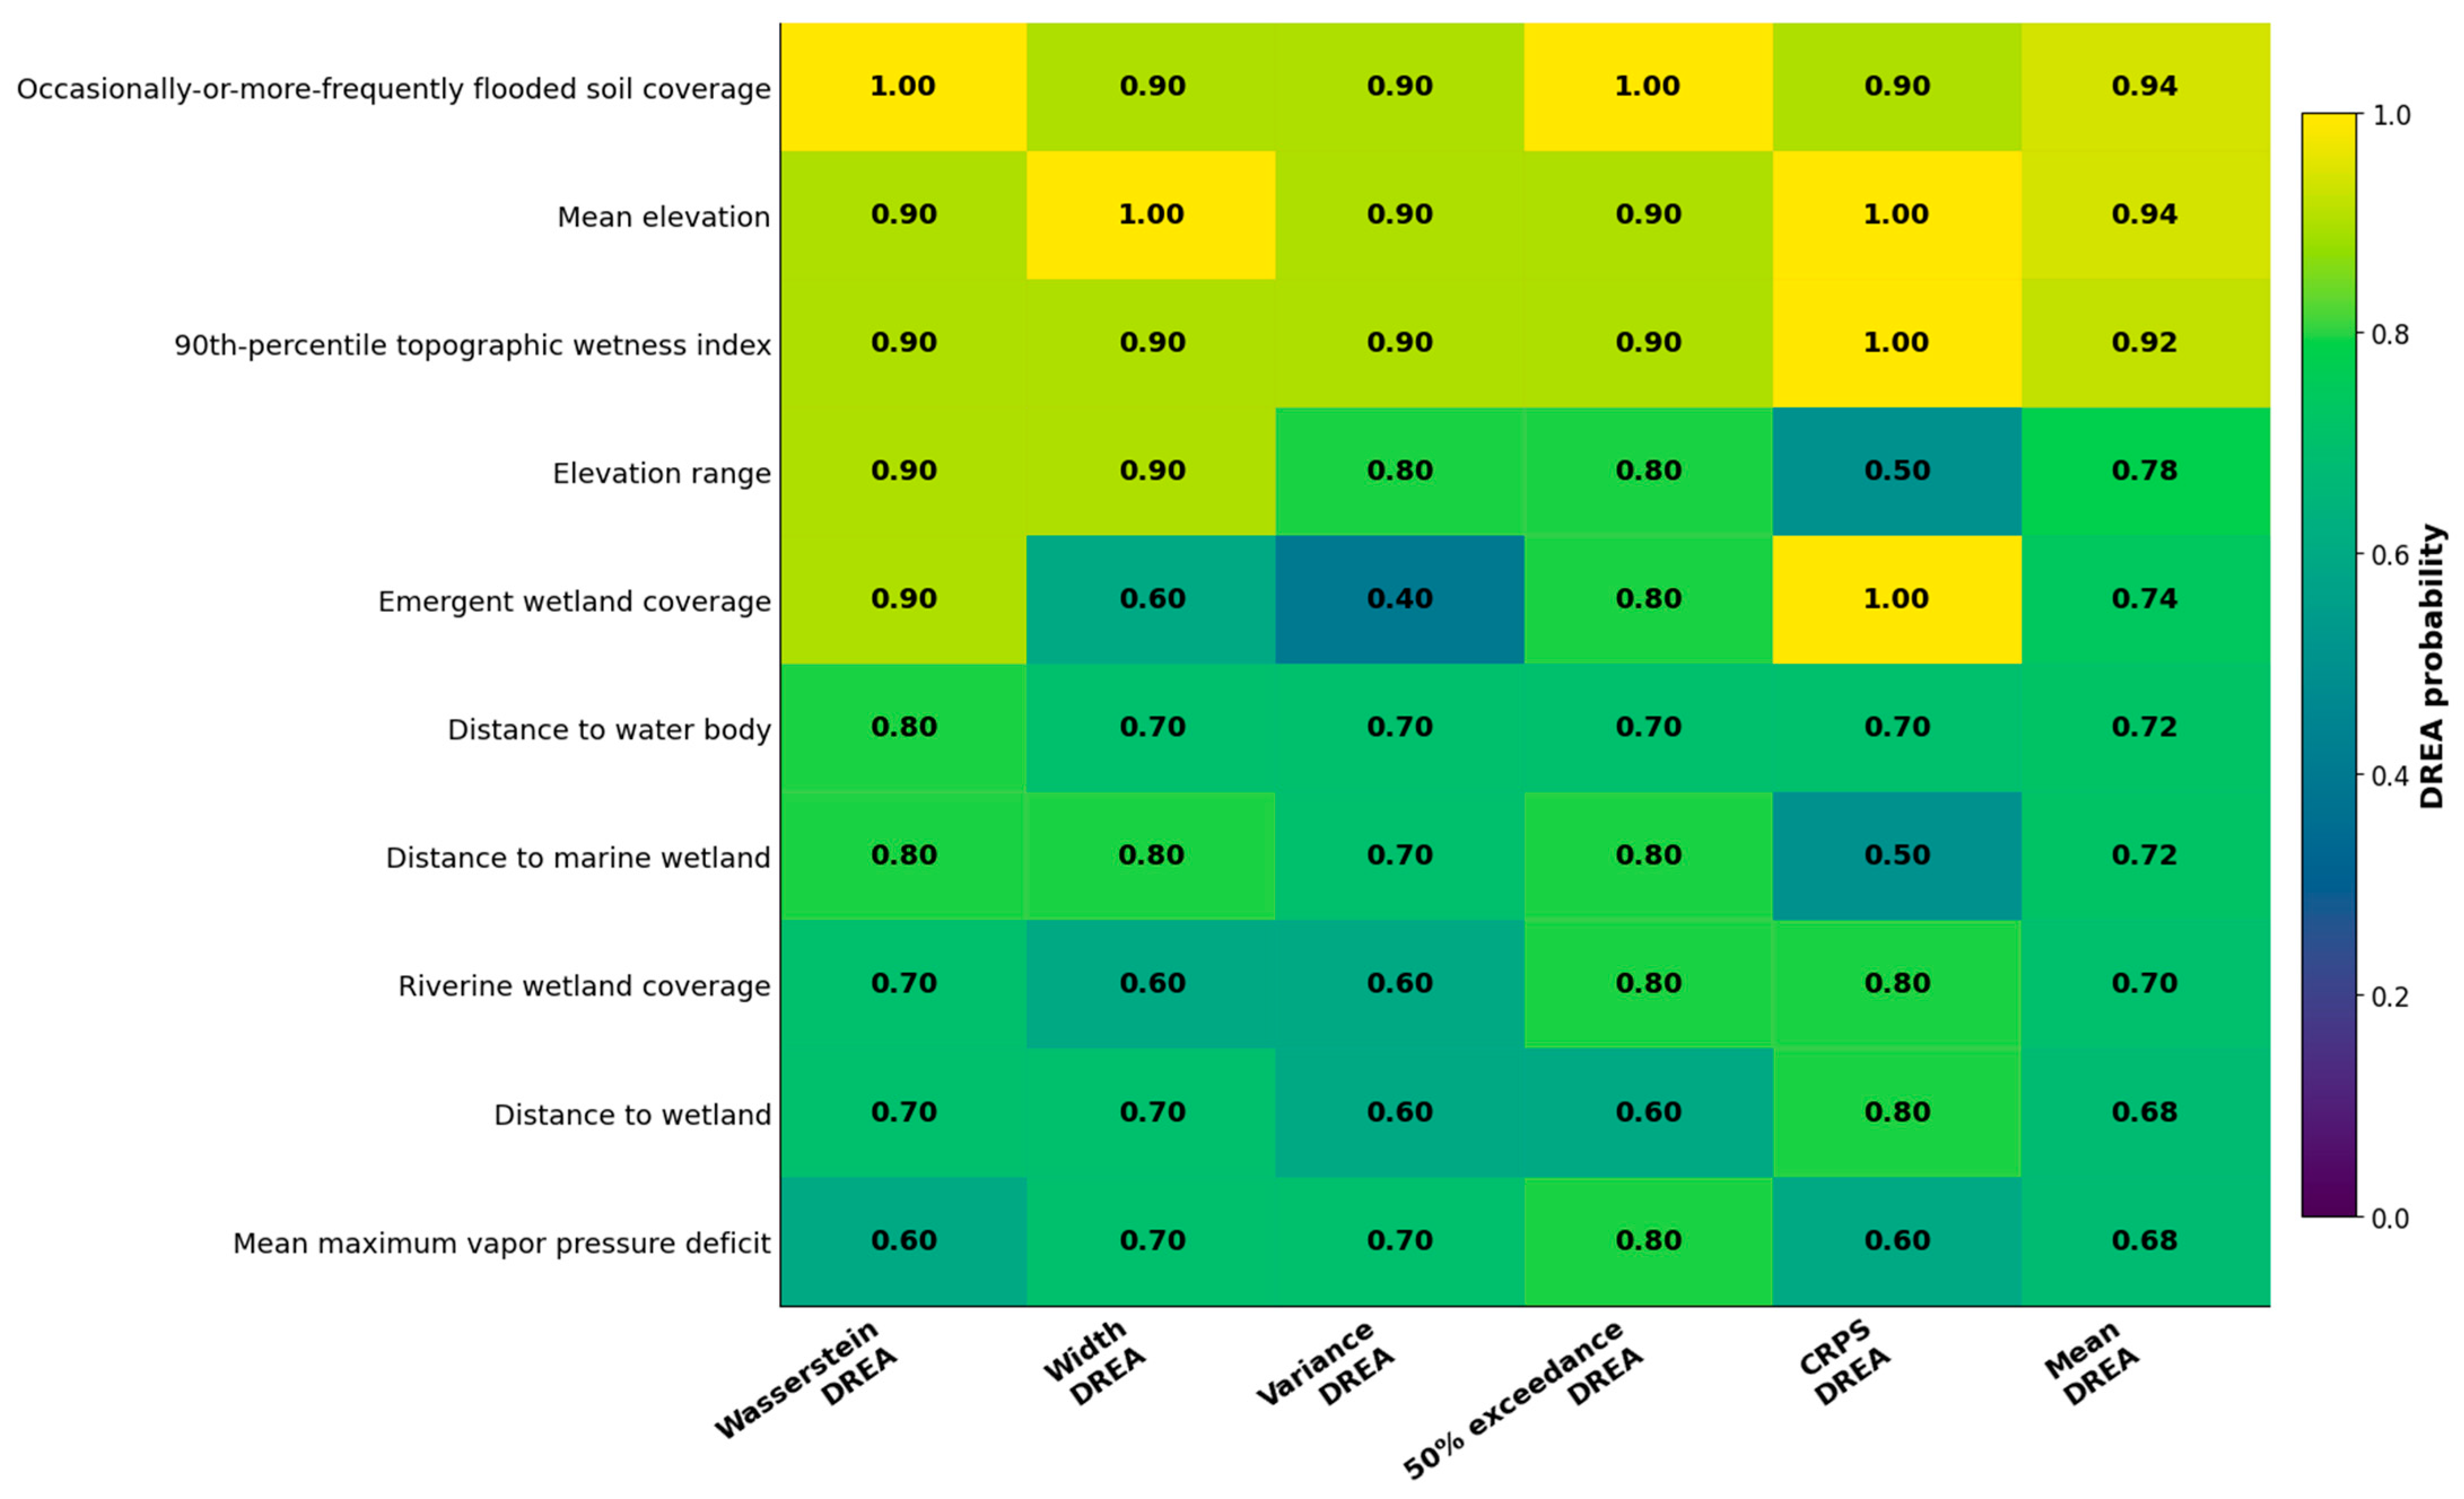
In the full holdout analysis, DREA identified a small group of predictors that consistently altered multiple properties of the predictive distribution across independently trained model realizations (
Figure 6). Occasionally-or-more-frequently flooded soil coverage and mean elevation had the highest exploratory mean component probabilities (0.94 each), followed by the 90th-percentile topographic wetness index (0.92). These predictors showed consistently high probabilities across multiple DREA components, although the distributional properties they influenced differed (
Figure 6).
Elevation range formed the next tier, with an exploratory mean component probability of 0.78, followed by emergent wetland coverage at 0.74. Distance to water bodies and distance to marine wetlands each had an exploratory mean of 0.72, followed by riverine wetland coverage at 0.70. Distance to wetlands and mean maximum vapor pressure deficit each had exploratory mean values of 0.68 (
Figure 6). In the 25% exceedance sensitivity, the 90th-percentile precipitation predictor remained among the ten most reliable predictors (
Figure S5), indicating that extreme precipitation retained distributional relevance under a lower substantial coverage threshold.
The component profiles showed that the leading predictors did not affect the model in identical ways. Occasionally-or-more-frequently flooded soil coverage produced the strongest Wasserstein and 50% exceedance responses, indicating consistent effects on both the overall predictive distribution and the probability of substantial SFHA coverage. Mean elevation showed the strongest interval-width response and, together with the 90th-percentile topographic wetness index and emergent wetland coverage, showed strong probabilistic skill responses. Emergent wetland coverage had relatively strong effects on substantial coverage probability and probabilistic skill but a weaker variance response, while hydrographic distance variables showed more moderate effects across several components.
Practically, these results indicate that long-term soil flooding, vertical position, terrain-mediated moisture accumulation, wetland context, and hydrographic proximity contribute to different aspects of modeled SFHA coverage and uncertainty rather than acting as interchangeable predictors. DREA therefore distinguishes whether an environmental predictor primarily shifts the predicted distribution, changes its uncertainty, or alters the probability of substantial SFHA coverage. Because several leading predictors are correlated, these attribution patterns should not be interpreted as independent effects; some may instead reflect shared environmental gradients linking terrain position, wetland conditions, soil flooding, and hydrographic proximity.
3.6. Population and Neighborhood Characteristics
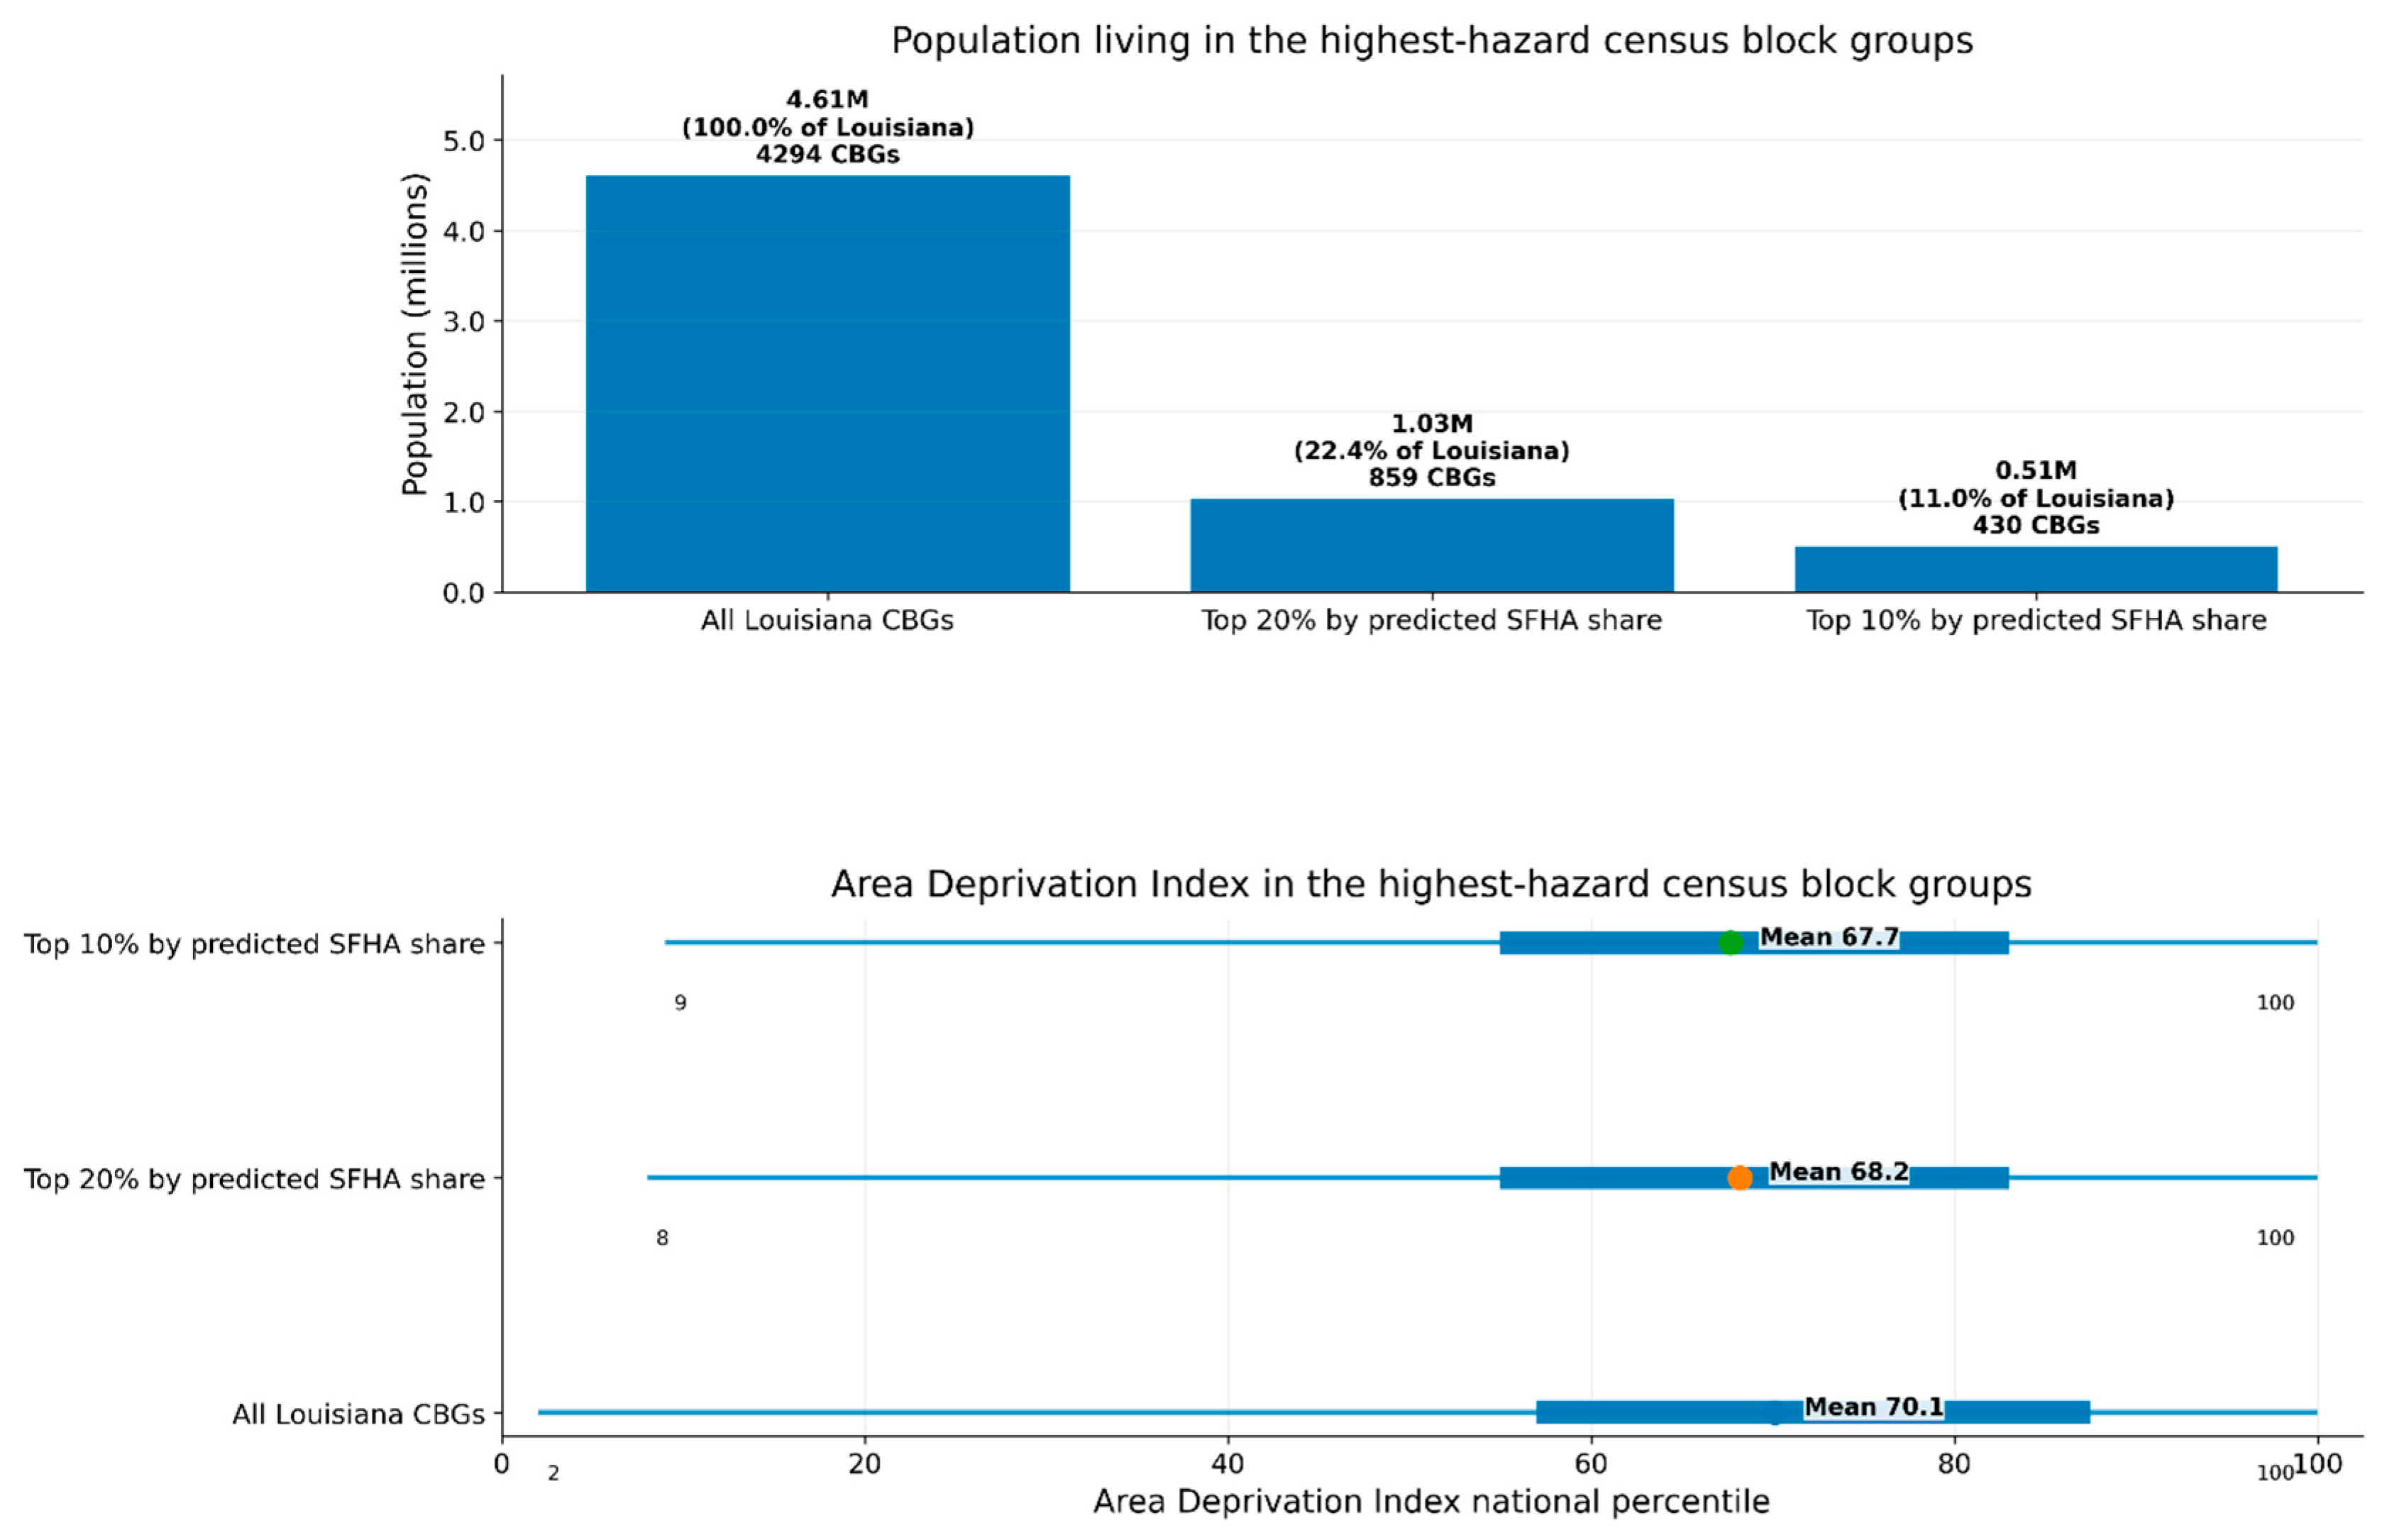
The top 20% of census block groups ranked by predicted median SFHA share contained 1,033,886 residents, representing 22.4% of Louisiana’s population across 859 units; the top 10% contained 509,078 residents, representing 11.0% across 430 units (
Figure 7). These totals identify residents living in high-share census block groups and do not imply that every resident is located within the predicted SFHA portion.
The mean national Area Deprivation Index percentile was 70.1 statewide, 68.2 in the top 20%, and 67.7 in the top 10%. The highest predicted-share groups therefore did not have a higher average composite deprivation score than the state overall, although each group included census block groups at the most deprived national percentile (
Figure 7).
The ACS overlay revealed more specific socioeconomic differences (
Figure S3). From the statewide group to the top 20% and top 10% groups, minority population share increased from 45.1% to 48.0% and 49.4%; unemployment increased from 6.9% to 7.3% and 8.0%; the share of children younger than 18 increased from 22.2% to 26.0% and 26.4%; lack of high school completion increased from 13.9% to 15.5% and 16.4%; and lack of internet access increased from 11.9% to 12.1% and 12.7%. Average household income declined from approximately USD 68,100 statewide to USD 58,800 and USD 54,600. Together, these patterns indicate that census block groups with the highest predicted SFHA shares contain notable concentrations of several socially and economically vulnerable populations, despite their slightly lower mean composite Area Deprivation Index scores.
4. Discussion
4.1. Main Findings and Contribution
This study develops and evaluates a leakage-safe probabilistic framework for spatial completion of FEMA-derived SFHA coverage. Using Louisiana as a demonstration case, the framework combined strict spatial out-of-fold evaluation, a calibrated hurdle diffusion model, explicit separation of verified and unresolved reference units, and uncertainty-aware statewide completion. The model reproduced the dominant statewide gradients in SFHA share and showed strong parish-level agreement, although it did not outperform every benchmark on every metric, and its primary nominal 90% intervals remained moderately undercovered. A supplementary spatial cross-conformal sensitivity showed that nominal coverage could be restored under the same strict outer spatial evaluation, although this required wider intervals and modest trade-offs in point and distributional accuracy (
Table S3).
The principal contribution is therefore methodological rather than the production of a replacement flood map. The study provides a reproducible approach for generating complete spatial screening layers without treating unresolved observations as zeros, leaking target information into the predictors, or presenting model outputs as verified regulatory delineations. It also applies Distributional Reliability Explanation Attribution to SFHA coverage spatial completion, extending interpretation beyond point-prediction importance to identify predictors that consistently influence the location, spread, variance, 50% exceedance probability, and probabilistic skill of the predicted SFHA-share distribution. The statewide predictions, predictor data and metadata, census-block-group geometries, model evaluation outputs, and analysis code are publicly archived, allowing the completed predictions and analytical workflow to be independently examined and reproduced.
The 518 unresolved census block groups illustrate the practical value and limitations of this framework. Their mean calibrated probability of at least 10% SFHA coverage was 0.797, and their mean predicted SFHA share was 0.333. Treating these units as zero or excluding them from statewide analyses could therefore underrepresent potentially substantial mapped hazard. However, their mean 90% prediction interval width was 0.597, equivalent to 59.7 percentage points, indicating considerable uncertainty. The completed values should consequently be used as screening information for prioritizing map review, data collection, or hydraulic investigation, rather than as substitutes for verified FEMA delineations or regulatory determinations.
4.2. Relationship to Flood Susceptibility and Exposure Research
The environmental structure of the predictions is consistent with established flood susceptibility research. Elevation, slope, topographic wetness, precipitation, land cover, drainage, soil properties, and proximity to water are recurrent predictors across geographic settings [
14,
39,
40]. The present analysis differs by targeting the continuous proportion of a census block group mapped within the regulatory SFHA rather than an inventory of historical flood points, damage observations, or event-specific inundation. Consequently, the model should be interpreted as learning the spatial structure of FEMA-mapped coverage.
The strict spatial design also distinguishes this study from results obtained with random partitions. Random cross-validation can place environmentally similar neighboring units in both training and testing data and may therefore overstate geographic generalization [
10,
11]. The AUROC of 0.852 and AUPRC of 0.923 should be interpreted considering this more demanding transfer question, not compared mechanically with metrics from studies that use different outcomes, spatial scales, class balances, or resampling schemes.
Parish-level agreement was stronger than census-block-group agreement, suggesting that the model preserved broad regional gradients while some local transitions remained unresolved. Part of this scale dependence may reflect census-block-group aggregation: hydrological processes operate at finer spatial scales, and block-group summaries can smooth localized elevation differences, drainage pathways, wetland boundaries, and floodplain transitions. The completed surface is therefore more defensible for statewide or regional screening and prioritization than for resolving site- or parcel-scale flood characteristics.
4.3. Comparison with Benchmark Models
The benchmark comparison showed that no single model dominated all evaluation criteria. Tree-based models remained highly competitive for point prediction, while quantile gradient boosting achieved coverage closest to the nominal level through wider intervals. Among the models that generated complete sample-based predictive distributions, diffusion achieved the lowest Continuous Ranked Probability Score and interval score; for the 10% screening endpoint, it also achieved the highest area under the precision–recall curve and sensitivity and the lowest expected calibration error. The value of diffusion in this study therefore lies in its combination of competitive prediction, complete conditional distributions, calibrated exceedance probabilities, and direct compatibility with DREA rather than universal superiority in deterministic accuracy, consistent with prior tabular diffusion research [
20,
41].
Methodologically, the present framework also occupies a different role from process-based hydrologic or hydraulic models and conventional data-driven flood susceptibility models. Process-based models simulate physical processes such as rainfall–runoff, flow routing, water levels, and inundation under specified conditions and are therefore suited to event-specific analysis, engineering design, and detailed flood delineation. Conventional machine learning susceptibility models instead learn statistical relationships between environmental predictors and mapped outcomes and can provide computationally efficient classification, susceptibility, or point-prediction outputs. The present hurdle diffusion framework remains data-driven but differs by explicitly separating zero from positive SFHA coverage and representing positive SFHA share through a sampleable conditional distribution. Its practical role is therefore uncertainty-aware screening and spatial completion of unresolved FEMA-mapped SFHA coverage at the census-block-group scale, rather than simulation of flood mechanics or replacement of site-specific hydraulic analysis and regulatory mapping.
These additional distributional capabilities come with greater computational cost than the conventional tree-based benchmarks. Unlike tree-based models that can make predictions through comparatively direct forward evaluation, diffusion requires iterative reverse-denoising and repeated stochastic sampling. In the present implementation, each predictive trajectory used 80 reverse-diffusion steps, with 100 trajectories generated for each of 10 independently trained model realizations per outer fold. This additional computation was required to characterize the full predictive distribution and model-to-model variability rather than only a point estimate. At the census-block-group scale used here (4294 units), this computational burden remained practical for statewide analysis, but it would increase substantially for much finer spatial units or larger geographic domains. Future large-scale implementations could therefore benefit from batched or parallel inference, accelerated diffusion sampling, or fewer sampling trajectories where adequate probabilistic accuracy can be retained. The trade-off demonstrated here is consequently not lower computational cost or uniformly better deterministic accuracy but richer uncertainty quantification, calibration, and distribution-level explanation.
The calibration sensitivity further showed that the primary weakness was specific to geographic transfer of nominal interval coverage. Under the same strict outer-fold design, pooling leakage-safe calibration predictions across all non-test spatial folds increased empirical 90% coverage from 80.4% to approximately 92%, whereas relaxing the spatial exclusion buffers increased coverage only to approximately 83%. This indicates that a single inner calibration fold did not fully represent the spatial heterogeneity in Louisiana’s coastal, riverine, wetland, and inland environments. The broader cross-fold calibration improved interval reliability but produced wider intervals and modest increases in mean absolute error, root mean squared error, and Continuous Ranked Probability Score; nevertheless, the interval score improved, indicating a better overall balance between coverage and sharpness.
The original calibration workflow was retained as the primary analysis because it was specified within the initial nested spatial evaluation design and yielded the originally observed outer-fold performance. Replacing it retrospectively after observing outer-fold undercoverage would make the choice of the reported primary calibration strategy partly dependent on test-set behavior. The spatial cross-conformal formulations are therefore reported as leakage-safe sensitivity analyses showing that geographic interval calibration can be substantially improved by pooling calibration information across non-test spatial folds, although at the cost of wider intervals.
4.4. Distributional Explanation and Physical Plausibility
Prior flood modeling studies have largely relied on explanation methods that rank predictors for point predictions or selected summary outcomes [
42,
43,
44]. Such approaches do not distinguish whether a predictor primarily shifts the center of the prediction, changes uncertainty, alters exceedance probabilities, or affects probabilistic skill, and their rankings can be unstable across resamples or model realizations [
45]. DREA [
22] addresses this limitation by evaluating the reliability of predictor-induced changes across multiple properties of the predictive distribution. In this study, it therefore enabled separate assessment of distributional displacement, interval width, variance, the probability of at least 50% SFHA coverage, and Continuous Ranked Probability Score reliability.
Predictor correlation should nevertheless be considered when interpreting these attribution profiles. The synthetic benchmark underlying DREA showed lower reliability for a correlated proxy than for the corresponding true data-generating predictor [
22], indicating some ability to reduce attribution to redundant proxy information. However, this does not eliminate multicollinearity effects. In the present application, correlated terrain, wetland, soil, climatic, and hydrographic predictors may represent shared environmental gradients; consequently, DREA values are interpreted as reliable predictive attributions rather than independent or causal effects.
Notably, the primary interval undercoverage pertains to the absolute geographic calibration of nominal 90% intervals, whereas DREA evaluates the consistency of perturbation-induced changes in distributional properties across independently trained model realizations.
The resulting attribution profile was physically coherent and provided information that a single importance ranking would have obscured. Occasionally-or-more-frequently flooded soil coverage and mean elevation had the highest mean component probabilities, followed by the 90th-percentile topographic wetness index. Flooded soil coverage led the Wasserstein and 50% exceedance components, indicating consistent effects on both the full predicted distribution and the probability of substantial SFHA coverage. Mean elevation showed the strongest interval-width response and, together with topographic wetness, achieved the highest Continuous Ranked Probability Score reliability. Emergent wetland coverage showed relatively strong 50% exceedance and probabilistic-skill responses but a weaker variance response, while distances to water bodies and wetlands produced more moderate effects across several components. These differences demonstrate that predictors can influence the location, spread, exceedance probability, and accuracy of the predicted SFHA-share distribution in distinct ways.
Also, these findings are consistent with the broader flood susceptibility literature in emphasizing terrain position, wetness, soil flooding, and hydrographic proximity [
7,
8,
9], but they place less emphasis on slope and precipitation under the primary 50% exceedance DREA setting. Precipitation reappeared in the 25% exceedance sensitivity, suggesting that its distributional relevance depends on the substantial coverage threshold considered.
4.5. Population and Equity Implications
More than one million residents lived in the top 20% of the census block groups ranked by predicted SFHA share. Because these units contained 22.4% of Louisiana’s population, high predicted SFHA coverage was not confined to sparsely populated areas. The mean Area Deprivation Index percentile was slightly lower in the upper predicted-share groups than statewide, but this composite measure concealed important vulnerability dimensions: lower household income, higher unemployment, lower educational attainment, less internet access, and larger minority and child population shares were more common in the highest predicted-share groups. This distinction is important for planning because composite indices may obscure specific social and economic conditions that can shape access to warnings, evacuation resources, insurance, and post-flood recovery support [
46,
47,
48].
4.6. Limitations and Future Research
The modeled target is the proportion of each census block group represented within the FEMA-mapped SFHA. The framework therefore predicts the spatial structure of FEMA mapping rather than direct physical flood risk or observed flood occurrence. The completed values should be interpreted as uncertainty-aware estimates of FEMA-mapped SFHA coverage for unresolved units, not as new regulatory delineations or estimates of flood depth, annual flood probability, historical inundation frequency, expected loss, or climate-adjusted future hazard. Consequently, the predictions inherit the definitions, map ages, engineering assumptions, and spatial inconsistencies of the FEMA reference layer. The 518 unresolved census block groups lacked independent targets for direct validation; although spatial transfer among verified units supports cautious completion, future FEMA updates will be necessary for prospective validation. Some unresolved areas may also contain predictor combinations poorly represented in the training domain, particularly where subsidence, wetland loss, levees, engineered drainage, or rapid coastal change are important, motivating stronger domain-shift diagnostics. Census-block-group aggregation may conceal important within-unit terrain and drainage transitions, while the predictor products differed in date, resolution, and update cycle. The present framework is spatial rather than temporal and therefore does not represent event-to-event or seasonal flood dynamics. Future extensions could integrate multi-temporal synthetic aperture radar (SAR) and optical imagery with time-varying precipitation products to support dynamic flood assessment and complement the static FEMA-derived SFHA coverage framework.
Finer-scale analyses and improved temporal alignment of land cover, wetland extent, shoreline position, precipitation, and FEMA study dates would strengthen future applications. The 10% threshold was used as an analytical screening endpoint to reduce the influence of very small boundary intersections; alternative thresholds would change the derived binary classification and exceedance probability summaries but not the primary continuous SFHA-share predictions or distributional attribution analysis. Finally, the benchmark suite was designed to compare several distinct probabilistic representations rather than exhaustively evaluate modern probabilistic neural network architectures. Future work could extend the same spatial validation framework to deep ensembles, Bayesian neural networks, and related probabilistic deep learning methods to determine whether comparable or improved uncertainty representation can be achieved under different computational and modeling trade-offs.