1. Introduction
Typhoon-induced heavy rain causes severe meteorological disasters such as urban flooding, landslides, and mudflows every year. It is of great significance to improve the capability of quantitative estimation of typhoon precipitation using weather radars. Polarimetric radar variables, including horizontal reflectivity factor (
ZH), differential reflectivity (
ZDR), specific differential phase shift (
KDP), and co-polar correlation coefficient (
ρhv), have been widely utilized in quantitative precipitation estimation (QPE) for decades. Establishing polarimetric rainfall estimators for typhoons involves a good knowledge of the characteristics of typhoon raindrop size distribution (DSD) [
1]. Moreover, a raindrop shape model and an oscillation model are crucial for connecting radar variables to DSD, which further impacts the accuracy of QPE as well as DSD retrieval [
2,
3].
Conventionally, a raindrop is approximated as an oblate spheroid, with its shape characterized by the ratio of its minor-axis length (
b) to its major-axis length (
a), referred to as the axis ratio (
ar). The relations between the raindrop axis ratio and equivolume diameter
, hereafter referred to as drop-shape relations (DSRs), have been investigated through theoretical analysis, tunnel experiments, and observations [
4,
5,
6,
7,
8,
9]. For example, a linear DSR
, with equivolume diameter (D) in mm, has been given by [
5]. A fourth-order polynomial DSR has been derived by [
7] and is widely utilized in QPE and DSD retrieval [
10,
11]. There are also studies about DSRs of typhoon precipitation.
Typhoon-specific DSRs have been investigated using 2-dimensional video disdrometer (2DVD) observations. For example, Chang et al. [
12] derived a DSR from typhoon precipitation in the western North Pacific, and Wen et al. [
13] obtained a typhoon DSR based on 2DVD observations of landfalling typhoons in East and South China. Both relations indicate more spherical raindrops than the commonly used Brandes et al. [
7] relation. However, these DSRs were derived from near-surface 2DVD measurements, whereas polarimetric radar QPE is generally based on elevated sampling volumes. Under typhoon conditions, low-level wind, turbulence, drop oscillation, and sampling-height differences may cause the effective drop shape relevant to radar measurements to differ from that inferred from surface disdrometer observations. Therefore, the transferability of the Chang et al. [
12] and Wen et al. [
13] DSRs to typhoon polarimetric radar QPE needs to be evaluated.
A useful way to address this issue is to exploit the self-consistency among polarimetric radar variables. Because
ZH,
ZDR, and
KDP are jointly controlled by the DSD and raindrop shape [
14], their inter-relationships contain information on the effective drop shape sampled by the radar volume. This approach is based entirely on radar observations without relying on surface measurements and therefore provides a radar-consistent constraint on the effective drop shape sampled by the radar volume. Based on this principle, previous studies proposed an effective linear DSR, commonly expressed as
, in which the parameter
controls the mean raindrop oblateness and can be estimated from radar measurements of
ZH,
ZDR, and
KDP [
2,
15,
16]. This effective
β algorithm has been applied to QPE and DSD retrieval in mid-latitude and tropical precipitation systems [
2,
15,
17], but its use for evaluating typhoon DSRs and typhoon radar QPE remains limited. It therefore provides a physically consistent framework for examining whether surface 2DVD-derived typhoon DSRs can be transferred to elevated radar-volume QPE.
In this study, we derive radar-constrained effective DSRs for six landfalling typhoon cases observed with the Guangzhou S-POL radar and use them to evaluate two surface 2DVD-derived typhoon DSRs. Rather than retrieving
locally from individual
ZH-
ZDR-
KDP samples, as in previous applications of the effective
β concept [
2,
15,
17], this study estimates a representative typhoon
through multi-sample radar self-consistency optimization to improve robustness. We further quantify how different DSR assumptions affect simulated polarimetric variables, rainfall-estimator coefficients, and gauge-validated radar QPE. In addition to the six Guangzhou cases used for DSR estimation and evaluation, Typhoon Lekima 2019, observed by the Wenzhou S-POL radar in East China, is employed as an independent case to examine the regional transferability of the derived rainfall relations.
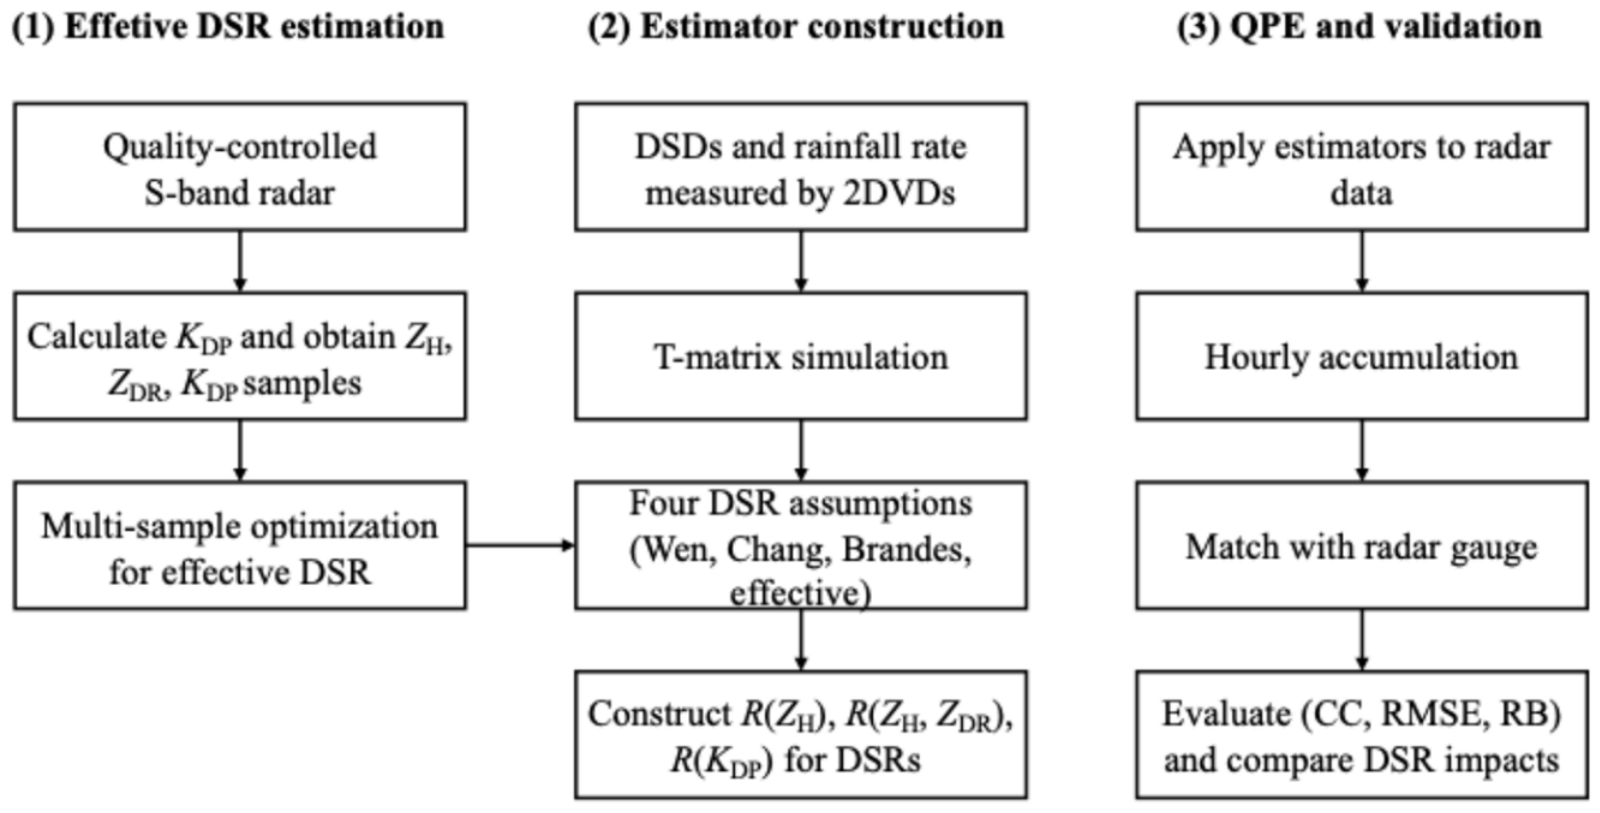
Section 2 describes the radar, 2DVD, and rain-gauge datasets and the methodology used for
KDP retrieval, DSR estimation, rainfall-estimator construction, and QPE validation.
Section 3 first compares the surface 2DVD-derived and radar-constrained DSRs and then examines their impacts on polarimetric-variable simulations, rainfall estimators, and typhoon QPE performance. Discussion and conclusions are presented in
Section 4 and
Section 5, respectively.
3. Results
3.1. Comparison of Prescribed and Surface 2DVD-Derived DSRs
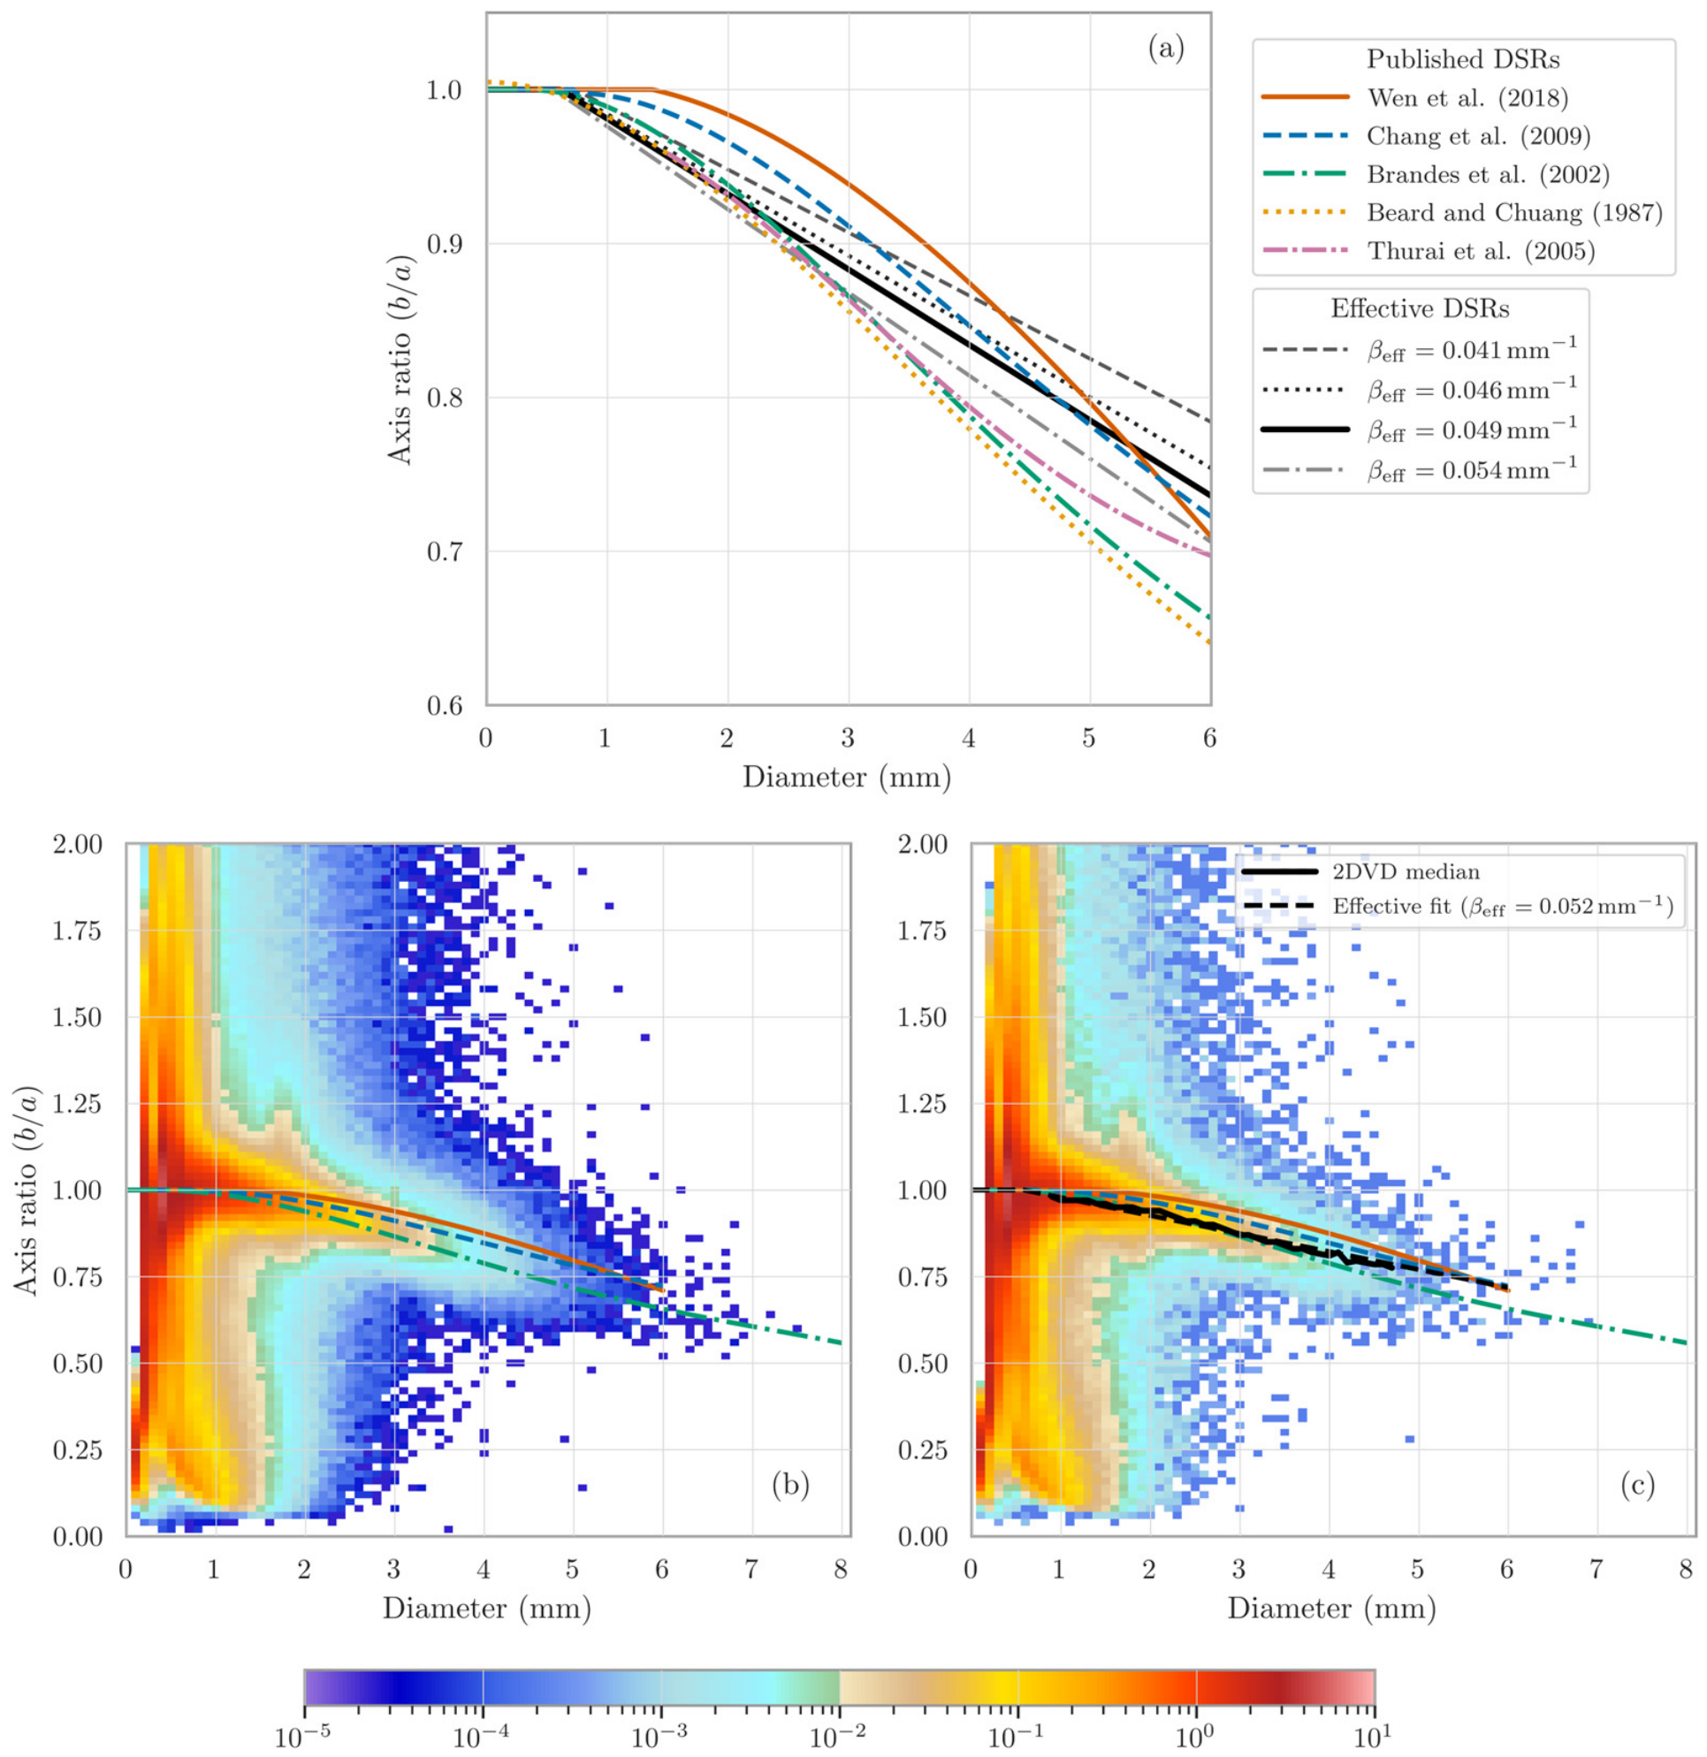
Figure 2a compares the DSRs considered in this study together with several commonly used theoretical or observational relations. The Brandes et al. relation (
arBrandes) lies close to several established relations, such as BC1987 [
9] and Thurai2005 [
27], over much of the 1–5 mm diameter range. In contrast, the surface 2DVD-derived typhoon relations of Wen et al. (
arWen) and Chang et al. (
arChang) indicate systematically larger axis ratios, with
arWen representing the most spherical drops over most of the sampled diameter range. The cyan and black radar-constrained ranges in
Figure 2a are analyzed in
Section 3.2.
Figure 2.
Comparison of published and radar-constrained effective drop-shape relations (DSRs) with 2DVD observations. (
a) Published DSRs from Wen et al. [
13], Chang et al. [
12], Brandes et al. [
7], Beard and Chuang [
9], and Thurai et al. [
27], among others, together with radar-constrained effective linear DSRs. (
b) Joint frequency distribution of raindrop axis ratio and equivolume diameter from non-typhoon 2DVD observations collected between March and September 2017, with the typhoon periods excluded. (
c) Corresponding distribution for the selected non-typhoon event listed in
Table 1. In (
c), the thick black curve denotes the median 2DVD axis ratio in each diameter bin, and the black dashed curve denotes the radar-constrained effective DSR with
. The color shading in (
b,
c) indicates the joint frequency on a logarithmic scale.
Figure 2.
Comparison of published and radar-constrained effective drop-shape relations (DSRs) with 2DVD observations. (
a) Published DSRs from Wen et al. [
13], Chang et al. [
12], Brandes et al. [
7], Beard and Chuang [
9], and Thurai et al. [
27], among others, together with radar-constrained effective linear DSRs. (
b) Joint frequency distribution of raindrop axis ratio and equivolume diameter from non-typhoon 2DVD observations collected between March and September 2017, with the typhoon periods excluded. (
c) Corresponding distribution for the selected non-typhoon event listed in
Table 1. In (
c), the thick black curve denotes the median 2DVD axis ratio in each diameter bin, and the black dashed curve denotes the radar-constrained effective DSR with
. The color shading in (
b,
c) indicates the joint frequency on a logarithmic scale.
Table 1.
Selected observation periods, event-level radar-constrained estimates, and numbers of valid hourly radar–gauge pairs for the six typhoon events and one non-typhoon event analyzed in this study.
Table 1.
Selected observation periods, event-level radar-constrained estimates, and numbers of valid hourly radar–gauge pairs for the six typhoon events and one non-typhoon event analyzed in this study.
| Number | Name | Selected Period (UTC) | βeff (mm−1) | Valid Hourly Radar–Gauge Pairs |
|---|
| 1604 | Nida | 1 August 06:00–2 August 20:00, 2016 | 0.049 | 9967 |
| 1702 | Merbok | 12 June 06:00–12 June 23:00, 2017 | 0.048 | 3037 |
| 1707 | Roke | 22 July 18:00–23 July 11:00, 2017 | 0.046 | 3634 |
| 1713 | Hato | 22 August 12:00–24 August 00:00, 2017 | 0.049 | 9592 |
| 1714 | Pakhar | 26 August 06:00–28 August 00:00, 2017 | 0.048 | 12,815 |
| 1716 | Mawar | 3 September 20:00–4 September 06:00, 2017 | 0.049 | 3837 |
| n/a | Non-Typhoon | 6 May 16:00–8 May 18:00, 2017 | 0.052 | n/a |
The non-typhoon 2DVD observations provide an observational reference for these prescribed relations. In the joint frequency distribution for March–September 2017, with typhoon periods excluded (
Figure 2b),
arBrandes follows the high-frequency ridge of the axis-ratio distribution particularly well for diameters of approximately 1–4 mm. The axis-ratio measurements show greater scatter for drops smaller than 1 mm, while drops larger than approximately 5 mm occur infrequently. Thus,
arBrandes provides a reasonable baseline for the non-typhoon rainfall sampled in South China, although it should not be interpreted as a universally valid DSR.
The systematic separation of arWen and arChang from arBrandes demonstrates that the surface-derived typhoon relations imply substantially more spherical drops than the commonly used reference relation. Note that the raindrop shape indicated by the arWen is generally more spherical than that indicated by the arChang. These contrasts motivate the subsequent tests of whether the surface 2DVD-derived typhoon DSRs are consistent with elevated radar-volume observations and radar QPE.
3.2. Radar-Constrained Effective DSRs
Because the method for estimating
is based on polarimetric self-consistency rather than precipitation-type-specific empirical tuning, we first performed a case-based consistency check using the selected non-typhoon event. The event extended from 16:00 UTC on 6 May to 18:00 UTC on 8 May 2017 (
Table 1). It can be noted that the 2DVD axis-ratio distribution for this event (
Figure 2c) is consistent with the longer non-typhoon sample (March to September) in
Figure 2b. For diameters of approximately 1–4 mm, the median observed axis ratio is close to
arBrandes, while drops of 4–5 mm are slightly more spherical. The radar-constrained effective DSR for this event, with
= 0.052 mm
−1, also follows the median 2DVD relation closely (
Figure 2c). This agreement provides a basic qualitative consistency check on the processing and quality-control framework.
We next investigate the transferability of surface 2DVD-derived typhoon DSRs to radar-volume observations. Specifically, the typhoon DSRs proposed by Wen et al. (
arWen) and Chang et al. (
arChang) are compared with the radar-constrained effective DSRs derived from Guangzhou S-POL observations for the typhoon cases listed in
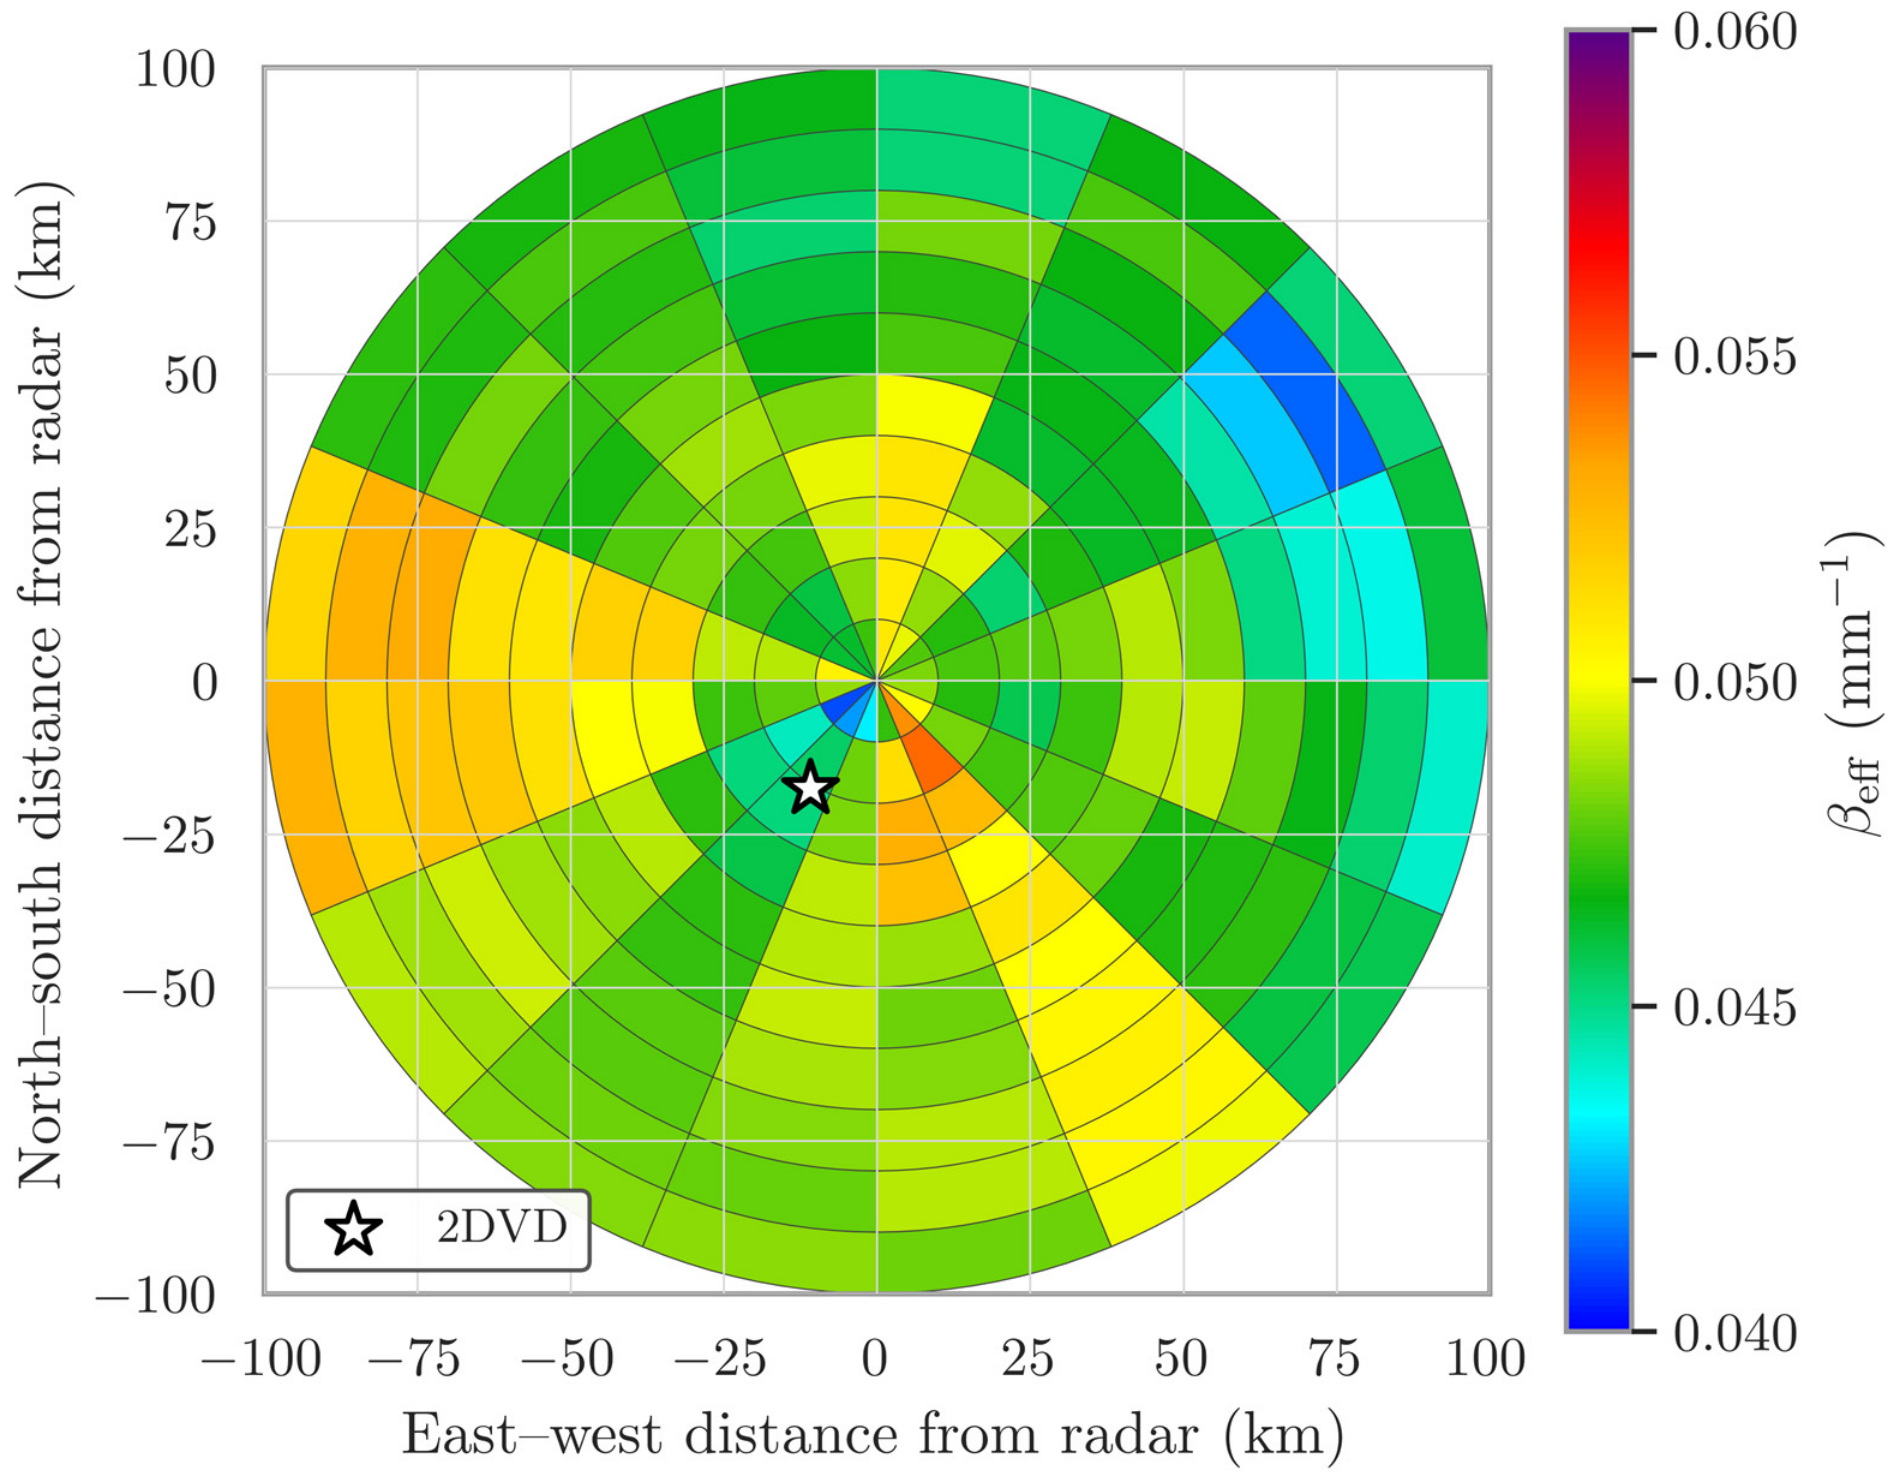
Table 1. First, the regions around the radar site are divided every 22.5° azimuthally and 10 km radially, as shown by the black solid lines in
Figure 3. The mean
βeff value in each sub-region is calculated from the measurements of
ZH,
ZDR, and
KDP within this sub-region in all six selected cases. It can be found that the mean
βeff values in different sub-regions show modest spatial variability, with the minimum, maximum, and median values being about 0.041, 0.054, and 0.048 mm
−1, respectively. The spatial variability in the mean
βeff values reflects variability in the radar-constrained effective relation and may arise from a combination of drop-shape variability, canting and oscillation, DSD weighting, precipitation heterogeneity, and residual measurement uncertainty [
16]. The radar-constrained effective DSRs corresponding to the spatially derived
βeff range of 0.041–0.054 mm
−1 are compared with
arWen, arChang, and
arBrandes in
Figure 2a. The lower and upper bounds of this range were obtained from the spatial subregions shown in
Figure 3 and are represented by the cyan dashed and solid curves, respectively. The radar-constrained effective DSRs generally indicate greater effective oblateness than
arWen and
arChang. Even the relation corresponding to the minimum
βeff of 0.041 mm
−1 indicates greater effective oblateness than
arWen for
and than
arChang for
. The black dashed and solid curves in
Figure 2a denote the minimum and maximum event-level
βeff values of 0.046 and 0.049 mm
−1, respectively, derived from the six typhoon cases. These ranges are shown to illustrate the spatial and event-to-event variability of the radar-constrained effective DSR rather than to define additional prescribed drop-shape models. In addition, the analysis is based on the radar scans at a 1.5-degree elevation, in which the regions closer to the radar site have lower altitudes. Because the analysis is based on a fixed 1.5° elevation scan, the radar beam samples progressively higher altitudes with increasing range. However, beam height covaries with range, azimuth, and precipitation structure; therefore,
Figure 3 represents a range-dependent spatial comparison rather than a true vertical profile. Consequently, the absence of a monotonic range dependence should not be interpreted as evidence that
is vertically invariant.
Then, to show the case dependence of typhoon raindrop shape, a mean
βeff value is estimated for each typhoon case (
Table 1). To mitigate the potential impact of ground clutter and ice particles, only the data with altitudes between 1 km and 3.5 km are used. Generally, the estimated mean
βeff values are stable across different cases and are generally within the range of 0.046 to 0.049 mm
−1. The lowest
βeff estimate (0.046 mm
−1) corresponds to the typhoon case (Roke 2017), which has a short observation period. Two typhoon cases (Merbok 2017 and Pakhar 2017) have
βeff estimates of 0.048 mm
−1, while three typhoon cases (Nida 2016, Hato 2017, and Mawar 2017) have
βeff estimates of 0.049 mm
−1.
Combining all quality-controlled samples from the six typhoons yielded mm−1, which is reported as 0.049 mm−1 after rounding to three decimal places. The leave-one-typhoon-out estimates ranged from 0.048353 to 0.048661 mm−1, corresponding to relative changes of only to from the full-sample estimate. Thus, excluding any individual event had only a minor influence on the representative , indicating that the derived effective DSR was not dominated by a single typhoon. The representative value used in the subsequent analyses, therefore, remains 0.049 mm−1, as derived from the complete six-event dataset.
According to
Table 1 and the combined estimate (0.049 mm
−1), even though the linear DSRs estimated from the polarimetric measurements show slight diversity in different typhoons (0.046~0.049 mm
−1), all represent greater effective oblateness than the
arWen and the
arChang. An exception exists when the raindrop sizes are large (
), but the raindrop concentrations are mostly very low, according to the 2DVD observations [
12,
13]. On the other hand, the determined linear DSRs are closer to the
arBrandes when raindrop sizes are not large (
).
In contrast to the results for the non-typhoon case, the typhoon DSRs derived from the 2DVDs and those derived from the measurements of Guangzhou S-POL show large diversity, as illustrated above. Thus, their applicability to radar-volume QPE should be further evaluated. Since QPE is an important application of polarimetric radars, the impacts of DSRs on radar variables and QPE, as well as the applicability of the DSRs on typhoon QPE, are shown in the next section.
3.3. Impacts on Simulation of Polarimetric Variables
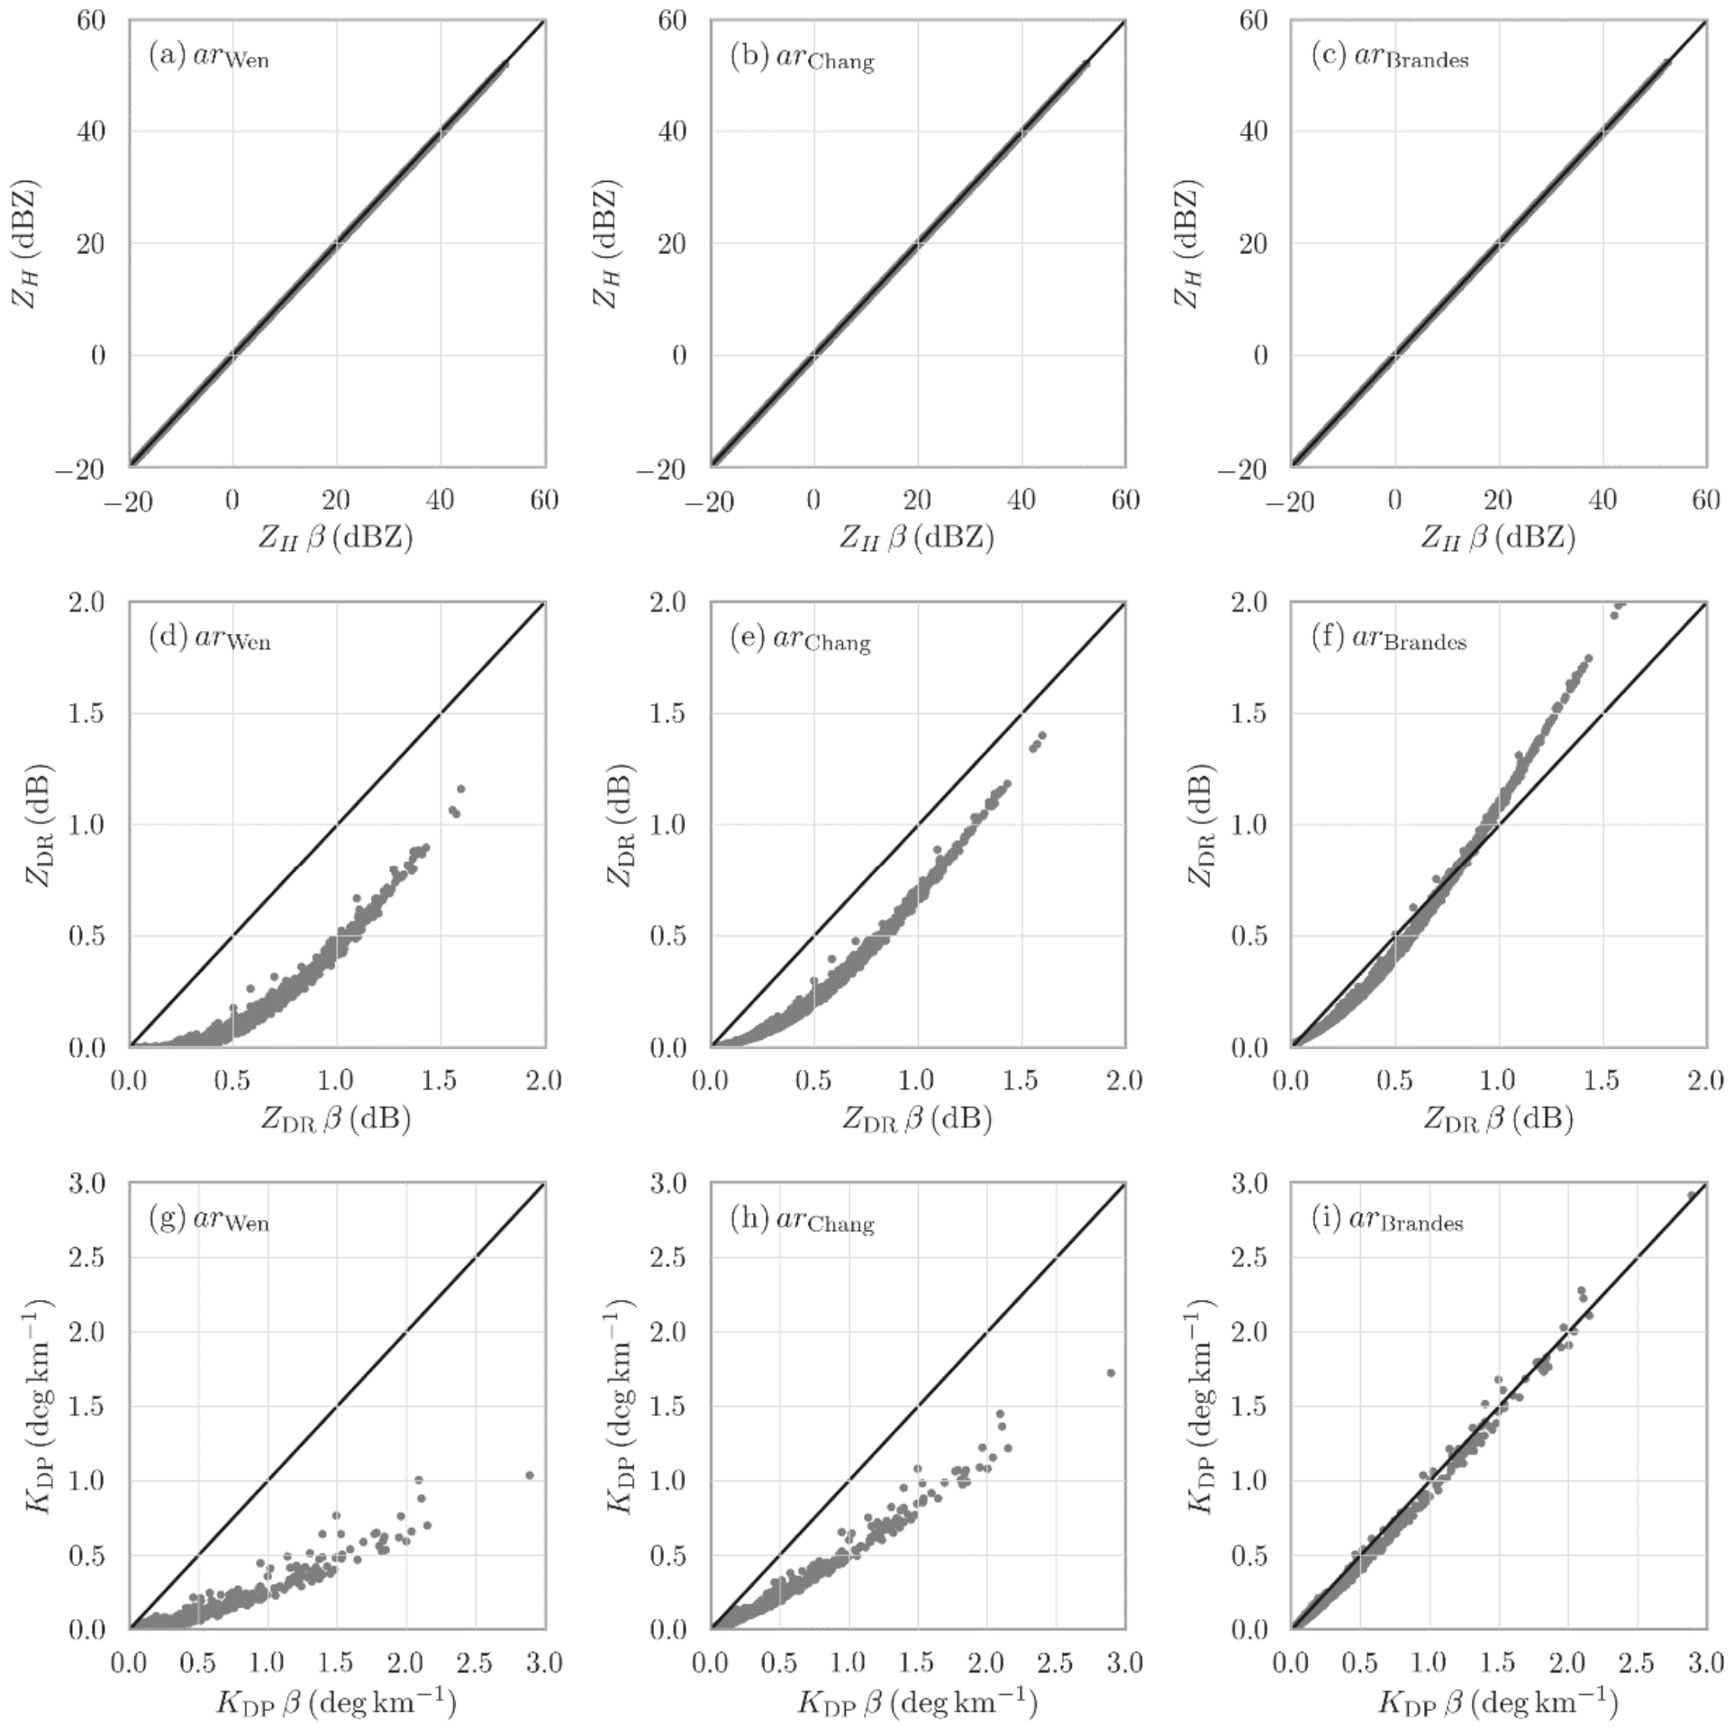
To isolate the effect of drop shape,
ZH,
ZDR, and
KDP were simulated from the typhoon DSD dataset under four DSR assumptions:
arWen,
arChang,
arBrandes, and the radar-constrained effective DSR with
βeff = 0.049 mm
−1. The radar-constrained effective DSR is used as the reference in
Figure 4. For
ZH, the simulations based on
arWen,
arChang, and
arBrandes are all close to the one-to-one line (
Figure 4a–c), indicating that S-band reflectivity is only weakly affected by DSR choice. This weak sensitivity is expected because
ZH is mainly controlled by drop size and concentration. In contrast, the
ZDR comparisons show clear DSR dependence (
Figure 4d–f). The more spherical
arWen relation produces much lower
ZDR than the radar-constrained effective DSR, especially when
ZDR is large (
Figure 4d). The
arChang relation shows the same tendency but with a smaller reduction (
Figure 4e), whereas
arBrandes remains much closer to the radar-constrained effective DSR over most of the
ZDR range (
Figure 4f).
The
KDP simulations show an even stronger sensitivity to the assumed DSR. Compared with the radar-constrained effective DSR,
arWen substantially reduces
KDP throughout the sampled range (
Figure 4g), and
arChang also produces lower
KDP, although the discrepancy is smaller than that for
arWen (
Figure 4h). By contrast, the
KDP values simulated with
arBrandes are distributed close to the one-to-one line (
Figure 4i), suggesting that
arBrandes is more consistent with the radar-constrained effective DSR than the two surface 2DVD-derived typhoon DSRs.
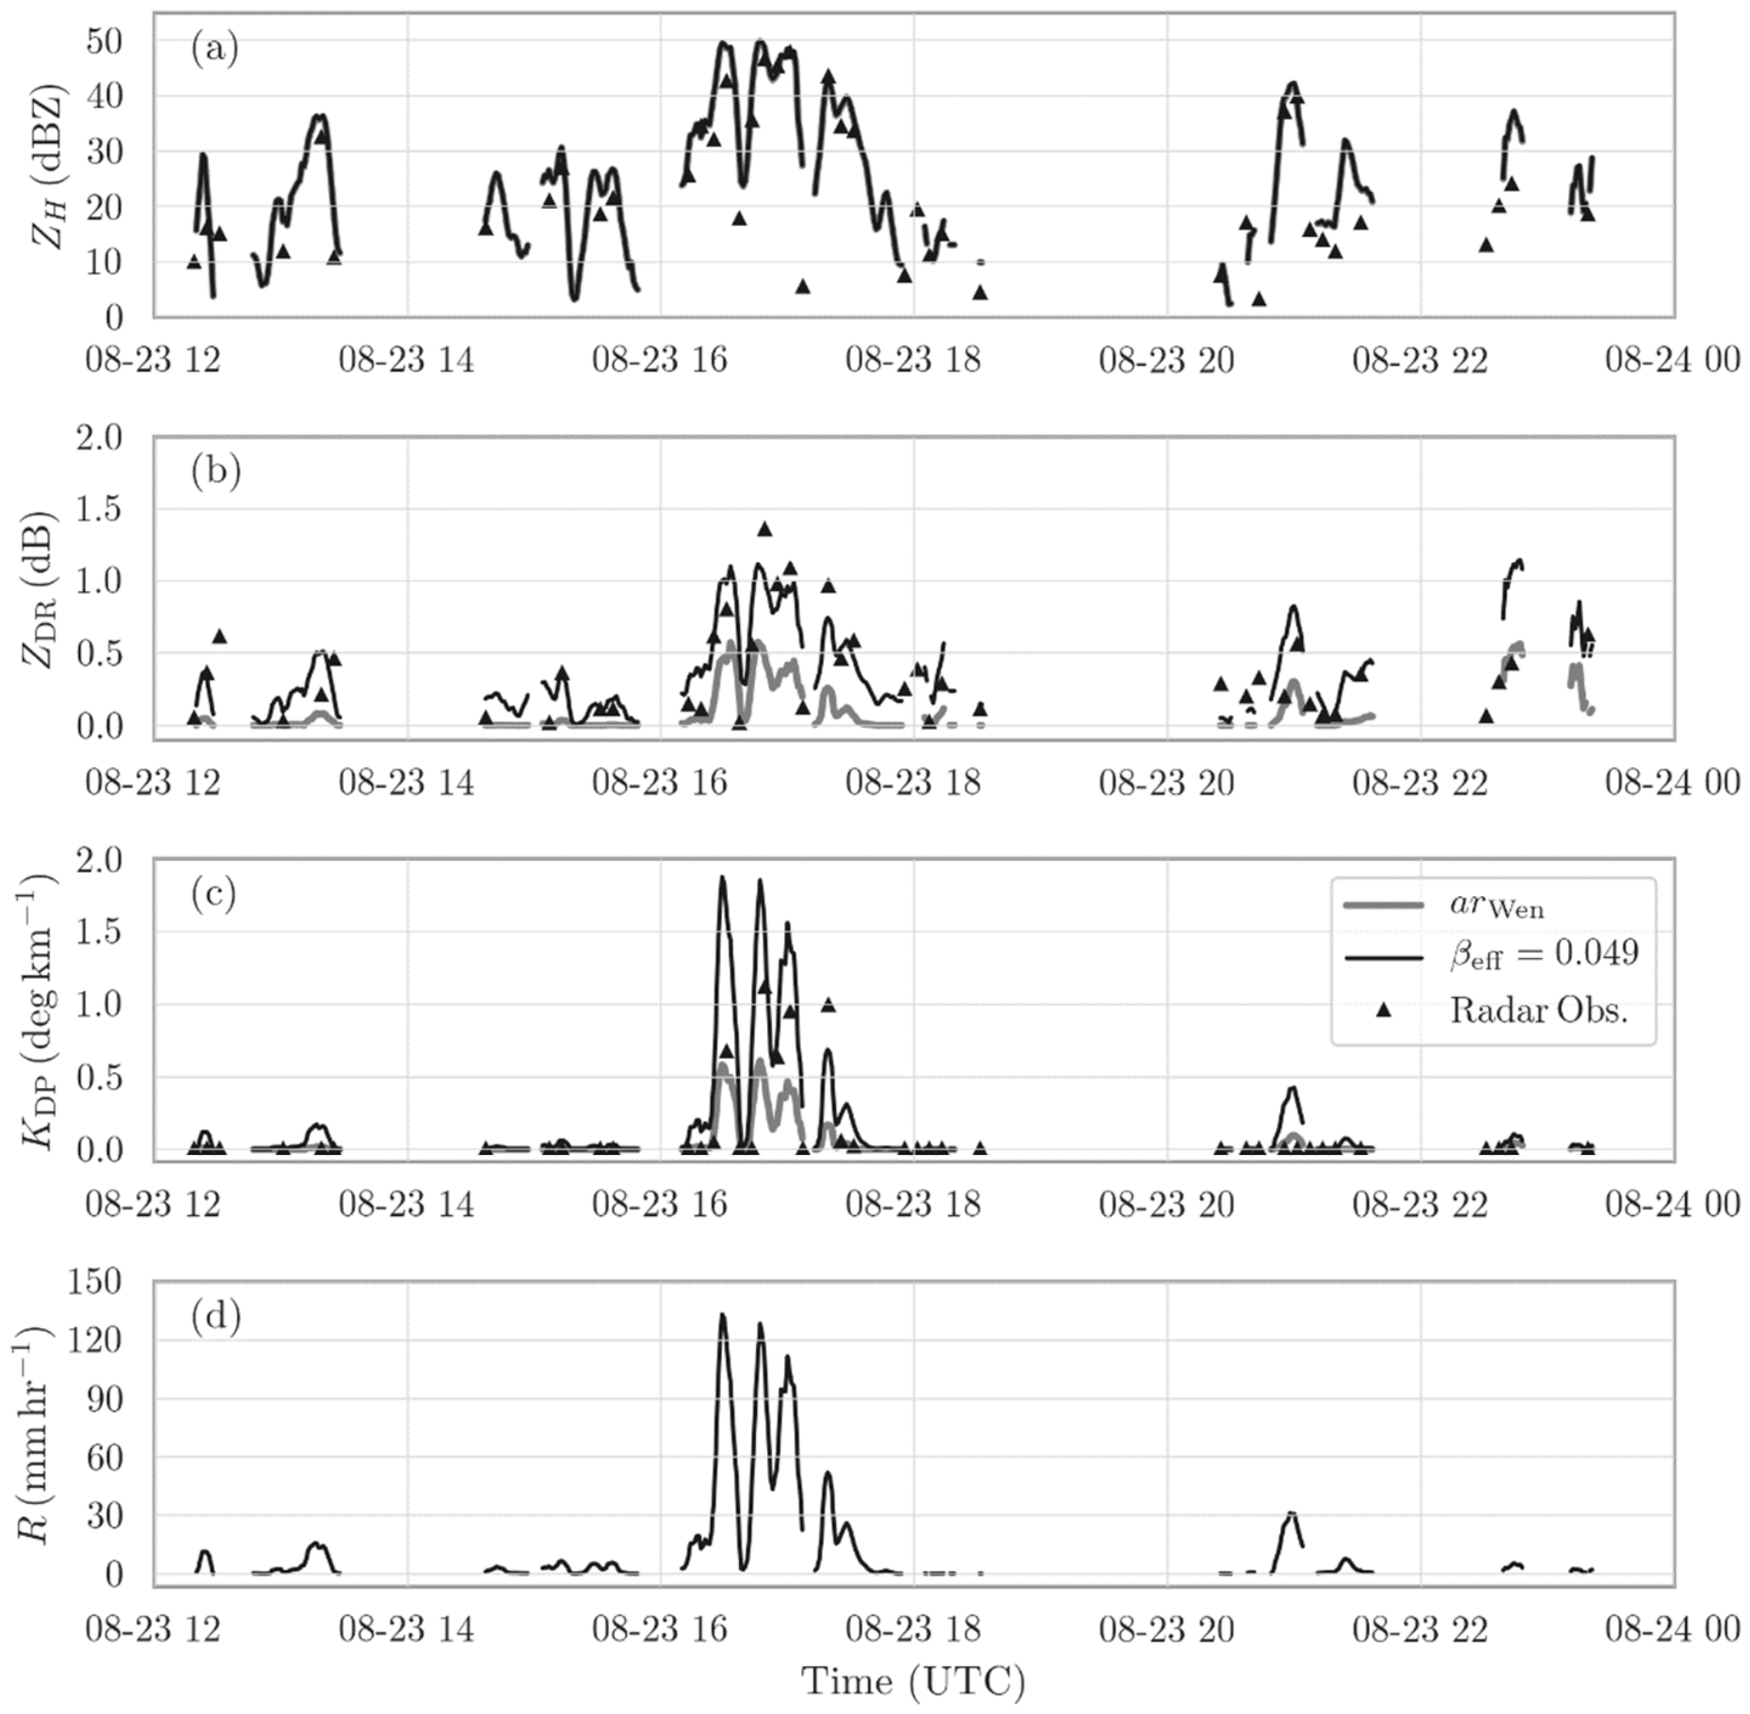
The Hato 2017 case further provides a case-based consistency check between radar observations aloft and 2DVD-based scattering simulations at a nearby surface site.
Figure 5 compares the time series of
ZH,
ZDR, and
KDP, and rainfall rate derived from the 2DVD observations with the corresponding Guangzhou S-POL measurements. The two DSR assumptions produce nearly identical
ZH simulations (
Figure 5a), consistent with the weak sensitivity of S-band reflectivity to drop shape. In contrast, their differences are evident in
ZDR and
KDP. During the intense precipitation period around 16:00–17:00 UTC, when the 2DVD-derived rainfall rate exceeds 100 mm h
−1 (
Figure 5), the simulation based on
arWen produces substantially lower
ZDR and
KDP than the radar-constrained effective DSR with
βeff = 0.049 mm
−1 (
Figure 5b,c). The observed radar
ZDR and
KDP peaks are generally better represented by the radar-constrained effective DSR than by the more spherical
arWen relation, although perfect agreement is not expected because of sampling differences.
This comparison is useful because it connects the DSD-based scattering simulations with actual polarimetric radar measurements. The 2DVD site is located about 20 km from the radar, and the 1.5° radar beam samples a volume approximately 0.7 km above the disdrometer site. Therefore, differences in sampling height, beam volume, advection, and spatial inhomogeneity cannot be fully removed. Nevertheless, the enhanced ZDR and KDP observed by the radar during the strongest rainfall period are more consistent with the radar-constrained effective DSR than with arWen. This supports the interpretation that surface 2DVD-derived typhoon DSRs may underrepresent the effective oblateness relevant to the elevated radar sampling volume, especially in intense typhoon rainfall.
3.4. Impacts on Rainfall Estimators
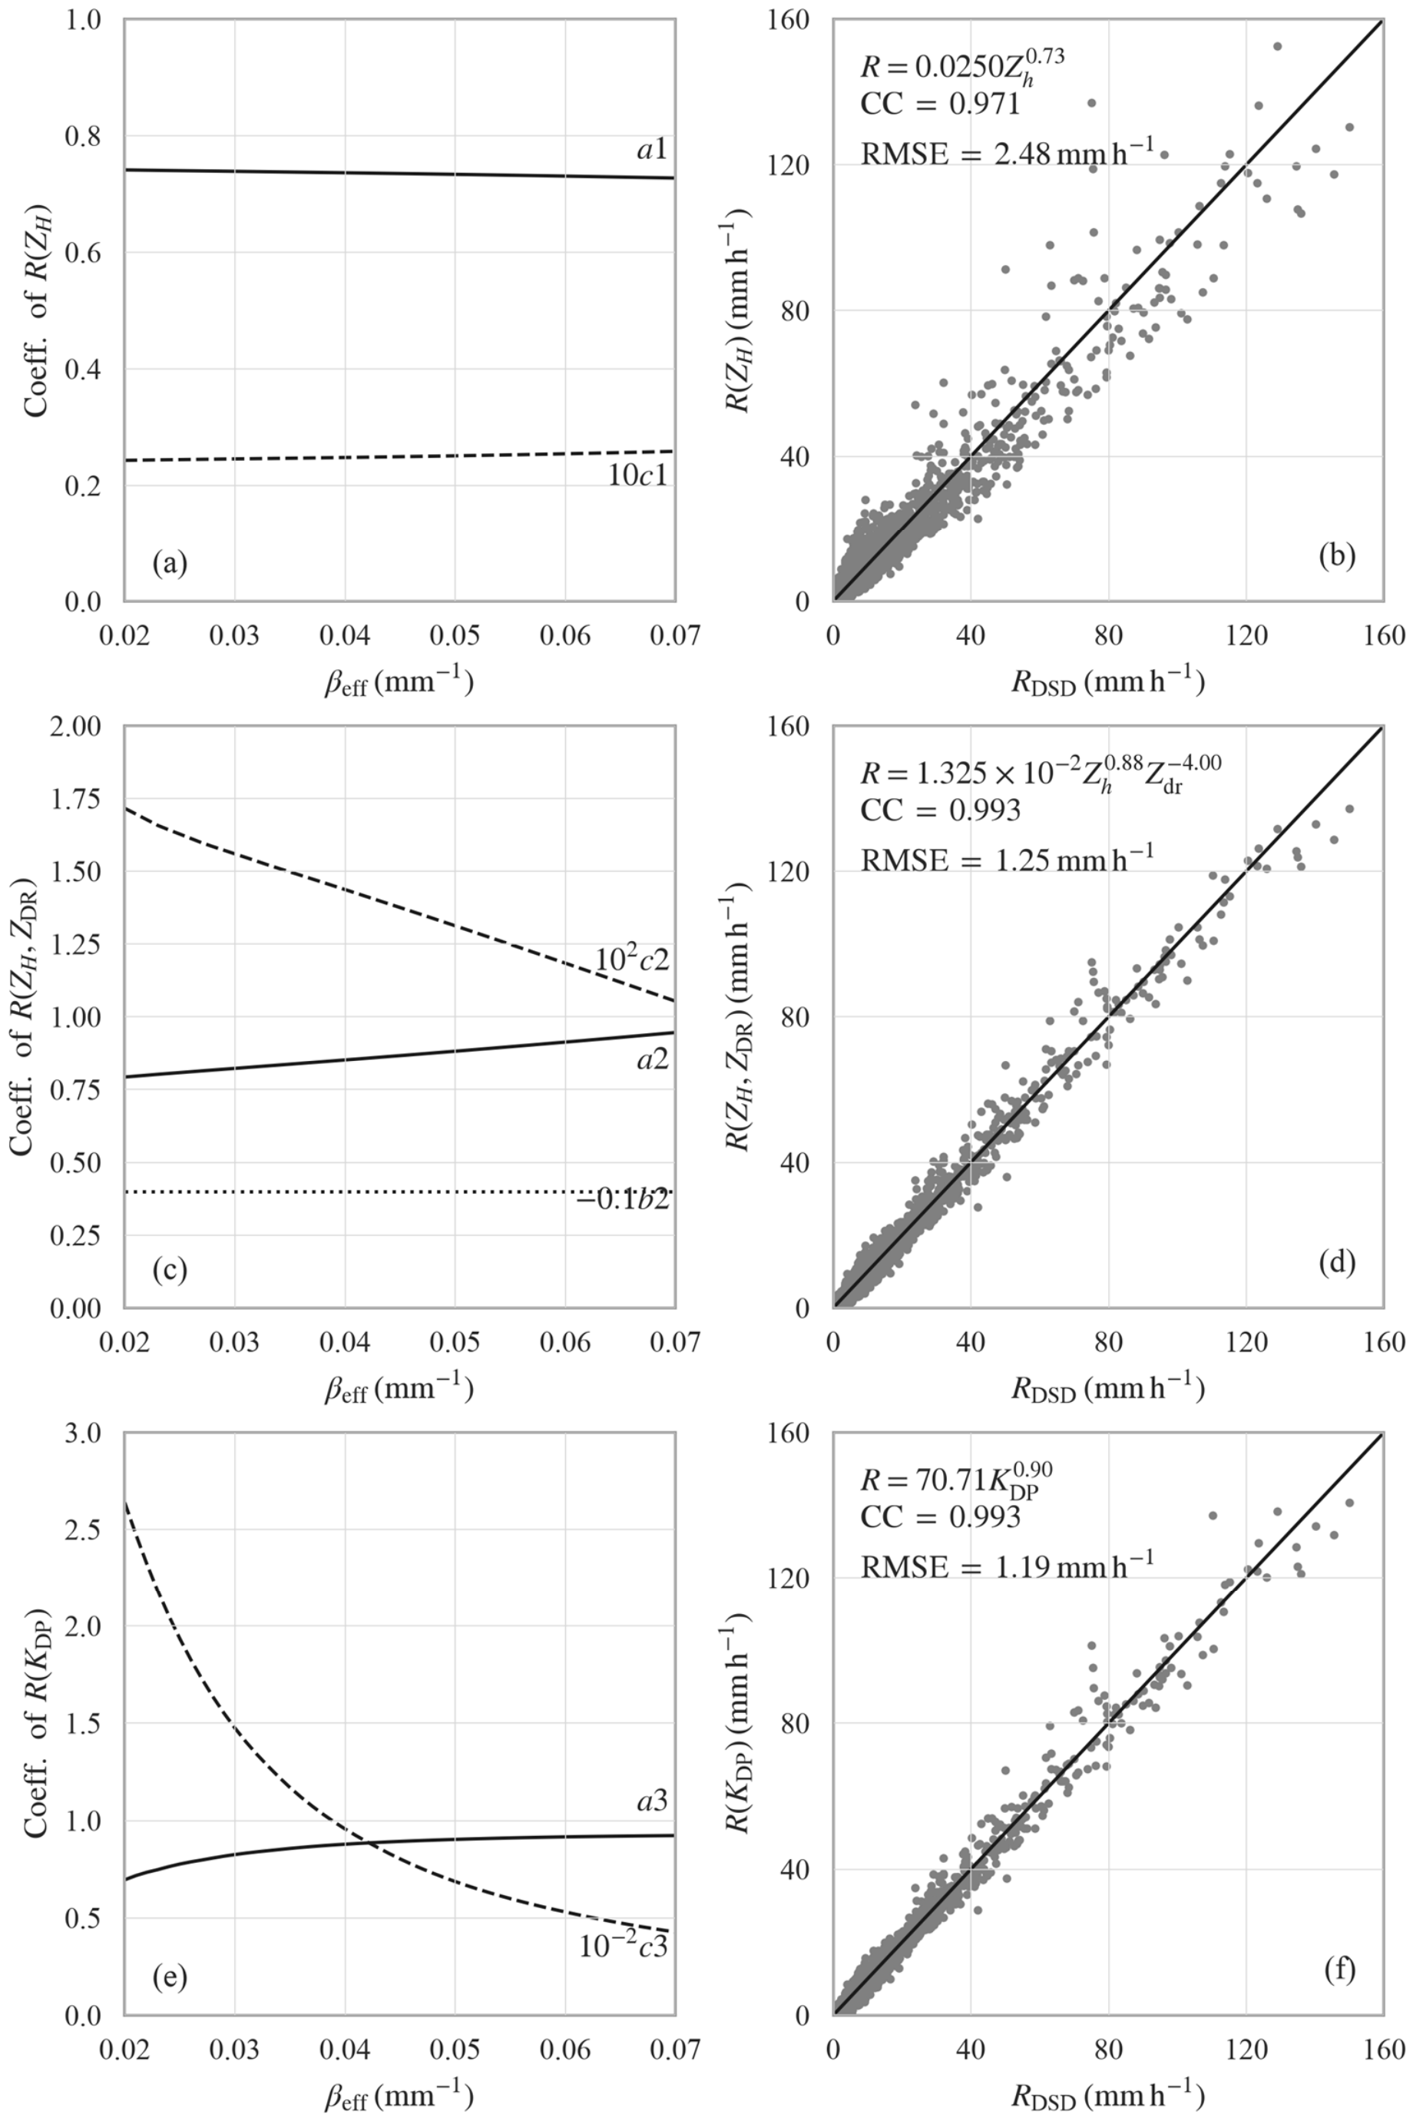
As shown in
Figure 6a, the
R(
ZH) estimator is almost insensitive to
: the exponent a1 remains nearly constant, and the coefficient
c1 changes only slightly. This is consistent with the weak DSR dependence of
ZH and with the similar CC and RMSE values of
R(
ZH) in
Table 2. In contrast, the coefficients of
R(
ZH,
ZDR) and
R(
KDP) vary clearly with
(
Figure 6c,e). For
R(
ZH,
ZDR), the exponent
a2 increases moderately with
, whereas
c2 decreases; the
ZDR exponent
b2 is fixed at −4.0 to avoid excessive sensitivity to
ZDR errors. For
R(
KDP), the dependence is stronger:
a3 increases with
, while
c3 decreases rapidly as the assumed drops become more oblate. Additional sensitivity tests with
b2 = −3.0 and −5.0 produced the same principal QPE performance grouping as the reference
b2 = −4.0 case: the radar-constrained effective and Brandes et al. DSRs consistently produced lower RMSE and smaller absolute bias than the Chang et al. and Wen et al. DSRs. Thus, the main QPE conclusion is insensitive to reasonable variations in the prescribed
ZDR exponent.
These coefficient changes are physically consistent with the scattering results in
Figure 4. A more spherical DSR produces lower
ZDR and
KDP for the same DSD, so the regression must compensate by adjusting the estimator coefficients. This compensation has different consequences for different estimator families. When an overly spherical DSR is used,
R(
ZH,
ZDR) tends to give smaller rainfall rates for actual radar measurements, whereas
R(
KDP) assigns a larger rainfall rate to a given observed
KDP. The regression statistics in
Table 2 also show this sensitivity, especially for
R(
KDP):
arWen gives the lowest CC and largest RMSE, while the radar-constrained effective DSR gives the best regression performance. The Brandes et al. DSR remains much closer to the radar-constrained effective DSR than the two surface 2DVD-derived typhoon DSRs.
3.5. Validation of Radar QPE Against Gauge Measurements
The DSR-dependent rainfall estimators were applied to the 1.5° elevation radar observations after quality control for all six typhoon cases and evaluated against hourly gauge accumulations.
Table 3 reports the exact radar–gauge validation statistics and event-block-bootstrap 95% confidence intervals for the three rainfall-estimator families under the four DSR assumptions. The 95% confidence intervals were estimated using an event-block bootstrap with 10,000 realizations. In each realization, six typhoon events were resampled with replacement from the original six events, while all paired radar–gauge station-hour observations within each selected event were retained. The 2.5th and 97.5th percentiles of the resulting bootstrap distributions were reported as the lower and upper confidence limits, respectively.
For
R(
ZH), all four DSRs yield nearly identical CC, RMSE, and RB values, with strongly overlapping confidence intervals. This weak sensitivity is consistent with the similar
R(
ZH) coefficients and DSD-fitting statistics reported in
Table 2, as well as with the limited influence of DSR on simulated
ZH. The RB confidence intervals include zero for all four relations, indicating no robust systematic bias associated with DSR choice for this estimator.
The DSR dependence becomes more evident for
R(
ZH,
ZDR). As shown in
Table 2, the fitted
and
coefficients vary among the DSR assumptions to compensate for their different simulated
ZDR responses. When these relations are applied to radar observations, the Wen et al. and Chang et al. DSRs produce substantial underestimation, with RB values of
and
, respectively (
Table 3). The Brandes et al. and radar-constrained effective DSRs reduce both RMSE and the magnitude of the negative bias. The radar-constrained effective DSR gives an RMSE of 2.347 mm and an RB of
, compared with 2.409 mm and
for the Brandes et al. DSR. However, their confidence intervals overlap substantially, indicating broadly comparable performance rather than a clearly distinguishable advantage.
The strongest DSR sensitivity occurs for
R(
KDP).
Table 2 shows that the coefficients of
R(
KDP) vary markedly with the assumed DSR: the more spherical Wen et al. and Chang et al. relations require substantially larger coefficients to compensate for their lower simulated
KDP. When applied to the observed radar
KDP, these compensated relations produce severe overestimation, with RB values of
and
, respectively (
Table 3). In contrast, the Brandes et al. and radar-constrained effective DSRs reduce the RMSE to 3.099 and 3.042 mm. Their relative advantages differ by metric: the radar-constrained effective DSR has a slightly lower RMSE, whereas the Brandes et al. relation has a smaller absolute RB and an RB confidence interval that includes zero. Thus, the two relations provide comparable overall performance, while both clearly outperform the two more spherical surface 2DVD-derived typhoon DSRs.
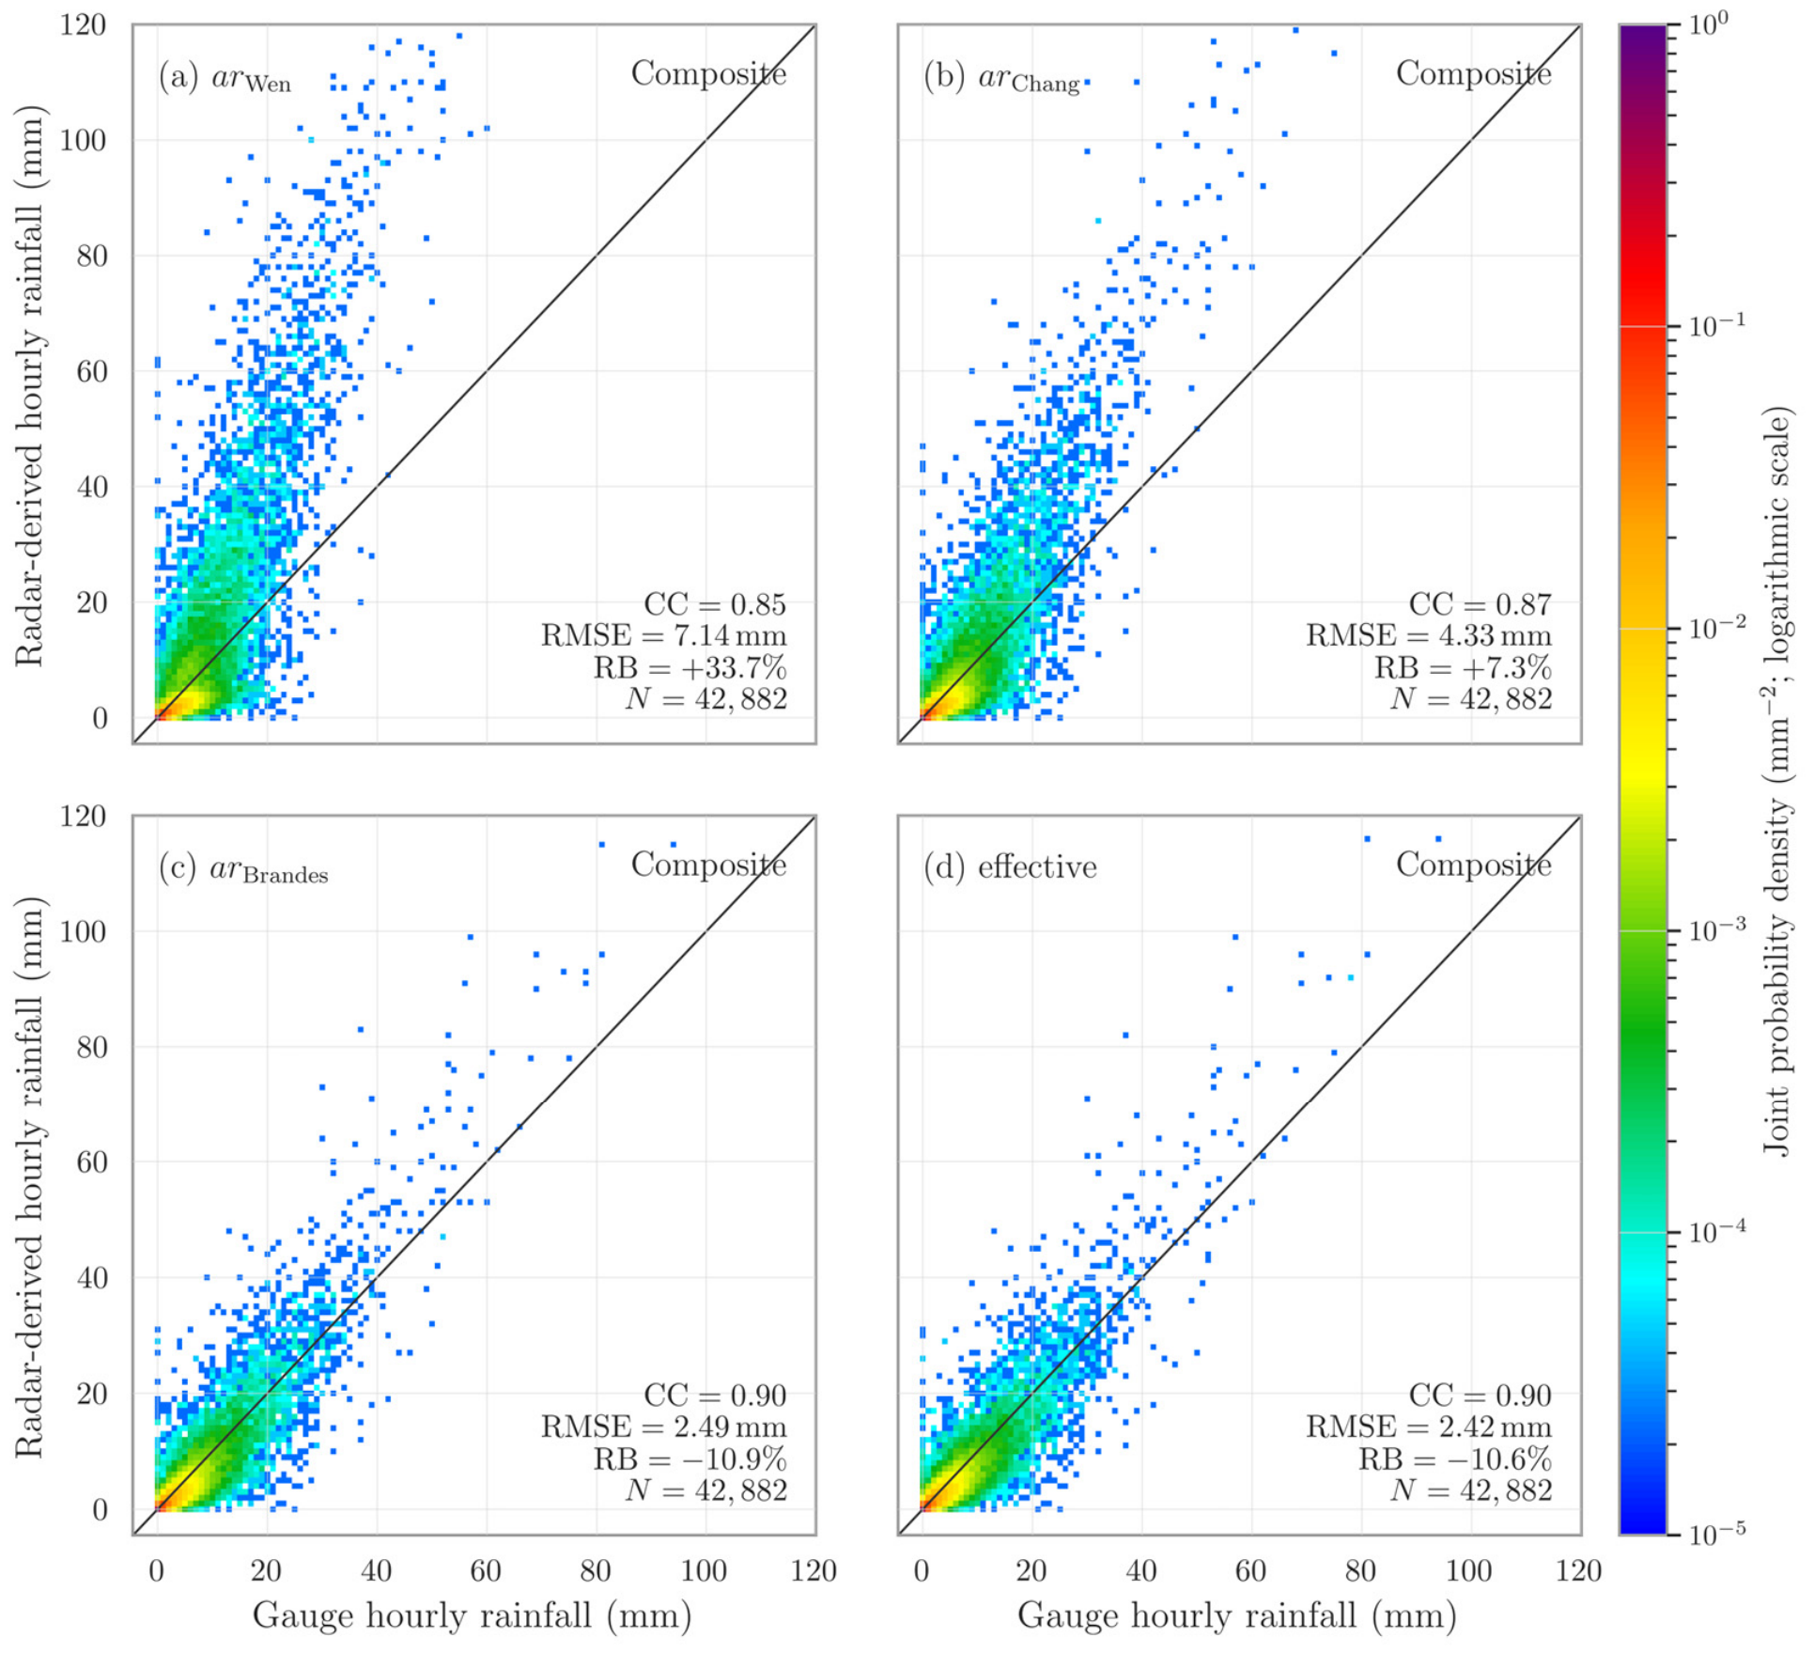
The threshold-based composite estimator described in
Section 2.4 was then evaluated to determine how the DSR-dependent errors of the individual relations propagate into a multi-estimator QPE framework (
Figure 7). For
arBrandes and the radar-constrained effective DSR, the composite estimator gives satisfactory performance, with CC values of 0.90, RMSE values of 2.49 and 2.42 mm, and relative biases of −10.9% and −10.6%, respectively. The scatter points are also more concentrated around the one-to-one line than those based on
arWen and
arChang. For
arWen and
arChang, the composite estimates are degraded, with larger scatter and higher RMSE values of 7.14 and 4.33 mm. This occurs because the fixed selection rules in the Bringi et al. [
26] composite estimator can activate
R(
ZH,
ZDR) or
R(
KDP) in regimes where those component estimators are already biased by the DSR assumption. Therefore, the composite algorithm cannot automatically eliminate DSR-related errors; a physically consistent DSR remains important even when multiple rainfall estimators are combined.
3.6. Independent Validation Using the Wenzhou Radar During Typhoon Lekima
To assess whether the DSR-dependent rainfall relations derived from the Guangzhou and 2DVD datasets can be transferred to another radar and typhoon event, the four sets of rainfall estimators were applied without recalibration to observations of Typhoon Lekima 2019 from the Wenzhou S-POL radar. The Lekima data were not used in the estimation of , the T-matrix regression, or the selection of estimator coefficients. The results, therefore, provide an independent cross-radar and cross-event evaluation of the derived rainfall relations.
Table 4 summarizes the gauge-validation statistics. For
R(
ZH), the four DSR assumptions produce nearly identical CC values of 0.850 and only small differences in RMSE and RB, confirming the weak sensitivity of
ZH-based QPE to raindrop shape. The radar-constrained effective DSR gives the lowest RMSE, although the differences among the four DSRs are small.
The influence of DSR becomes more evident for R(ZH, ZDR). The Wen et al. and Chang et al. DSRs produce negative biases of and , respectively. In contrast, the Brandes et al. and radar-constrained effective DSRs yield substantially smaller biases and lower RMSE values. The Brandes et al. DSR gives the smallest absolute RB, whereas the two relations produce nearly identical RMSE values of 3.153 and 3.154 mm.
The strongest DSR dependence again occurs for R(KDP). The Wen et al. DSR causes severe overestimation, with an RB of 114.63% and an RMSE of 8.855 mm. The Chang et al. relation reduces these errors, while the Brandes et al. and radar-constrained effective DSRs provide substantially lower RMSE values. However, both of the latter relations underestimate rainfall in this independent case, with the Brandes et al. DSR showing a smaller absolute bias than the radar-constrained effective DSR.
For the composite estimator, the Brandes et al. and radar-constrained effective DSRs provide the best and nearly identical overall performance. Their RMSE values are 3.136 and 3.135 mm, respectively, compared with 3.985 mm for the Chang et al. DSR and 6.651 mm for the Wen et al. DSR. These independent results support the main conclusion that the two more spherical surface 2DVD-derived typhoon DSRs, particularly the Wen et al. relation, are less transferable to radar-volume QPE. At the same time, the relative advantages of the Brandes et al. and radar-constrained effective DSRs vary among estimator types and performance metrics, and the two should therefore be regarded as providing broadly comparable performance in the Lekima case.
4. Discussion
This study uses the polarimetric self-consistency framework to examine whether surface 2DVD-derived typhoon DSRs can be transferred directly to elevated radar-volume QPE. Building on the established effective
framework, we estimate a representative
for each typhoon through multi-sample optimization. In contrast to sample-level retrievals, which may exhibit considerable scatter because of measurement uncertainties in the polarimetric variables, particularly
KDP [
16,
19], the optimization constrains an event-level value using a large ensemble of quality-controlled
ZH–
ZDR–
KDP samples. The resulting
estimates are consistent among the six landfalling typhoons, ranging from 0.046 to 0.049 mm
−1, with an overall value of approximately 0.049 mm
−1. Excluding any individual Guangzhou event changed the representative estimate by no more than 0.322%. The agreement between the radar-constrained effective DSR and the surface 2DVD observations during the selected non-typhoon event further supports the reliability of the estimation approach under the radar-processing and quality-control procedures adopted here. These results provide a basis for evaluating the transferability of surface-derived DSRs to radar-volume QPE.
The radar-constrained effective DSR should not be interpreted as a direct measurement of the geometric axis ratio of individual raindrops. Instead, it represents the effective polarimetric response of the radar sampling volume and may incorporate the combined influences of drop shape, oscillation, canting, DSD weighting, spatial heterogeneity, and radar-volume averaging. By comparison, the Wen et al. [
13] and Chang et al. [
12] relationships were obtained from near-surface 2DVD observations and characterize drops passing through a much smaller sampling area. The two types of DSR therefore describe related but not identical quantities. The difference between them does not imply that the surface 2DVD measurements are inaccurate; rather, it indicates that a relationship derived from near-surface particle images may not fully represent the effective drop-shape characteristics relevant to elevated polarimetric radar measurements.
For the six typhoon cases, the radar-constrained effective DSR indicates greater effective oblateness than the two surface 2DVD-derived typhoon DSRs. This difference has only a minor effect on ZH, but substantially affects ZDR and KDP. The comparison during Typhoon Hato provides an additional case-based consistency check. During the period of intense rainfall, the enhanced radar-observed ZDR and KDP are more consistent with the radar-constrained effective DSR than with the more spherical relation. However, this comparison is not a strict point-by-point validation because the radar and 2DVD observations differ in sampling height, sampling volume, horizontal location, and advection history. It nevertheless supports the interpretation that the effective DSR relevant to the radar sampling volume can differ systematically from a DSR derived from near-surface measurements.
One possible explanation for the more spherical surface 2DVD-derived DSRs is enhanced non-equilibrium drop oscillation in the typhoon near-surface layer. Strong horizontal winds, wind shear, and turbulence can perturb raindrops from their equilibrium shapes and increase the amplitude of axis-ratio fluctuations. Laboratory and field studies have shown that raindrop oscillations can produce larger time-averaged axis ratios than predicted by equilibrium-shape models, particularly for moderate and large drops [
8,
28]. More recently, Zheng et al. [
29] found that stronger turbulence produces more pronounced oscillations and more rounded mean shapes for large raindrops. Chang et al. [
12] also reported that typhoon raindrops larger than approximately 1.5 mm tended to exhibit larger axis ratios under stronger horizontal winds. These findings suggest that enhanced near-surface dynamical forcing may contribute to the more spherical apparent DSRs obtained from surface 2DVD observations. Thus, the observed difference does not necessarily imply a simple monotonic change toward more oblate equilibrium shapes with height.
This interpretation should nevertheless remain tentative because the two approaches do not measure exactly the same physical quantity. The 2DVD-derived DSR describes the geometric axis ratios of individual drops passing through a small near-surface sampling area, whereas the radar-constrained is a scattering-weighted and volume-averaged parameter that may incorporate the combined effects of drop shape, oscillation, canting, DSD weighting, spatial heterogeneity, and nonuniform beam filling. Collision–coalescence, breakup, evaporation, and associated DSD evolution during descent may further alter both the drop population and its polarimetric response. The present observations cannot separate true vertical microphysical evolution from near-surface dynamical effects and differences in sampling definitions. Coordinated multilevel disdrometer observations, turbulence measurements, and in situ imaging of drop shapes aloft would therefore be required to determine the relative contributions of these processes.
The influence of DSR assumptions on QPE is systematic and depends on the estimator form. Because S-band ZH is only weakly sensitive to raindrop shape, the coefficients and gauge-validation statistics of R(ZH) change little among the tested DSRs. In contrast, R(ZH, ZDR) and R(KDP) depend on variables that respond strongly to the assumed axis ratio. A more spherical DSR produces lower simulated ZDR and KDP for the same DSD, requiring the fitted rainfall relationships to compensate through their coefficients. When these compensated relationships are applied to radar observations that are more consistent with a more oblate effective DSR, R(ZH, ZDR) tends to underestimate rainfall, whereas R(KDP) can substantially overestimate it. This opposite bias behavior explains why an inappropriate DSR cannot necessarily be corrected through regression alone.
The Brandes et al. DSR and the radar-constrained effective DSR produce relatively similar scattering characteristics and QPE performance over the diameter range that contributes most strongly to the analyzed rainfall. This does not demonstrate that the Brandes et al. relationship is universally optimal for typhoon precipitation. Instead, it indicates that, for the Guangzhou S-POL observations and the typhoon DSD dataset considered here, its effective polarimetric response is more consistent with the radar measurements than those of the two more spherical surface 2DVD-derived typhoon DSRs. The result emphasizes that a DSR should be evaluated in terms of its consistency with the radar sampling volume and the polarimetric relationships used in QPE, rather than selected solely because it was derived from the same general precipitation category.
Several limitations should be considered. First, the radar-constrained effective DSR is represented by a single linear parameter and therefore cannot fully describe nonlinear or size-dependent variations in raindrop shape. An event-level also suppresses possible variability among convective and stratiform precipitation, different rainbands, rainfall intensities, and stages of typhoon evolution. Second, the estimated depends on the calibration and quality of ZH, ZDR, and KDP. The variational KDP retrieval and quality-control procedures reduce the effects of phase noise, nonmeteorological echoes, and nonliquid hydrometeors, but cannot completely eliminate residual ZDR calibration bias, nonuniform beam filling, or uncertainty in the corrected radar variables. The large sample size reduces random sampling uncertainty but does not remove systematic measurement errors. Third, the independent Wenzhou–Lekima evaluation provides initial cross-radar and cross-region support for the principal performance grouping. However, it represents only one additional S-band radar and one typhoon event and therefore does not establish universal transferability across radar wavelengths, regions, or tropical-cyclone environments.
The sensitivity analyses further show that the uncertainty in is not equally distributed among the input variables. From Equation (4), systematic ZDR offsets of 0.1 and 0.2 dB change by approximately and , respectively. Residual ZDR calibration bias may therefore explain part of the relatively small event-to-event range and represents a more important systematic uncertainty than the tested random KDP errors. By comparison, replacing the variational KDP retrieval with a local linear-slope method changed the six-event estimate by only 0.044%, and independent zero-mean KDP perturbations did not affect the rounded value of 0.049 . The latter test, however, does not represent systematic or spatially correlated phase errors. The leave-one-typhoon-out estimates ranged from 0.048353 to 0.048661 , indicating that the representative value was not dominated by any individual event. Thus, the retrieved is stable with respect to event inclusion and the tested KDP uncertainties, but it remains conditional on the adopted calibration and quality-control framework, particularly the correction of systematic ZDR bias.
Environmental controls on hydrometeor microphysics may also extend beyond the low-level liquid-phase processes examined here. Wang et al. [
30], for example, showed that changes in mineral dust and ice-nucleating particles can affect high-cloud ice-to-liquid phase partitioning and its associated radiative feedbacks. This study provides broader context showing that hydrometeor properties can respond to environmental and aerosol-related forcing. However, those high-cloud mixed- and ice-phase processes are distinct from the warm-rain liquid-drop shapes investigated here and should not be regarded as direct evidence for the observed DSR differences. Because aerosol, ice-nucleating-particle, and in situ drop-shape observations aloft are unavailable, their possible indirect effects cannot be assessed in the present study.
For future applications, the radar-constrained effective DSR can be used in two complementary ways. First, a representative can be estimated from quality-controlled observations for a local radar or radar network and then used to construct polarimetric QPE relationships that are consistent with the effective drop-shape characteristics of the radar sampling volume. Second, the radar-constrained can serve as a diagnostic constraint for evaluating existing DSRs. If a surface-derived or literature-based DSR produces ZDR–KDP relationships that are inconsistent with local radar observations, it should not be transferred directly to operational QPE without further evaluation or adjustment. Future studies should test this approach with additional independent radars and typhoon cases and propagate uncertainties in radar calibration, KDP retrieval, DSR specification, and rainfall-relation fitting into probabilistic QPE products.
5. Conclusions
This study evaluated the influence of raindrop-shape assumptions on polarimetric radar QPE using six landfalling typhoons observed by Guangzhou S-POL. A radar-constrained effective linear DSR was estimated from the self-consistency among
ZH,
ZDR, and
KDP. The event-level
values range from 0.046 to 0.049 mm
−1, with an overall value near 0.049 mm
−1. The resulting relationships indicate greater effective oblateness than the surface 2DVD-derived typhoon DSRs of Wen et al. [
13] and Chang et al. [
12], while remaining relatively close to the Brandes et al. relationship over the most relevant diameter range.
The assumed DSR has little effect on ZH and R(ZH), but strongly affects ZDR, KDP, and rainfall estimators using these variables. The more spherical surface-derived typhoon DSRs lead to underestimation by R(ZH, ZDR) and pronounced overestimation by R(KDP). Gauge validation confirms that the radar-constrained effective DSR and the Brandes et al. DSR provide more consistent single-estimator and composite QPE results for the analyzed cases.
The application of the rainfall relations without recalibration to Typhoon Lekima, observed by the independent Wenzhou S-POL radar, reproduced the principal performance grouping, providing additional cross-radar, cross-region, and cross-event support for the identified DSR transferability issue. These findings identify a DSR transferability issue: a relationship derived from near-surface disdrometer observations is not necessarily directly applicable to elevated radar-volume QPE. A locally estimated βeff can be used either to construct radar-consistent rainfall relationships or as a diagnostic constraint for evaluating existing DSRs. However, the value obtained here should be applied cautiously beyond similar S-band radar and South China typhoon conditions. Further cross-radar, cross-region, and uncertainty analyses are required before broader operational application.