Article

Improvement of Flood Risk Model Performance by Incorporating Sediment Factors

1
National Satellite Meteorological Center (National Center for Space Weather), China Meteorological Administration, Beijing 100081, China
2
Innovation Center for FengYun Meteorological Satellite (FYSIC), Beijing 100081, China
3
Key Laboratory of Radiometric Calibration and Validation for Environmental Satellites/Key Laboratory of Space Weather, CMA, Beijing 100081, China
4
Nansen-Zhu International Research Centre (NZC), Chinese Academy of Sciences, Beijing 100029, China
5
National Weather Forecasting Center, Pakistan Meteorological Department (PMD), Islamabad 44000, Pakistan
6
Department of Meteorology, Sri Lanka, Colombo 00700, Sri Lanka
*
Author to whom correspondence should be addressed.
Remote Sens. 2026, 18(17), 2933; https://doi.org/10.3390/rs18172933
Submission received: 24 July 2026 / Revised: 27 August 2026 / Accepted: 29 August 2026 / Published: 1 September 2026
(This article belongs to the Section AI Remote Sensing)

Highlights

What are the main findings?
  • By incorporating sediment deposition as a key factor into the flood risk model, a reasonable spatial distribution of flood risk was captured, and 98.1% of the observed flood extent was located within high-risk zones.
  • The traditional flood risk model that overlooked the role of sediment deposition underestimated the flood hazard risk along the Indus River by up to 23.3%.
What are the implications of the main findings?
  • The methodology addresses the critical gap between the improved flood risk model and traditional models that often overlook the sediment factor for accurately analyzing flood risk distribution.
  • The role of the sediment factor in exacerbating flood risks needs to be emphasized in flood risk identification, especially as intense rainfall will increase sedimentation in the Indus River in Pakistan in the future.

Abstract

Timely flood hazard assessment is essential for determining flood risk levels and plays a critical role in flood prevention and mitigation, particularly in extreme rainfall events under global climate change. This study developed a flood risk model (FRM) incorporating sediment deposition as a key factor to address a gap often overlooked by traditional models for accurately analyzing flood risk distribution. Near-real-time FengYun satellite products were adopted in this model to investigate the causes and impacts of the catastrophic flood in Pakistan in 2022. The results show that the FRM is capable of accurately capturing the spatial distribution of flood risk compared to traditional models, with 98.1% of observed flood extent located within high-risk zones. The floods were mainly attributed to historically unprecedented monsoon rainfall in August—which totaled 2.2 times the 1961–2021 average, and 7.9 times in central Pakistan—while glacier melt contributed minimally. Meanwhile, sediment deposition significantly amplified the magnitude and severity of the flood. The model estimated an inundation of 5.0 × 10⁴ km2, and an affected population of 28 million, aligning closely with field survey data. The traditional model without incorporating sediment thickness as an input parameter underestimates flood hazard risk evaluation by up to 23.3%, especially as intensification of extreme rainfall drives higher erosivity and increased suspended sediment concentrations in the future. Therefore, the sediment factors adopted in flood risk assessment would provide an effective framework for accurate flood hazard risk identification and support decision-making aimed at enhancing flood disaster prevention and mitigation.

1. Introduction

Flood disasters, among the major climate-related disasters [1,2], are becoming more frequent and intense due to global warming. According to the World Meteorological Organization (WMO), flood-related disasters accounted for 45% of reported global natural disasters worldwide, with Asia suffering the highest proportion (31%) [3]. From 1993 to 2022, flood disasters accounted for as much as 63% of all natural disasters recorded in the Emergency Events Database (EM-DAT) [4]. As one of the most destructive natural hazards, floods and their associated risks cause substantial damage to property, infrastructure, and human lives worldwide [5], posing an increasingly critical global challenge.
The United Nations International Strategy for Disaster Reduction (UNISDR) considers raising disaster risk awareness and strengthening disaster risk management to be crucial components of sustainable development, intending to reduce disaster-induced losses across the human, social, economic, and environmental domains. Currently, risk is commonly defined as the combination of hazard, exposure, and vulnerability, representing the potential adverse consequences for human and ecological systems [6,7]. Accordingly, flood risk assessment integrates these three components into a comprehensive framework [7,8,9] and has been widely applied in flood prevention, disaster early warning, and decision-making [10,11], playing a critical role in effective flood management and loss mitigation.
The formation of a flood disaster is a process through linked disaster-inducing factors, disaster-forming environment, exposure of receptors, and coping capacity [12]. Flood hazard analysis, which is the foundation of flood risk assessment [13,14], refers to the likelihood of a flood event occurring based on the disaster-inducing factors and disaster-forming environmental conditions [5,12,15].
Recent advances in computer science and remote sensing have shifted flood risk research from theory to practice. To obtain accurate flood risk maps, various approaches and techniques have been utilized at regional and global scales, including statistical models, multi-criteria analysis (MCA), geographic information systems (GISs), hydrological and physical models, scenario simulation, machine learning (ML) algorithms, and artificial intelligence (AI) models [9,10,16,17,18,19,20]. Among these approaches, MCA is widely used for flood risk assessment due to its simple modeling principles, lower data requirements, and ease of operation, while also achieving robust results [9,12]. However, traditional flood risk model-based MCA includes only terrain, land cover, and river density as disaster-forming environment factors, while ignoring the sediment factor, which plays a critical role in amplifying flood risks. Sediment deposition uplifts the riverbeds and reduces river channel capacity, intensifying the flood risk [21]. Some investigations have focused on mapping flooding [22], evaluating the impact of flooding [23], and analyzing the causes of flooding [24,25]. In contrast to previous flood events that were primarily caused by rainfall and runoff, Bazai et al. emphasized that sediment deposition became a crucial factor that amplified the flood’s magnitude, severity, and inundation during this flooding. It is also highlighted that traditional flood risk models (FRMs) often neglect sediment dynamics and underestimate the possible amplified flood risks. Considering sediment deposition as a crucial factor to assess flood risk could enhance our understanding of flood dynamics and improve the accuracy of flood risk assessment in the coming decades. Nevertheless, limited research has been conducted on the evaluation of FRMs that integrate a comprehensive analysis of sediment deposition processes.
In this work, we developed an FRM, incorporating the MCA method to account for sediment deposition as a critical factor, to quantitatively assess flood hazards, delineate hazard levels, and explore the spatial distribution of extreme flooding. To improve the accuracy of flood risk assessment in 2022 in Pakistan, the proposed FRM incorporated the near-real-time FengYun-4B (FY-4B) and FengYun-3D (FY-3D) quantitative products, global fluvial sediment concentration, sediment thickness, and multiple auxiliary data sources, rather than relying on the station observation data. By integrating an enhanced FRM with near-real-time FengYun satellite products, this study establishes a new framework capable of generating timely flood hazard risk maps to support flood disaster prevention and mitigation.

2. Data and Methods

2.1. Data

The data used in this study are shown in Table 1. To obtain disaster-inducing factors, the FY-4B Quantitative Precipitation Estimation (QPE) and FY-3D soil moisture data, covering Pakistan from August to September 2022, were obtained from the FengYun satellite data service. The observed meteorological variables, such as rainfall and temperature, as well as the flow discharge data from hydrological stations along the Indus River, were collected from the Pakistan Meteorological Department. For calculating disaster-forming environment factors, the Digital Elevation Model (DEM), topographic relief, fluvial sediment, sediment thickness, river density, and land-cover data were used in this work. The DEM was derived from NASA’s Earth Observing System Data and Information System (EOSDIS), and topographic relief was generated at 30 m resolution following pre-processing. Global fluvial suspended sediment concentrations (SSCs) were provided by the Global Aqua Remote Sensing (GARS) laboratory [26]. Global sediment thickness in the year 2012 was derived from the Institute of Geophysics and Planetary Physics, University of California. The dataset was hand-digitized from atlases and maps with a spatial resolution of 1°. For most of the continental areas, sediment thickness data were obtained from the Tectonic Map of the World. Given its widespread adoption and proven reliability in various scientific studies, this dataset is sufficient for the current investigation. River density was acquired from the global geographic map database released by the National Geomatics Center of China using GIS technology. Land-cover data with 500 m resolution were provided by the EOSDIS. Population density data with 1 km resolution were obtained from LandScan Global, produced by the Oak Ridge National Laboratory (ORNL). Considering the differences in spatial resolution among the datasets, we co-registered them to a common projection and spatial resolution to reduce georeferencing errors and ensure the provision of a detailed flood hazard risk assessment.

2.2. Assessment Framework of the Flood Hazard Susceptibility Model

Flood hazard susceptibility assessment aims to accurately characterize the spatial distribution of flood hazard by comprehensively combining the disaster-inducing and disaster-forming environmental factors. Disaster-inducing factors are mainly responsible for the occurrence of the hazard, while disaster-forming environmental factors mainly refer to the formation of the hazard. The flood hazard assessment framework, which comprises three components, is shown in Figure 1. The first part involves constructing a comprehensive flood hazard assessment index system. Taking into account both disaster-inducing factors and disaster-pregnant environmental factors, seven indicators—QPE, soil moisture, DEM, topographic relief, river density, land cover, and sediment thickness—were selected for this purpose. Among these, factors such as QPE, soil moisture, DEM, topographic relief, river density, and land cover are directly or closely related to the occurrence of flood disasters, flood processes, and the severity of flood disasters, and they are often used as indices for flood hazard assessment. For instance, heavy rain is the direct factor causing flood disasters. Soil moisture is a core parameter in flood forecasting and early warning. DEM and topographic relief might affect flood processes by altering the flow routing path and velocity. River density influences flood disasters by adjusting the water storage capacity, while land cover directly modulates the water cycle process. In this work, the sediment thickness is included in the flood risk model, owing to its significant influence on flood processes through the reduction in channel capacity and the rise in water level.
Subsequently, the flood hazards assessment map was generated by integrating these hazard indicators through ArcGIS. To eliminate the dimensional effects of different factors, each indicator was normalized to a value between 0 and 1, and weights were then assigned using the analytic hierarchy process (AHP). Flood hazard levels were classified into five levels using the Jenks natural breaks method.
Finally, the flood hazard level was validated based on the floodwater bodies identified from FengYun satellite data.

2.3. Model Parameterization

2.3.1. QPE

Heavy rainfall and flood disasters are closely linked, with rainfall intensity being a critical driver of flood events. Due to the influence of monsoon climate and tropical cyclones, heavy rainfall-inducing floods frequently occur during the monsoon season (June to October) in Southern Asia. In this study, 24 h cumulative rainfall—QPE derived from the FengYun satellite—was selected as an indicator for flood hazard assessment. The QPE was normalized based on rainfall intensity as follows [27]:
x 1 = {                       0 ,                   P 20   ( 3 P 20 ) / 220 ,       20 < P 80                     1 ,                     P > 80
where x 1 is the normalized value of QPE, and P is the value of 24 h cumulative rainfall.

2.3.2. DEM

The DEM contains fundamental terrain information and plays a key role in determining flood overflow direction and flood depth distribution. Areas with higher elevation are less vulnerable to flooding than those with lower elevation. The DEM was normalized as follows [28]:
x 2 = { 1 ,                     H < 0 1 H / 1000 ,       0 H < 700         0.3 ,                 H 700
where x 2 is the value of elevation after normalization, and H is the value of the elevation.

2.3.3. Topographic Relief

The topography is a key factor in flood disaster assessment. In this study, topographic relief was selected to represent topographic characteristics and was normalized using a normalization model based on elevation and its standard deviation [9]. Further details are given in Table 2.

2.3.4. Land Cover

Land cover is a key factor in areas vulnerable to flooding. Areas with low or sparse vegetation, such as barren land and urban areas, are more susceptible to flood processes. In addition, land-use and land-cover changes can alter surface flow patterns and influence flooding. Table 3 presents the values assigned to each land-cover type based on the land-cover map [29].

2.3.5. Soil Moisture, Sediment Thickness, and River Density

Soil moisture is a critical factor in flooding, as it significantly affects the infiltration and runoff of surface water. Areas with high soil moisture typically have weaker water retention capacity and are more prone to flooding. Sediment thickness is a critical geomorphological factor that modifies the landscape via riverbed uplift and widening, substantially intensifying flood hazards. The riverbed uplifts as sediment thickness increases, which reduces the channel storage capacity and, consequently, enhances the flood hazard risk. Therefore, the thicker the sediment, the greater the flood hazard risk. River density is defined as the total length of the river network per unit area, which reflects the abundance of rivers in a given area. A higher river density generally indicates a greater likelihood of flood disasters.
In this study, soil moisture, sediment thickness, and river density were normalized using the max–min normalization method. Here, soil moisture, sediment thickness, and river density are applied as follows:
u i = ( x i x m i n ) / ( x m a x x m i n )
where u i   is the normalized value of indicator i , x m a x is the maximum value of the corresponding indicator x i , and x m i n is the minimum value of the corresponding indicator   x i .

2.3.6. Indicator Weighting

Given the varying significance of individual factors to flood hazard, different weights should be assigned to the indicators. In this study, we employed the AHP, a well-established multi-criteria decision-making method, to weight the indicators, given its proven effectiveness in flood risk assessment [30]. The core principle of the AHP is to decompose a complex problem into a series of hierarchical structures comprising multiple levels and components. For each layer, a pairwise comparison matrix is generated based on a fundamental 1–9 scale derived from expert judgment, and indicator weights are determined [17,31]. The AHP generally consists of four main steps: establishing a hierarchical structure model, constructing a judgment matrix, performing consistency tests, and calculating the final weights. Factors should be estimated to identify the significance of each factor in the flood risk. The most significant factor is given the highest weight in the totality of the assessment. We calculated the consistency index (CI) and consistency ratio (CR) to ensure that the pairwise comparisons were consistent (both required < 0.1). The CR can be calculated as follows:
C R = C I / R I
where C I and R I are the consistency index and the random index, respectively. The R I value is determined by the number of criteria ( n ), and the C I is calculated as follows:
C I = ( λ m a x n ) / ( n 1 )
where λ m a x is the largest eigenvalue of the comparison matrix and n is the number of criteria.
In this study, the C I and C R were 0.0428 and 0.0382, respectively. Both ratios are below the threshold value of 0.1, indicating a high level of consistency among the selected judgments and supporting the acceptance of the derived weights.
The weight for each indicator was derived based on the AHP method by seven experts in the fields of meteorology, disasters, geology, and hydrology. The weights for each indicator are shown in Table 4. The weights of QPE, soil moisture, DEM, topographic relief, sediment thickness, river density, and land cover are 0.3889, 0.1944, 0.0880, 0.0685, 0.0495, 0.1698, and 0.0409, respectively.

2.4. Flood Hazard Evaluation

Hazards are determined by both disaster-inducing factors and disaster-forming environmental factors. Flood hazard assessment is defined as a function of these hazard factors. After determining the specific weight for each indicator using the AHP method, the flood hazard index was calculated using the following equation:
H = i = 1 n ( x i · w i )
where H is the flood hazard index; n is the number of factors; x i represents the indicators of QPE, soil moisture, DEM, topographic relief, river density, and land cover with normalized values; and w i indicates the weight of the corresponding indicator. The flood hazard index, defined as the degree to which an area is affected by flooding, was standardized to a range of 0 to 1, where 0 indicates no flood risk and 1 represents the highest risk. Based on the Jenks natural breaks method, the flood hazard risk was classified into five levels within ArcGIS to map its spatial distribution in the study area: extremely low, low, moderate, high, and extremely high.

2.5. Floodwater Extraction

Floodwater was extracted based on FY-3D Medium-Resolution Spectral Imager (MERSI) imagery on 3 August 2022 and 31 August 2022 in Pakistan. The extraction process involved four phases. Cloud shadows are particularly vulnerable to misclassification as water due to their low reflectance in optical remote sensing. Firstly, cloud shadows were removed by constructing a spherical geometric projection relationship model between clouds and cloud shadows [32]. Second, the water bodies were automatically extracted by selecting the optimal threshold based on the maximum between-class variance algorithm (OTSU) method [33]. Third, terrain shadows share similar spectral features with floodwaters, making them easily detected as water bodies by flood detection algorithms based on optical spectral features. Terrain shadows were removed by an object-based method based on quantitative surface roughness parameters [34]. Finally, the floodwater bodies were quantitatively delineated by comparing the post-flood water bodies (31 August) with the pre-flood background water bodies (3 August).

3. Results

3.1. Estimated Flood Hazard Risk

In August 2022, Pakistan experienced continuous monsoon rainfall that broke a 30-year record, resulting in nationwide rainfall that doubled the average amount and was more than four times the usual rainfall in some local areas. The record-breaking rainfall triggered extreme flooding across Pakistan. As a result, one-third of Pakistan was submerged due to extreme flooding, and one-seventh of the population was affected, with the most severely affected provinces being Balochistan, Punjab, and Sindh.
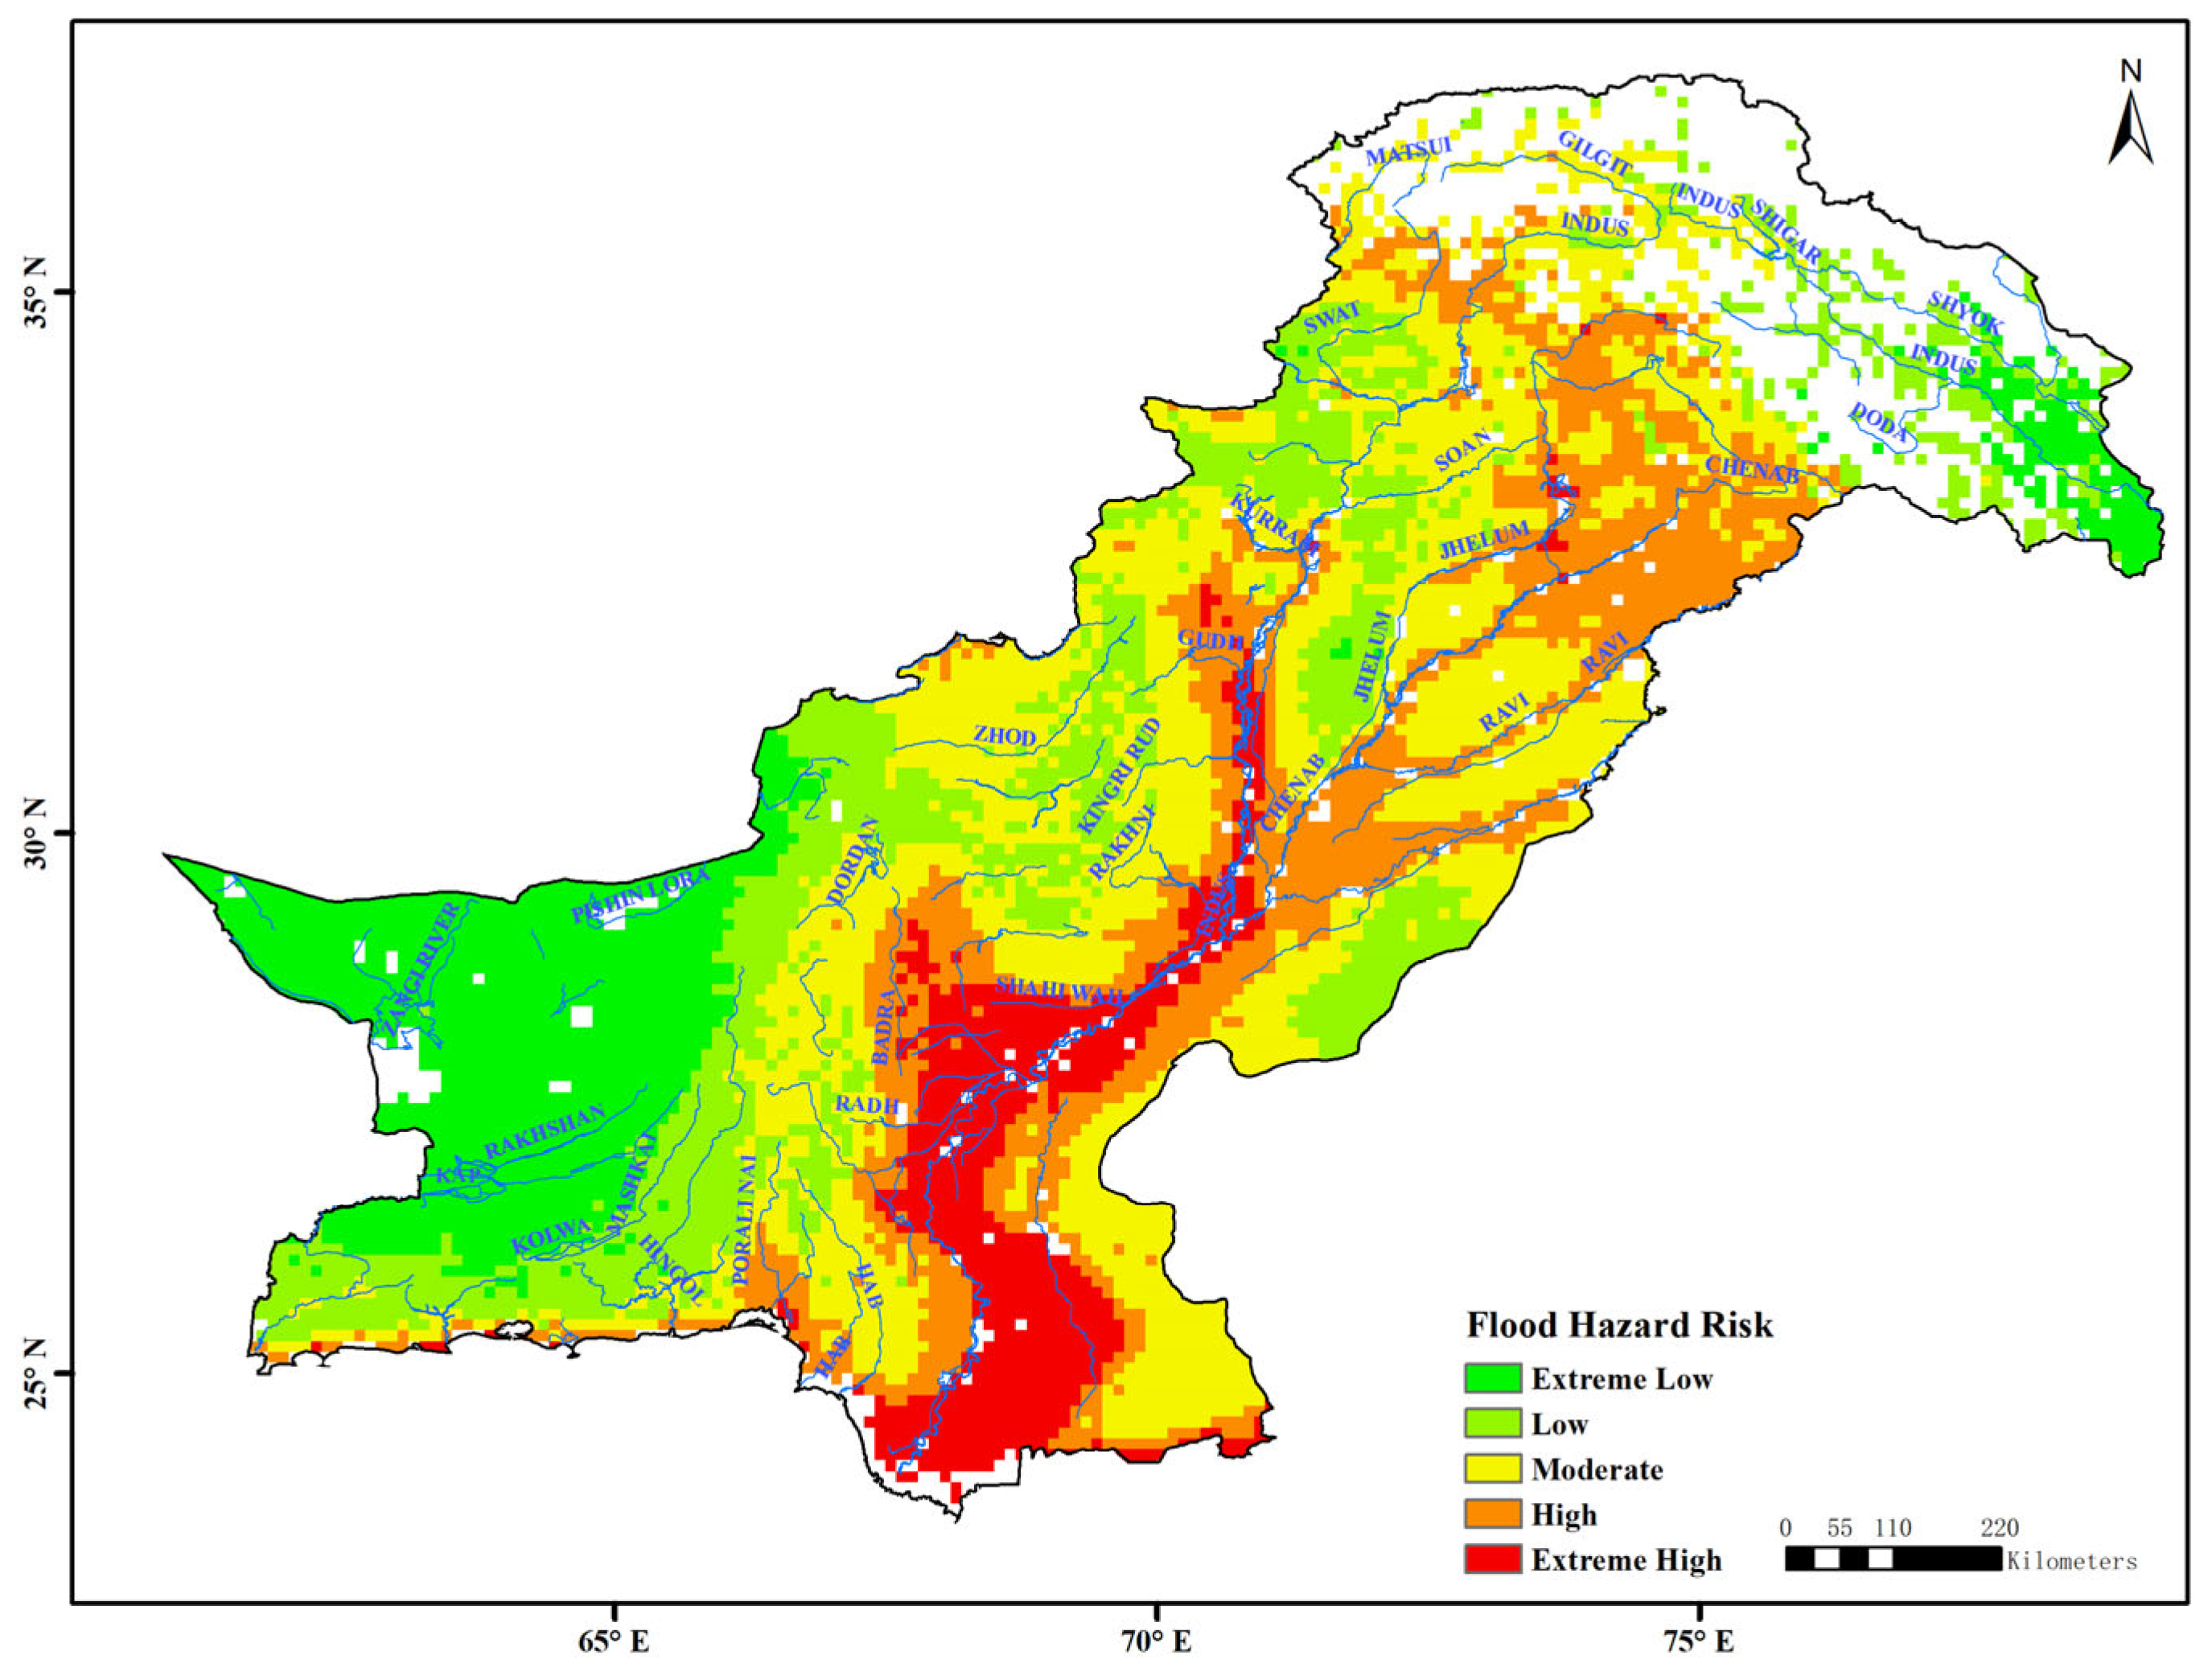
We estimated the flood hazard risk for this event using our proposed method. The spatial distribution of the estimated flood hazard risk is presented in Figure 2. The results indicate that Pakistan experienced moderate-to-high flood hazard risk, mainly along both banks of the Indus River, and to a lesser extent in the northeastern regions. Widespread areas with moderate- to extremely high-level flood hazard risk were identified in the Balochistan and Sindh provinces of southern Pakistan. The area percentages for the flood hazard risk levels—extremely low, low, moderate, high, and extremely high—were 16.2%, 20.9%, 33.5%, 20.0%, and 9.4% of Pakistan’s total area, respectively. Flood hazard risk classification is influenced by the classification threshold. We examined the sensitivity of the results to common methods, finding that the standard deviation of the proportion of areas with different flood risk levels ranges from 3.4% to 9.9%. The values for high and extremely high levels were 9.9% and 7.8%, respectively. This indicates that flood hazard risk varies significantly due to differences in classification methods. Appropriate thresholds are important for flood hazard risk classification.

3.2. Model Evaluation and Results Validation

The sediment factor plays a critical role in exacerbating flood severity and increasing flood risk. To investigate the influence of the sediment factor on flood hazard risk assessment, a comparative analysis was performed between the traditional model and our improved FRM. Firstly, the improved flood model was performed as a standard assessment with the seven indicators. Then, the traditional flood model was conducted as the comparison, which was similar to the standard assessment but without the sediment thickness as input for flood hazard risk assessment. Hence, the contribution of sediment thickness to flood hazard risk was quantified by subtracting the results of the comparison assessment from those of the standard one.
The findings showed that the underestimated areas occur mainly along the Indus River and its surroundings, where sediment deposition exerts a dominant influence. Without sediment thickness as an input, the traditional model underestimated the flood risk by 4.3% on average across sediment-rich areas of the Indus River (Pakistan), but by up to 23.3% in the central Indus River where sediment thickness is high, relative to the improved FRM. The underestimated flood risk area in the severe flood disaster of 2022 accounts for 21.2% of Pakistan’s total area. The areas of moderate and high risk in the traditional model decreased by 4.0% and 2.1%, respectively. The results of spatial distribution show that the flood risk in the sediment-affected areas along the Indus River (Pakistan) was significantly underestimated, especially in the middle and lower reaches where sediment thickness is high—reaches that were inundated during the 2022 catastrophic flood disaster. Further analysis reveals that 70.2% of inundation areas coincide with regions of underestimated flood risk.
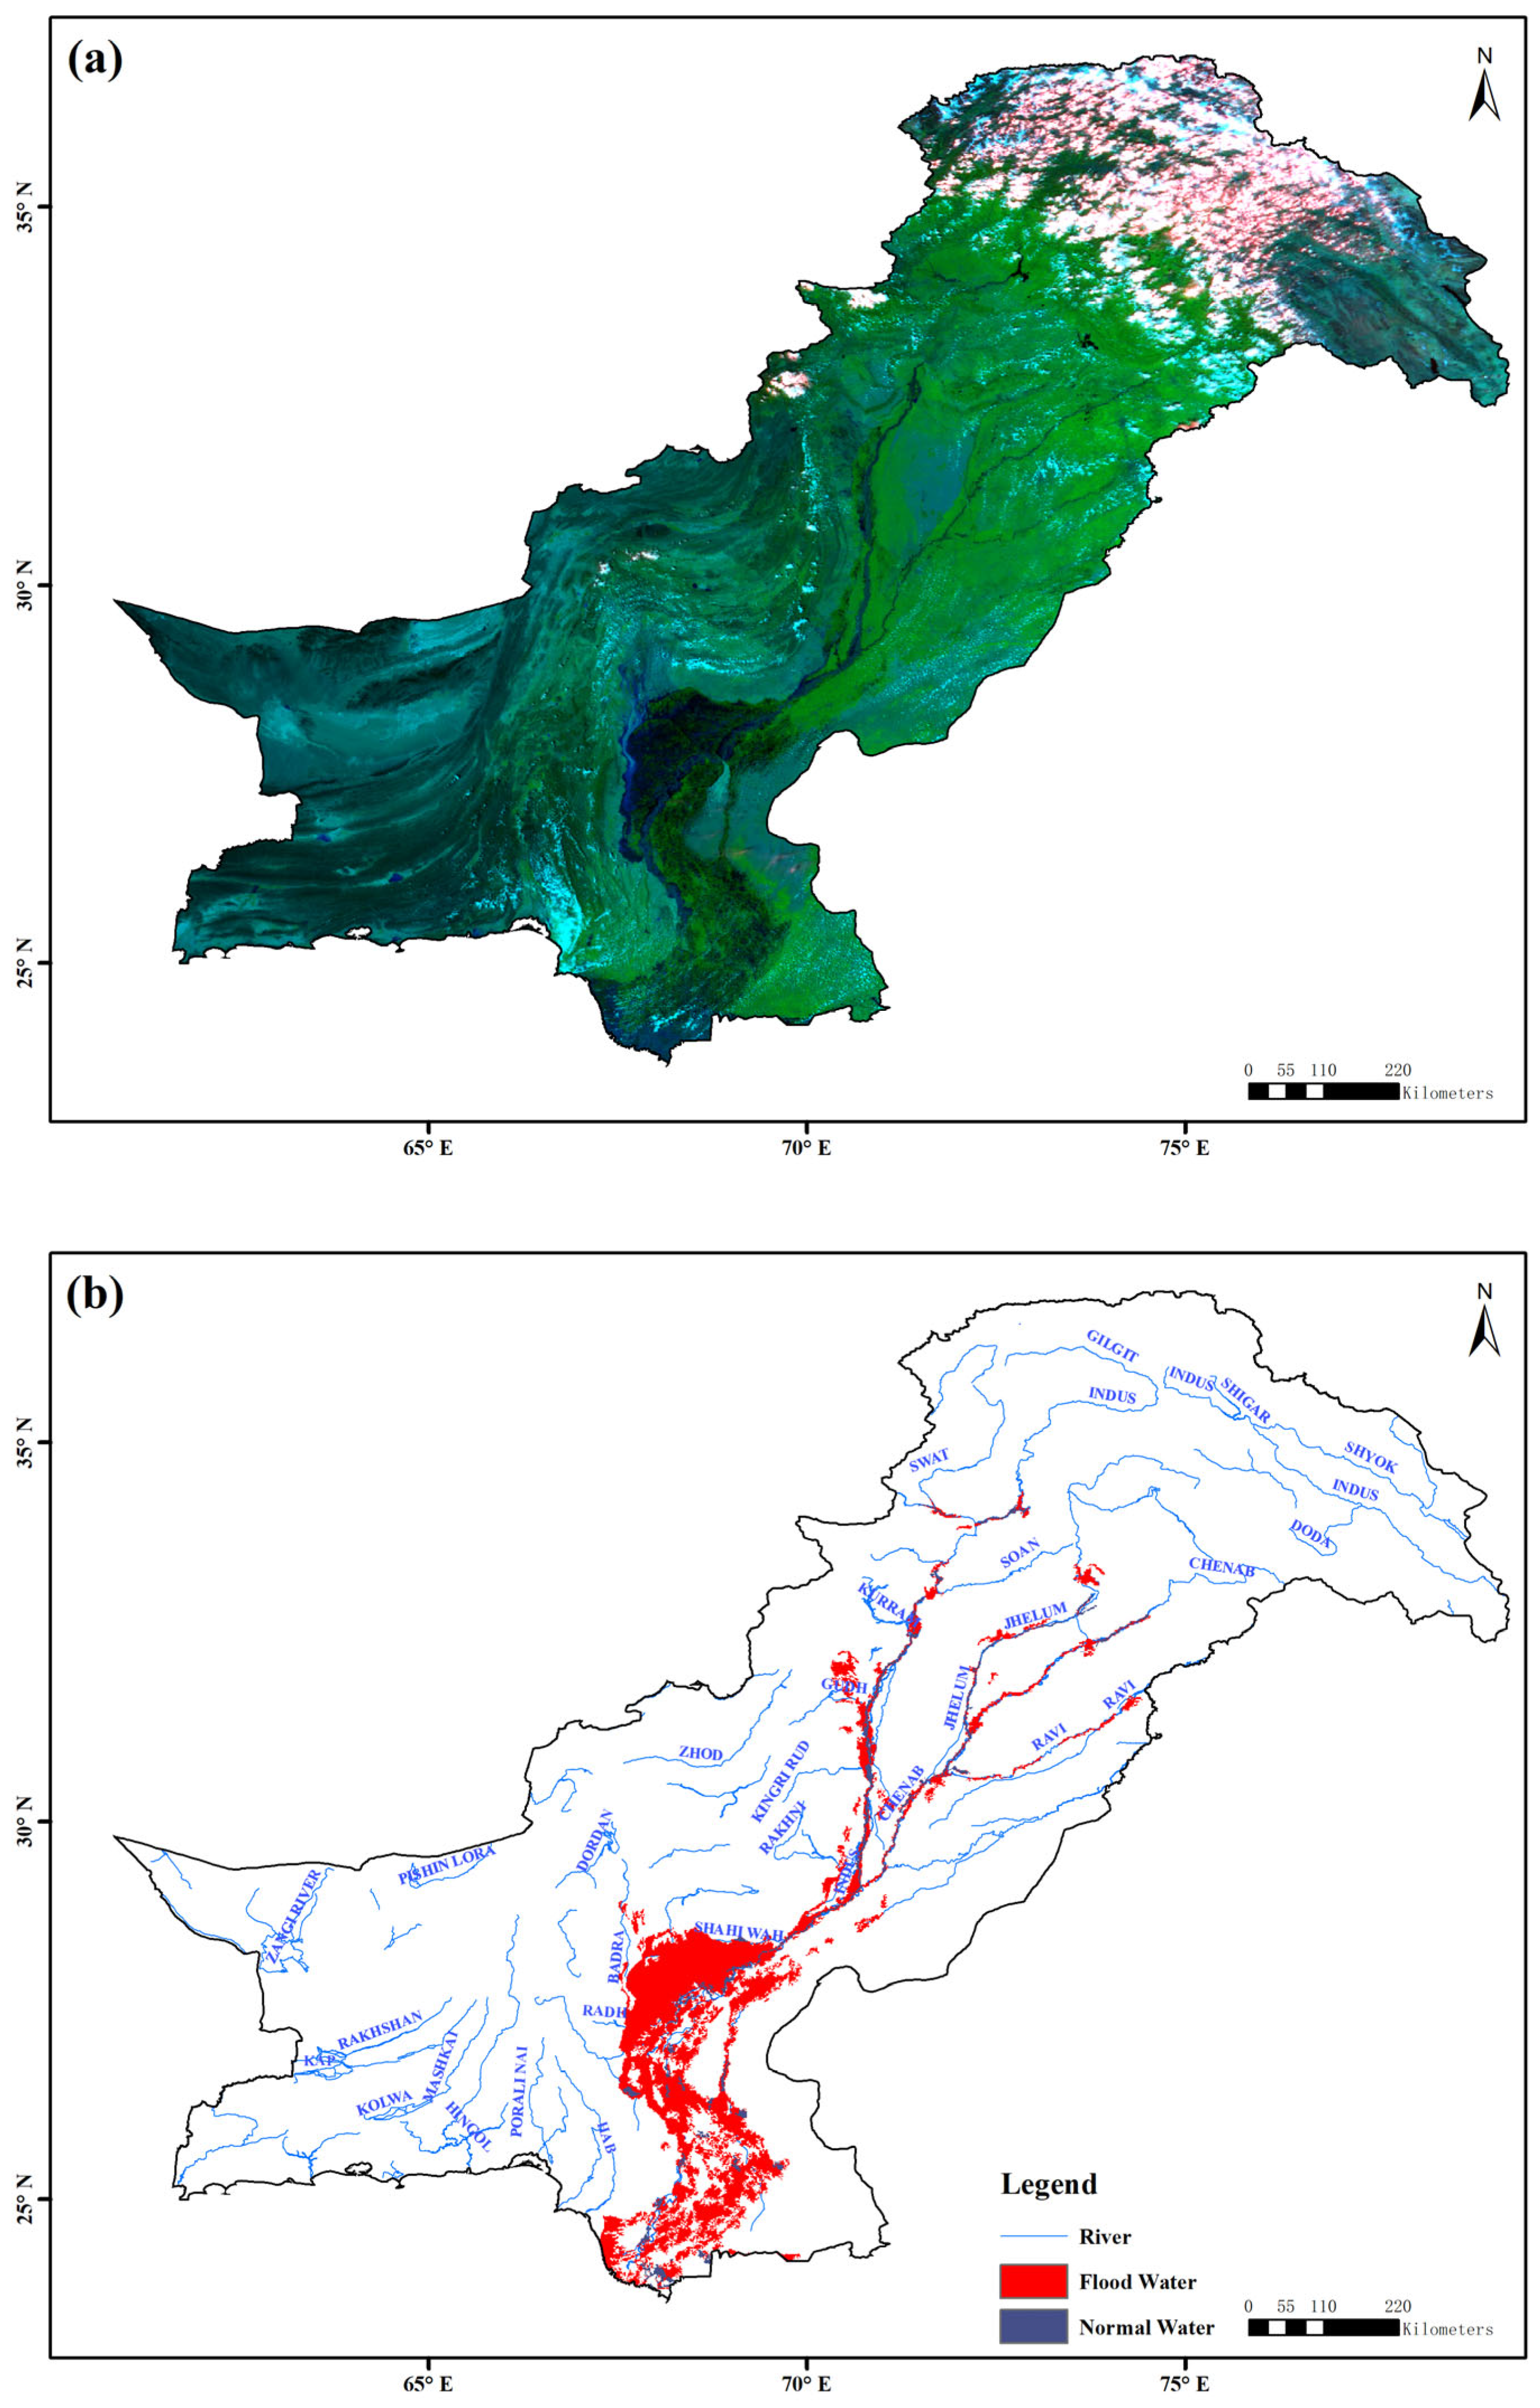
The composite color image of FY-3D obtained on 31 August 2022 shows noticeable water bodies (shown in blue) across southeastern, central, and northeastern Pakistan (Figure 3a). The floodwater bodies derived from FY-3D satellite imagery before and after the disaster are presented in Figure 3b, including floodwater and permanent water bodies. This shows that extensive regions were inundated due to extreme rainfall. Spatially, flooding was particularly evident along the Indus River Basin, affecting most of Sindh Province, eastern Balochistan Province, and central Punjab Province. Significant inundation also occurred on both banks of the Jhelum River, Chenab River, Ravi River, and Sutlej River. The total area of floodwater bodies in Pakistan is estimated to be about 5.0 × 10⁴ km2. To investigate the accuracy of floodwater extent derived from FY-3D imagery, we applied the identical method to Moderate-Resolution Imaging Spectroradiometer (MODIS) Terra imagery from 31 August 2022, and we calculated the confusion matrix. The overall accuracy was 93.6%, indicating a high level reliability. As expected, the spatial distribution of flood hazard risk closely aligns with the extent of floodwater bodies. The comparison reveals that the significantly increased floodwater bodies are concentrated in the areas classified as high- and extremely high-level flood hazard risk in Pakistan, as identified by the improved method in this study (Figure 2). The statistics on floodwater bodies falling in various flood risk level areas are shown in Table 5. Of floodwater bodies identified from FY-3D satellite imagery, 80.0% and 18.1% fall within high-level and extremely high-level flood hazard risk areas under our improved method, respectively, while 77.8% and 17.2% fall within those areas under the traditional models. The confusion matrix-based validation shows that the overall accuracy, the true precision rate (TPR), and the F1-score are 0.949, 0.869, and 0.650, respectively. The findings demonstrate that the flood hazard risk derived from this work is consistent with the actual floodwater extent, effectively capturing the distribution of the flood hazard risk and providing a comprehensive assessment of risk levels across Pakistan.

3.3. Estimation of Flood Hazard Influence

The quantitative effects of severe flood hazard on Pakistan’s population, cropland, and urban areas were assessed using socioeconomic data from the year 2022 (Table 6). The findings indicate that Pakistan’s socioeconomic situation was significantly influenced by the August 2022 flood disaster. The impacted population, cropland, and urban area in extremely high-level risk areas were approximately 2.8 × 10⁷ people, 4.0 × 10⁴ km2, and 1.0 × 10³ km2, respectively. The actual population, cropland, and urban area impacted by this flood disaster were also quantified by statistics, and the results show that approximately 2.1 × 10⁷ people, 3.5 × 10⁴ km2, and 0.3 × 10³ km2 of urban area are situated within the inundation regions of Pakistan. Our impact assessment results are in excellent agreement with previous findings, which show that the unprecedented 2022 monsoon floods in Pakistan affected 33 million people and caused extensive loss of life, infrastructure, and crops [21,24].

3.4. Analysis of Flood Causes

3.4.1. Extreme Rainfall in the Monsoon Season

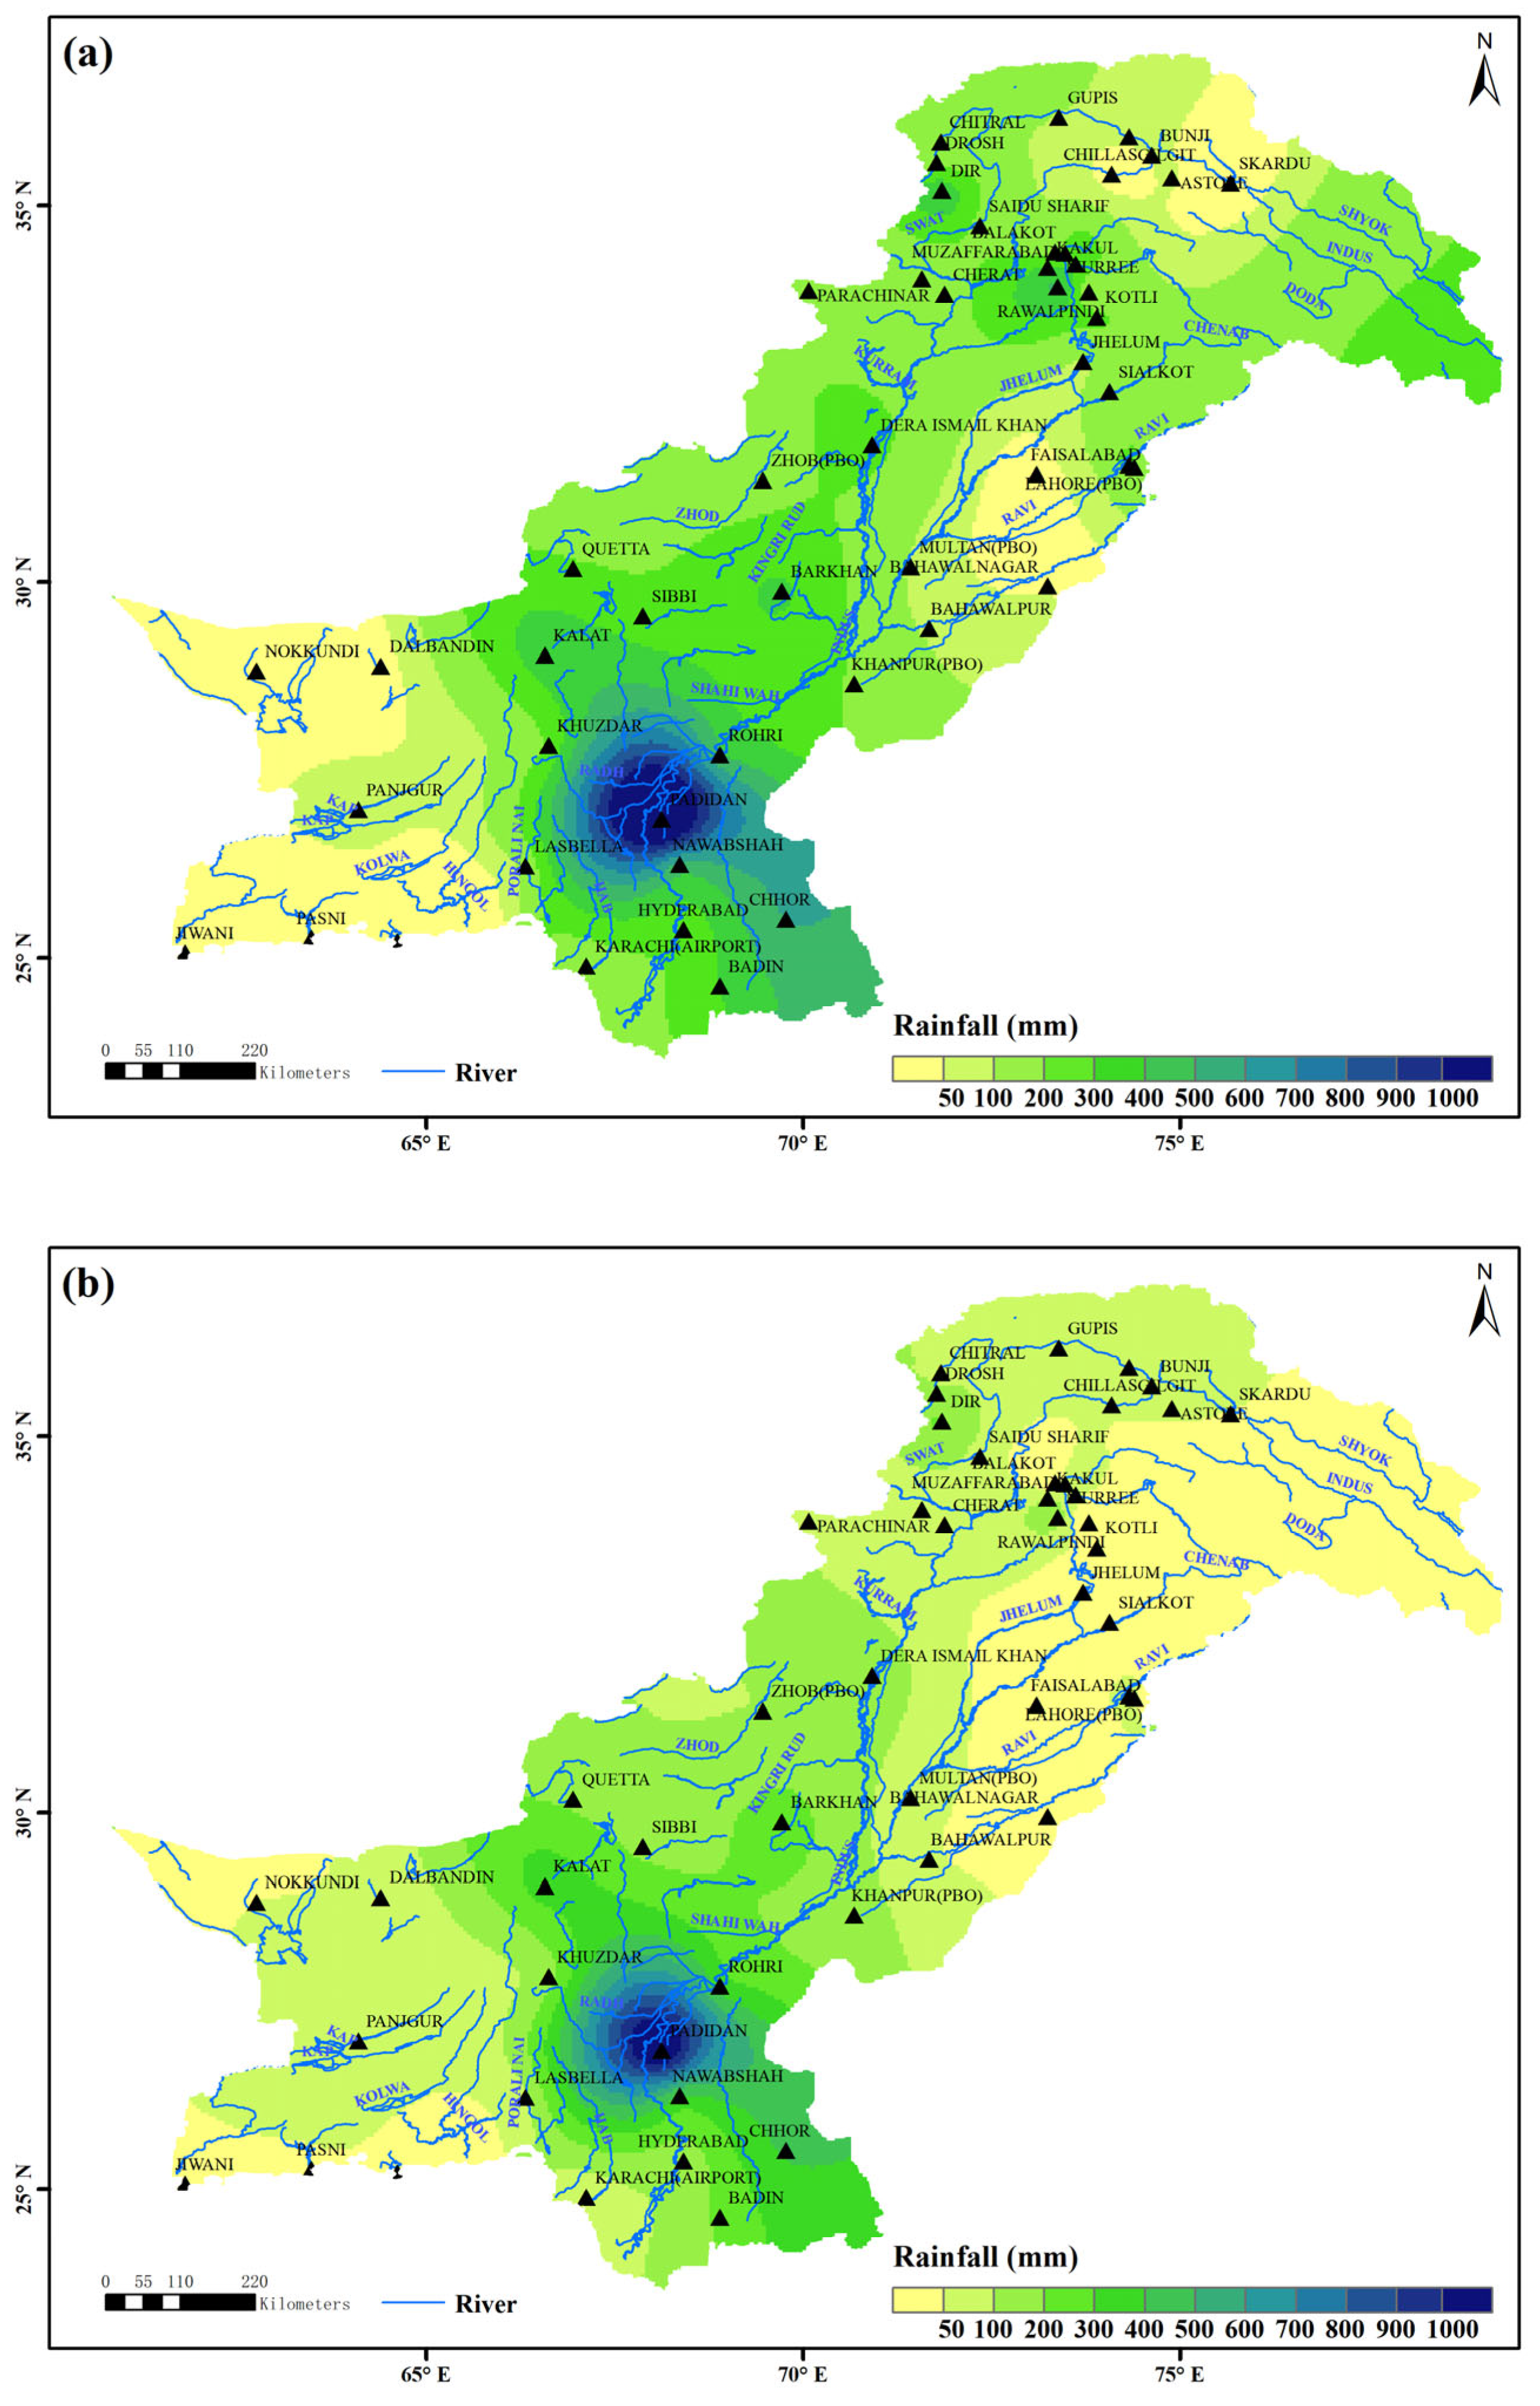
Satellite image from 18–26 August shows a cyclonic cloud cluster moving from the Bay of Bengal to southern Pakistan, which, combined with a slow-moving cyclonic cloud cluster over the Arabian Sea, led to excessive rainfall and severe flooding in southern Pakistan, particularly in Sindh and Balochistan. Based on rainfall data from 50 ground observation stations across Pakistan, we interpolated the average August rainfall (1961 to 2021) and the August 2022 rainfall using the spline interpolation method. The rainfall anomaly for August 2022 relative to the 1961–2021 average was calculated. The results show that Pakistan experienced extreme rainfall during August 2022, with over 300 mm falling in the northwestern and southeastern regions, while parts of Sindh and Balochistan in the southeast exceeded 800 mm (Figure 4a). Relative to the 1961–2022 average, precipitation in 2022 in most parts of Sindh and the central and northern parts of Balochistan reached 200–300 mm, more than two to three times the historical average. Moreover, a pronounced rainfall anomaly (>600 mm) was observed in northern Sindh, Pakistan (Figure 4b). These regions agree well with the high- and extremely high-level flood hazard risk zones identified by our method, and they match the floodwater extent detected by the FY-3D meteorological satellite (Figure 3). Notably, the long-term cumulative effects of the torrential monsoon rainfall ultimately led to widespread flooding across Pakistan.
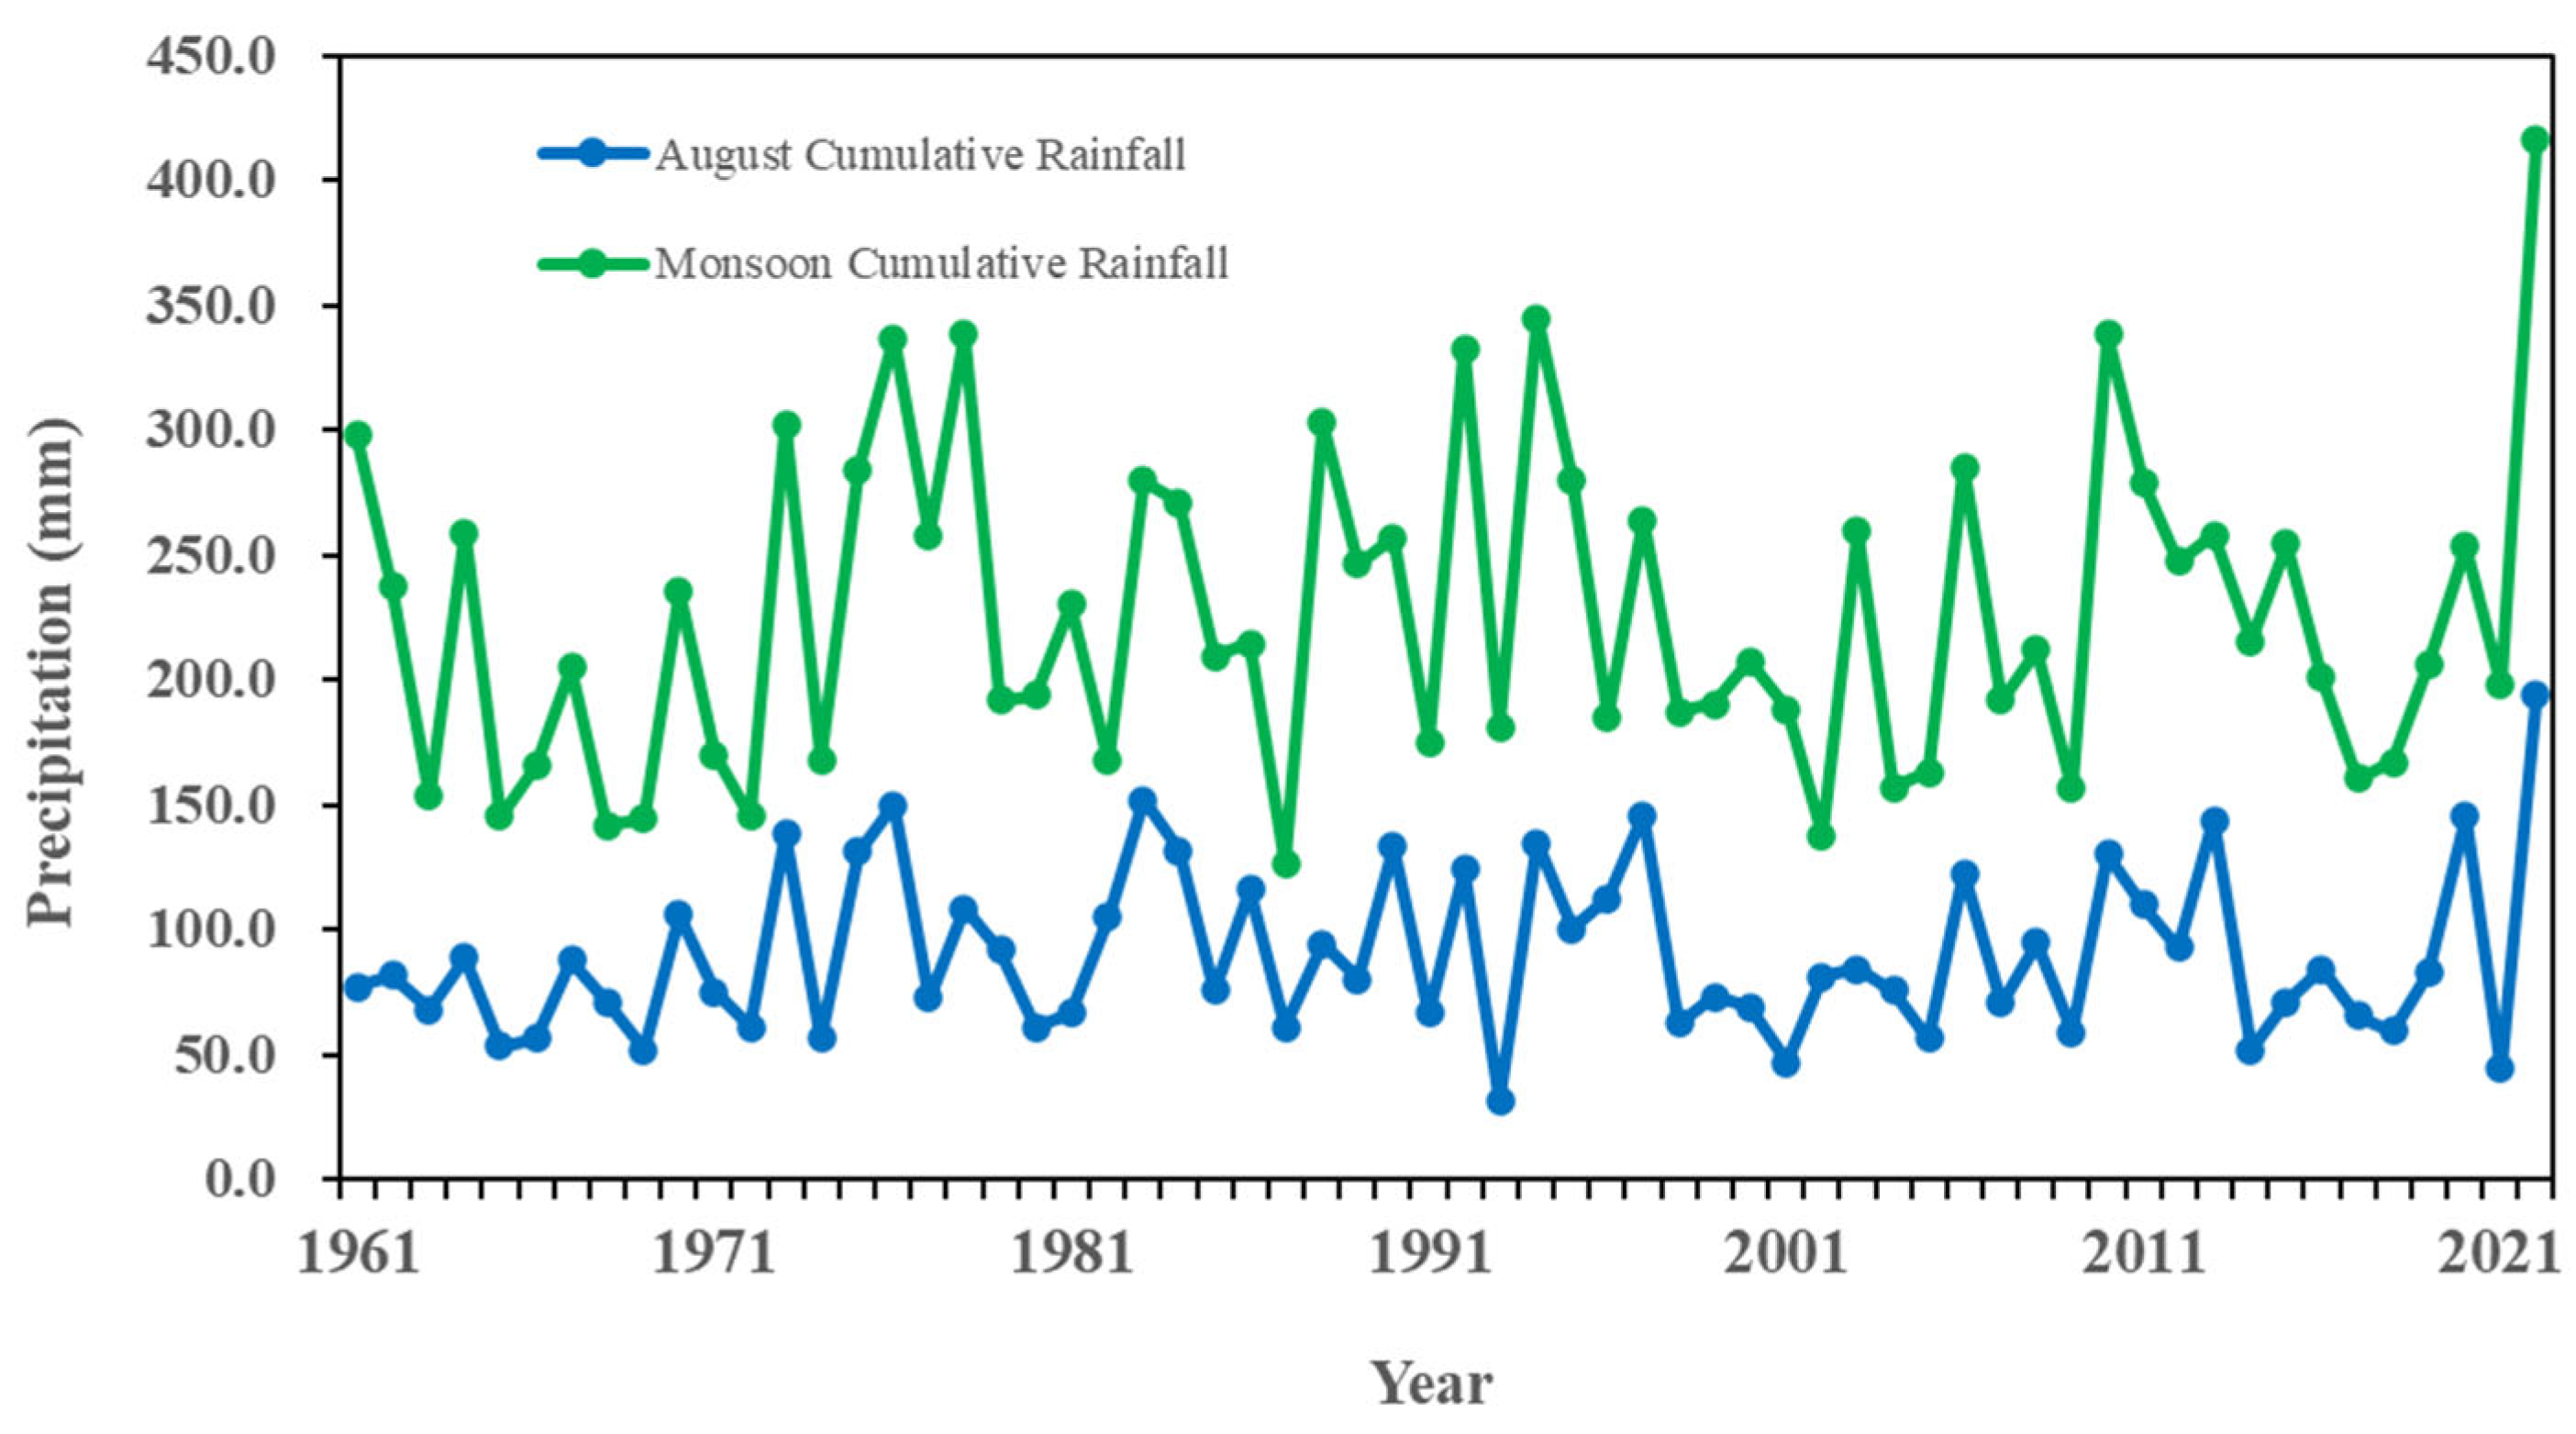
Based on the statistical results from 50 ground meteorological observation stations across Pakistan, it was found that August 2022 was the wettest month since 1961, recording an average rainfall of 193.4 mm—more than three times the historical average—and contributing 46.6% of the total monsoon rainfall. Figure 5 shows the interannual variation in cumulative rainfall in August and the monsoon season (July–August–September) over 1961–2022. The cumulative rainfall in August (193.4 mm) and the monsoon season (414.9 mm) in 2022 are 2.2 times and 1.9 times the 1961–2021 means, respectively. Additionally, before the flood event, the cumulative rainfall in July 2022 also reached a historical record of 198.1 mm. Among the 38 ground observation stations with historical cumulative rainfall data (1961–2021), 12 stations recorded cumulative rainfall in July more than four times the historical average. It was found that the PADIDAN station, located in the rainfall center, recorded 14.7 times the cumulative rainfall of the same period from 1961 to 2021. Extraordinary area-weighted rainfall occurred in Sindh and Balochistan, with the historical values of 442.8 mm and 154.9 mm from 1961 to 2021, which are 7.9 times and 5.9 times the average, respectively. Meanwhile, ground observation stations in northwestern mountainous regions of Pakistan also recorded extreme cumulative rainfall in July and August 2022, which was 93.5% and 170.1% above the average from 1961 to 2021. Abnormally high rainfall in the upper reaches of the Indus River generated substantial runoff that flowed into Balochistan, Sindh, and Punjab. Obviously, unusually extreme rainfall in August, coupled with the record-breaking rainfall in July, was the main driver of the devastating flood disaster in Pakistan.

3.4.2. Impact of Soil Moisture and Glacier Melting

Soil moisture plays a considerable role in flooding due to its infiltration capacity to regulate flood storage capability. Several rainfall events in July, before the flood disaster, raised water levels in the Indus, Jhelum, Chenab, Ravi, and Sutlej rivers and increased soil moisture across the southern, central, and western alluvial plains of Pakistan. Extreme rainfall on wet antecedent soil moisture conditions leads to a higher probability of flooding. The FY-3D soil moisture product showed that positive soil moisture anomalies persisted across central and southern regions in Pakistan. Soil moisture from July to August exceeded more than 100% in most regions during the same period in 2021. The prolonged extreme rainfall from July saturated the soil before the record-breaking rainfall in August, creating highly conducive conditions for the 2022 severe flood in Pakistan. The extreme rainfall on wet antecedent soil moisture conditions was a critical driver of the flooding.
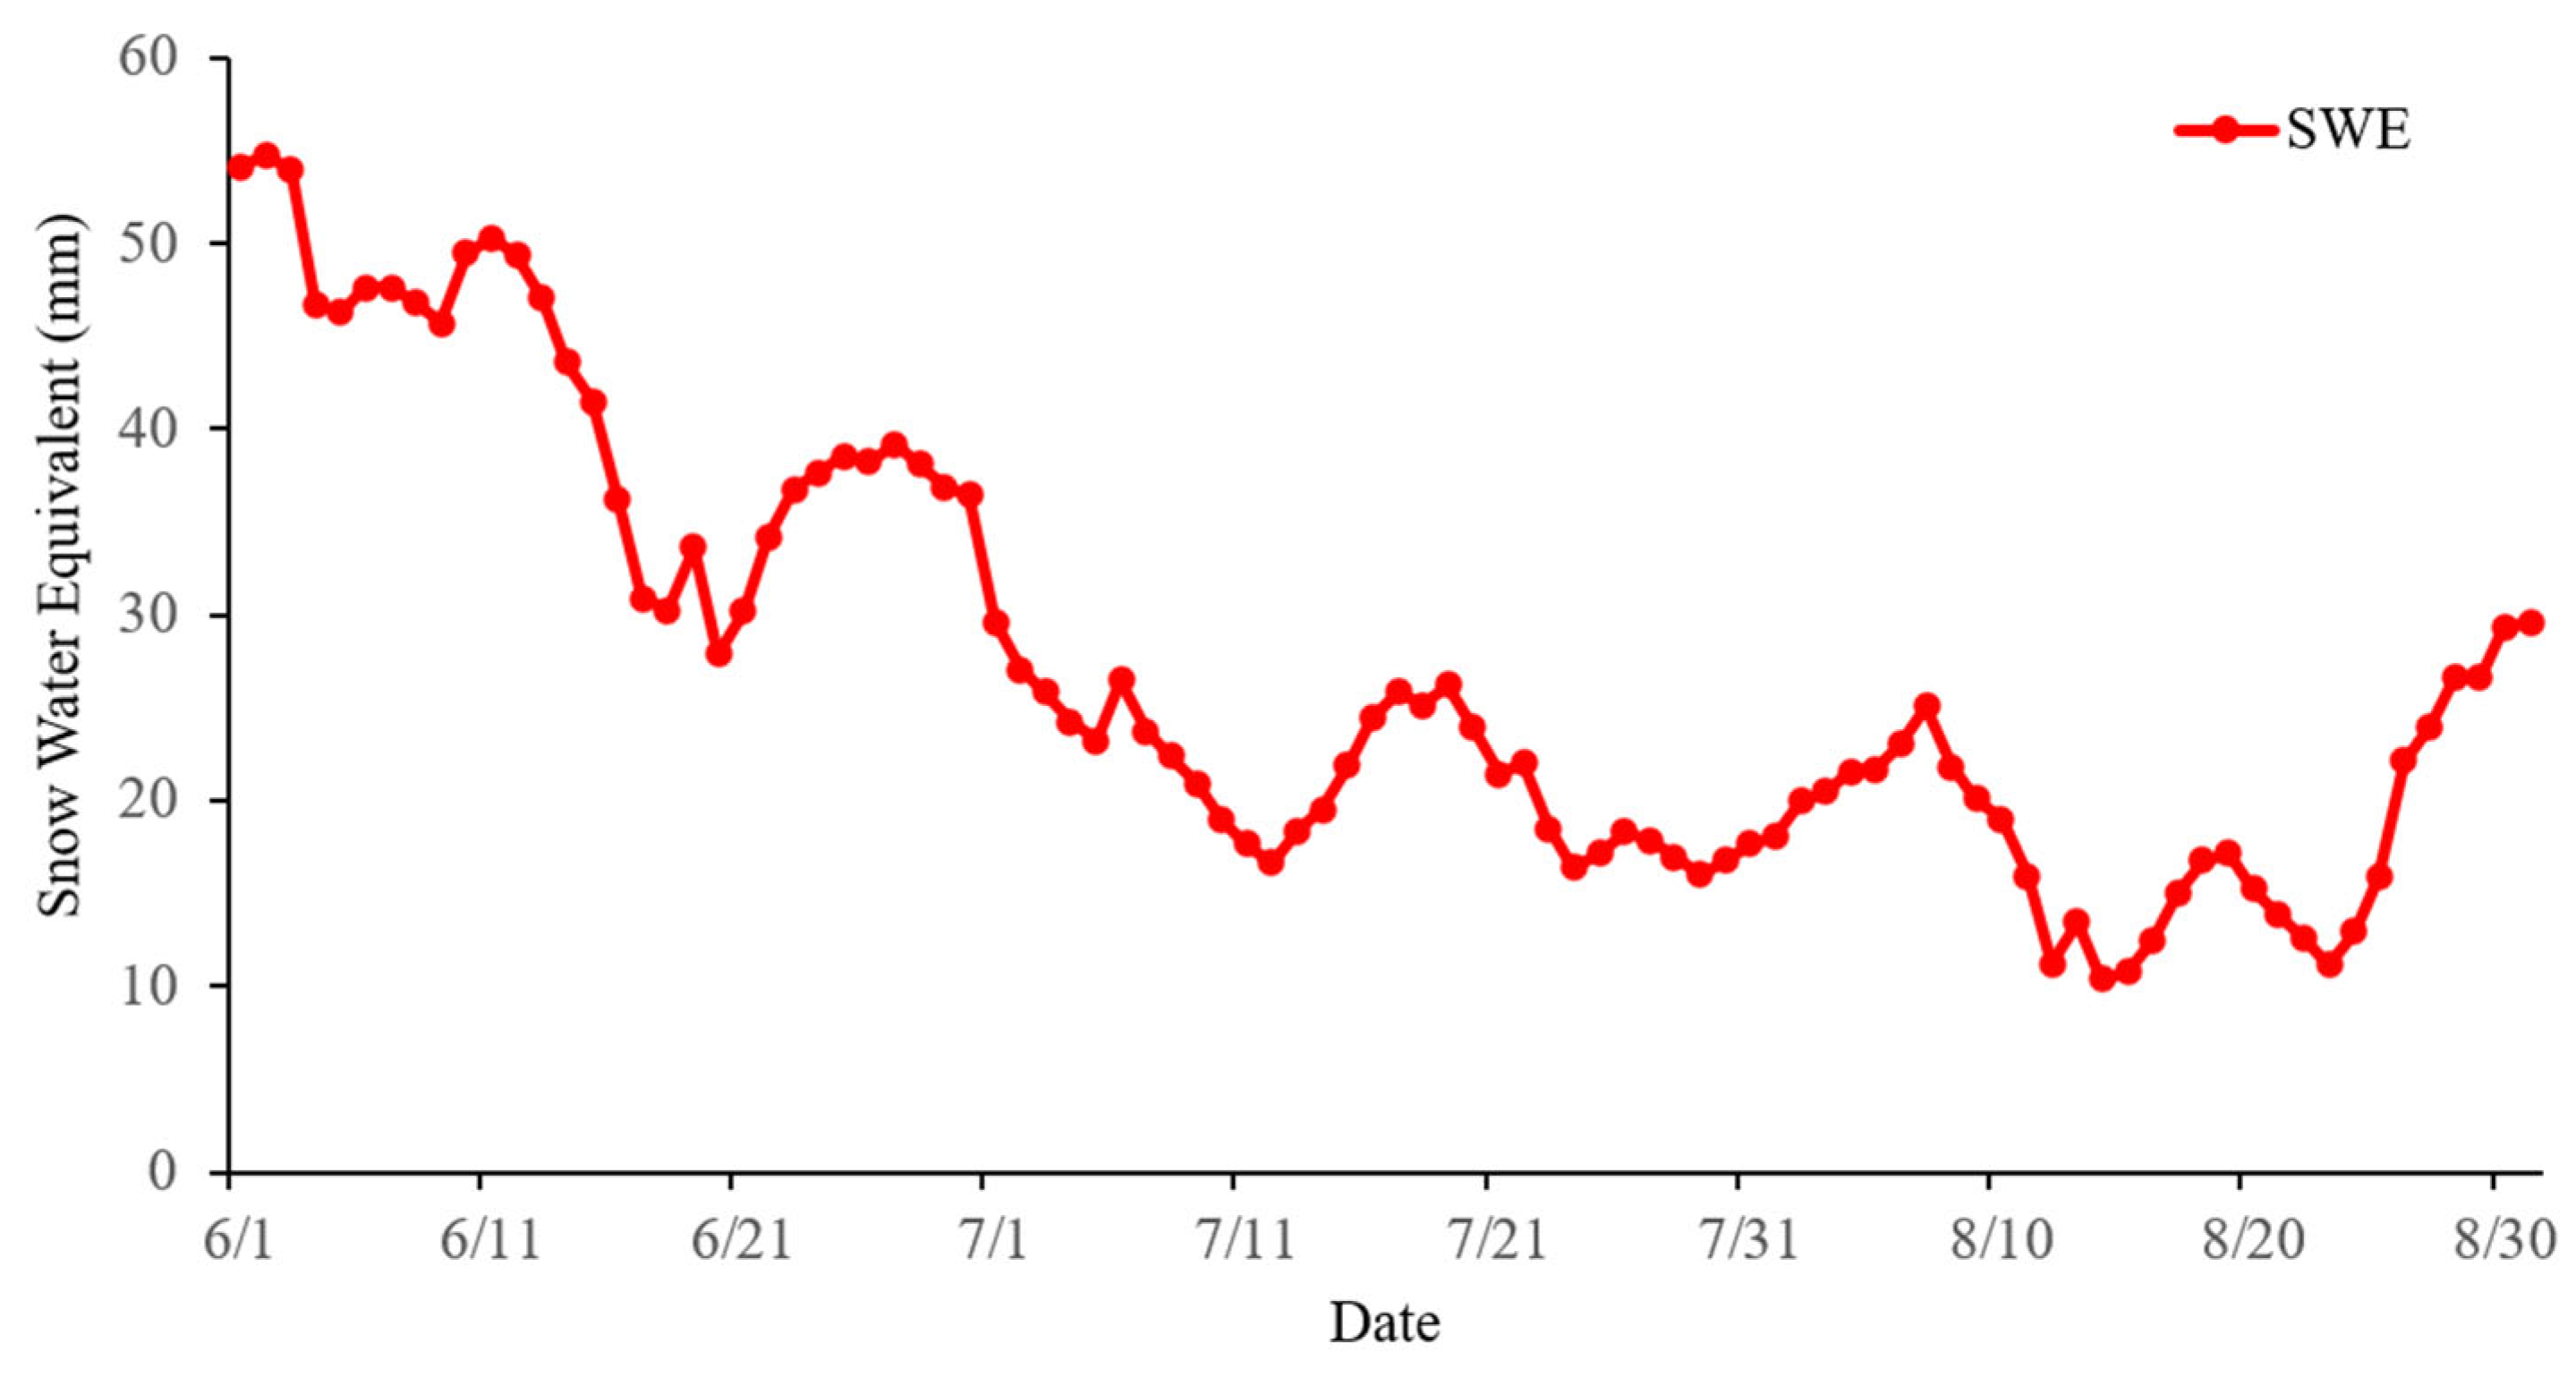
Pakistan is one of the world’s major glacier centers; 60% of the water in the Indus River comes from the melting of snow on the Tibetan Plateau and the Pamir Plateau. Thus, glacier melt caused by global warming was considered to be a critical driver of floods in Pakistan. Observations show that a heatwave occurred from March to May 2022 in Pakistan, with the average temperatures in most areas 5 to 8 °C higher than the historical average. The sustained abnormally high temperatures caused the premature melting of glaciers and snow, leading to an increase in the water level of the Indus River. Subsequently, the abnormal rainfall from June to July gradually increased the soil moisture, and the flood hazard risk continued to increase. From June to August 2022, the daily snow water equivalent (SWE) in northern Pakistan, measured by FY-3D MWRI, decreased rapidly from June to July, driven by the heatwave, but declined more slowly in August (Figure 6). This suggests that the rapid glacier melting before the flood disaster raised water levels in the Indus River and increased the risk of flooding, whereas glacier melt in August was not the main driver of the flood disaster.
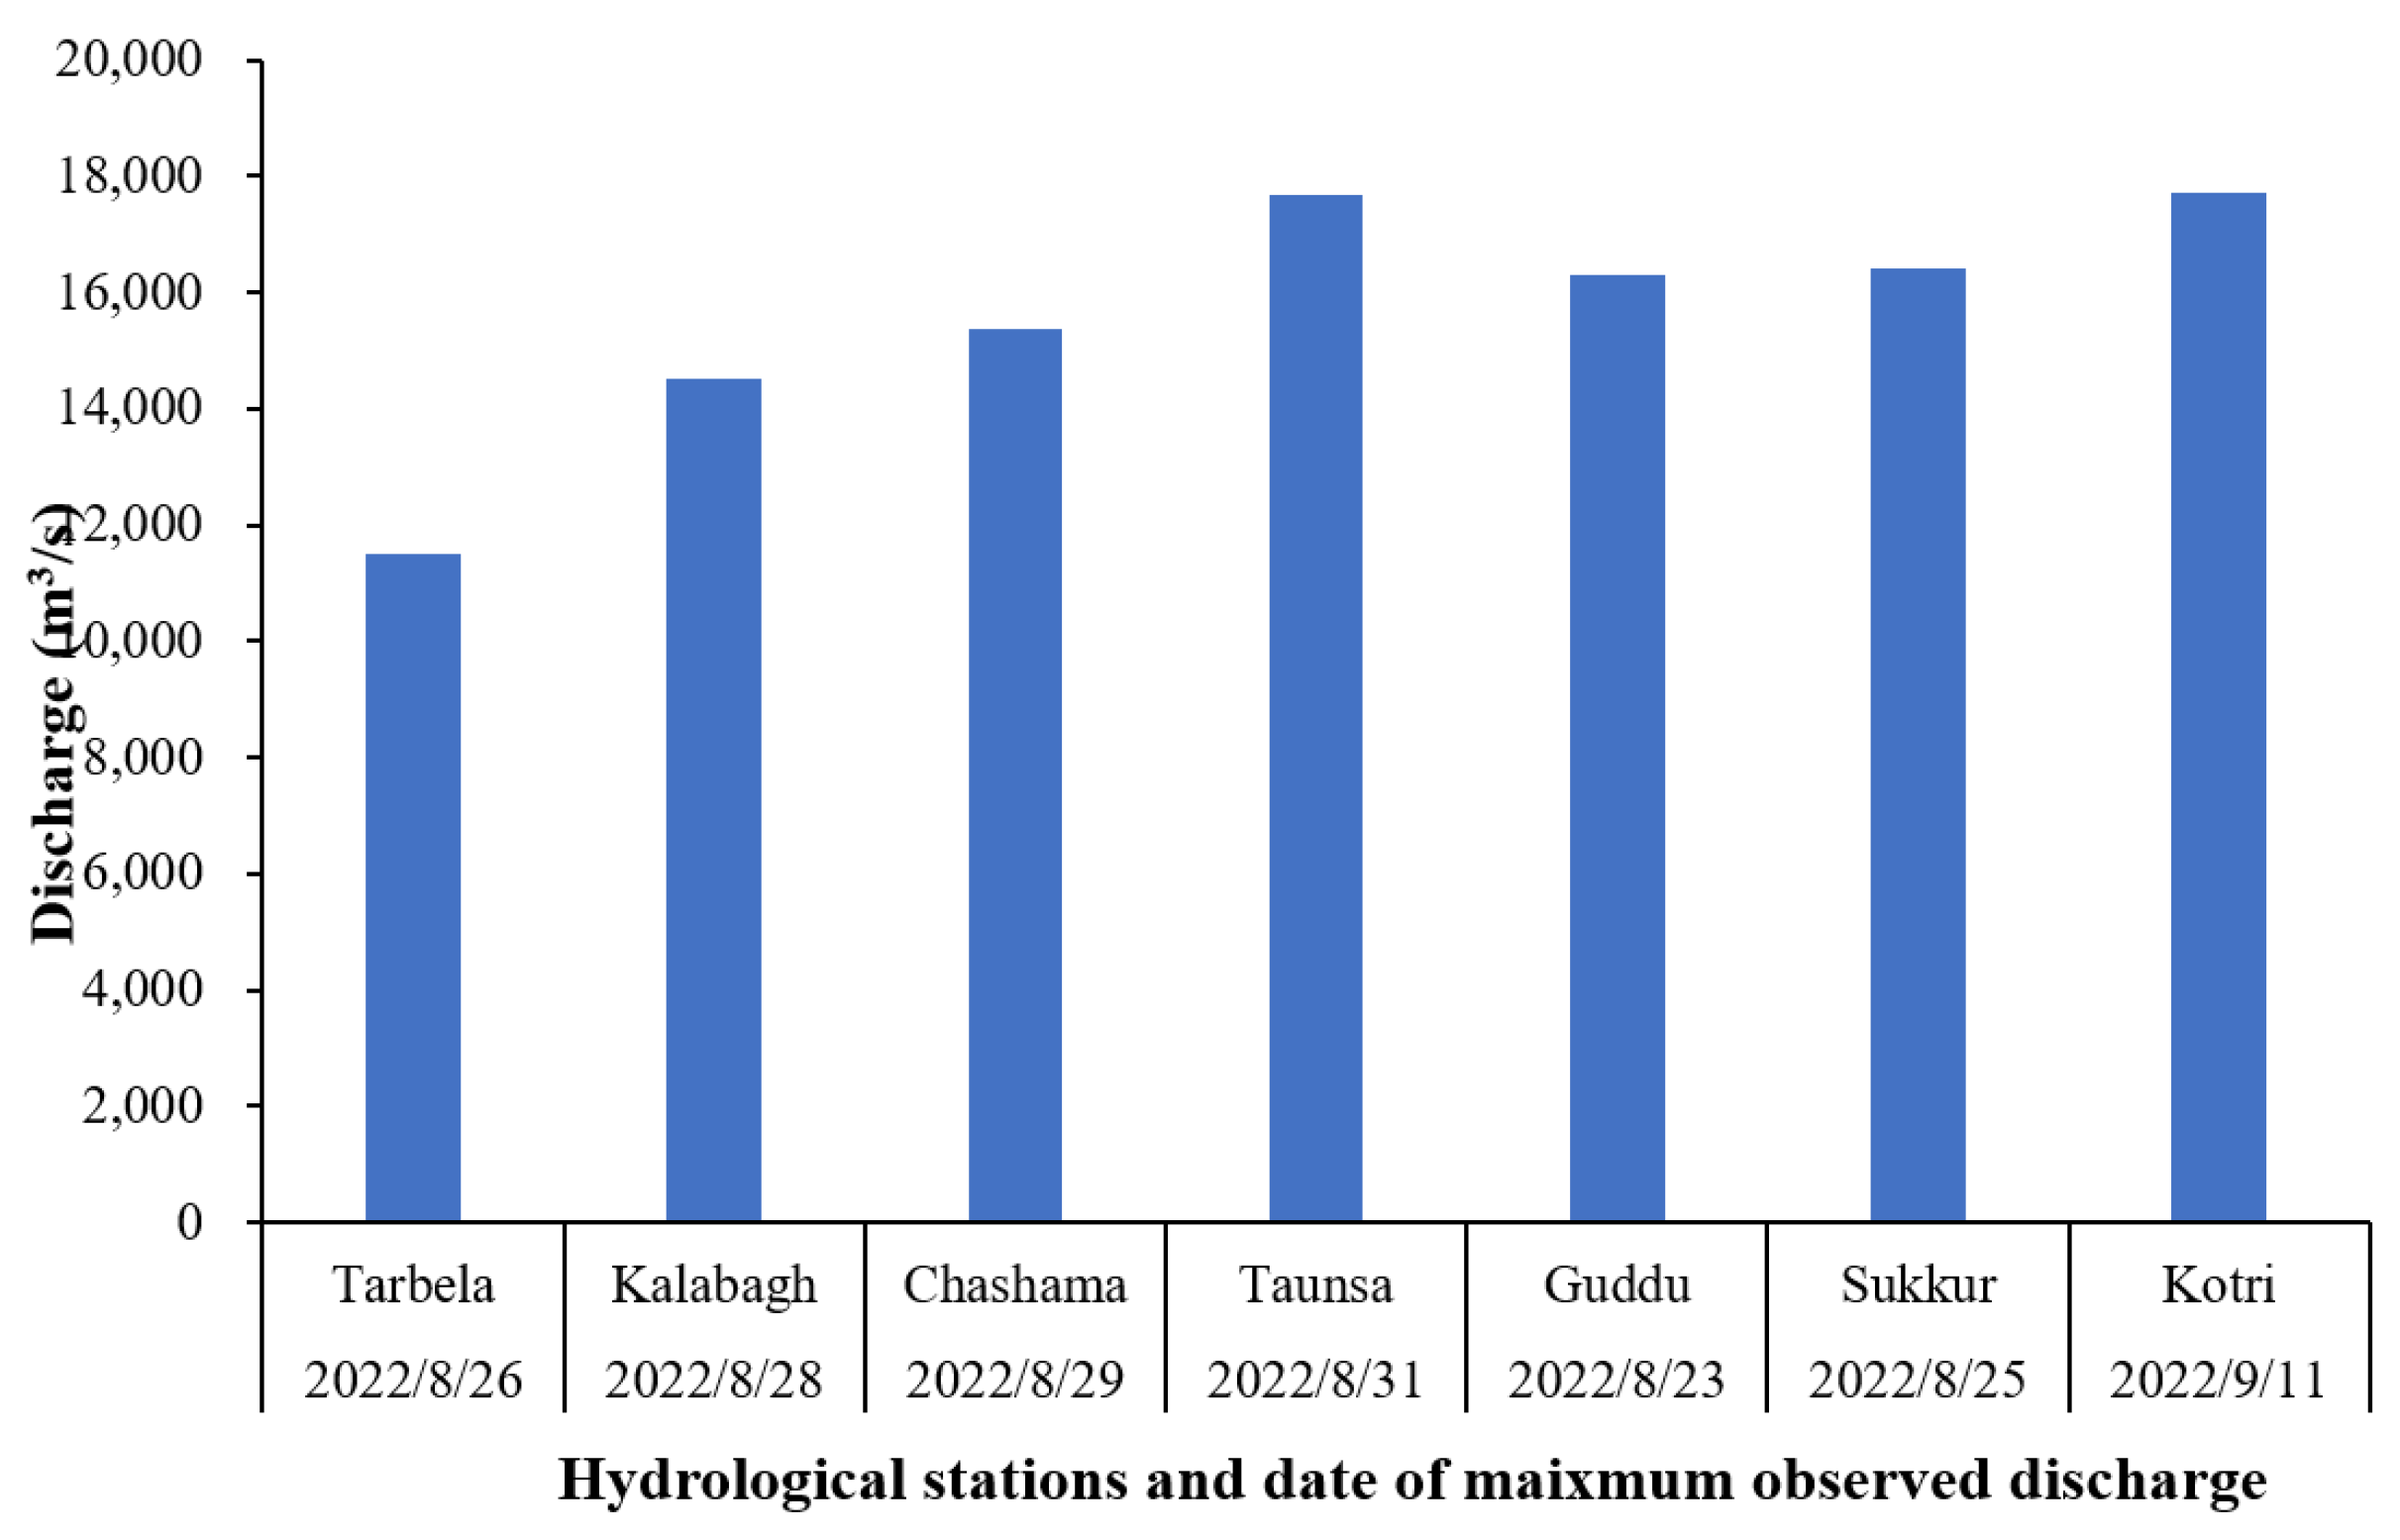
Analysis of hydrological observation data from stations along the Indus River revealed the maximum discharge during August 2022 (Figure 7). At the Tarbela, Kalabagh, Chashana, and Taunsa hydrological stations in the upper reaches, peak flow discharge ranged from 12,000 to 18,000 m3/s between 26 and 31 August. In the middle reaches, the Guddu and Sukkur hydrological stations recorded maximum flow discharge of approximately 16,000 m3/s on 23 and 25 August. In the lower reaches, the Kotri hydrological station received its peak flow discharge of 18,000 m3/s on 11 September. These observations indicate that extreme rainfall in the middle reaches of the Indus River was a critical factor causing floods in central Pakistan, while sustained high flow discharge from the upstream further exacerbated flooding along the Indus River in southern Pakistan. From 22 to 26 August, QPE products from the FY-4B satellite show heavy rainfall moving from southeastern to northwestern Pakistan. Notably, extreme rainfall occurred in the middle reaches of the Indus River from 23 to 25 August, moving to the upper reaches on 26 August. The extreme rainfall observed by the FY-4B satellite was broadly consistent with the peak flow discharge recorded at hydrological stations along the Indus River, confirming that extreme rainfall was the primary cause of severe flooding, with only a minor contribution from glacier melt in northern Pakistan.

3.4.3. Sediment Deposition Amplified Flood Risk

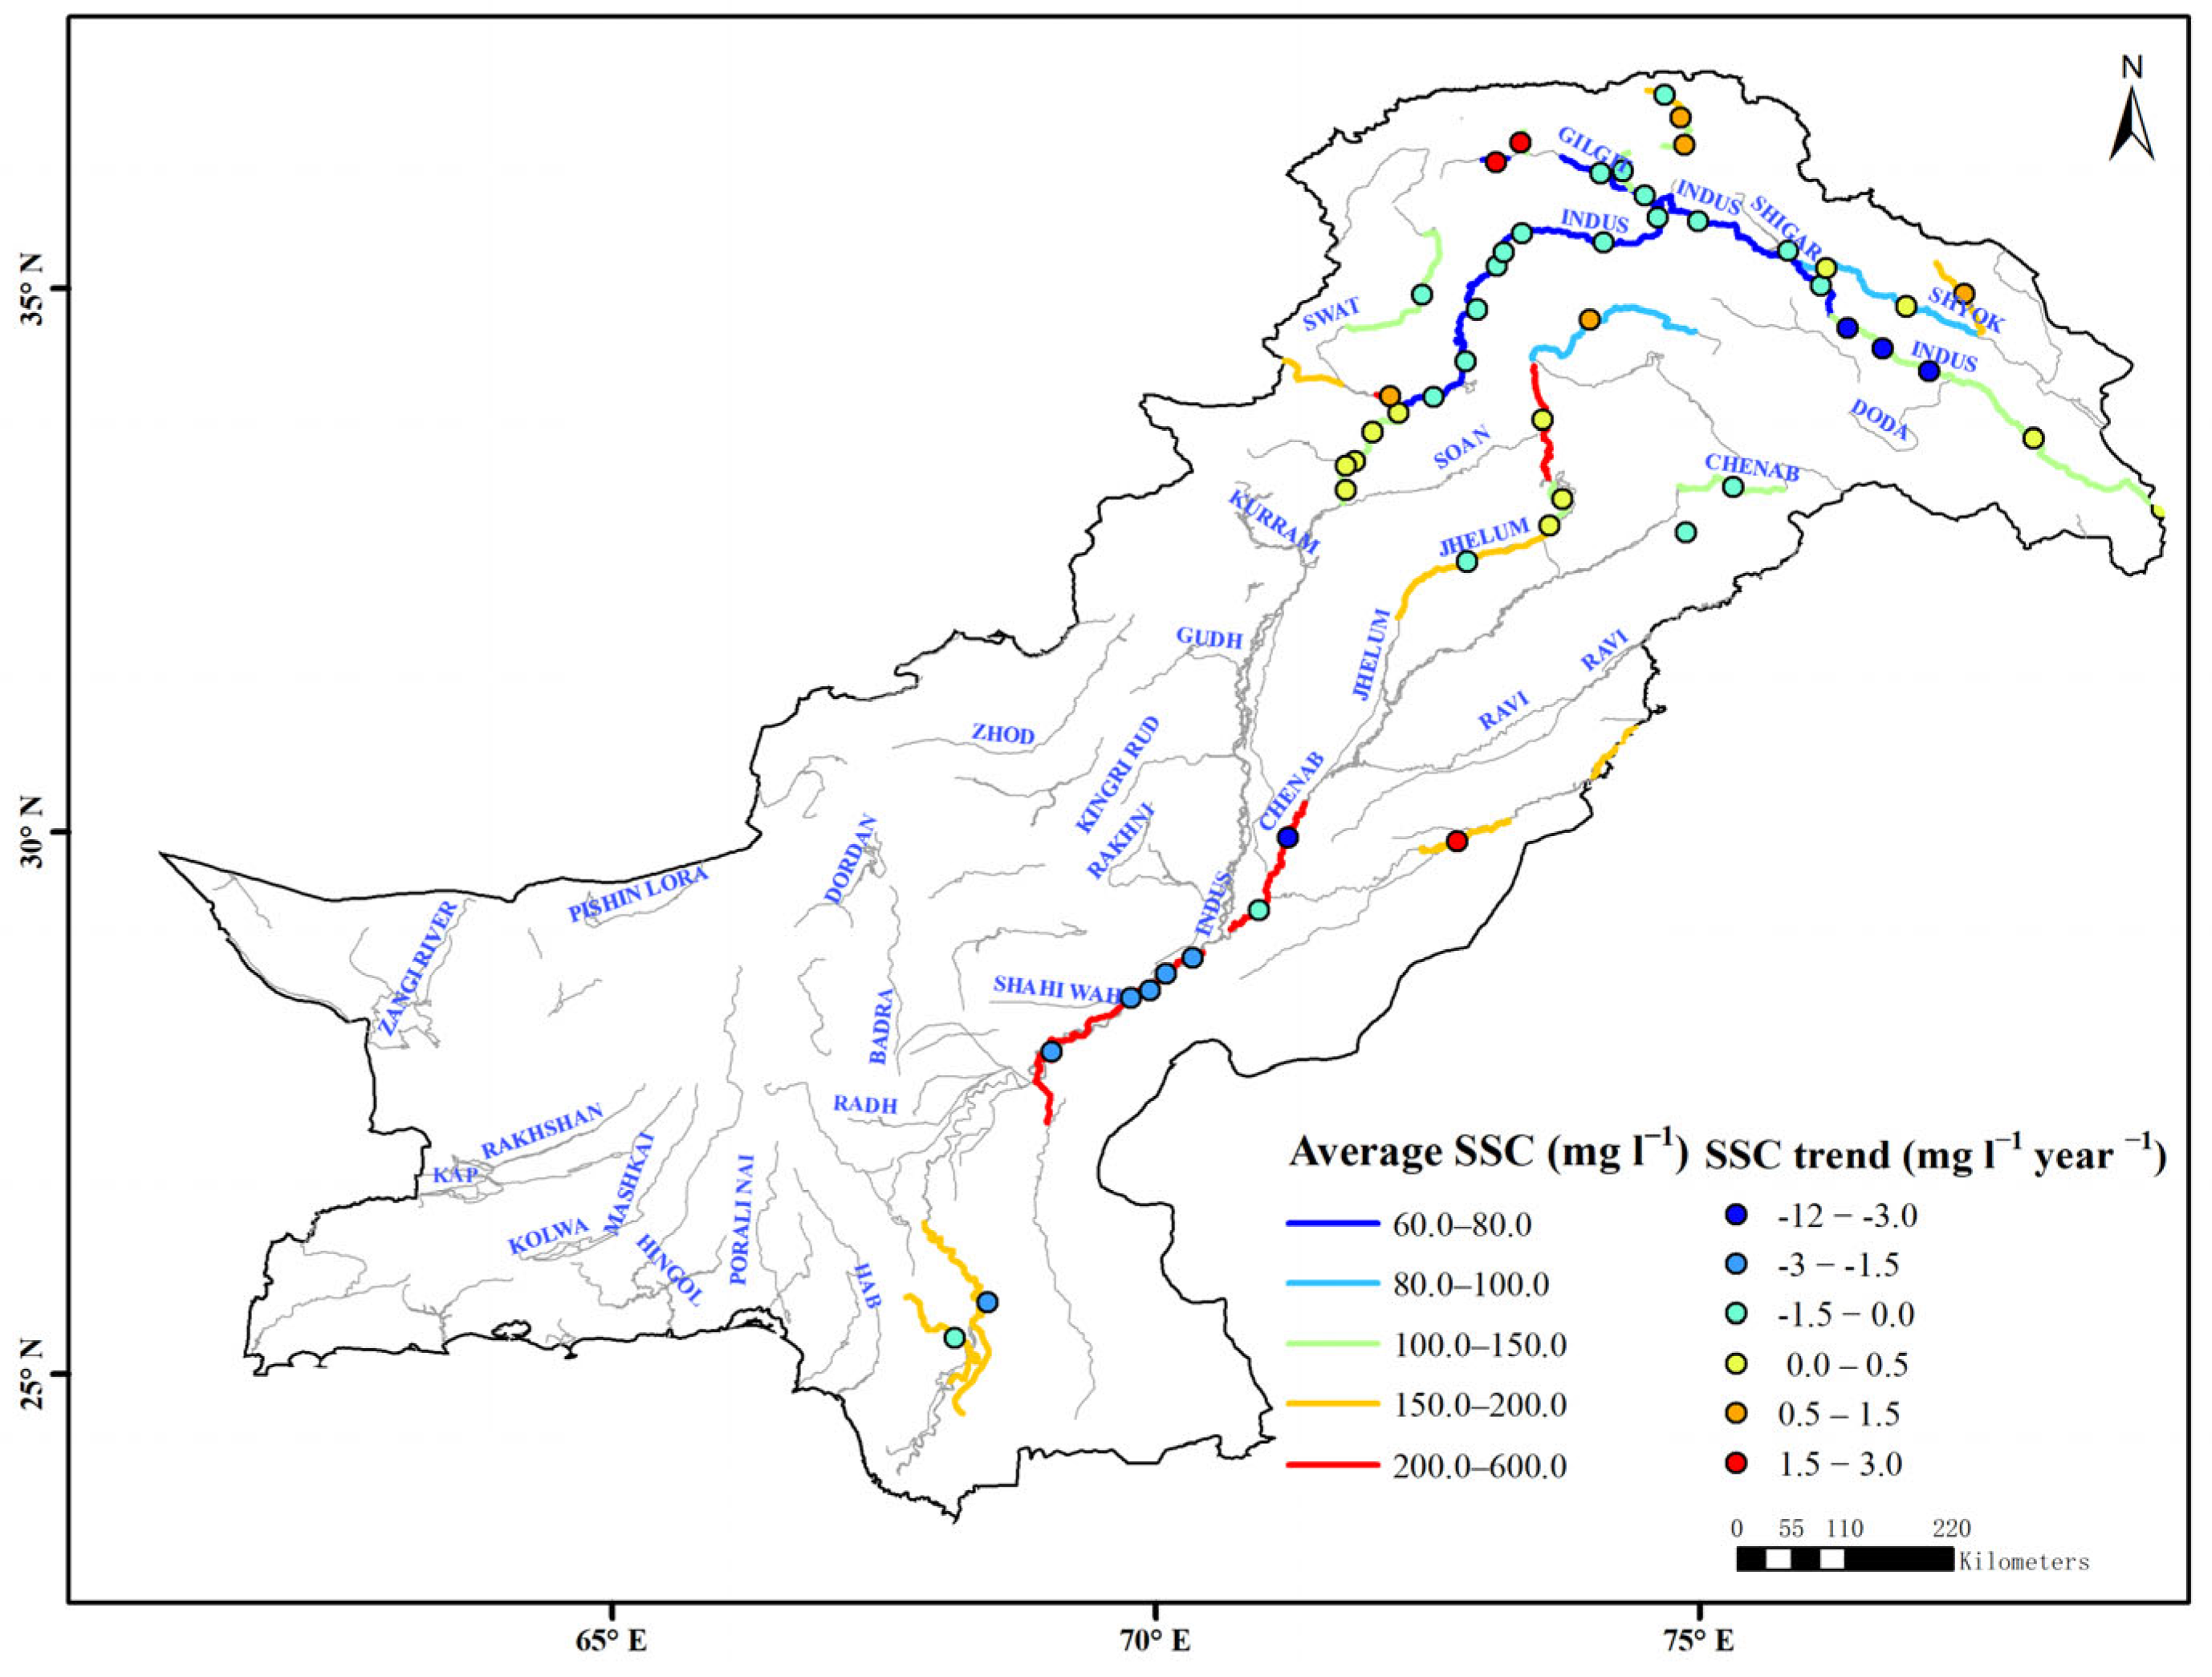
Sediment deposition and streambed uplift were considered as amplifiers of flood severity in Pakistan in previous studies. The spatial pattern of fluvial SSC and temporal trends for major rivers in Pakistan were characterized based on the satellite observations from 1985 to 2020 (Figure 8). The average SSC varied significantly across the upper, middle, and lower reaches of the Indus, Jhelum, and Chenab rivers. The middle reaches of the Indus River and Chenab River exhibited the highest average SSC (250.7–375.1 mg l−1), while the upstream sections recorded the lowest SSC (60.7–100.0 mg l−1). The Jhelum River, Sutlej River, and downstream Indus River displayed medium SSC, with values of 183.4 mg l−1, 188.2 mg l−1, and 172.9 mg l−1, respectively. Due to the high terrain in the north and low terrain in the south of Pakistan, river flow velocity decreases significantly in the middle and lower reaches of the Indus River. The reduction in velocity, coupled with elevated SSC, promotes rapid sediment deposition. This lifts the riverbed and widens the channel, thereby increasing flood risk in the middle and lower reaches of the Indus River. Our results show that the most extensive floodwater occurs along the middle and lower reaches of the Indus River (Figure 3b). These areas are also characterized by greater sediment thickness, with an average value of 4.0 m based on global sediment thickness data. These findings suggest that sediment deposition in these reaches of the Indus River significantly amplified the flood risk—a factor that played a substantial role in the severe flood disaster of 2022 in Pakistan.
From 1985 to 2020, the fluvial SSC of major rivers in Pakistan changed significantly, with an increasing trend in the upstream reaches of the major rivers in northern Pakistan (0.21 to 2.15 mg l−1 yr−1), and a decreasing trend in the midstream and downstream reaches of the major rivers in southern Pakistan (−1.37 to −11.56 mg l−1 yr−1). A pronounced increase in SSC was observed in the upper reaches of the Jhelum River and Sutlej River, as well as the major tributary of the Indus River. Significant decreases generally occurred within the middle and lower reaches of the Indus River. Interestingly, opposite trends were observed along different reaches of the Indus River: SSC increased in the upper reaches but decreased in the lower reaches, highlighting the spatial heterogeneity of SSC in Pakistan (Figure 8). Although SSC has significantly reduced in the middle and lower reaches of the Indus River, the sharp increases in the upper reaches and its major tributaries still deliver sediment deposition downstream. This further uplifts the riverbed and widens the river channel, ultimately increasing the flood risk in these areas.

4. Discussion

The role of fluvial sedimentation in amplifying flood risk is often overlooked in traditional flood risk assessment models [21,35]. Bazai et al. emphasized that fluvial sedimentation greatly contributed to the severe flooding in Pakistan in the year 2022. A riverbed uplift of 1–2 m could significantly increase flood discharge and exacerbate future vulnerabilities. The sediment thickness has been recognized for the first time as a critical factor in amplifying flood risk and has been incorporated into the flood hazard risk assessment model in this work.
Sediment thickness was integrated into our flood risk assessment model, where it played a positive role by enabling accurate mapping of the spatial distribution and risk level of the 2022 flood disaster in Pakistan. The influenced population and cropland were also accurately captured, corresponding well with the actual impact investigated by the National Disaster Management Authority (NDMA) [22,24]. The traditional model without considering sediment thickness obviously underestimates the flood risk along the Indus River. Our results support the findings of Bazai et al., who emphasized the need to incorporate sediment dynamics and geomorphic processes into flood risk models. The role of sediment deposition in amplifying flood risk leads to widespread flooding and severe damage.
Incorporating sediment thickness into flood risk models could improve the accuracy of flood risk assessment. Nevertheless, different flood hazard risk classification methods may bring differences in the spatial distribution of flood hazard risk, and limitations remain regarding sediment thickness data in our study. The commonly used classification methods in previous flood hazard studies, such as equal interval, quantile, geometrical interval, standard deviation, and Jenks natural breaks, may yield substantially different spatial patterns of flood hazard risk, as they are based on different core grading principles. Thus, the differences in classification methods are one of the sources of uncertainty in this work. Additionally, the accuracy of our flood risk assessment may be compromised by uncertainties in sediment thickness data, which were derived from atlas sources and, thus, have limited spatial and temporal resolution. Further efforts are needed to integrate high-resolution sedimentation data from satellite remote sensing with real-time monitoring.
Floods in Pakistan are commonly attributed to a combination of monsoon rainfall, glacier melt, and geomorphological factors [21,24]. In particular, the joint role of extreme rainfall coupled with glacier melt has often been identified as a key trigger for widespread flooding in Pakistan [36,37]. Our results found that extreme rainfall coupled with sediment played a critical role in causing the 2022 catastrophic flooding in the Indus River in Pakistan, indicating the important role of sediment deposition in exacerbating flood risk. Glacier melt had a limited contribution to the 2022 severe flooding in Pakistan, which was supported by the observed changes in SWE and peak discharge. Interestingly, a recent study underlines that increasing trends in SSC over the Indus River were mainly due to enhanced rainfall erosivity [26]. Therefore, sediment in the Indus River of Pakistan will continue to increase due to extreme rainfall under future climate change. The sediment factor is overlooked in flood risk assessment models, leading to insufficient understanding of its amplification effect on floods. Our quantitative assessment of sediment’s impact on flood hazard risk challenges the traditional understanding that flooding is primarily attributed to rainfall and runoff. The vital role of sediment in amplifying flood risk needs to be emphasized in flood risk models; otherwise, the flood risk in central and southern Pakistan may be underestimated in the future. Effective sediment management strategies are essential for identifying and mitigating future flood risks in sediment-prone areas.
A key priority for future research is to fully utilize near-real-time satellite-based disaster-inducing factors and disaster-forming environmental factors. The FengYun satellite offers near-real-time observations of flood disaster-inducing factors such as QPE and soil moisture, which can be directly integrated into flood risk assessment models. Thereby, the methods proposed in this work could help provide timely and effective information for flood management decision-making.

5. Conclusions

We developed a flood hazard assessment model using the MCA method, which included sediment deposition as a key factor and applied near-real-time FengYun satellite QPE and soil moisture products instead of station observation data to evaluate the risk and severe impacts of the unprecedented flooding in Pakistan in August 2022. Our model accurately delineated the spatial distribution of flood hazard risks and quantified the effects on Pakistan’s population, cropland, and urban areas, yielding results consistent with NDMA surveys. A key finding is that the exceptional August rainfall, 2.2 times the historical average from 1961 to 2021 (and even 7.9 times in central Pakistan), together with July rainfall, was the principal cause of the devastating 2022 flood, with glacial melt contributing minimally, while sediment deposition substantially intensified the flood magnitude and severity. The traditional model, without considering sediment thickness as a critical input factor, underestimated the flood risk in sediment areas along the Indus River by up to 23.3%. Our results indicate that integrating sediment deposition into the model could further improve the spatial characterization of flood hazard risk.
Unlike past events primarily attributed to rainfall and glacier melt, the catastrophic 2022 flood highlights the joint role of extreme rainfall and sediment deposition. The role of sediment in amplifying flood hazards has often been overlooked in traditional flood risk models. Under future climate change, the enhanced erosivity induced by intensified extreme rainfall will further increase SSC in the Indus River Basin. These findings demonstrate the need to incorporate sediment deposition into flood risk models; otherwise, they may underestimate future flood hazard risk in Pakistan. Considering the importance of providing timely flood hazard assessment, a key recommendation is to use near-real-time QPE and soil moisture products from the FengYun satellite—particularly satellite-based sediment deposition data—in flood risk models to provide timely and valuable decision-making information for flood prevention and mitigation in Pakistan.

Author Contributions

Conceptualization, H.G.; Formal Analysis, H.G.; Funding Acquisition, H.G. and Y.F.; Investigation, H.G. and Y.F.; Methodology, H.G. and Y.F.; Resources, H.G. and M.R.; Data Curation, M.R. and S.D.; Software, H.G. and X.J.; Supervision, Y.F.; Visualization, X.J. and H.G.; Writing—Original Draft, H.G.; Writing—Review and Editing, H.G. and Y.F. All authors have read and agreed to the published version of the manuscript.

Funding

This research was funded by the National Natural Science Foundation of China, grant number 42275142, 41977191; and the Gaofen Project, grant number 32-Y30F08-9001-20/22.

Data Availability Statement

The original data presented in the study are openly available in FigShare at https://doi.org/10.6084/m9.figshare.33137444 (accessed on 28 August 2026).

Acknowledgments

We acknowledge the use of FengYun satellite products, land cover, fluvial suspended sediment concentration, sediment thickness, and population data provided by the FengYun satellite data service; NASA’s Earth Observing System Data and Information System (EOSDIS); the Global Aqua Remote Sensing (GARS) Laboratory, University of California; and LandScan Global. We would like to thank the anonymous reviewers for their helpful comments and suggestions on the improvement of the manuscript.

Conflicts of Interest

The authors declare no conflicts of interest.

Abbreviations

The following abbreviations are used in this manuscript:
FRMFlood risk model
MCA Multi-criteria analysis
AHPAnalytic Hierarchy Process
FY-4BFengYun-4B
FY-3DFengYun-3D
MERSIMedium-Resolution Spectral Imager
MWRIMicrowave Radiometer Imager
QPEQuantitative Precipitation Estimation
SSCSediment concentrations
SWESnow water equivalent
MODISModerate-Resolution Imaging Spectroradiometer
NDMANational Disaster Management Authority

References

  1. Hirabayashi, Y.; Mahendran, R.; Koirala, S.; Konoshima, L.; Yamazaki, D.; Watanabe, S.; Kim, H.; Kanae, S. Global flood risk under climate change. Nat. Clim. Change 2013, 3, 816–821. [Google Scholar] [CrossRef] [Scilit]
  2. Wang, W.J.; Kim, D.; Han, H.; Tak Kim, K.; Kim, S.; Soo Kim, H. Flood risk assessment using an indicator based approach combined with flood risk maps and grid data. J. Hydrol. 2023, 627, 130396. [Google Scholar] [CrossRef] [Scilit]
  3. World Meteorological Organization. Atlas of Mortality and Economic Losses from Weather, Climate and Water-Related Hazards (1970–2021). Available online: https://wmo.int/publication-series/atlas-of-mortality-and-economic-losses-from-weather-climate-and-water-related-hazards-1970-2021 (accessed on 15 July 2026).
  4. Zhu, Z.; Zhang, S.; Zhang, Y.; Yao, R.; Jin, H. Integrating flood risk assessment and management based on HV-SS model: A case study of the Pearl River Delta, China. Int. J. Disaster Risk Reduct. 2023, 96, 103963. [Google Scholar] [CrossRef] [Scilit]
  5. Feng, D.; Shi, X.; Renaud, F.G. Risk assessment for hurricane-induced pluvial flooding in urban areas using a GIS-based multi-criteria approach: A case study of Hurricane Harvey in Houston, USA. Sci. Total Environ. 2023, 904, 166891. [Google Scholar] [CrossRef] [Scilit] [PubMed]
  6. Merz, B.; Blöschl, G.; Vorogushyn, S.; Dottori, F.; Aerts, J.C.J.H.; Bates, P.; Bertola, M.; Kemter, M.; Kreibich, H.; Lall, U.; et al. Causes, impacts and patterns of disastrous river floods. Nat. Rev. Earth Environ. 2021, 2, 592–609. [Google Scholar] [CrossRef] [Scilit]
  7. Lai, C.; Chen, X.; Chen, X.; Wang, Z.; Wu, X.; Zhao, S. A fuzzy comprehensive evaluation model for flood risk based on the combination weight of game theory. Nat. Hazards 2015, 77, 1243–1259. [Google Scholar] [CrossRef] [Scilit]
  8. Wu, J.; Chen, X.; Lu, J. Assessment of long and short-term flood risk using the multi-criteria analysis model with the AHP-Entropy method in Poyang Lake basin. Int. J. Disaster Risk Reduct. 2022, 75, 102968. [Google Scholar] [CrossRef] [Scilit]
  9. Yu, J.; Zou, L.; Xia, J.; Chen, X.; Wang, F.; Zuo, L. A multi-dimensional framework for improving flood risk assessment: Application in the Han River Basin, China. J. Hydrol. Reg. Stud. 2023, 47, 101434. [Google Scholar] [CrossRef] [Scilit]
  10. Peng, L.; Wang, Y.; Yang, L.; Garchagen, M.; Deng, X. A comparative analysis on flood risk assessment and management performances between Beijing and Munich. Environ. Impact Assess. Rev. 2024, 104, 107319. [Google Scholar] [CrossRef] [Scilit]
  11. Xu, H.; Ma, C.; Lian, J.; Xu, K.; Chaima, E. Urban flooding risk assessment based on an integrated k-means cluster algorithm and improved entropy weight method in the region of Haikou, China. J. Hydrol. 2018, 563, 975–986. [Google Scholar] [CrossRef] [Scilit]
  12. Chen, Y.; Alexander, D. Integrated flood risk assessment of river basins: Application in the Dadu river basin, China. J. Hydrol. 2022, 613, 128456. [Google Scholar] [CrossRef] [Scilit]
  13. Huang, S.; Xu, M.; Chen, D. GIS-based extraction of drainage network density and it’s application to flood hazard analysis. J. Nat. Disasters 2001, 10, 129–132. [Google Scholar]
  14. Li, X.; Ma, Y.; Sun, Y.; Gong, H.; Li, X. Flood hazard assessment in Pakistan at grid scale. J. Geo-Inf. Sci. 2013, 15, 314–320. [Google Scholar] [CrossRef] [Scilit]
  15. Apel, H.; Aronica, G.T.; Kreibich, H.; Thieken, A.H. Flood risk analyses—How detailed do we need to be? Nat. Hazards 2009, 49, 79–98. [Google Scholar] [CrossRef] [Scilit]
  16. Guan, X.; Yu, F.; Xu, H.; Li, C.; Guan, Y. Flood risk assessment of urban metro system using random forest algorithm and triangular fuzzy number based analytical hierarchy process approach. Sustain. Cities Soc. 2024, 109, 105546. [Google Scholar] [CrossRef] [Scilit]
  17. Jemai, S.; Belkendil, A.; Kallel, A.; Ayadi, I. Assessment of flood risk using Hierarchical Analysis Process method and Remote Sensing systems through arid catchment in southeastern Tunisia. J. Arid Environ. 2024, 222, 105150. [Google Scholar] [CrossRef] [Scilit]
  18. Wang, X.; Chen, W.; Yin, J.; Wang, L.; Guo, H. Risk assessment of flood disasters in the Poyang lake area. Int. J. Disaster Risk Reduct. 2024, 100, 104208. [Google Scholar] [CrossRef] [Scilit]
  19. Abu, I.-O.; Ibebuchi, C.C. Risk Assessment of the 2022 Nigerian Flood Event Using Remote Sensing Products and Climate Data. Remote Sens. 2025, 17, 1814. [Google Scholar] [CrossRef] [Scilit]
  20. Zhang, M.; Fu, X.; Liu, S.; Zhang, C. Integrating Remote Sensing and Machine Learning for Actionable Flood Risk Assessment: Multi-Scenario Projection in the Ili River Basin in China Under Climate Change. Remote Sens. 2025, 17, 1189. [Google Scholar] [CrossRef] [Scilit]
  21. Bazai, N.A.; Cui, P.; Hussain, T.; Zhang, G.-T.; Wang, Y.; Akhter, M.G.; Wang, H.; Alam, M. Exploring the roles of recorded unprecedented rainfall-runoff characteristics and uplifted riverbeds in the catastrophic 2022 Pakistan megaflood. Adv. Clim. Change Res. 2025, 16, 409–424. [Google Scholar] [CrossRef] [Scilit]
  22. Wang, J.; Li, K.; Hao, L.; Xu, C.; Liu, J.; Qu, Z.; Yan, X.; Sajjad, M.M.; Sun, Y. Disaster mapping and assessment of Pakistan’s 2022 mega-flood based on multi-source data-driven approach. Nat. Hazards 2024, 120, 3447–3466. [Google Scholar] [CrossRef] [Scilit]
  23. Khan, A.; Gong, Z.; Shah, A.A.; Haq, M. A comprehensive assessment model for livelihood vulnerability using fuzzy TOPSIS technique: A case of 2022 flood in Pakistan. Int. J. Disaster Risk Reduct. 2024, 103, 104351. [Google Scholar] [CrossRef] [Scilit]
  24. Nanditha, J.S.; Kushwaha, A.P.; Singh, R.; Malik, I.; Solanki, H.; Chuphal, D.S.; Dangar, S.; Mahto, S.S.; Vegad, U.; Mishra, V. The Pakistan Flood of August 2022: Causes and Implications. Earth’s Future 2023, 11, e2022EF003230. [Google Scholar] [CrossRef] [Scilit]
  25. Wang, Y.; Cui, P.; Zhang, C.-D.; Zhang, G.-T.; Hao, J.-S.; Yuan, X.; Jiang, Y.-Z.; Wang, L. Antecedent snowmelt and orographic precipitation contributions to water supply of Pakistan disastrous floods, 2022. Adv. Clim. Change Res. 2024, 15, 419–430. [Google Scholar] [CrossRef] [Scilit]
  26. Sun, X.; Tian, L.; Fang, H.; Walling, D.E.; Huang, L.; Park, E.; Li, D.; Zheng, C.; Feng, L. Changes in global fluvial sediment concentrations and fluxes between 1985 and 2020. Nat. Sustain. 2025, 8, 142–151. [Google Scholar] [CrossRef] [Scilit]
  27. Shao, J.; Zheng, W. Study on the flood hazard assessment method. J. Catastrophology 2018, 33, 58–63. [Google Scholar]
  28. Ma, G.; Jiang, W.; Li, J.; Zhang, J.; Ma, Y.; Li, L. Assessment and validation of short-term flood hazards in China. Geogr. Res. 2012, 31, 34–44. [Google Scholar]
  29. Zhang, X.L. Risk Assessment of Tropical Cyclone Disaster in Bangladesh. Master’s Thesis, China University of Geosciences (Beijing), Beijing, China, 2017. [Google Scholar]
  30. Rincon, D.; Khan, U.T.; Armenakis, C. Flood risk mapping using GIS and multicriteria analysis: A greater Toronto area case study. Geosciences 2018, 8, 275. [Google Scholar] [CrossRef] [Scilit]
  31. Saaty, T.L. Decision making with the analytic hierarchy process. Int. J. Serv. Sci. 2008, 1, 83–98. [Google Scholar] [CrossRef] [Scilit]
  32. Li, S.; Sun, D.; Goldberg, M.D.; Sjoberg, B.; Santek, D.; Hoffman, J.P.; DeWeese, M.; Restrepo, P.; Lindsey, S.; Holloway, E. Automatic near real-time flood detection using Suomi-NPP/VIIRS data. Remote Sens. Environ. 2018, 204, 672–689. [Google Scholar] [CrossRef] [Scilit]
  33. Shao, J.L.; Gao, H.; Wang, X.; Zhang, Q. Application of Fengyun-4 satellite to flood disaster monitoring through a rapid multi-temporal synthesis approach. J. Meteor. Res. 2020, 34, 720–731. [Google Scholar] [CrossRef] [Scilit]
  34. Li, S.; Sun, D.; Goldberg, M.E.; Sjoberg, B. Object-based automatic terrain shadow removal from SNPP/VIIRS flood maps. Int. J. Remote Sens. 2015, 36, 5504–5522. [Google Scholar] [CrossRef] [Scilit]
  35. Clift, P.D.; Jonell, T.N. Monsoon controls on sediment generation and transport: Mass budget and provenance constraints from the Indus River catchment, delta and submarine fan over tectonic and multimillennial timescales. Earth Sci. Rev. 2021, 220, 103682. [Google Scholar] [CrossRef] [Scilit]
  36. Bazai, N.A.; Cui, P.; Liu, D.; Carling, P.A.; Wang, H.; Zhang, G.; Li, Y.; Hassan, J. Glacier surging controls glacier lake formation and outburst floods: The example of the Khurdopin Glacier, Karakoram. Glob. Planet. Change 2022, 208, 103710. [Google Scholar] [CrossRef] [Scilit]
  37. Sun, D.; Bi, W.; Zhang, D.; Wang, F. Brief analysis and suggestions on the flood occurred in Pakistan in 2022. China Flood Drought Manag. 2023, 33, 16–21. [Google Scholar]
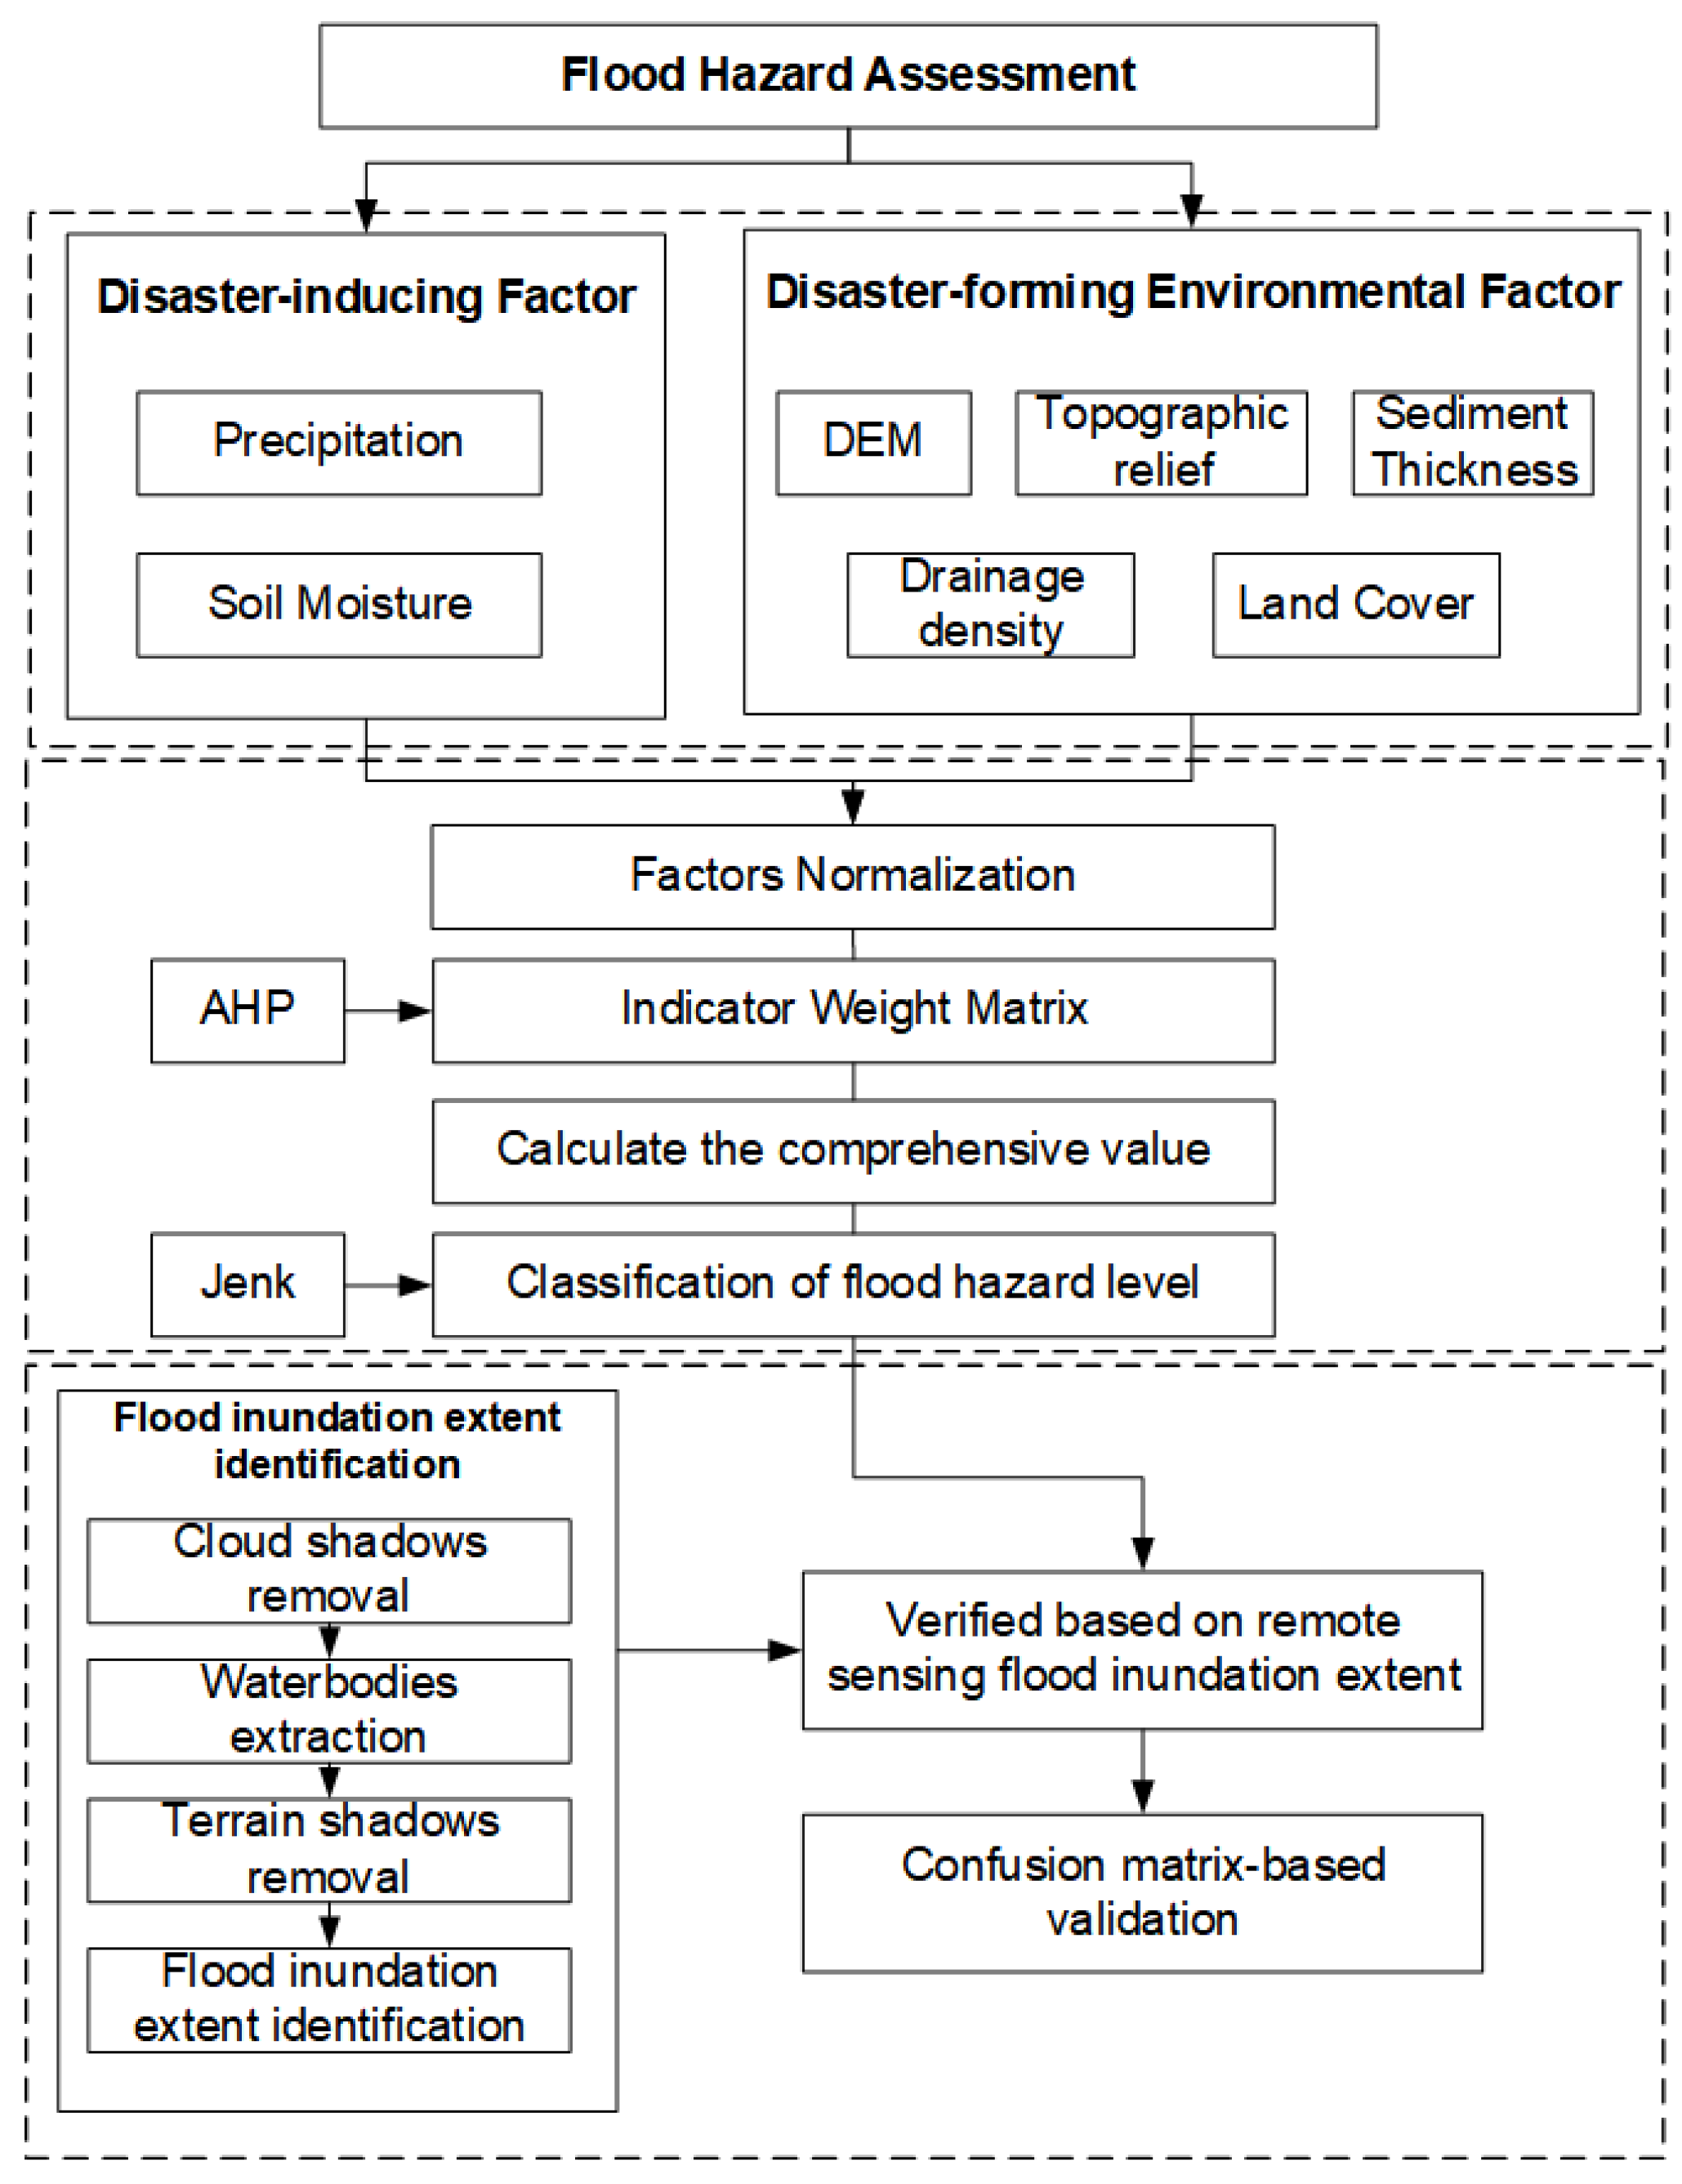
Figure 1. Technical framework for flood hazard susceptibility assessment.
Remotesensing 18 02933 g001
Figure 2. Spatial distribution of flood hazard risk in Pakistan on 24 August 2022, based on the improved flood risk assessment model. The blank areas in northern Pakistan correspond to pixels with missing soil moisture data.
Remotesensing 18 02933 g002
Figure 3. (a) FY-3D MERSI false-color composite image in RGB (red, green, and blue) space from bands 7, 4, and 3 of Pakistan on 31 August 2022; dark blue indicates water. (b) Comparison of floodwater bodies from FY-3D MERSI images between 3 August 2022 (pre-disaster) and 31 August 2022 (post-disaster) in Pakistan; red indicates floodwater extent.
Remotesensing 18 02933 g003
Figure 4. (a) Spatial distribution of rainfall in Pakistan from ground meteorological stations in August 2022; (b) rainfall anomalies of August 2022 compared to the 1961 to 2021 average in Pakistan from ground meteorological stations. The black triangular symbols denote the 50 ground meteorological observation stations in Pakistan.
Remotesensing 18 02933 g004
Figure 5. Cumulative rainfall in August and monsoon season (July–August–September) from 1961 to 2022, based on 50 ground observation stations in Pakistan.
Remotesensing 18 02933 g005
Figure 6. Daily average snow water equivalent (SWE, mm) of FY-3D MWRI snow water equivalent product from June to August 2022 in northern Pakistan.
Remotesensing 18 02933 g006
Figure 7. Maximum observed discharge from hydrological stations along the Indus River during August 2022 in Pakistan.
Remotesensing 18 02933 g007
Figure 8. Long-term annual mean of satellite-derived fluvial SSC during 1985–2020 in Pakistan, and the SSC trend at a 95% confidence level for major rivers in Pakistan from 1985 to 2020.
Remotesensing 18 02933 g008
Table 1. Datasets used in this study.
DataSpatial ResolutionData Source
FY-4B Quantitative Precipitation Estimation (QPE)4 km × 4 kmFengYun satellite data service (http://data.nsmc.org.cn/) (accessed on 28 August 2026)
FY-3D MWRI (Microwave Radiometer Imager) soil moisture0.25° × 0.25° FengYun satellite data service (http://data.nsmc.org.cn/) (accessed on 28 August 2026)
FY-3D MWRI snow water equivalent (SWE) 0.25° × 0.25° FengYun satellite data service (http://data.nsmc.org.cn/) (accessed on 28 August 2026)
Meteorological & hydrological observation datastationsPakistan Meteorological Department
Topographic relief30 m × 30 mGenerated from DEM data calculations
River density-Generated based on the global geographic map database from the National Geomatics Center of China (http://www.ngcc.cn/) (accessed on 28 August 2026)
Land cover500 m × 500 mNASA’s Earth Observing System Data and Information System (EOSDIS) (https://search.earthdata.nasa.gov/) (accessed on 28 August 2026)
Fluvial suspended sediment concentration (SSC)-Global Aqua Remote Sensing (GARS) laboratory (https://garslab.com/) (accessed on 28 August 2026)
Global sediment thickness1° × 1°Institute of Geophysics and Planetary Physics, University of California (https://igppweb.ucsd.edu/~gabi/sediment.html) (accessed on 28 August 2026)
Population1 km × 1 kmLandScan Global
(https://www.worldpop.org/) (accessed on 28 August 2026)
Table 2. Topographic relief normalization method.
Elevation (m)Topographic Standard Deviation
First Level (≤1)Second Level (1–10)Third Level (≥10)
First level (≤100)0.90.80.7
Second level (100–300)0.80.70.6
Third level (300–700)0.70.60.5
Fourth level (≥700)0.60.50.4
Table 3. Determined values of land cover.
Land Cover
Forest0.5
Shrubland or grassland0.6
Water or wetland0.7
Barren0.8
Cropland0.9
Impervious surface1
Table 4. The weights for each indicator derived by the AHP method.
Index layerIndicatorWeight
Flood hazard riskDisaster-inducing factorsQPE0.3889
Soil moisture0.1944
Disaster-forming environmental factorsDEM0.0880
Topographic relief0.0685
Sediment thickness0.0495
River density0.1698
Land cover0.0409
Table 5. Statistics on floodwater bodies falling in various flood-risk-level areas.
Flood Risk LevelFlood Area Proportion in the Flood Risk Area by Traditional Model (%)Flood Area Proportion in the Flood Risk Area by Improved Model (%)
Extreme high80.0%77.8%
High18.1%17.2%
Moderate1.8%2.9%
Low0.1%2.1%
Very low0.0%0.0%
Table 6. Estimation of flood hazard influence on population, cropland, and urban areas in August 2022 in Pakistan.
Population
(107 People)
Cropland
(104 km2)
Urban
(103 km2)
Extreme high-level risk2.84.01.0
Inundated area2.13.50.3
Disclaimer/Publisher’s Note: The statements, opinions and data contained in all publications are solely those of the individual author(s) and contributor(s) and not of MDPI and/or the editor(s). MDPI and/or the editor(s) disclaim responsibility for any injury to people or property resulting from any ideas, methods, instructions or products referred to in the content.