Article

Deep Learning-Based Quantitative Precipitation Estimation Using Ground-Based Microwave Radiometer and Micro-Rain Radar Observations


Key Laboratory of Microwave Remote Sensing, National Space Science Center, Chinese Academy of Sciences, Beijing 100190, China
*
Author to whom correspondence should be addressed.
Remote Sens. 2026, 18(17), 2941; https://doi.org/10.3390/rs18172941
Submission received: 26 June 2026 / Revised: 16 August 2026 / Accepted: 19 August 2026 / Published: 1 September 2026

Highlights

What are the main findings?
  • Polarization differences from non-spherical raindrops help constrain the relative contributions of cloud water and rainwater, while the 89 GHz channel provides enhanced sensitivity to frozen hydrometeors when liquid-water effects are limited.
  • The combined TB + PD + Z retrieval achieved correlation coefficients of 0.70 and 0.84 for C-LWC and R-LWC against ECMWF reference profiles, respectively, and 0.84 for surface rainfall rate against disdrometer observations.
What are the implications of the main findings?
  • Micro-Rain Radar (MRR) reflectivity provides the dominant constraint on rainfall rate retrieval, while microwave brightness temperatures and polarization differences offer complementary information and a modest additional improvement.
  • The temporal evolution of the C-LWP and R-LWP provides a physically interpretable basis for precipitation indication in the analyzed stratiform events, achieving a precipitation presence accuracy of 97% and an onset-time MAE of 60 min with a correlation coefficient of 0.90.

Abstract

This study utilizes the 89 GHz dual-polarization channel of the Ground-Based Multi-Frequency and Dual-Polarization Microwave Radiometer (GMD-MR) to overcome the challenges posed by the insensitivity of low-frequency microwave channels to cloud ice particles. By integrating data from Micro-Rain Radars (MRRs), we developed and implemented advanced convolutional and deep learning models. These models leverage brightness temperature, polarization differences, and constraints from cloud and precipitation data to quantitatively estimate cloud ice content, cloud water content profiles, rainwater content profiles, and precipitation rates, achieving correlation coefficients of 0.6, 0.7, 0.84, and 0.84, respectively. Our analysis of the spatiotemporal dynamics of ice water, cloud liquid water, and rain liquid water paths during precipitation events highlights their predictive value for precipitation occurrence. With a prediction accuracy of 97% and a temporal correlation coefficient of 0.9, our findings affirm the effectiveness of ground-based radiometers and micro-rain radars in precipitation detection. This study demonstrates the capability of multi-instrument joint retrieval for various meteorological parameters, highlighting the significant potential of multi-source microwave data fusion in quantitative precipitation estimation. It establishes and reinforces the foundation for future investigations into the physical processes of precipitation evolution.

1. Introduction

In recent years, ground-based radars and microwave radiometers have become key technologies for continuous precipitation observation over fixed areas [1,2]. In particular, the Ground-Based Multi-Frequency Dual-Polarization Microwave Radiometer (GMD-MR) integrates and enhances the advantages of both radar and microwave radiometers [3,4]. Owing to its multi-frequency and dual-polarization configuration, the GMD-MR has also been used as a preliminary research and development platform for Hyperspectral Microwave Radiometers, providing valuable observational and technical support for the design and validation of future high-spectral-resolution microwave sensing systems. It employs multi-frequency and dual-polarization capabilities to capture detailed information about cloud water particles and their phase states in the atmosphere. Additionally, the high temporal resolution of the GMD-MR significantly enhances its ability to continuously monitor the development of cloud and precipitation processes, providing quantitative estimates of cloud water content, cloud ice content, and precipitation rate, which are typically challenging to obtain with a single instrument.
Despite substantial progress in the combined use of ground-based microwave radiometers and precipitation radars for quantitative precipitation estimation, uncertainties remain in separating the radiative contributions of different hydrometeor phases. Conventional microwave radiometer retrievals mainly use brightness temperatures at water-vapor and liquid-water absorption channels to estimate integrated water vapor and total liquid water path. However, when cloud droplets and raindrops coexist, their absorption and emission signals overlap, making it difficult for a radiometer alone to distinguish cloud liquid water from rain liquid water. Previous studies have therefore combined microwave radiometers with cloud or precipitation radars to introduce information on the vertical cloud structure and radar reflectivity, or have used polarization differences produced by non-spherical raindrops to constrain the separation of cloud and rain liquid water paths [5,6]. Nevertheless, these retrievals remain sensitive to assumptions regarding particle size distributions, particle shapes, and the relationship between radar reflectivity and particle mass.
A further limitation is the relatively weak sensitivity of conventional low-frequency microwave channels to scattering by frozen hydrometeors. Radiative transfer studies have demonstrated that microwave responses to ice depend strongly on frequency, particle size distribution, density, shape, and orientation, with channels near and above 89 GHz generally providing greater sensitivity to precipitation-sized ice particles than lower-frequency channels [7,8]. Ground-based observations have also identified measurable snow-scattering signatures in passive microwave brightness temperatures, although these signals may be affected or obscured by cloud liquid water [9]. Consequently, retrievals relying mainly on low-frequency brightness temperatures and radar reflectivity may insufficiently constrain ice water and may introduce uncertainties into the partitioning of ice, cloud water, and rainwater. These limitations motivate the integrated observational framework adopted in this study.
Within this framework, the brightness temperatures and polarization differences from multiple GMD-MR channels are used to detect variations in the ice water path, cloud liquid water path, and rain liquid water path. Compared with the lower-frequency channels, the 89 GHz dual-polarization channel provides greater sensitivity to frozen hydrometeors because its shorter wavelength is more comparable to the dimensions of larger ice particles, resulting in stronger interactions between the particles and microwave radiation. In addition, horizontally oriented non-spherical ice particles, such as columnar crystals and aggregates, can produce different responses in the two polarization channels. To complement the radiometric observations, MRR reflectivity profiles are used as the primary source of vertically resolved precipitation information, while disdrometer observations provide supplementary near-surface information on raindrop size distributions and rainfall rate. The combined use of these instruments provides more complete information on the vertical distribution of precipitation particles and the characteristics of near-surface raindrop size distributions. Recent multi-source observations in Zhuhai have provided an important regional basis for precipitation microphysics studies. Xie et al. [10] evaluated collocated ground-based measurements of rainfall rate and raindrop size distributions and discussed their potential for satellite precipitation validation. More recently, Li et al. [11] characterized the distinct microphysical properties and vertical structures of stratiform and convective precipitation in South Coastal China using disdrometer, MRR, and satellite observations. These studies demonstrate the value of multi-source observations for coastal precipitation research and provide important regional context for the present study.
Furthermore, deep learning technology has been widely demonstrated to be effective in rainfall estimation and monitoring, achieving significant results in various applications. For instance, quantitative precipitation estimation has been realized using a random forest algorithm based on Meteosat visible and infrared imager data [12]; passive microwave neural network precipitation retrieval algorithms have been employed to accurately retrieve instantaneous surface precipitation rates based on the Advanced Technology Microwave Sounder (ATMS) and the next generation of passive microwave sensors [13]. Additionally, deep convolutional neural networks (CNNs) are demonstrated as effective models for integrating heterogeneous geospatial data [14]. These findings indicate that deep learning methods have immense potential and application value in improving the accuracy of precipitation estimation and monitoring. Based on those integrated approaches, the study has developed convolutional models constrained by brightness temperature and polarization differences, as well as deep models constrained by cloud and precipitation data, for the quantitative estimation of cloud liquid water content, rain liquid water content, precipitation rate, and cloud ice content. The innovation of these models lies in their ability to integrate and analyze multi-source data, enhancing the accuracy of precipitation forecasting. Extensive analysis and validation of the models’ quantitative estimates have confirmed the high accuracy and practicality of this method in quantitative precipitation detection. The outcomes of this research not only enhance our understanding of precipitation processes but also provide technical pathways for future meteorological forecasting. Through these technological advancements, we are able to maintain prediction accuracy under various meteorological conditions while addressing data consistency issues from different devices, thus improving the overall reliability of weather detection and climate modeling.

2. Materials and Methods

This study employs a ground-based multi-frequency dual-polarization microwave radiometer (GMD-MR), a micro-rain radar, and a disdrometer for quantitative precipitation estimation. All onsite instruments were deployed at Sun Yat-sen University in Zhuhai, China (22.358°N, 113.598°E), a coastal city in southern China (Figure 1). The ground-based multi-frequency dual-polarization microwave radiometer (GMD-MR), developed by the National Space Science Center, Chinese Academy of Sciences, consists of 10 channels, specifically at 10.65 GHz, 18.7 GHz, 23.8 GHz, 36.5 GHz, and 89 GHz [15]. Each of these frequencies has both horizontal and vertical polarization channels (Table 1). Table 2 presents the Acceptance criteria for GMD-MR based on laboratory tests and field experiments.
The ground-based microwave radiometer’s parabolic reflector is coated with a waterproof layer to prevent raindrops from adhering to it. It also has a protective cover, which can effectively shield the feed horn from rain erosion during low-elevation angle measurements. The OTT Parsivel2 disdrometer, designed by OTT Hydromet, is a modern laser-based precipitation measurement device that can capture the size and speed of falling particles, thereby determining ground-level rainfall rates and raindrop size distribution [16]. The Micro-Rain Radar (MRR) is based on the relationships between the scattering cross-section, particle size, particle fall velocity, and raindrop size [17]. It can simultaneously provide rainfall rate, raindrop size distribution, radar reflectivity, rain liquid water content (R-LWC), raindrop fall velocity, and other precipitation parameters in the vertical profile several kilometers above the radar. The MRR used in this study has a sampling frequency of 1 min. For further details on the instrument parameters, refer to Table 3.
The observational data used in this study underwent routine calibration and quality-control procedures before analysis. For GMD-MR, two-point calibration and nonlinear correction were applied, with a calibration accuracy of approximately 0.5 K. The OTT Parsivel2 disdrometer was calibrated by the manufacturer before deployment, and unrealistically large raindrops with diameters greater than 7 mm were excluded during quality control. For MRR, the Doppler spectra were preprocessed to remove noise, and the lowest range gates affected by near-field effects and ground clutter were excluded. Similar quality-control procedures for the collocated Parsivel2 and MRR observations at the same Zhuhai site have also been documented in previous studies [10,11].
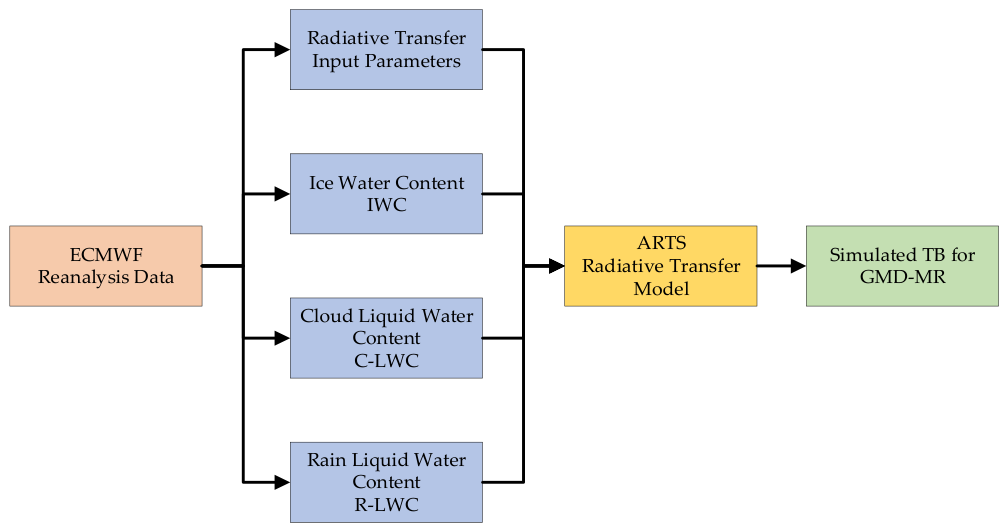
This study simulated the brightness temperature measurements of a ground-based radiometer using the Atmospheric Radiative Transfer Simulator (ARTS) [18]. Figure 2 shows the specific workflow for stratifying cloud water and rainwater content, as well as simulating brightness temperatures, based on European Centre for Medium-Range Weather Forecasts (ECMWFs) reanalysis data [19], MRR, and GMD-MR. Initially, the ECMWF reanalysis data from December 2021 to April 2022, including parameters such as pressure, temperature and humidity, cloud ice content, cloud liquid water content (C-LWC), and rain liquid water content (R-LWC), are input into the ARTS model for brightness temperature simulation. The ECMWF hydrometeor profiles were vertically integrated over the corresponding altitude ranges to obtain ice water paths (IWPs), cloud liquid water paths (C-LWPs), and rain liquid water paths (R-LWPs).
During the radiative transfer simulations, particle size ranges were set as follows: 1 to 180 microns for cloud particles, 180 to 5000 microns for rain particles, and 0.1 to 1500 microns for ice particles. Along with the input data and the model’s internal particle size distributions, cloud and rain particles used a gamma distribution, while ice particles smaller than 100 microns used a first-order gamma distribution and those larger than 100 microns used a log-normal distribution [20,21,22]. In this study, fixed particle size ranges and distribution forms were applied to all atmospheric layers and precipitation conditions. However, ice particle spectra may vary with temperature, while raindrop size distributions may change with rainfall intensity through variations in particle size and concentration. These differences can affect hydrometeor scattering and absorption and thus introduce uncertainty into the simulated brightness temperatures, especially at higher frequencies. This simplification is a limitation of the present study. Cloud particles were set as spherical, rain particles as ellipsoidal, and ice particles as horizontally oriented cylindrical particles with their long axes parallel to the ground [23,24,25]. The optical properties of cloud, rain, and ice particles were calculated using the TMatrix module in the ARTS model [26]. The all-sky radiative transfer simulation included a scattering module, and the Discrete Ordinate Iterative Method (DOIT) was used to compute the scattering energy of electromagnetic waves [27], yielding the final brightness temperatures and polarization differences.

3. Results and Discussion

3.1. Analysis of Rainfall Rate Based on Micro-Rain Radar

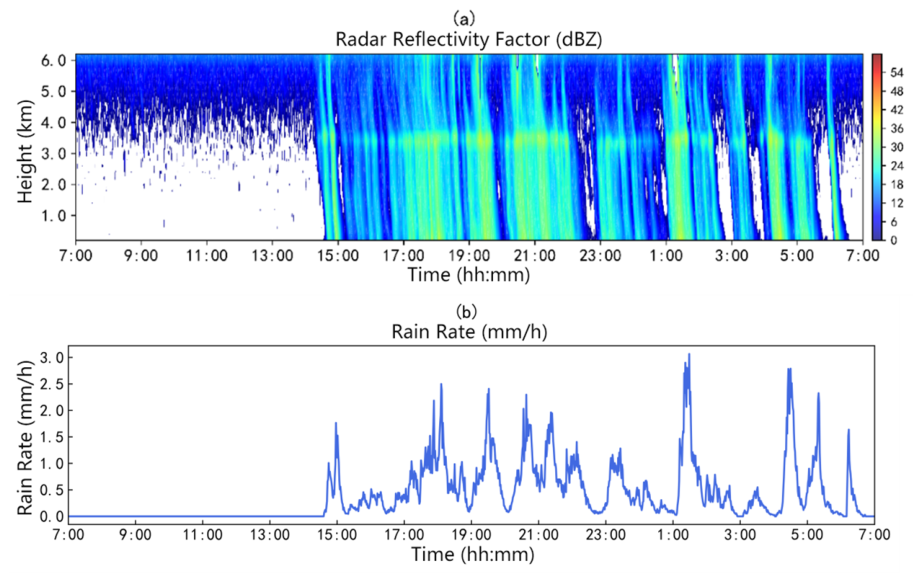
This study focuses on a precipitation event from 26 to 27 December 2021. Figure 3 displays the reflectivity profiles and rainfall rates observed by the micro-rain radar. The data indicates a significant correlation between radar echo intensity and rainfall rate. Based on the characteristics of the radar echoes, the analysis suggests that this precipitation process belongs to the stratiform cloud category, with relatively weak convection and turbulence. Accordingly, the present results are most applicable to similar weak stratiform rainfall conditions. Throughout the entire precipitation event, the radar echo intensity did not exceed 36 dBZ, indicating low precipitation intensity and limited development height, with echo intensity remaining between 24 and 36 dBZ, demonstrating relatively stable and uniform characteristics [28]. The duration of this precipitation event was relatively long, with a noticeable bright band appearing at an altitude of 3 km to 4 km. At higher altitudes, where temperatures are lower, precipitation particles are in the form of ice crystals and snowflakes. As the altitude decreases and temperatures approach zero degrees, the ice crystals and snowflakes begin to melt, forming a water film on the outer surface. Because the complex refractive index of raindrops is significantly higher than that of ice crystals, this leads to an increase in the radar-detected echo intensity, forming the bright band at the zero-degree layer. Below the zero-degree layer, the ice crystals and snowflakes completely melt into small raindrops, leading to smaller particle sizes and a decrease in radar echo intensity. Additionally, since raindrops fall faster than ice crystals and snowflakes, the number of raindrops per unit volume is relatively low, resulting in reduced scattering capability. This contributes to the weakening of the radar echo intensity below the bright band.

3.2. Sensitivity Analysis of Cloud Ice, Cloud Water, Rain Liquid Water, and Rainfall Rate Using a Ground-Based Radiometer

3.2.1. Rainfall Rate Sensitivity Analysis

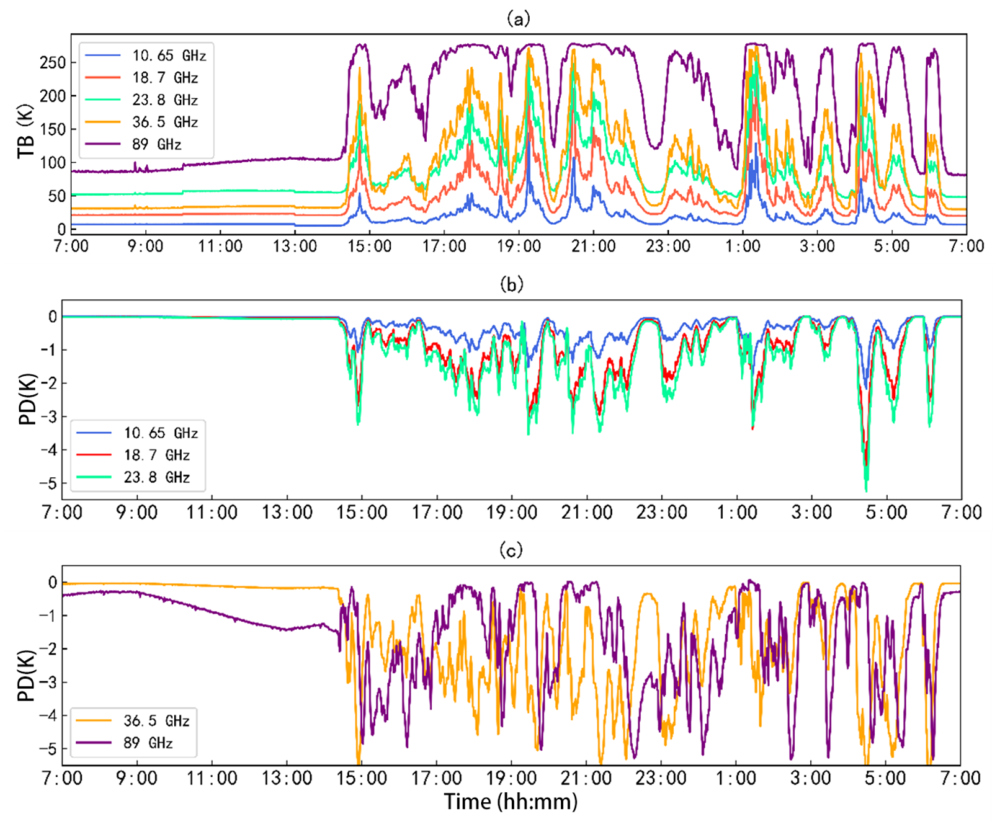
Figure 4 shows the brightness temperatures (TB = (TBV + TBH)/2) and polarization differences (PD = TBV − TBH) measured by the ground-based microwave radiometer from 26 to 27 December 2021. Polarization differences generally become detectable when raindrops are sufficiently large and non-spherical. As raindrops increase in size, they tend to become more oblate, producing different responses in the horizontal and vertical polarization channels. Therefore, the magnitude of the polarization difference is closely related to raindrop size and deformation [29]. Overall, the observed brightness temperatures and polarization differences varied consistently with the rainfall rate. More specifically, the brightness temperatures increased with rainfall rate across all observed channels, although the response differed among frequencies. As rainfall intensified, the sensitivity of the 89 GHz channel gradually decreased, and its brightness temperature increased more slowly. This behavior may be attributed to the increasing number of large raindrops, which enhanced scattering and radiative extinction. Between 17:00 and 22:00 on 26 December, when the rainfall rate reached approximately 2 mm h−1, the brightness temperature at 89 GHz stabilized near 270 K, indicating that the channel was approaching saturation. In comparison, the 18.7, 23.8, and 36.5 GHz channels remained more sensitive to changes in rainfall rate and exhibited wider brightness temperature ranges.
The polarization differences, meanwhile, showed clear frequency-dependent behavior. The 36.5 and 89 GHz channels reached their maximum absolute polarization differences at relatively low rainfall rates. As the rainfall rate increased further, their polarization differences became less negative and gradually approached 0 K. In contrast, the 10.65, 18.7, and 23.8 GHz channels reached their maximum absolute polarization differences at higher rainfall rates. These differences are mainly related to the particle size parameter, namely the ratio of particle size to wavelength, as well as the frequency dependence of the refractive index and optical thickness. For example, the lower total optical thickness at 10.65 GHz results in a narrower brightness-temperature dynamic range and therefore requires a larger rain liquid water path to reach the maximum absolute polarization difference. Between 06:00 and 06:30 on 27 December, the polarization difference was −1 K at 10.65 GHz, compared with −2.5, −3, −5.5, and −5 K at 18.7, 23.8, 36.5, and 89 GHz, respectively. The slightly smaller absolute polarization difference at 89 GHz than at 36.5 GHz suggests that the 89 GHz response had already passed its most negative value and had begun to move toward 0 K.
Furthermore, although two rainfall peaks between 17:00 and 20:00 on 26 December both reached 2.5 mm/h, their polarization differences were not identical. This result suggests that similar rainfall rates may be associated with different cloud microphysical conditions, particularly different relative contributions of cloud water, rainwater, and ice water.

3.2.2. Sensitivity Analysis of Cloud Liquid Water Path and Rain Liquid Water Path

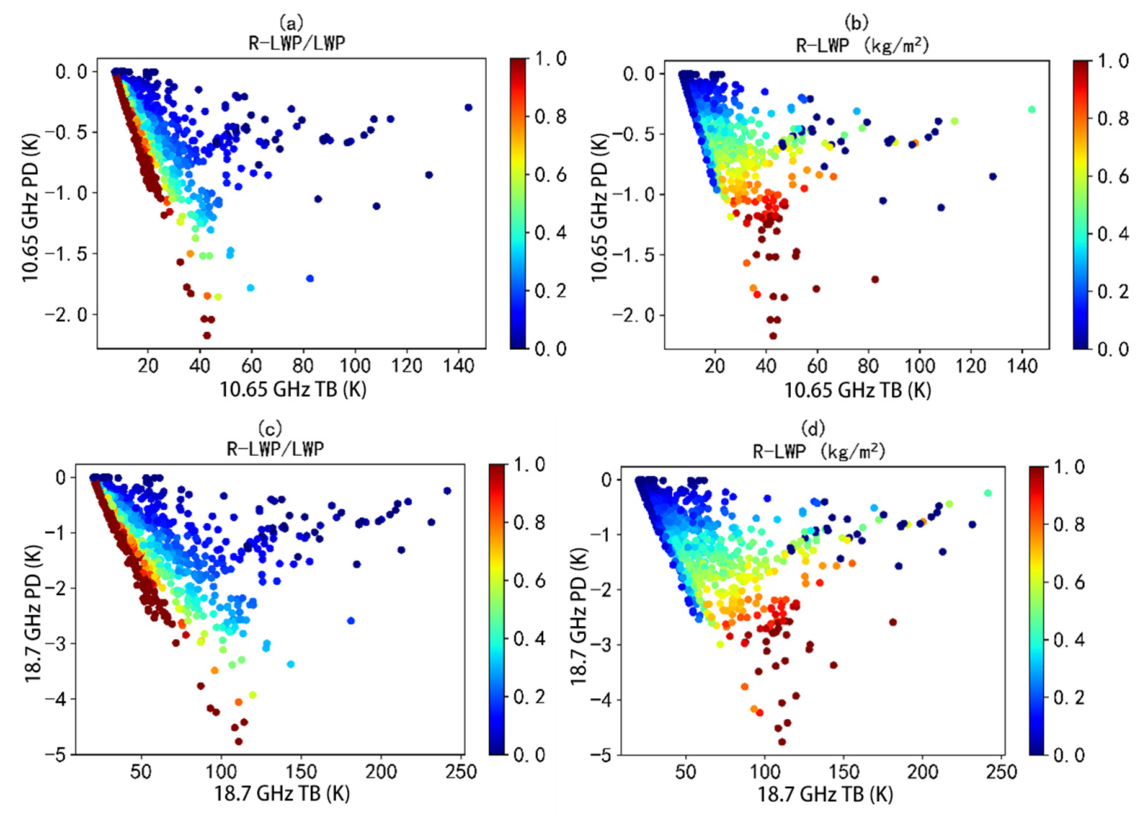
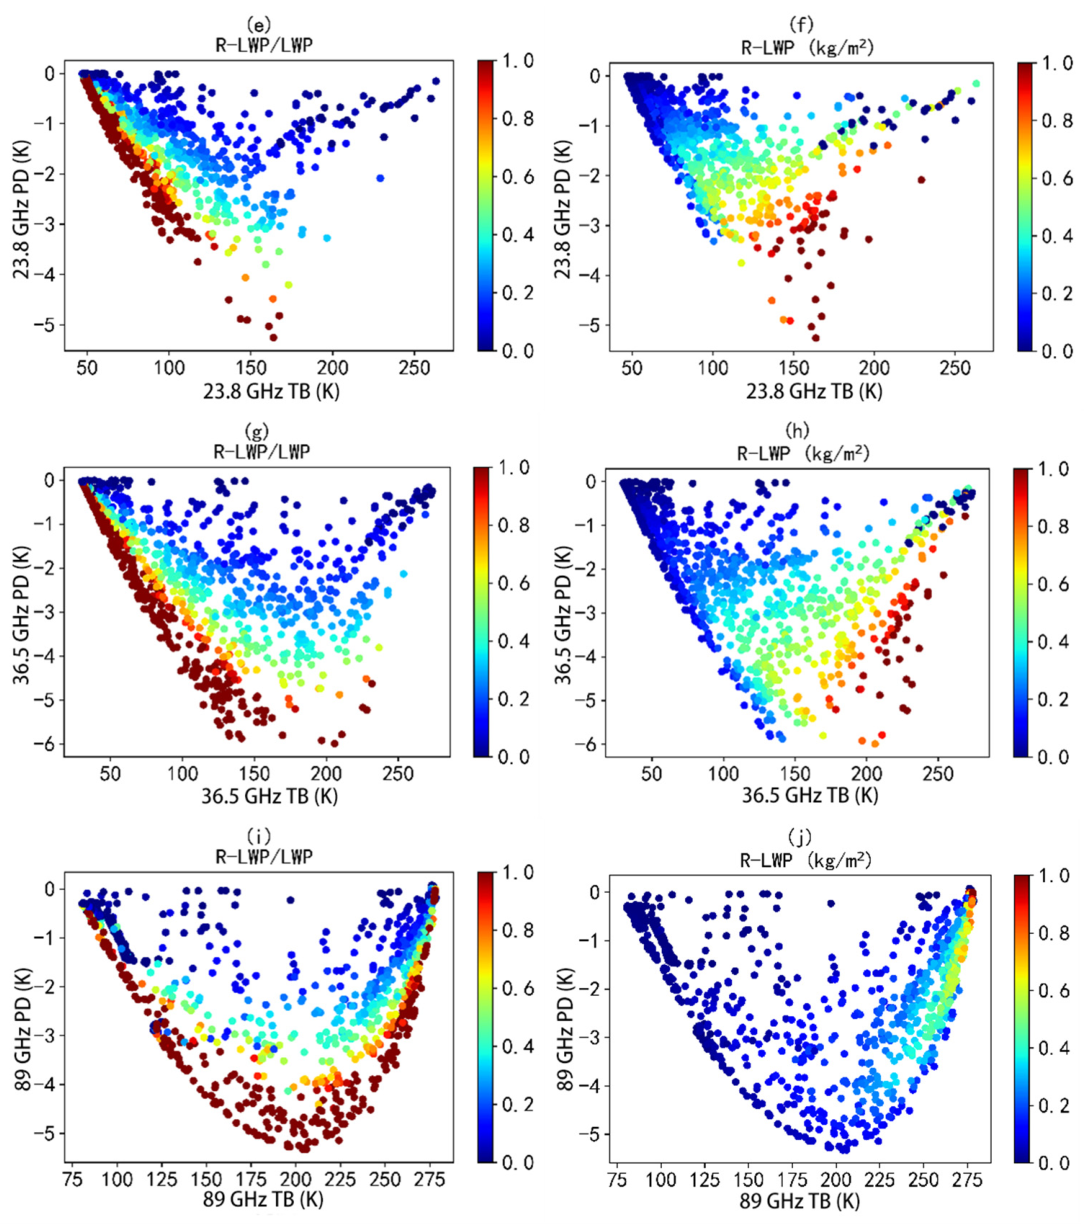
This study uses the negative polarization differences produced by non-spherical raindrops [30,31] to estimate the relative contributions of the cloud liquid water path (C-LWP) and rain liquid water path (R-LWP) to the total liquid water path (LWP). This approach helps reduce the uncertainty associated with separating cloud water from rainwater. Figure 5 combines the R-LWP fraction with brightness temperature and polarization difference, demonstrating that cloud liquid water and rain liquid water produce distinct but complementary microwave responses.
When only cloud liquid water is present, the brightness temperature increases with the C-LWP, whereas the polarization difference remains close to 0 K. The dark blue points in the left column of Figure 5 represent conditions with no rainwater, for which the R-LWP/LWP is zero. For example, Figure 5i shows that the brightness temperature of the 89 GHz channel increases from approximately 75 to 275 K, while the polarization difference remains near 0 K. Similar behavior is observed at the other frequencies because spherical cloud droplets produce little polarization difference.
When both cloud water and rainwater are present, increasing the C-LWP raises the brightness temperature but makes the negative polarization difference less pronounced. For example, when the R-LWP is fixed at 0.4 kg m−2 in the 23.8 GHz channel, an increase in the C-LWP, corresponding to a decrease in the R-LWP/LWP, raises the brightness temperature from approximately 80 to 200 K and changes the polarization difference from −2 to −1 K, as shown in Figure 5e,f. This occurs because the relative contribution of oblate raindrops to the total liquid water decreases as cloud water increases. Meanwhile, the increase in the total LWP enhances microwave absorption and emission, particularly at the lower-frequency channels of 10.65, 18.7, and 23.8 GHz, resulting in higher observed brightness temperatures.
At a fixed C-LWP, increasing the R-LWP initially makes the polarization difference more negative until its maximum absolute value is reached. With a further increase in R-LWP, the polarization difference becomes less negative and gradually approaches 0 K because of increasing optical thickness and saturation. This behavior is also observed under pure-rain conditions. For example, the dark red points in Figure 5i show that the 89 GHz polarization difference reaches its most negative value of approximately −5.5 K at an R-LWP of about 0.1 kg/m2. Throughout this process, the brightness temperatures of all channels continue to increase with the R-LWP.
The responses also vary substantially among frequencies under the same cloud and rain conditions. The 36.5 and 89 GHz channels are more sensitive to small amounts of rainwater and reach their maximum absolute polarization differences at lower R-LWP values than the lower-frequency channels. When the C-LWP is 0 kg/m2 and R-LWP increases from 0 to 0.2 kg/m2, the polarization difference decreases from 0 to approximately −1 K at 10.65 GHz, as shown in Figure 5b but decreases to approximately −5.5 K at 89 GHz, as shown in Figure 5j. This frequency dependence is mainly related to the particle size parameter, namely the ratio of particle size to wavelength.

3.2.3. Sensitivity Analysis of Ice Water Path

Traditional precipitation studies derive information on cloud liquid water path and rain liquid water path by differentiating between cloud particles and rain particles in microwave radiative signals, often overlooking the scattering effect of ice particles [32]. This study addresses this limitation by incorporating the 89 GHz channel to explore its sensitivity to ice water path, given the lower sensitivity to cloud ice particles in low-frequency channels.
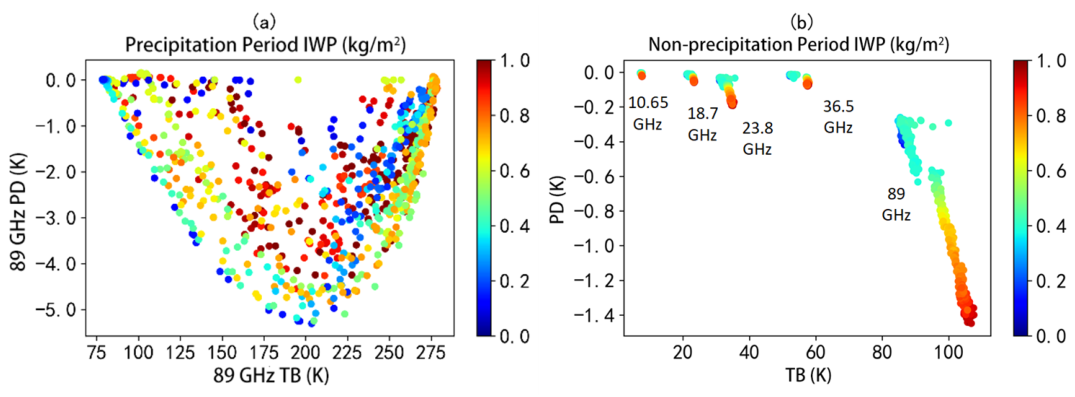
To minimize the impact of clouds and rain, this study divides the precipitation event into two phases—before and during the rainfall—to analyze the sensitivity of brightness temperature and polarization difference to the ice water path (IWP) separately. Figure 6 illustrates the brightness temperature and polarization difference in the 89 GHz channel during precipitation and non-precipitation periods from 26 to 27 December 2021. The analysis revealed that brightness temperatures and polarization differences in the low-frequency channels of 10.65 GHz, 18.7 GHz, 23.8 GHz, and 36.5 GHz exhibit little change, indicating their low sensitivity to ice particles. This suggests that the brightness temperatures in the low-frequency channels of ground-based radiometers are primarily influenced by the absorption and re-emission effects from cloud particles and rain particles, while polarization differences are mainly due to rain particles emitting more horizontally polarized radiation than vertically polarized radiation. In contrast, the brightness temperature in the 89 GHz channel exhibits higher sensitivity to ice particles, fluctuating between 80 K and 110 K. However, during rainfall, the impact of cloud water and rainwater makes it challenging to observe a direct relationship between the brightness temperature and polarization difference in the 89 GHz channel and the ice water path. Therefore, it is impractical to use the brightness temperature and polarization difference in the 89 GHz channel alone to detect cloud ice content.
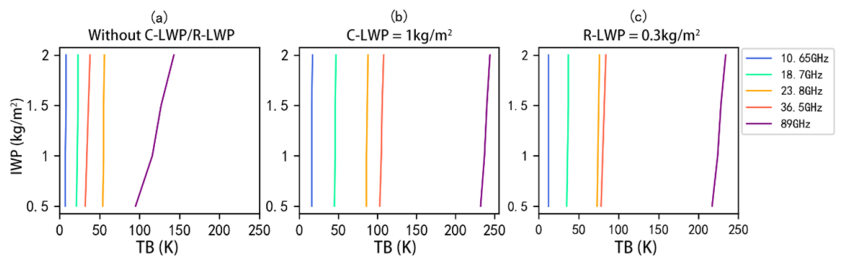
To further validate the sensitivity of the 89 GHz brightness temperature to the ice water path, the ARTS radiative transfer model was used to simulate the response of the 89 GHz brightness temperature to variations in the liquid water path under different cloud and rain conditions (Figure 7). The simulation results are consistent with real-world observations (Figure 6), indicating that the 89 GHz channel’s brightness temperature shows high sensitivity to ice particles only in the absence of clouds and rain. When the ice water path increases from 0.5 kg/m2 to 2 kg/m2, the 89 GHz channel’s brightness temperature rises from 100 K to 150 K. However, when cloud liquid water path or rain liquid water path is present, the 89 GHz channel’s sensitivity to ice particles is lower compared to when clouds and rain are absent. This is partly because ice particles primarily exhibit scattering, while the absorption effect of cloud and rain particles suppresses the increase in brightness temperature.

3.3. Quantitative Estimation of Cloud Ice, Cloud Liquid Water, Rain Liquid Water, and Rainfall Rate

3.3.1. Deep Learning Model Construction

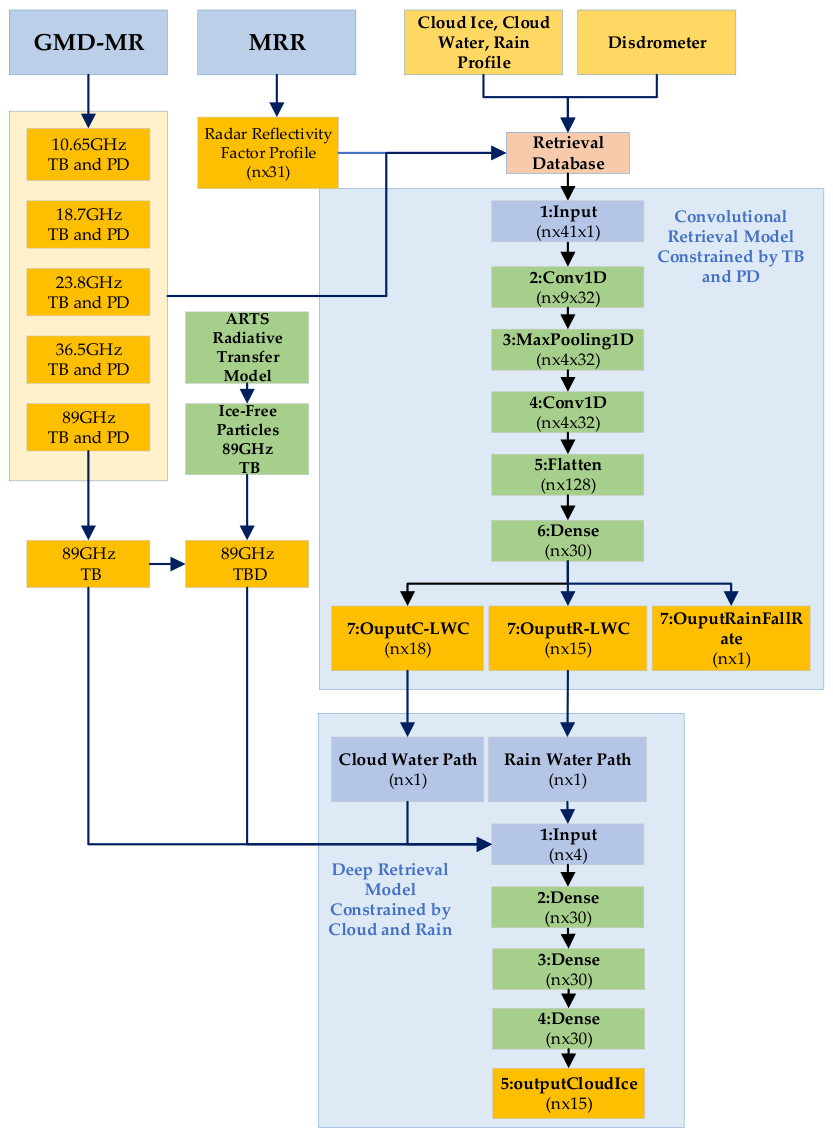
Through an analysis of micro-rain radar and ground-based radiometer data, this study confirms the effectiveness and scientific validity of jointly retrieving radar reflectivity factor, multi-channel brightness temperatures, and polarization differences for the quantitative estimation of cloud ice, cloud liquid water, rain liquid water, and rainfall rate. This study constructed a convolutional model based on brightness temperature and polarization differences for the quantitative estimation of rainfall rate, cloud liquid water content, and rain liquid water content, and examined how changes in the deep learning model’s input affect retrieval accuracy. Based on this, we constructed a deep model with cloud-rain constraints to estimate cloud ice content more accurately. The specific retrieval framework is shown in Figure 8. The figure includes micro-rain radar, disdrometer, ground-based radiometer, and profiles for cloud water, rainwater, and cloud ice. The data comes from precipitation events between December 2021 and April 2022, comprising a total of 17,280 matching data pairs.
In the convolutional retrieval model, polarization differences are introduced as an additional physical constraint because brightness temperatures alone cannot clearly distinguish cloud water from rainwater owing to their similar absorption and emission effects. Moreover, radar reflectivity measurements at adjacent altitudes exhibit vertical correlations associated with the continuous structure of cloud and precipitation systems. The convolutional model is therefore used to extract local vertical features from the reflectivity profiles and retrieve rainfall rate, cloud liquid water content, and rain liquid water content.
The convolution kernel size and stride were both set to 5, with 32 convolutional filters. These parameters were selected to balance the extraction of local vertical features, model complexity, and computational efficiency. A smaller kernel would capture more localized variations but may provide insufficient vertical context, whereas a larger kernel could smooth fine-scale structures. Similarly, increasing the number of filters may improve model capacity but also increase computational cost and the risk of overfitting. The input has dimensions of n × 41 × 1, consisting of a 31 × 1 radar reflectivity profile and a 10 × 1 vector containing the brightness temperatures and polarization differences in five radiometer channels. The outputs are the vertical profiles of cloud liquid water content and rain liquid water content from the surface to 8400 m and 5000 m, respectively. A systematic hyperparameter ablation analysis was not conducted, and the selected configuration should therefore be regarded as an empirical setting rather than a universally optimal solution.
In the deep model with cloud-rain constraints, the sensitivity analysis of the ice water path indicated that the warming effect of ice particles might be masked by the absorption of cloud and rain particles in mixed cloud-rain conditions, making it challenging to directly retrieve cloud ice content using the 89 GHz channel. To address this, the model first retrieves cloud liquid water and rain liquid water content, then uses this information as physical constraints, inputting it into the ARTS radiative transfer model to simulate the 89 GHz brightness temperature in the absence of ice particles. This is compared to the 89 GHz brightness temperature measured by the ground-based radiometer, yielding a brightness temperature difference (TBD), emphasizing the impact of ice particles on brightness temperature. Model inputs include cloud liquid water path, rain liquid water path, brightness temperature difference, and 89 GHz brightness temperature, while outputs are cloud ice content profiles from 3100 m to 15,000 m, with 15 levels. The model uses the tanh activation function, the Adam optimizer for training, and mean squared error (MSE) as the loss function. To validate the model’s performance, a database including profiles for cloud ice, cloud liquid water, rainwater content, disdrometer data, radar reflectivity factor profiles, with brightness temperature and polarization difference information for each channel was created. The database was divided chronologically to maintain temporal independence among the datasets. Data from March to April 2022 were used for model training and testing, whereas data from December 2021 to February 2022 were retained as an independent validation dataset. This cross-seasonal separation provides a more stringent assessment of model generalizability under atmospheric conditions different from those represented in the training data. However, seasonal differences in temperature profiles, cloud structures, and precipitation microphysics may introduce distribution shifts and affect retrieval performance. Therefore, the validation results should be interpret-ed as an evaluation of cross-seasonal transferability rather than performance under identically distributed conditions. Finally, the retrieval results were evaluated against the corresponding reference profiles of ice, cloud, and rainwater content, while the near-surface rainfall rates were independently compared with disdrometer observations.

3.3.2. Quantitative Estimation of Cloud Liquid Water and Rain Liquid Water Content

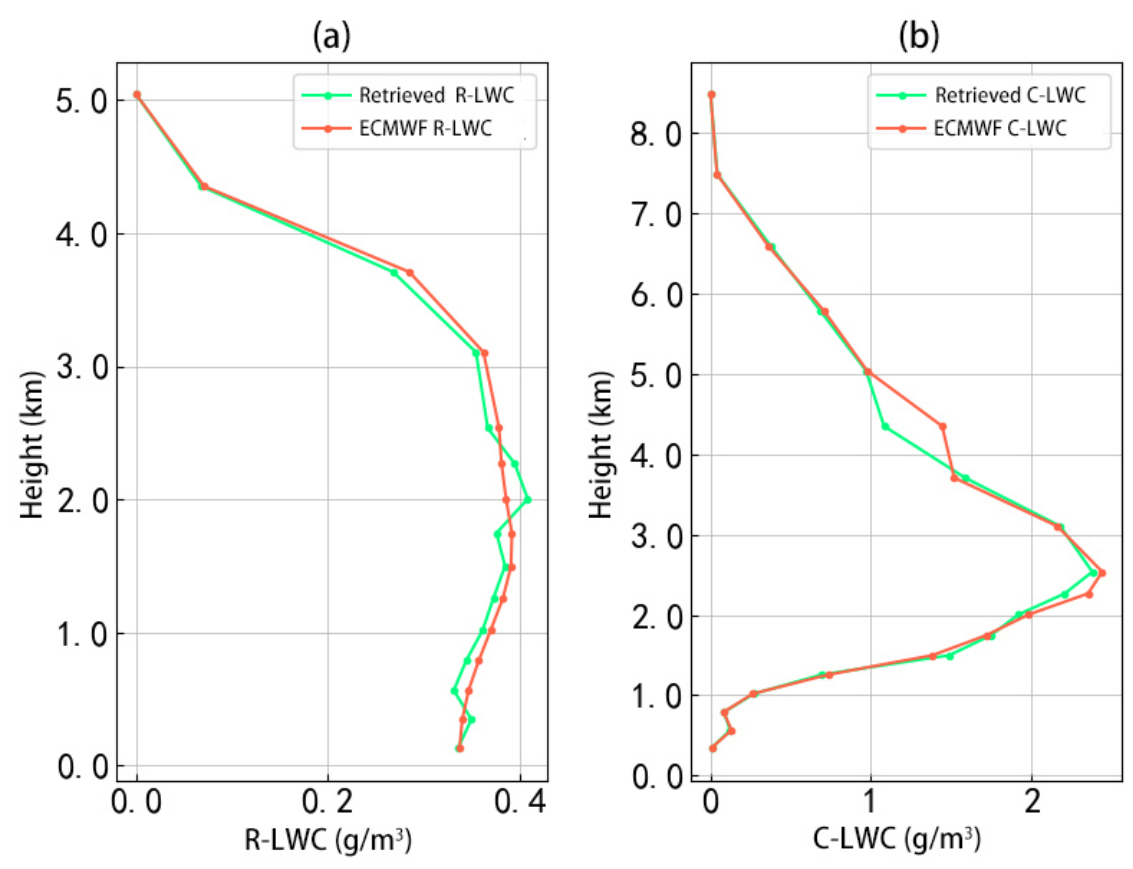
A model was developed to quantitatively retrieve the vertical profiles of cloud liquid water content (C-LWC) and rain liquid water content (R-LWC) using brightness temperatures (TB), polarization differences (PDs), and radar reflectivity factor profiles (Z) as inputs. Representative retrieval results are shown in Figure 9, and the performance of different input combinations is summarized in Table 4.
According to Table 4, the TB-only retrieval performs better than the Z-only retrieval for both the C-LWC and R-LWC. For C-LWC, the TB-only model achieves a Corr of 0.45 and an MAE of 0.66 g/m3, compared with a Corr of 0.33 and an MAE of 0.75 g/m3 for the Z-only model. For R-LWC, the TB-only model achieves a Corr of 0.79 and an MAE of 0.08 g/m3, whereas the Z-only model yields a Corr of 0.64 and an MAE of 0.21 g/m3. These results indicate that, when used independently, multi-frequency microwave brightness temperatures provide stronger constraints on both cloud and rain liquid water content than radar reflectivity profiles in the present dataset.
Nevertheless, brightness temperature alone remains insufficient to fully distinguish cloud liquid water from rain liquid water when both are present, because both cloud droplets and raindrops contribute to microwave absorption and emission, and similar brightness temperatures may correspond to different proportions of cloud water and rainwater (Figure 5). Radar reflectivity, on the other hand, is strongly dependent on particle size and is dominated by larger droplets, making Z-only retrieval particularly sensitive to the assumed or actual particle size distribution.
The inclusion of polarization differences improves the separation of cloud and rain liquid water because non-spherical raindrops produce distinct polarization signatures that are weak or absent for nearly spherical cloud droplets. When TB and PD are used together, the retrieval performance increases to a Corr of 0.69 and an MAE of 0.44 g/m3 for C-LWC, and a Corr of 0.82 and an MAE of 0.06 g/m3 for R-LWC. The best overall performance is obtained when TB, PD, and Z are combined. In this configuration, the Corr and MAE are 0.70 and 0.43 g/m3 for C-LWC and 0.84 and 0.05 g/m3 for R-LWC, respectively. These results suggest that PD provides additional information for distinguishing cloud water from rainwater, while the vertically resolved radar reflectivity profiles provide complementary information on the altitude-dependent distribution of precipitation particles.
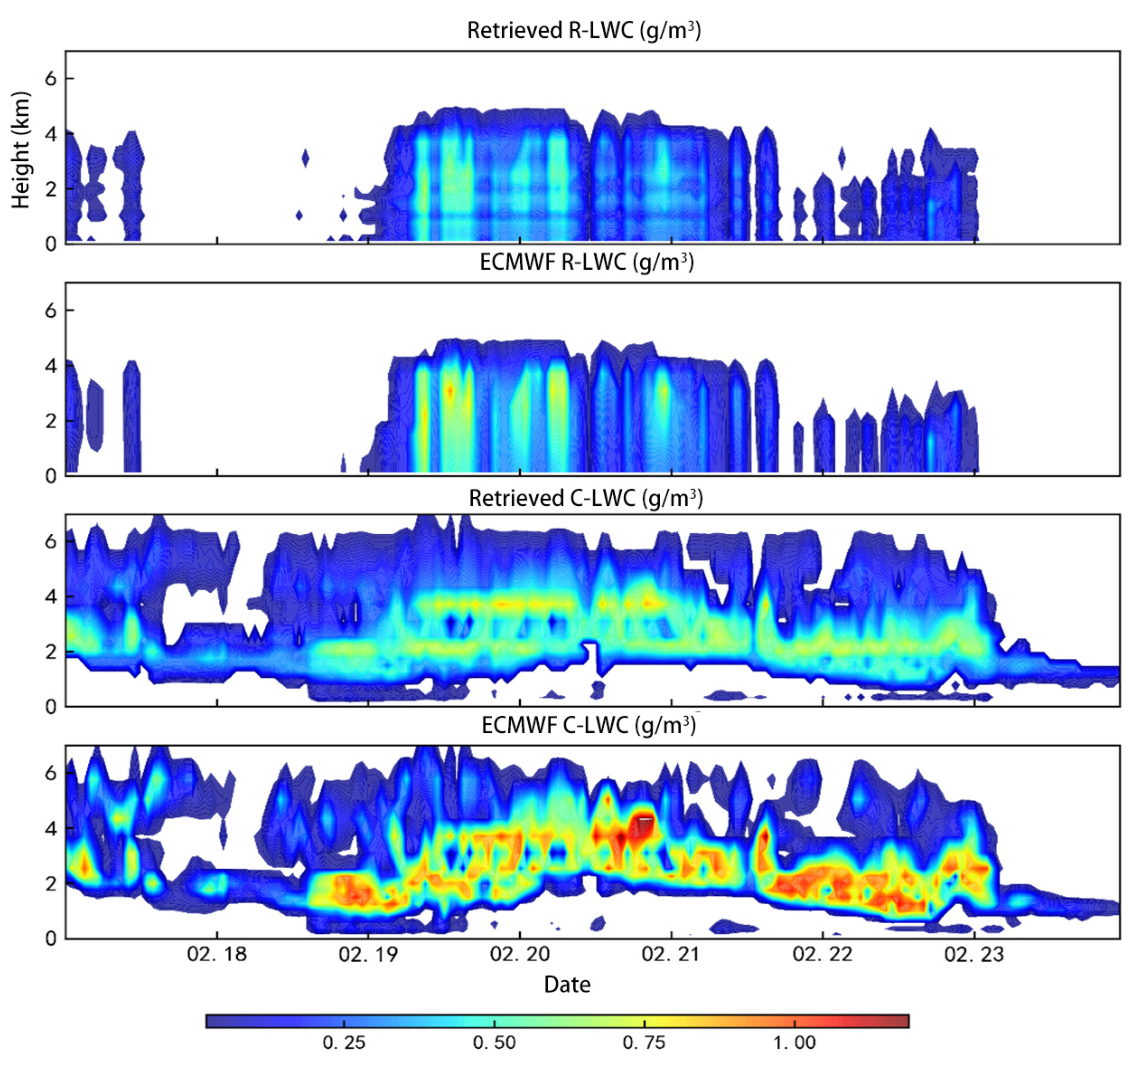
Figure 10 further compares the retrieved C-LWC and R-LWC profiles from 18 to 23 February 2022 with the corresponding ECMWF reference profiles. The retrieved results reproduce the major spatiotemporal variations in cloud and rain liquid water and show generally consistent distributions and intensity variations with the ECMWF reference data. Overall, the combined use of TB, PD, and Z provides complementary radiometric, polarization, and vertical-structure information for retrieving cloud and rain liquid water content profiles.

3.3.3. Quantitative Estimation of Cloud Ice Content

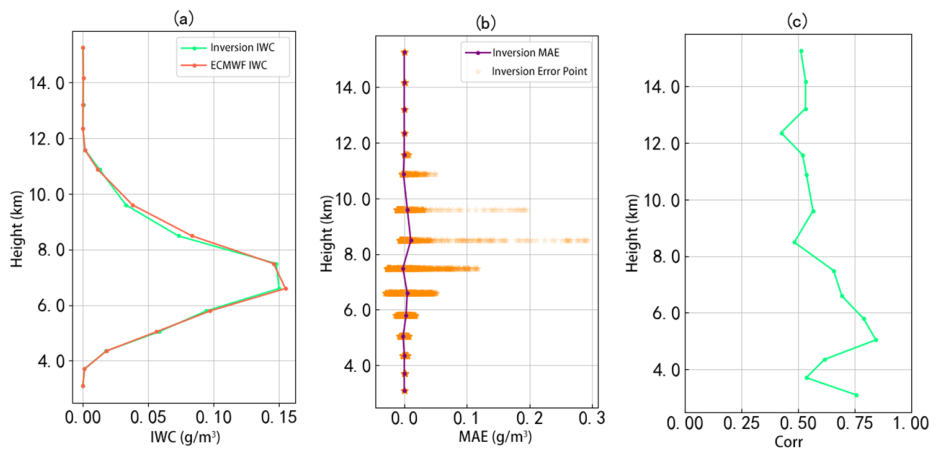
The 89 GHz channel is sensitive to the content of cloud ice, cloud water, and rainwater. As a result, when using the 89 GHz channel directly to retrieve cloud ice content, the scattering effects of ice particles and the radiative effects of cloud and rain particles can combine, complicating the quantitative estimation of cloud ice content. To address this issue, this paper constructs a deep model based on cloud-rain constraints to achieve quantitative estimation of the ice water content. The retrieval results are shown in Figure 11 and Table 5.
The results indicate that using the 89 GHz channel to retrieve cloud ice content is scientifically feasible, with a mean absolute error (MAE) of 0.02 g/m3 and a correlation coefficient (Corr) of 0.6. However, the correlation coefficient for cloud ice content is lower compared to that for cloud liquid water content and rain liquid water content. This may be because the model’s inputs include cloud liquid water path and rain liquid water path, which might contain some errors, impacting the effectiveness of the ARTS radiative transfer simulation and, consequently, the final retrieval results for cloud ice content. Moreover, the retrieval of cloud ice content does not use radar detection data, as the brightness temperature of the 89 GHz channel reflects the integrated energy along the atmospheric radiative transfer path, adding uncertainty to the retrieval of cloud ice content at each layer. The IWC profile retrieval results suggest that using the 89 GHz channel to compensate for the low-frequency channels’ sensitivity to ice water path is effective and reasonable. This also indicates that the 89 GHz channel has potential for quantitative estimation of cloud ice content, but caution should be exercised regarding potential errors and uncertainties in the retrieval process.

3.3.4. Quantitative Estimation of Rainfall Rate

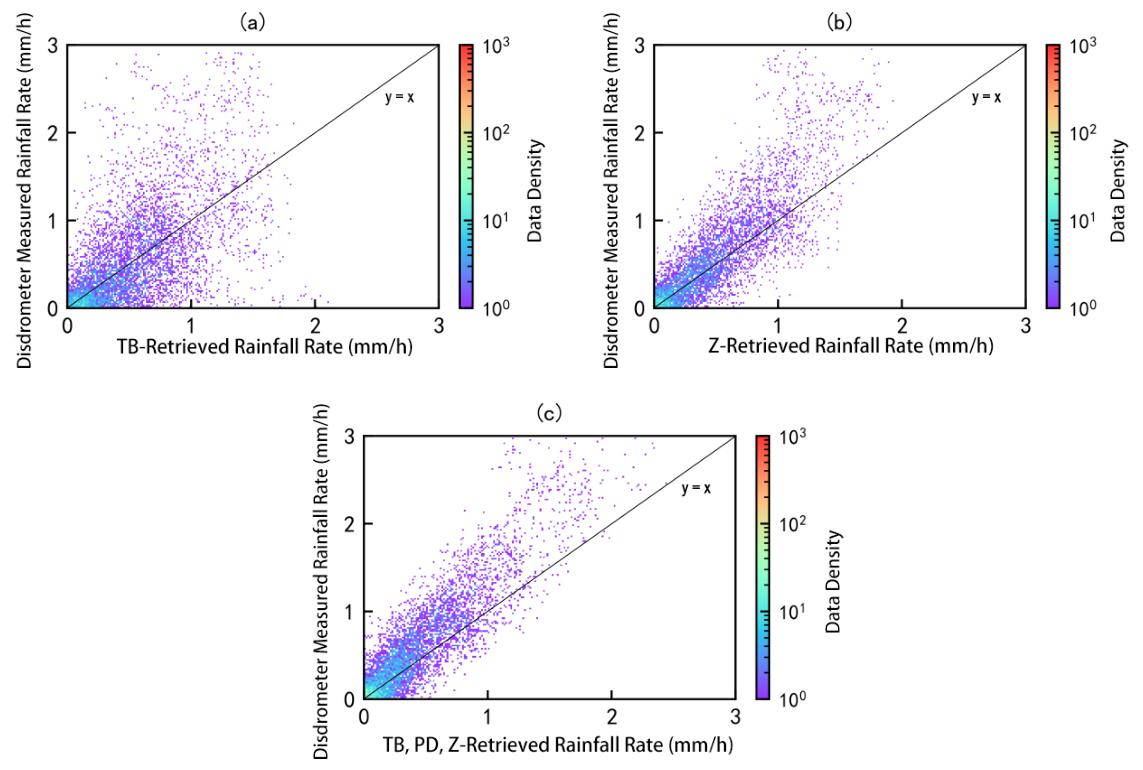
Figure 12 and Table 6 show the quantitative estimation results of rainfall rate under different input conditions. The results indicate that retrieval using radar reflectivity factor as an input parameter yields better results compared to using only radiometer brightness temperatures, with a reduction in the mean absolute error (MAE) by 0.08 mm/h and an increase in correlation coefficient (Corr) by 0.17. The predominant particles below the bright band in the zero-degree layer are raindrops, and thus, the radar reflectivity factor at this altitude primarily represents contributions from raindrops of different sizes, effectively reflecting changes in rainfall rate.
When the input to the model includes ground-based radiometer brightness temperatures from multiple channels, polarization differences, and radar reflectivity factor profiles, the best results are obtained for rainfall rate retrieval, with an MAE of 0.08 mm/h and a Corr of 0.84. Adding polarization differences from each channel to the input parameters significantly improves the accuracy of rainfall rate retrieval. This is because negative polarization differences are a strong indicator of raindrop presence, helping to effectively distinguish between the rain liquid water path and the total liquid water path. Additionally, due to the varying sensitivities of different frequencies to the liquid water path, the complementary effect of multi-channel polarization information provides a deeper learning model with richer information. Through collaborative detection with other channels of the ground-based radiometer, the accuracy of quantitative estimation of rainfall rate is further enhanced.

3.4. Indications of Precipitation from Cloud Ice, Cloud Water, and Rainwater

3.4.1. Spatiotemporal Variation in Cloud Ice, Cloud Water, and Rainwater Content

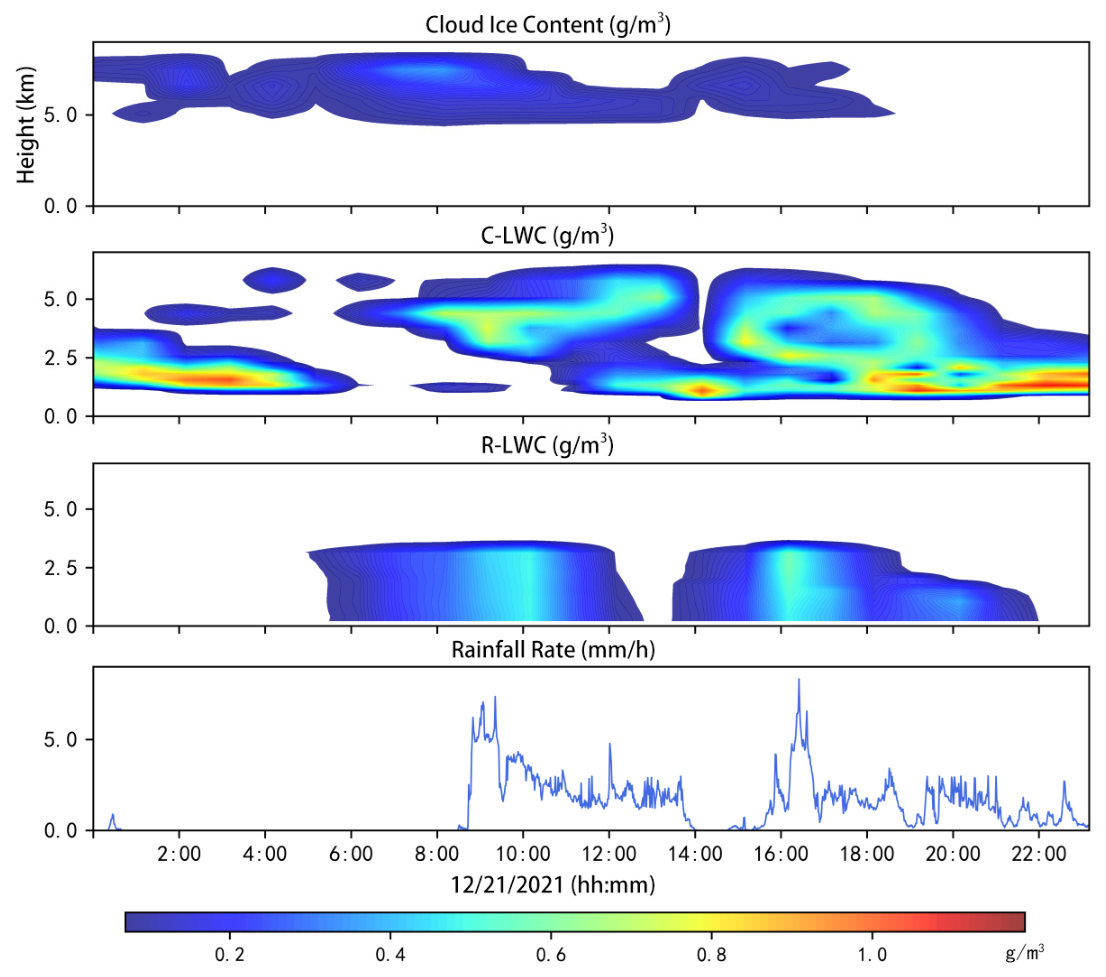
Through analysis and retrieval of multi-frequency ground-based radiometer (GMD-MR) and micro-rain radar (MRR) data, this paper lays the groundwork for understanding the spatiotemporal evolution of cloud ice, cloud water, and rainwater content during precipitation. Taking a precipitation event on 21 December 2021, as an example, the specific evolution of cloud ice, cloud water, and rainwater during the precipitation process was analyzed (Figure 13).
Eight hours before precipitation (around 1 a.m.), clouds began to thicken, indicating the cloud particles were in the development stage, and the rain liquid water content at all altitudes was 0 g/m3. Between four and six hours before precipitation, cloud liquid water content rapidly increased, especially in the lower levels between 1 km and 3 km, reaching a maximum, providing favorable conditions for raindrop formation. By 6 a.m., the cloud liquid water content in the 1 km to 3 km range dropped below 0.5 g/m3, suggesting that cloud particle coalescence and growth facilitated the formation and development of raindrops. The rain liquid water content in the 0 km to 3 km layer exceeded 0.1 g/m3 and extended to the ground, resulting in precipitation. When precipitation began, the cloud liquid water content in the upper layers quickly increased, thickening the clouds. Since raindrops primarily form from cloud droplets, the increase in cloud liquid water content laid the groundwork for the increase in rain liquid water content. The change in cloud ice content was relatively slow, but about one and a half hours before precipitation, the ice water path reached its maximum. Ice particles grew through sublimation and then melted into water droplets, which coalesced with smaller cloud droplets, promoting the occurrence of precipitation.
For the second precipitation event that started at 15:00, two hours before precipitation, the cloud liquid water content in the lower 1 km to 3 km range rapidly increased, reaching a peak just before precipitation. Simultaneously, cloud ice content also peaked, with cloud ice content in the 5 km to 8 km range exceeding 0.1 g/m3. At the same time, cloud liquid water content was relatively abundant between 1 km and 6 km, with an average exceeding 0.4 g/m3. The rain liquid water content across different layers showed minimal variation with altitude, with an average of about 0.3 g/m3. In stratiform cloud weak precipitation events, a stable vertical distribution of rain liquid water content suggests that the effects of collision, fragmentation, or evaporation during raindrop descent are relatively minor under lower rainfall rates. By 18:00, cloud liquid water content reached another peak, providing favorable conditions for an increase in rainfall rate.
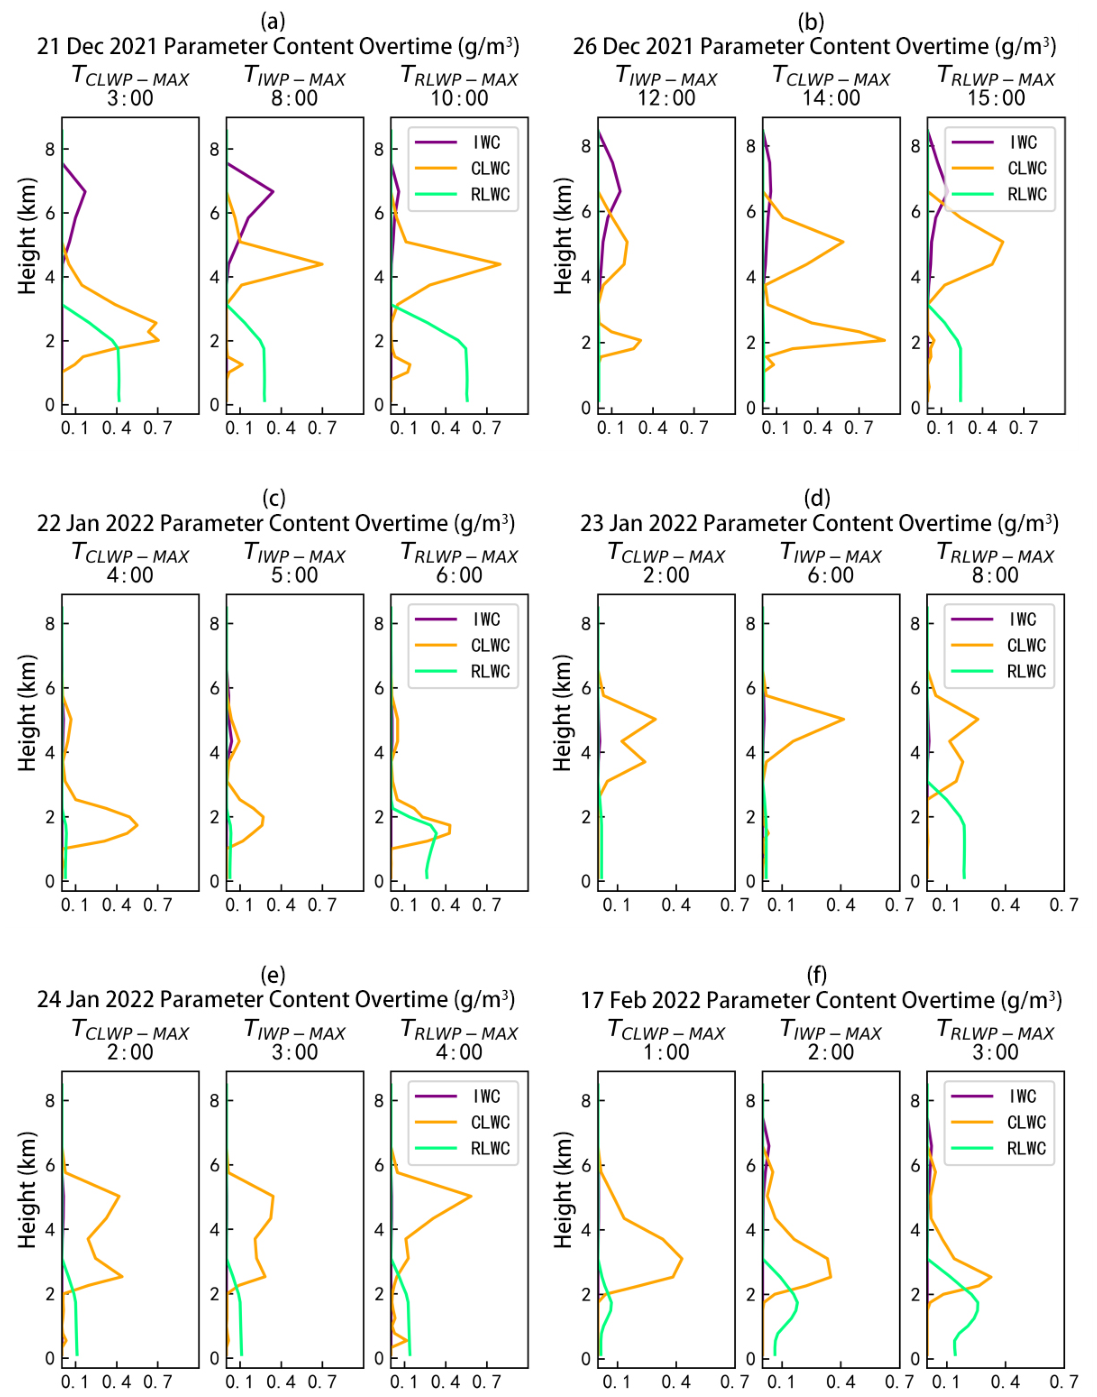
The precipitation event on 21 December 2021 illustrates the evolution of ice, cloud water, and rainwater and shows how variations in the cloud liquid water path and rain liquid water path are related to changes in rainfall rate. To further examine the general evolution of these parameters during precipitation, Table 7 presents the mean values and standard deviations of the relevant variables when each parameter reaches its maximum. TIWP-MAX, TCLWP-MAX, TRLWP-MAX, and TRain-MAX denote the first occurrence of the maximum ice water path, cloud liquid water path, rain liquid water path, and rainfall rate, respectively, within the analyzed event period.
The IWP varied relatively slowly before and during the precipitation event. It reached a maximum of 0.17 kg/m2 approximately 77 min before the onset of surface rainfall and then gradually decreased. This lead time may reflect the earlier development and accumulation of ice hydrometeors aloft. After the IWP peak, ice crystals and snow aggregates likely sedimented toward the melting layer and were subsequently converted into raindrops. The relatively slow sedimentation of ice particles, followed by melting and the descent of the resulting raindrops, may therefore have contributed to the observed delay before rainfall reached the surface [33,34]. Thus, the 77 min interval represents a combined timescale of sedimentation and phase transition rather than the fall time of a single particle type.
Following the earlier development of the ice phase, the cloud liquid water path increased gradually before the onset of precipitation. As shown in Table 7, the C-LWP reached a peak value of 2.49 kg/m2 at TCLWP-MAX. At this stage, abundant cloud liquid water was present near and below the 0 °C level, approximately between 1 and 3 km, providing favorable conditions for the growth of cloud droplets and the subsequent formation of raindrops, as shown in Figure 14. After TCLWP-MAX, the cloud liquid water content within and below this layer began to decrease as cloud droplets were converted into raindrops through collision and coalescence. By TRLWP-MAX, the lower-level cloud liquid water content had decreased further as cloud water continued to be consumed during the development of precipitation.
Meanwhile, the rain liquid water path began to increase after the initial rise in cloud liquid water and continued to increase as the rainfall rate intensified. At TCLWP-MAX, the C-LWP had already reached its maximum, whereas little rain liquid water was present in the vertical profile, indicating that the conversion from cloud droplets to raindrops was still at an early stage. As cloud droplets continued to grow through collision and coalescence, the cloud liquid water content between approximately 1 and 3 km decreased, while the rain liquid water content increased and extended downward toward the surface. This transition ultimately resulted in surface precipitation, as illustrated in Figure 14. The R-LWP subsequently reached its maximum at TRLWP-MAX, reflecting the progressive conversion of cloud water into rainwater during the precipitation process.

3.4.2. Construction and Validation of the Precipitation Indication Model

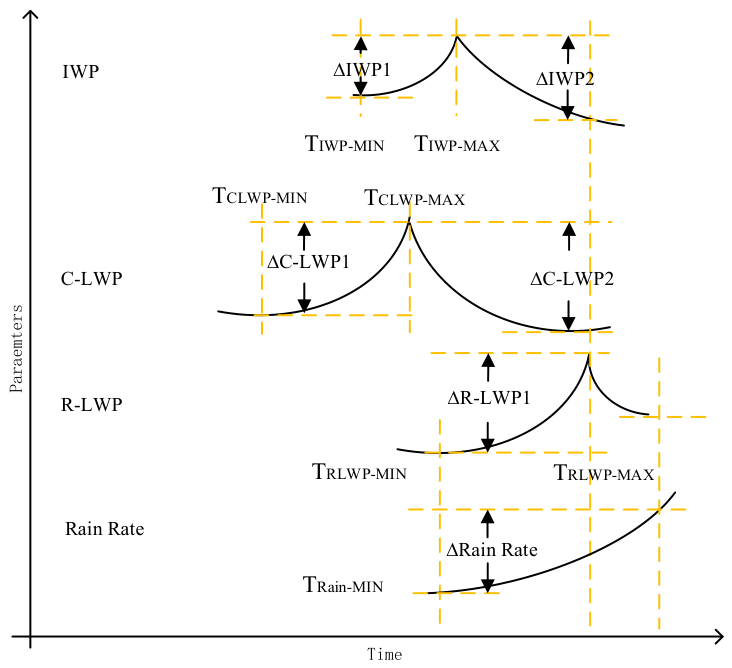
Based on the spatiotemporal analysis of ice, cloud, and rainwater paths in stratiform precipitation events, this section explores the evolution of various parameters during the precipitation phase. The precipitation indication model is constructed to quantify the indication provided by ground-based radiometer and micro-rain radar-derived meteorological parameters regarding precipitation. Figure 15 shows the method for selecting the model’s input data, with curves representing the temporal variations in the ice water path, cloud water path, rainwater path, and rainfall rate. Using the rain liquid water path as an example, TRLWP-MAX refers to the time point corresponding to the maximum RLWP during a precipitation event, while TRLWP-MIN refers to the nearest minimum RLWP to TRLWP-MAX, and ΔRLWP1 indicates the change in the RLWP from TRLWP-MIN to TRLWP-MAX. The meanings of other ice and cloud water parameters are similar to those of the rain liquid water path.
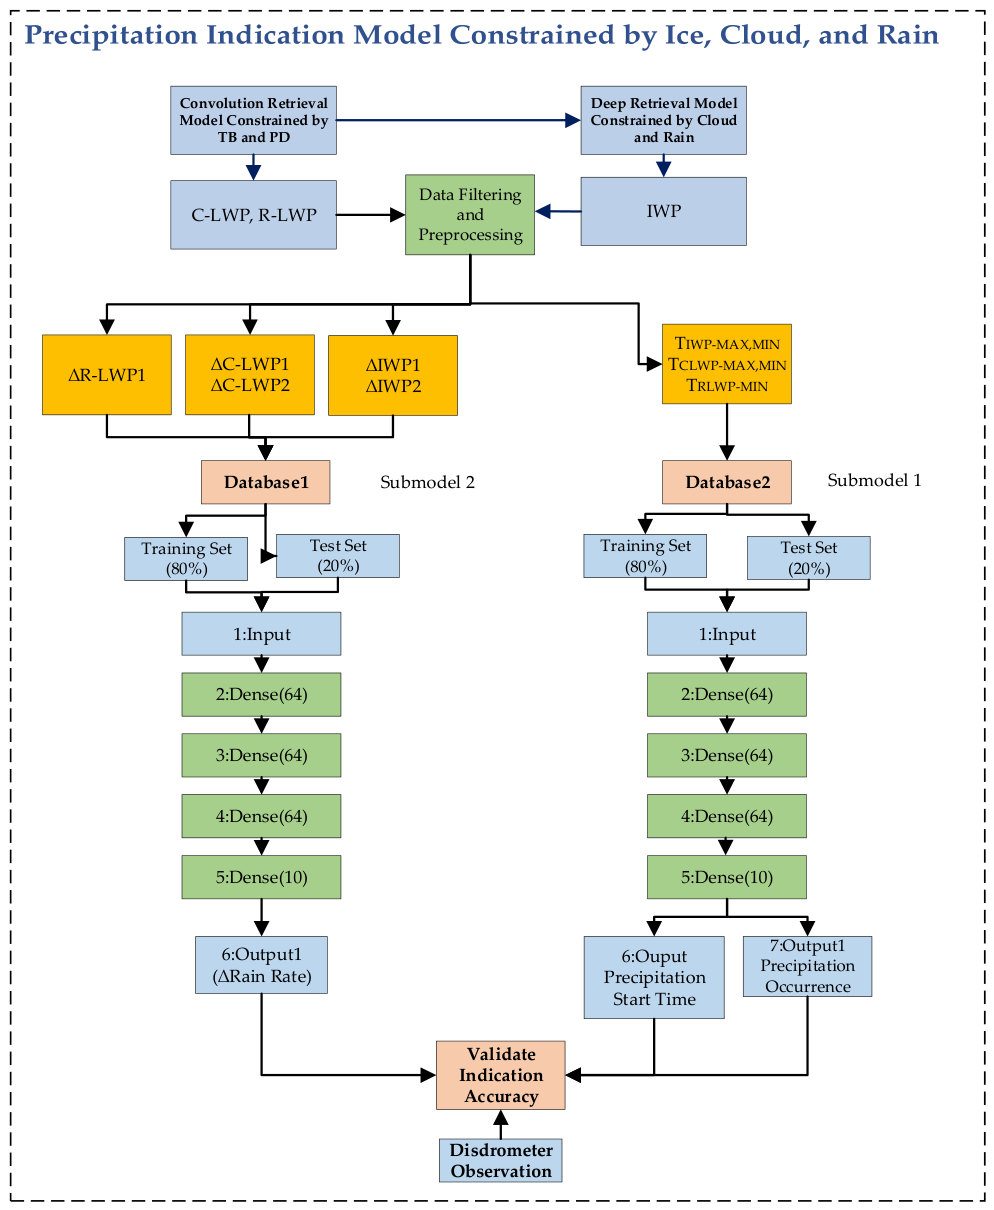
Figure 16 outlines the process of constructing the precipitation indication model based on spatiotemporal constraints from cloud, rain, and ice. This process employs convolutional and deep models to compute the ice water path, cloud liquid water path, and rain liquid water path at different times (data from December 2021 to February 2022, with correlation coefficients of 0.6, 0.7, and 0.84 for ice, cloud, and rainwater paths, respectively). The input to Submodel 1 comprises the peak times of cloud ice, cloud water, and rainwater paths, with the output indicating the start time of precipitation and whether it will occur. If the model predicts no precipitation, then ΔRain Rate and the time of precipitation are set to zero. The input to Submodel 2 consists of changes in cloud ice, cloud water, and rainwater paths, while the output is ΔRain Rate, the peak change in rainfall rate between TRLWP-MIN and the next TRLWP-MIN.
The precipitation-indication models were trained and validated using the precipitation onset times and rainfall rate variations derived from disdrometer observations as reference targets. Each model consisted of four fully connected hidden layers, with 64 neurons in each layer and a sigmoid activation function. The Adam optimizer was used for model training, with mean squared error (MSE) as the loss function. Model performance was evaluated using accuracy (ACC), mean absolute error (MAE), and the correlation coefficient (Corr). Table 8 and Table 9 summarize the performance of the two precipitation-indication submodels.
For Submodel 1, combining the extrema of the C-LWP and R-LWP produced the best overall performance. The precipitation-presence accuracy reached 97%, while the precipitation-onset time was estimated with an MAE of 60 min and a Corr of 0.90. These results indicate that the joint evolution of cloud water and rainwater provides useful information for identifying precipitation occurrence and characterizing its onset time. In comparison, including TIWP-MAX and TIWP-MIN reduced the prediction performance because the IWP generally changed more slowly during the precipitation process. When a single parameter was used, TRLWP-MIN provided the most accurate estimate of precipitation onset, with an MAE of 74 min and a Corr of 0.85, outperforming the extrema of the C-LWP and IWP. This stronger performance is consistent with the closer relationship between the R-LWP and surface rainfall. Meanwhile, the growth and coalescence of cloud droplets contribute to the subsequent formation of raindrops, linking variations in the C-LWP to the development of the R-LWP.
The ability of hydrometeor-path variations to indicate rainfall rate changes differed among the three water phases. Changes in the IWP provided the weakest direct indication. When ΔIWP1, 2 was used as the model input, the MAE for rainfall rate changes was 0.83 mm h−1, while the Corr was only 0.25. Changes in the C-LWP showed a slightly stronger relationship with rainfall rate variations, yielding an MAE of 0.81 mm/h and a Corr of 0.28. Combining changes in the IWP and C-LWP improved the indication of precipitation development relative to using either parameter alone, suggesting that the temporal evolution of ice water and cloud water provides complementary information.
In contrast, changes in the R-LWP provided the strongest indication of rainfall rate variations. As shown in Table 9, when ΔR-LWP1 was used as the model input, the MAE was below 0.70 mm/h, while the Corr exceeded 0.67. These values were substantially better than those obtained using only changes in the IWP or C-LWP, which is consistent with the direct relationship between rainwater and surface precipitation. Furthermore, compared with Input 3 in Table 9, combining changes in the IWP and C-LWP with the R-LWP reduced the MAE for rainfall rate changes to 0.57 mm/h and increased the Corr to 0.71. These results indicate that ice-, cloud-, and rainwater-related parameters provide complementary information for estimating precipitation onset and rainfall rate variations within the analyzed dataset.

4. Conclusions

This study investigated the responses of brightness temperature and polarization difference from a ground-based multi-frequency dual-polarization microwave radiometer to variations in the ice water path (IWP), cloud liquid water path (C-LWP), rain liquid water path (R-LWP), and rainfall rate. The results show that the negative polarization differences associated with non-spherical raindrops provide additional information for distinguishing the relative contributions of cloud water and rainwater. The 89 GHz dual-polarization channel exhibited greater sensitivity to frozen hydrometeors than the lower-frequency channels because of its shorter wavelength and its polarization-dependent response to non-spherical particles. However, this sensitivity decreased under optically thick mixed cloud–rain conditions, in which liquid-water emission, absorption, and scattering could partially mask the ice-scattering signal.
Based on these relationships, a convolutional retrieval model combining MRR reflectivity profiles with microwave–radiometer brightness temperatures and polarization differences was developed. The correlations between the retrieved IWC, C-LWC, and R-LWC profiles and their corresponding ECMWF reference targets were 0.60, 0.70, and 0.84, respectively. The surface rainfall rate retrieval was evaluated against disdrometer observations and achieved a correlation coefficient of 0.84. For rainfall rate retrieval, the Z-only model produced an MAE of 0.09 mm/h and a Corr of 0.82, whereas the combined TB + PD + Z model achieved an MAE of 0.08 mm/h and a Corr of 0.84. Thus, radar reflectivity provided the dominant constraint on rainfall rate, while the radiometer observations produced a modest additional improvement.
The temporal evolution and extrema of the IWP, C-LWP, and R-LWP were further used to construct precipitation indication models. Combining the extrema of the C-LWP and R-LWP produced the best result within the analyzed dataset, with a precipitation-presence accuracy of 97% and an onset-time MAE of 60 min with a Corr of 0.90. Changes in the R-LWP showed the strongest relationship with rainfall rate variations, while the IWP changed more slowly and provided a weaker direct indication of surface rainfall. These results suggest that the temporal evolution of cloud water and rainwater contains useful information for identifying precipitation development. Nevertheless, the reported indication performance should be interpreted within the current experimental definition because its operational lead time, false-alarm rate, missed-event rate, and performance using exclusively pre-onset observations require further evaluation.
Several limitations should be acknowledged. The hydrometeor profile targets were derived from ECMWF reanalysis and ARTS simulations rather than from independent direct observations of vertical IWC, C-LWC, and R-LWC profiles. Therefore, the reported profile correlations primarily represent consistency with the ECMWF reference framework and inherit uncertainties associated with the prescribed particle size distributions, particle shapes, orientations, and atmospheric background profiles. The observations were also collected at a single site in Zhuhai and were dominated by weak-to-moderate stratiform precipitation, limiting the present evaluation under strong convection, typhoon-related rainfall, and hail conditions. Additional uncertainties may arise from the chronological and cross-seasonal data division, the empirical selection of model hyperparameters, the spatial mismatch among ECMWF, MRR, GMD-MR, and disdrometer measurements, and possible rain-related contamination of radiometer observations.
Future work will focus on independent evaluation using vertically resolved cloud and precipitation observations, event-wise separation of training and validation samples, and explicit assessment of lead time, false alarms, and missed events. The retrieval models will also be evaluated across different rainfall intensities, precipitation types, seasons, and sites. Sensitivity tests involving particle size distributions, ice habits, ECMWF background conditions, instrument calibration errors, and wet-radome effects will be required to better quantify retrieval uncertainty and determine the conditions under which microwave–radiometer observations provide meaningful improvements beyond radar reflectivity alone.

Author Contributions

Conceptualization, J.H.; Methodology, J.L.; Software, J.L.; Validation, J.L. and J.H.; Formal analysis, J.L.; Investigation, J.L.; Resources, J.H.; Writing—original draft, J.L.; Writing—review & editing, J.L. and J.H.; Visualization, J.L.; Supervision, J.H.; Project administration, J.H. All authors have read and agreed to the published version of the manuscript.

Funding

This research was funded by Climbing Project of National Space Science Center (Grant No. E4PD40013S).

Data Availability Statement

All data are available upon reasonable request and will be approved by Sun Yat-sen University and the corresponding author.

Conflicts of Interest

The authors declare no conflict of interest.

References

  1. Qi, Y.; Fan, S.; Mao, J.; Li, B.; Guo, C.; Zhang, S. Impact of Assimilating Ground-Based Microwave Radiometer Data on the Precipitation Bifurcation Forecast: A Case Study in Beijing. Atmosphere 2021, 12, 551. [Google Scholar] [CrossRef] [Scilit]
  2. Liu, M.; Liu, Y.-A.; Shu, J. Characteristics Analysis of the Multi-Channel Ground-Based Microwave Radiometer Observations during Various Weather Conditions. Atmosphere 2022, 13, 1556. [Google Scholar] [CrossRef] [Scilit]
  3. Berg, W.; Olson, W.; Ferraro, R.; Goodman, S.J.; LaFontaine, F.J. An Assessment of the First- and Second-Generation Navy Operational Precipitation Retrieval Algorithms. J. Atmos. Sci. 1998, 55, 1558–1575. [Google Scholar] [CrossRef] [Scilit]
  4. Saavedra, P.; Battaglia, A.; Simmer, C. Partitioning of Cloud Water and Rainwater Content by Ground-Based Observations with the Advanced Microwave Radiometer for Rain Identification (ADMIRARI) in Synergy with a Micro Rain Radar. J. Geophys. Res. Atmos. 2012, 117, D05203. [Google Scholar] [CrossRef] [Scilit]
  5. Czekala, H.; Crewell, S.; Simmer, C.; Thiele, A. Discrimination of Cloud and Rain Liquid Water Path by Groundbased Polarized Microwave Radiometry. Geophys. Res. Lett. 2001, 28, 267–270. [Google Scholar] [CrossRef] [Scilit]
  6. Cadeddu, M.P.; Marchand, R.; Orlandi, E.; Turner, D.D.; Mech, M. Microwave Passive Ground-Based Retrievals of Cloud and Rain Liquid Water Path in Drizzling Clouds: Challenges and Possibilities. IEEE Trans. Geosci. Remote Sens. 2017, 55, 6468–6481. [Google Scholar] [CrossRef] [Scilit]
  7. Brath, M.; Ekelund, R.; Eriksson, P.; Lemke, O.; Buehler, S.A. Microwave and Submillimeter Wave Scattering of Oriented Ice Particles. Atmos. Meas. Tech. 2020, 13, 2309–2333. [Google Scholar] [CrossRef] [Scilit]
  8. Barlakas, V.; Geer, A.J.; Eriksson, P. Introducing Hydrometeor Orientation into All-Sky Microwave and Submillimeter Assimilation. Atmos. Meas. Tech. 2021, 14, 3427–3447. [Google Scholar] [CrossRef] [Scilit]
  9. Kneifel, S.; Löhnert, U.; Battaglia, A.; Crewell, S.; Siebler, D. Snow Scattering Signals in Ground-Based Passive Microwave Radiometer Measurements. J. Geophys. Res. Atmos. 2010, 115, D16214. [Google Scholar] [CrossRef] [Scilit]
  10. Xie, X.; Xiao, X.; He, J.; Saavedra Garfias, P.; Li, T.; Yu, X.; Gu, S.; Guo, Y. In Situ Observations of Rain Rate and Precipitation Microphysics over the Coastal Area of South China: Perspectives for Satellite Validation. J. Hydrometeorol. 2024, 25, 1045–1059. [Google Scholar] [CrossRef] [Scilit]
  11. Li, X.; Xie, X.; Liu, Y.; Zhou, Y.; Saavedra Garfias, P.; Guo, Y.; He, J. Characterizing Stratiform and Convective Precipitation Based on Multi-Source Observations in South Coastal China During 2022–2023. Remote Sens. 2026, 18, 1601. [Google Scholar] [CrossRef] [Scilit]
  12. Kühnlein, M.; Appelhans, T.; Thies, B.; Nauß, T. Precipitation Estimates from MSG SEVIRI Daytime, Nighttime, and Twilight Data with Random Forests. J. Appl. Meteorol. Climatol. 2014, 53, 2457–2480. [Google Scholar] [CrossRef] [Scilit]
  13. Sanò, P.; Panegrossi, G.; Casella, D.; Marra, A.C.; Di Paola, F.; Dietrich, S. The New Passive Microwave Neural Network Precipitation Retrieval (PNPR) Algorithm for the Cross-Track Scanning ATMS Radiometer: Description and Verification Study over Europe and Africa Using GPM and TRMM Spaceborne Radars. Atmos. Meas. Tech. 2016, 9, 5441–5460. [Google Scholar] [CrossRef] [Scilit]
  14. Veillette, M.S.; Hassey, E.P.; Mattioli, C.J.; Iskenderian, H.; Lamey, P.M. Creating Synthetic Radar Imagery Using Convolutional Neural Networks. J. Atmos. Ocean. Technol. 2018, 35, 2323–2338. [Google Scholar] [CrossRef] [Scilit]
  15. He, J.; Xie, X.; Guo, Y.; Liu, K. Study on Cloud-Rain Evolution During Precipitation Based on Multi-Frequency and Dual-Polarization Microwave Observations. In Proceedings of the IGARSS 2022—2022 IEEE International Geoscience and Remote Sensing Symposium, Kuala Lumpur, Malaysia, 17–22 July 2022; IEEE: New York, NY, USA, 2022; pp. 4669–4672. [Google Scholar] [CrossRef] [Scilit]
  16. Saha, R.; Testik, F.Y. Assessment of OTT Parsivel2 Raindrop Fall Speed Measurements. J. Atmos. Ocean. Technol. 2023, 40, 557–573. [Google Scholar] [CrossRef] [Scilit]
  17. METEK GmbH. MRR-2. Available online: https://metek.de/product/mrr-2/ (accessed on 31 May 2024).
  18. Buehler, S.A.; Mendrok, J.; Eriksson, P.; Perrin, A.; Larsson, R.; Lemke, O. ARTS, the Atmospheric Radiative Transfer Simulator—Version 2.2, the Planetary Toolbox Edition. Geosci. Model Dev. 2018, 11, 1537–1556. [Google Scholar] [CrossRef] [Scilit]
  19. European Centre for Medium-Range Weather Forecasts (ECMWF). ECMWF Reanalysis v5 (ERA5). Available online: https://www.ecmwf.int/en/forecasts/dataset/ecmwf-reanalysis-v5 (accessed on 6 August 2026).
  20. Petty, G.W.; Huang, W. The Modified Gamma Size Distribution Applied to Inhomogeneous and Nonspherical Particles: Key Relationships and Conversions. J. Atmos. Sci. 2011, 68, 1460–1473. [Google Scholar] [CrossRef] [Scilit]
  21. Deng, M.; Mace, G.G.; Wang, Z.; Lawson, R.P. Evaluation of Several A-Train Ice Cloud Retrieval Products with In Situ Measurements Collected during the SPARTICUS Campaign. J. Appl. Meteorol. Climatol. 2013, 52, 1014–1030. [Google Scholar] [CrossRef] [Scilit]
  22. McFarquhar, G.M.; Heymsfield, A.J. Parameterization of Tropical Cirrus Ice Crystal Size Distributions and Implications for Radiative Transfer: Results from CEPEX. J. Atmos. Sci. 1997, 54, 2187–2200. [Google Scholar] [CrossRef] [Scilit]
  23. Beard, K.V.; Chuang, C. A New Model for the Equilibrium Shape of Raindrops. J. Atmos. Sci. 1987, 44, 1509–1524. [Google Scholar] [CrossRef] [Scilit]
  24. Heymsfield, A.J.; Platt, C.M.R. A Parameterization of the Particle Size Spectrum of Ice Clouds in Terms of the Ambient Temperature and the Ice Water Content. J. Atmos. Sci. 1984, 41, 846–855. [Google Scholar] [CrossRef] [Scilit]
  25. Auer, A.H.; Veal, D.L. The Dimension of Ice Crystals in Natural Clouds. J. Atmos. Sci. 1970, 27, 919–926. [Google Scholar] [CrossRef] [Scilit]
  26. Videen, G.; Babenko, V.; Khlebtsov, N.; Wriedt, T. T-Matrix Theory of Electromagnetic Scattering by Particles and Its Applications: A Comprehensive Reference Database. J. Quant. Spectrosc. Radiat. Transf. 2004, 88, 357–406. [Google Scholar] [CrossRef]
  27. Liou, K.-N. A Numerical Experiment on Chandrasekhar’s Discrete-Ordinate Method for Radiative Transfer: Applications to Cloudy and Hazy Atmospheres. J. Atmos. Sci. 1973, 30, 1303–1326. [Google Scholar] [CrossRef] [Scilit]
  28. Browning, K.A.; Atlas, D. Initiation of Precipitation in Vigorous Convective Clouds. J. Atmos. Sci. 1965, 22, 678–683. [Google Scholar] [CrossRef] [Scilit]
  29. Vivekanandan, J.; Zhang, G.; Politovich, M.K. An Assessment of Droplet Size and Liquid Water Content Derived from Dual-Wavelength Radar Measurements to the Application of Aircraft Icing Detection. J. Atmos. Ocean. Technol. 2001, 18, 1787–1798. [Google Scholar] [CrossRef] [Scilit]
  30. Czekala, H.; Crewell, S.; Simmer, C.; Thiele, A.; Hornbostel, A.; Schroth, A. Interpretation of Polarization Features in Ground-Based Microwave Observations as Caused by Horizontally Aligned Oblate Raindrops. J. Appl. Meteorol. Climatol. 2001, 40, 1918–1932. [Google Scholar] [CrossRef] [Scilit]
  31. Ekelund, R.; Eriksson, P.; Kahnert, M. Microwave Single-Scattering Properties of Non-Spheroidal Raindrops. Atmos. Meas. Tech. 2020, 13, 6933–6944. [Google Scholar] [CrossRef] [Scilit]
  32. Jacob, M.; Ament, F.; Gutleben, M.; Konow, H.; Mech, M.; Wirth, M.; Crewell, S. Investigating the Liquid Water Path over the Tropical Atlantic with Synergistic Airborne Measurements. Atmos. Meas. Tech. 2019, 12, 3237–3254. [Google Scholar] [CrossRef] [Scilit]
  33. Mróz, K.; Battaglia, A.; Kneifel, S.; von Terzi, L.; Karrer, M.; Ori, D. Linking Rain into Ice Microphysics across the Melting Layer in Stratiform Rain: A Closure Study. Atmos. Meas. Tech. 2021, 14, 511–529. [Google Scholar] [CrossRef] [Scilit]
  34. Morrison, H.; Grabowski, W.W. A Novel Approach for Representing Ice Microphysics in Models: Description and Tests Using a Kinematic Framework. J. Atmos. Sci. 2008, 65, 1528–1548. [Google Scholar] [CrossRef] [Scilit]
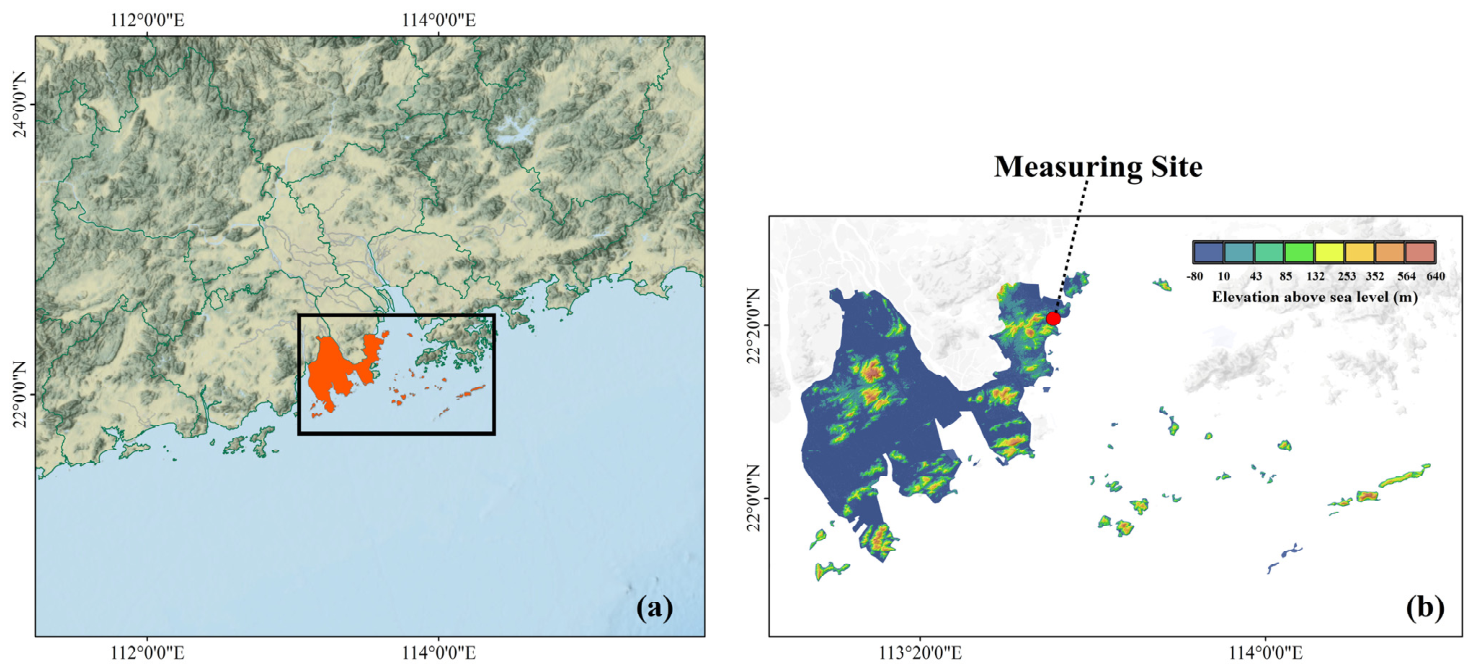
Figure 1. (a,b) The setup location of all onsite instruments.
Remotesensing 18 02941 g001
Figure 2. Flow figure of ice, cloud and rain water content division and brightness temperature matching.
Remotesensing 18 02941 g002
Figure 3. Radar reflectivity factor and rainfall rate from 26 to 27 December 2021. (a) Radar reflectivity Factor; (b) rainfall rate.
Remotesensing 18 02941 g003
Figure 4. Brightness temperature and polarization difference in ground-based radiometer from 26 to 27 December 2021. (a) Brightness temperature for all channels; (b) polarization differences for 10.65 GHz, 18.7 GHz and 23.8 GHz; (c) polarization differences for 36.5 GHz and 89 GHz.
Remotesensing 18 02941 g004
Figure 5. Scatter figure of brightness temperature and polarization difference in ground-based radiometer under different liquid water conditions during the period from 26 to 27 December 2021 (the scatter color on the left represents the proportion of rain liquid water path (R-LWP), 1 represents that LWP is composed of R-LWP, and 0 represents that LWP is composed of C-LWP; scatter color on the right represents the value of R-LWP). (a) 10.65 GHz PD and TB under R-LWP/LWP; (b) 10.65 GHz PD and TB under R-LWP; (c) 18.7 GHz PD and TB under R-LWP/LWP; (d) 18.7 GHz PD and TB under R-LWP; (e) 23.8 GHz PD and TB under R-LWP/LWP; (f) 23.8 GHz PD and TB under R-LWP; (g) 36.5 GHz PD and TB under R-LWP/LWP; (h) 36.5 GHz PD and TB under R-LWP; (i) 89 GHz PD and TB under R-LWP/LWP; (j) 89 GHz PD and TB under R-LWP.
Remotesensing 18 02941 g005aRemotesensing 18 02941 g005b
Figure 6. Scatter figure of 89 GHz channel brightness and polarization difference in ground-based radiometer during precipitation and non-precipitation periods from 26 to 27 December 2021. (a) Precipitation Period IWP under 89 GHz; (b) non-precipitation Period IWP PD.
Remotesensing 18 02941 g006
Figure 7. Response of 89 GHz brightness temperature (simulated by ARTS radiative transfer model) to changes in ice water path under different cloud and rain conditions. (a) Without C-LWP/R-LWP; (b) C-LWP = 1 kg/m2; (c) R-LWP = 0.3 kg/m2.
Remotesensing 18 02941 g007
Figure 8. Flow chart for quantitative estimation of C-LWC, R-LWC, IWC and rainfall rate.
Remotesensing 18 02941 g008
Figure 9. Quantitative estimation results of (a) Retrieved R-LWC with ECMWF R-LWC; (b) retrieved C-LWC with ECMWF.
Remotesensing 18 02941 g009
Figure 10. Temporal and spatial comparison figure of cloud and rain liquid water content between quantitative estimation results and ECMWF reanalysis data from 18 to 23 February 2022.
Remotesensing 18 02941 g010
Figure 11. Quantitative estimation results of ice water content. (a) Retrieved IWC with ECMWF IWC; (b) MAE; (c) Corr.
Remotesensing 18 02941 g011
Figure 12. Quantitative estimation results of rainfall rate. (a) TB retrieval rainfall rate; (b) Z retrieval rainfall rate; (c) TB, PD, and Z retrieval rainfall rate.
Remotesensing 18 02941 g012
Figure 13. Temporal and spatial variation in ice water content, cloud liquid water content, rain liquid water content and rain rate on 21 December 2021.
Remotesensing 18 02941 g013
Figure 14. Temporal and spatial variation in IWC, C-LWC, R-LWC and rain rate for stratiform cloud precipitation events from December 2021 to February 2022. (a) 21 Dec 2021 parameter content overtime; (b) 26 Dec 2021 parameter content overtime; (c) 22 Jan 2022 parameter content overtime; (d) 23 Jan 2022 parameter content overtime; (e) 24 Jan 2022 parameter content overtime; (f) 17 Feb 2022 parameter content overtime.
Remotesensing 18 02941 g014
Figure 15. Explanation of the selection method of precipitation indicator model input (ice, cloud and rain parameters).
Remotesensing 18 02941 g015
Figure 16. Flow figure of precipitation indicator model based on ice, cloud and rain constraints.
Remotesensing 18 02941 g016
Table 1. Specific parameters of GMD-MR.
Central FrequencyPolarizationMain Beam EfficiencyBand Width
10.65 GHzV&H>90%180 MHz
18.7 GHzV&H>90%200 MHz
23.8 GHzV&H>90%400 MHz
36.5 GHzV&H>90%900 MHz
89 GHzV&H>90%3000 MHz
Table 2. Acceptance criteria for GMD-MR based on laboratory tests and field experiments.
ItemRequirementsTest ResultCompliance
Frequency10.7 GHz, 18.7 GHz, 23.8 GHz, 36.5 GHz, 89 GHz10.7 GHz, 18.7 GHz, 23.8 GHz, 36.5 GHz, 89 GHzCompliant
PolarizationV&HV&HCompliant
Calibration MethodTwo Point Calibration & Nonlinear CorrectionTwo Point Calibration & Nonlinear CorrectionCompliant
Calibration Accuracy<0.7 K0.5 KCompliant
Calibration Correlation Coefficient of Observed Brightness Temperature and Actual Brightness Temperature>95%98.5%Compliant
Operating Temperature Range−20 °C~+40 °C−20 °C~+40 °CCompliant
Operating Humidity Range0~100%0~100%Compliant
Table 3. Specific parameters of MRR.
Frequency24.230 GHz
ModeFMCW
Transmit Power50 mW
3 dB Band Width1.5°
Averaging Interval10–3600 s
Height Resolution10–1000 m
Table 4. Quantitative estimation results of cloud and rain liquid water content profiles under different input.
Model Input Based on TB and PD ConstraintsRain Liquid Water
Content (R-LWC)
Cloud Liquid Water
Content (C-LWC)
MAE
(g/m3)
CorrMAE
(g/m3)
Corr
TB××0.080.790.660.45
××Z0.210.640.750.33
TBPD×0.060.820.440.69
TBPDZ0.050.840.430.70
Table 5. Quantitative estimation results of ice water content profiles under different inputs.
Model Input Based on Cloud-Rain ConstrainIce Water Content (IWC)
MAE(g/m3)Corr
TBTBDC-LWPR-LWP0.020.60
Table 6. Quantitative estimation results of rain rate under different inputs.
Model Input Based on TB and PD ConstraintsRain Rate
MAE(mm/h)Corr
TB××0.170.65
××Z0.090.82
TBPDZ0.080.84
Table 7. The Mean and STD values of IWP, C-LWP and R-LWP for stratiform cloud precipitation events from December 2021 to February 2022.
IndicatorTime IWPC-LWPR-LWP
STD (min)Mean (Time)STD (kg/m2)MeanSTD (kg/m2)MeanSTD (kg/m2)Mean
TIWP-MAX49 minTRain-MAX-77 min0.250. 171.992.220.020.05
TCLWP-MAX105 minTRain-MAX-153 min0.190.111.912.490.020.04
TRLWP-MAX14 minTRain-MAX-7 min0.130.101.882.180.931.09
TRain-MAX0 minTRain-MAX0.070.091.632.150.811.05
Table 8. Performance of rainfall indicator submodel 1.
No.Precipitation Index Factor (Input) Start TimePrecipitation Presence
MAE (min)CorrACC (%)
1TIWP-MAX,MIN××3070.2728
2×TCLWP-MAX,MIN×1080.4646
3××TRLWP-MIN740.8595
4TIWP-MAX,MIN×TRLWP-MIN1130.7195
5×TCLWP-MAX,MINTRLWP-MIN600.9097
6TIWP-MAX,MINTCLWP-MAX,MINTRLWP-MIN640.8996
Table 9. Performance of rainfall indicator submodel 2.
No.Precipitation Index Factor (Input)∆Rain Rate
MAE (mm/h)Corr
1×∆CLWP1, 2∆RLWP10.640.70
2∆IWP1, 2∆CLWP1, 2∆RLWP10.570.71
3××∆RLWP10.700.67
4∆IWP1, 2∆CLWP1, 2×0.760.31
5×∆CLWP1, 2×0.810.28
6∆IWP1, 2××0.830.25
Disclaimer/Publisher’s Note: The statements, opinions and data contained in all publications are solely those of the individual author(s) and contributor(s) and not of MDPI and/or the editor(s). MDPI and/or the editor(s) disclaim responsibility for any injury to people or property resulting from any ideas, methods, instructions or products referred to in the content.