Article

A Linear Attention Framework with Dual-Axis Multi-Scale Fusion for Fine-Grained Eucalyptus Change Detection


1
College of Geomatics and Geoinformation, Guilin University of Technology, No. 12 Jian’gan Road, Guilin 541006, China
2
Guangxi Forest Inventory & Planning Institute, No. 14, Zhonghua Road, Nanning 530011, China
*
Author to whom correspondence should be addressed.
Remote Sens. 2026, 18(17), 2944; https://doi.org/10.3390/rs18172944
Submission received: 10 July 2026 / Revised: 27 August 2026 / Accepted: 28 August 2026 / Published: 1 September 2026
(This article belongs to the Section Forest Remote Sensing)

Highlights

What are the main findings?
  • MLLAForestCD achieves strong dataset-specific performance after independent training on ECDD and WHU-CD, showing that the architecture can be optimized for plantation and building change-detection tasks under separate dataset-specific protocols.
  • The 2020–2023 change maps enable retrieval of the most recently detected plantation appearance within the observation window, producing a recent stand-renewal event map rather than a biologically validated stand-age product.
What are the implications of the main findings?
  • The combination of MLLA encoding, dual-axis feature extraction, and multi-scale fusion provides an effective framework for detecting subtle and fragmented vegetation changes.
  • Converting change masks into recent renewal-event indicatorscan support field-verification prioritization; any further forestry interpretation requires independent records and dedicated validation.

Abstract

The fine-scale monitoring of plantation cover disappearance and appearance is challenging because these changes are often expressed as weak within-class variations in high-resolution images. This study proposes MLLAForestCD, a three-class pixel-level semantic change-detection network for Eucalyptus plantations. The model uses an MLLA encoder to model the long-range spatial context with efficient linear attention, while a dual-axis change extractor reorganizes paired bi-temporal features through complementary layouts before contextual interaction. Multi-scale fusion then combines semantic cues with boundary-level details. We further construct the Eucalyptus Change Detection Dataset (ECDD), which contains plantation scenes with weak spectral contrast, fragmented boundaries, and directional canopy textures. Under the retained patch-level training/validation split, MLLAForestCD achieves an F1-score of 96.66% and an mIoU of 93.59%. After separate training and evaluation based on WHU-CD, it achieves an F1-score of 97.29% and an IoU of 90.10%; this result reflects performance under an independent WHU-CD training protocol. Finally, annual change maps from 2020 to 2023 are used to derive the most recently detected plantation-appearance time within the observation window. The resulting product is interpreted as a recent stand-renewal event map and requires independent forestry records before biological stand age can be inferred.

1. Introduction

With the increasing availability of high-resolution imagery, plantation monitoring is no longer limited to coarse land-cover comparisons. Fine-scale monitoring requires the delineation of narrow changed areas, fragmented boundaries, and early canopy-development patterns. Landsat and Sentinel-2 time series remain valuable for regional and long-term disturbance analysis, but their medium-resolution pixels frequently mix tree crowns, roads, bare soil, understory vegetation, and adjacent plantation areas. High-resolution monitoring is therefore valuable for delineating fine spatial changes and prioritizing subsequent field verification.
Remote sensing change detection identifies land-cover differences from images acquired at different dates [1,2,3]. It has been used in urban expansion analysis, disaster assessment, natural-resource monitoring, and ecological monitoring [4,5,6]. With the increasing availability of high-resolution imagery, the task is no longer limited to coarse land-cover comparisons. Many practical applications now require the precise spatial delineation of changed areas [7,8,9].
Algorithm development has followed this shift in application demand. Early approaches depended on hand-crafted spectral, textural, or index-based differences [10]. Deep networks instead learn change representations from paired observations [9,11]. CNN-based Siamese architectures, such as FC-EF, FC-Siam-diff, and FC-Siam-conc [12], provide efficient end-to-end comparison frameworks. However, convolutional operators mainly capture local patterns and have limited ability to relate distant image regions [13,14]. Transformer-based models, including ChangeFormer [15,16], improve long-range modeling through self-attention, but the quadratic computational cost is difficult to scale to large high-resolution scenes [17,18]. Recent state-space and linear-attention designs offer a more efficient alternative for dense remote-sensing prediction [19,20].
Most public change-detection benchmarks focus on buildings, roads, cropland, or other targets with clear visual transitions [21,22]. Construction and demolition commonly produce abrupt spectral changes and sharp boundaries. Eucalyptus plantation dynamics are more subtle: harvesting, thinning, replanting, early regrowth, seasonal leaf-area variation, and canopy closure can preserve the vegetation-like spectra while altering the planting-row texture, shadow distribution, crown density, and compartment boundaries. These weak changes are easily confused with phenology, illumination, shadow, and background vegetation [23,24,25], so effective detection requires spatial texture, context, and boundary modeling rather than reliance on greenness alone.
This property also determines the task definition. In this study, each pixel is assigned to one of three semantic change classes: unchanged, disappearance, or appearance. The network outputs pixel-level semantic masks only. These masks may subsequently be aggregated into region-level summaries, but the method does not identify individual plantation entities or distinguish the causes of change, such as harvesting, disease, storm damage, or fire.
To meet this need, we develop MLLAForestCD, a Siamese change-detection model that uses MLLA [26] as its feature encoder. The main contributions are summarized as follows:
(1) We develop a task-specific Siamese framework that uses MLLA linear attention to combine long-range contextual modeling with local feature extraction, allowing weak plantation changes and fine boundaries to be represented efficiently.
(2) We design a Dual-Axis Change Extractor (DACE) that organizes paired bi-temporal features in two complementary spatial arrangements and integrates the resulting change features across scales. This coordinated design is intended to preserve the plantation texture and irregular compartment boundaries rather than simply stack independent modules.
(3) We independently construct the Eucalyptus Change Detection Dataset (ECDD) for plantation-specific evaluation and demonstrate how annual semantic change maps can be summarized as recent stand-renewal event information within the observation window. We additionally evaluate the architecture based on WHU-CD through separate dataset-specific training, validation, and testing; this experiment supports only WHU-CD-specific performance after retraining.

2. Materials and Methods

This section describes the model architecture, datasets, training protocol, and evaluation metrics used in this study. As shown in Figure 1, MLLAForestCD follows a Siamese encoder–decoder design for bi-temporal high-resolution imagery. The encoder is based on MLLA and produces multi-scale representations with global context and local spatial detail. The decoder reorganizes paired temporal features through complementary layouts and applies contextual feature interaction before multi-scale fusion. The datasets and implementation settings are then introduced to support reproducibility.

2.1. MLLA-Based Backbone Encoder

MLLA is used as the backbone encoder because Eucalyptus change detection requires global context, computational efficiency, and boundary-level detail at the same time. MLLA combines linear attention with Rotary Position Encoding (RoPE) [27] and Local Position Enhancement (LePE) [28]. This structure keeps the capacity of attention-based representation while reducing the cost to near-linear complexity. It is therefore suitable for high-resolution plantation imagery, where change cues may depend on spatial consistency, stand growth patterns, and neighboring disturbances.
The linear attention module avoids the quadratic cost of standard self-attention by changing the order of matrix operations and using a kernel-based approximation. For an input feature X, linear projections first generate the query (Q), key (K), and value (V) tensors:
Q = W q X , K = W k X , V = X
where the projection matrices are learnable parameters. Because the kernel function requires non-negative inputs, Q and K are transformed before attention is computed:
Q = ELU ( Q ) + 1 ,   K = ELU ( K ) + 1
Spatial position is introduced through RoPE:
RoPE ( x m ) = x m e im θ
where the feature at position m is rotated according to a predefined angular frequency. RoPE is then applied to the query and key features:
Q rope = RoPE ( Q ) , K rope = RoPE ( K )
The projected tensors are reshaped into a multi-head form so that attention can be computed in parallel:
Q h = Reshape Q , B , H , N , d , K h = Reshape K , B , H , N , d , V h = Reshape ( V , B , H , N , d )
Q rope h = Reshape Q rope , B , H , N , d , K rope h = Reshape ( K rope , B , H , N , d )
Linear attention is obtained by separately calculating the normalization term and contextual aggregation:
Z = 1 Q h · 1 N j = 1 N K h T + ε  
KV = 1 N K rope h T V h
Attention = ( Q rope h KV ) Z
Output = Attention + Conv 2 D ( V )
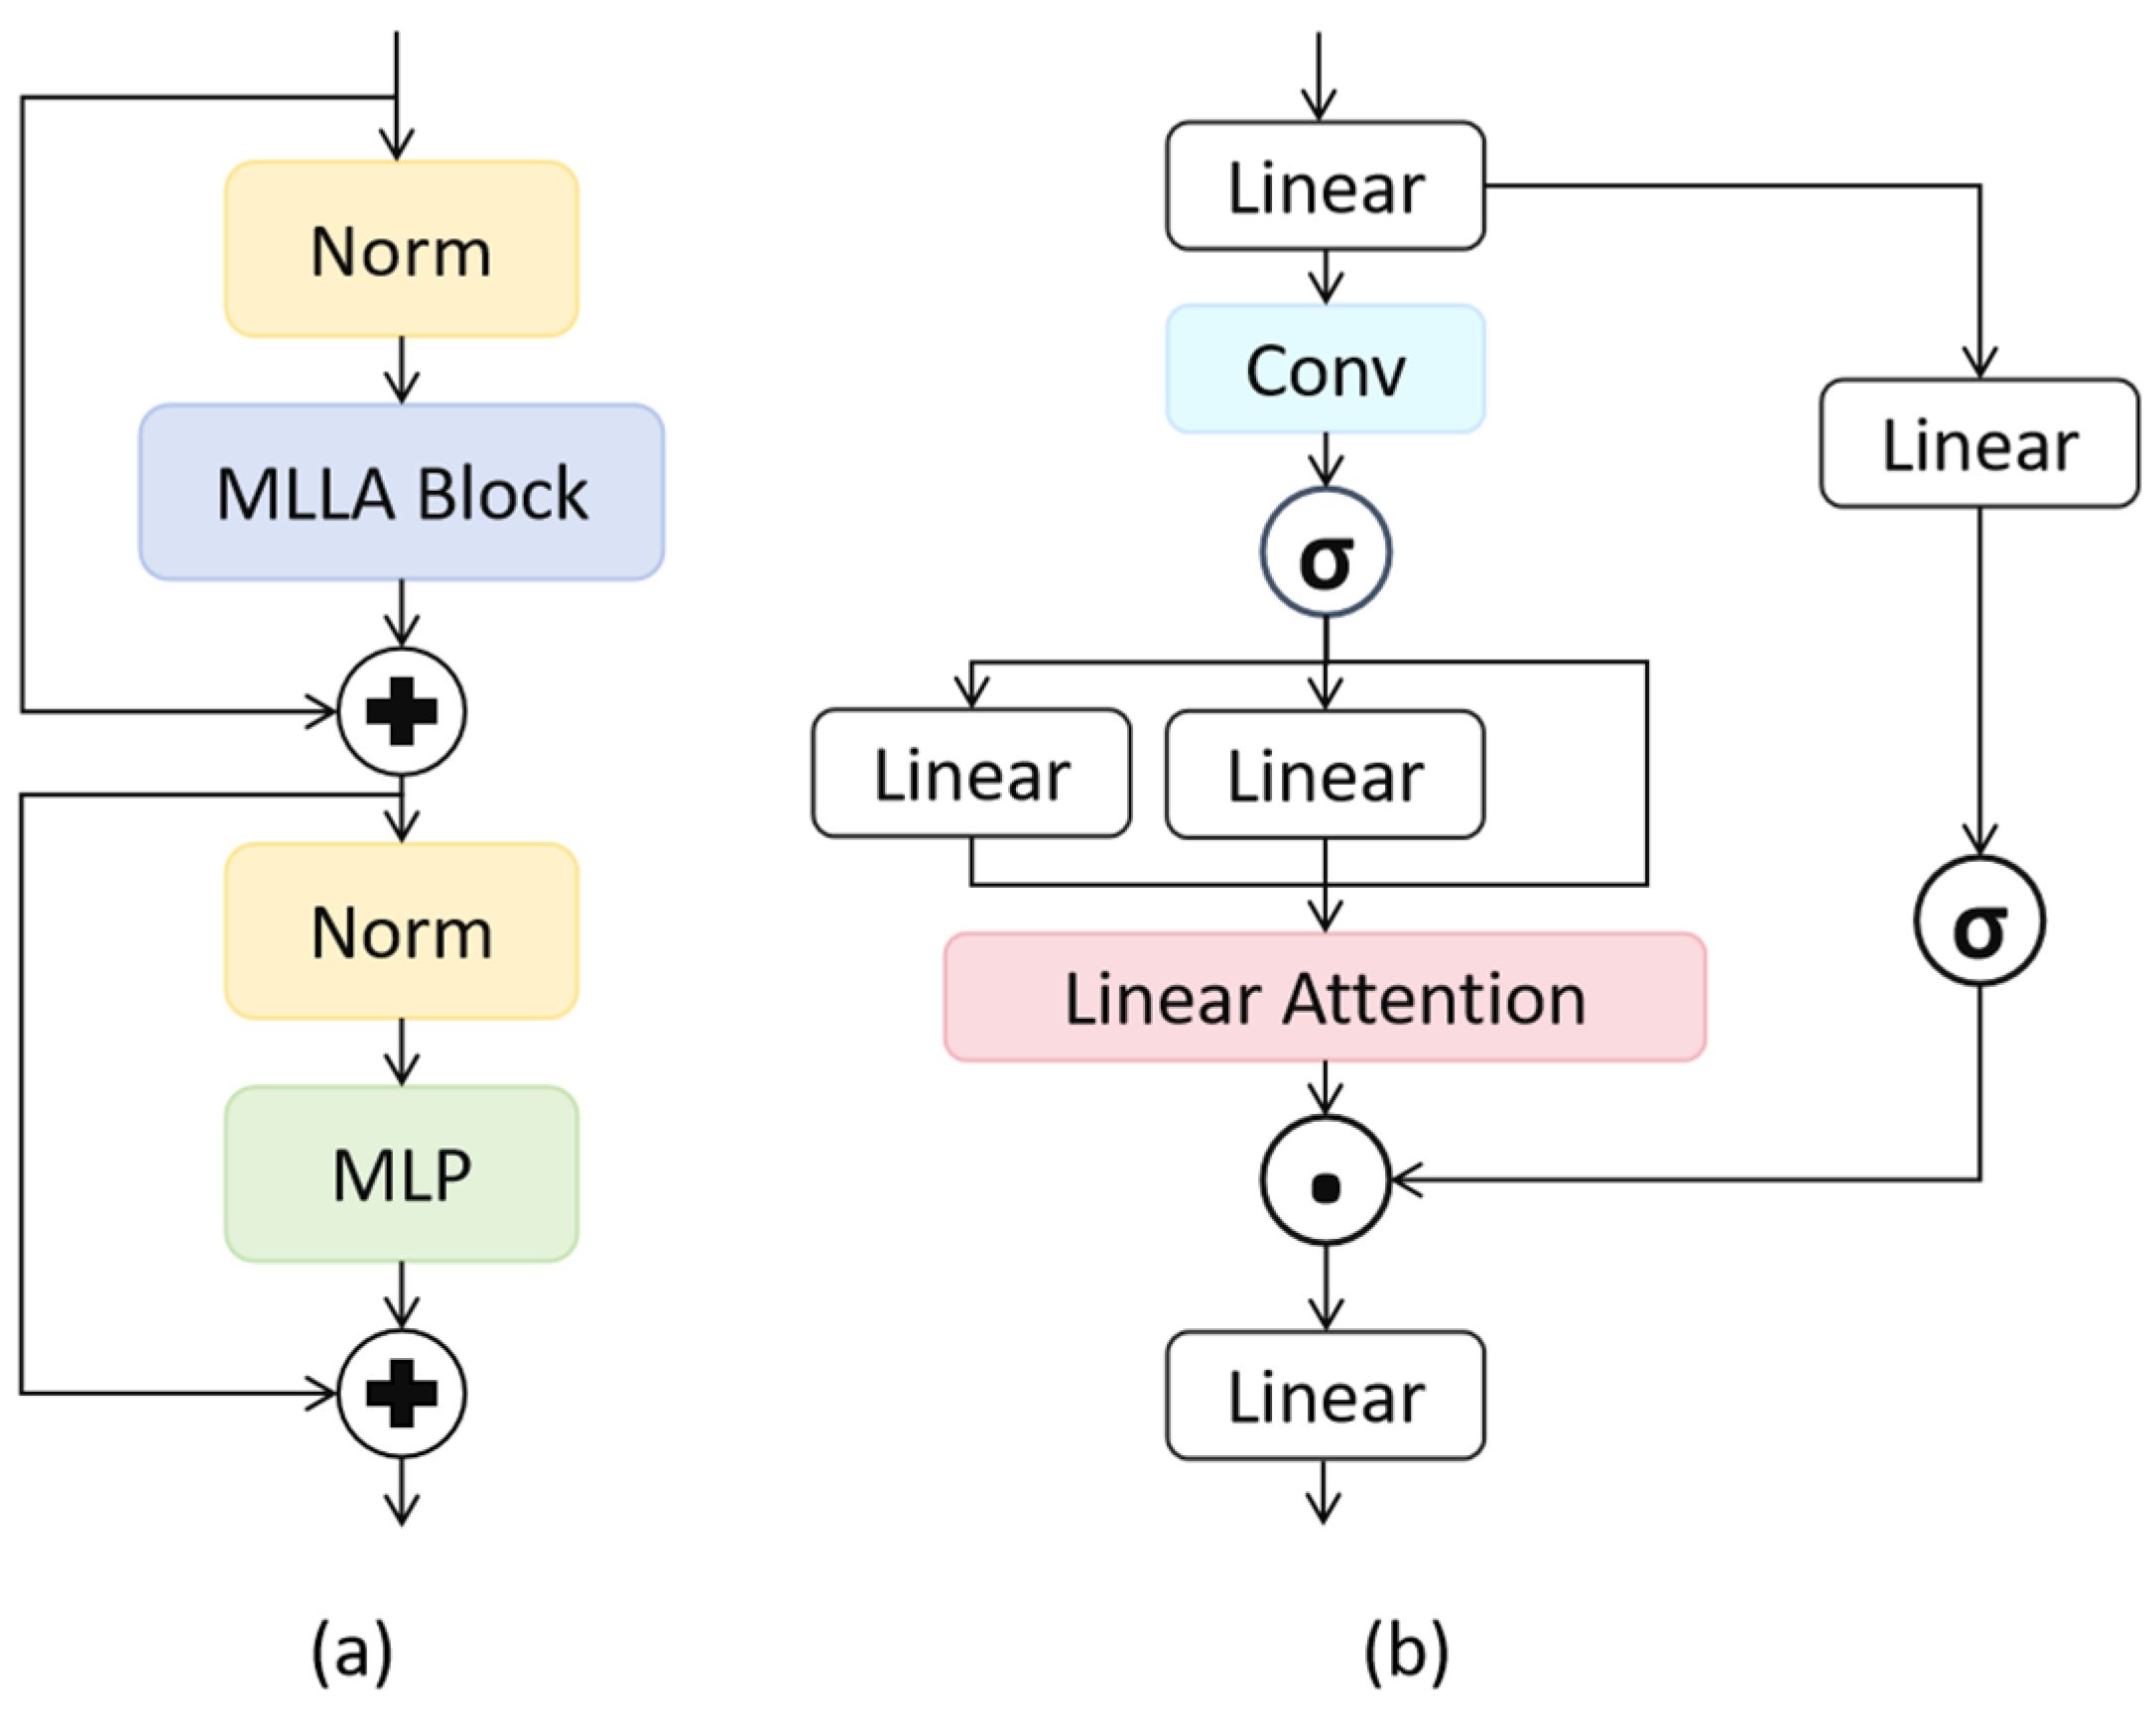
This formulation follows the linear-attention interpretation of MLLA. The encoder uses parallel matrix multiplication with position-aware linear attention and does not contain a native recurrent forgetting mechanism. Its relationship to Mamba is limited to the motivation of efficient context modeling; operationally, MLLA remains a parallel linear-attention architecture. Local convolution branches complement the global representation by improving sensitivity to edges and textures. The MLLA structure is illustrated in Figure 2.
For the 256 × 256 input used in this study, the encoder produces four hierarchical feature maps with spatial resolutions of 64 × 64, 32 × 32, 16 × 16, and 8 × 8 (stride factors of 4, 8, 16, and 32). After feature projection, the corresponding channel dimensions supplied to the decoder are 128, 256, 512, and 1024. The decoder upsamples all scale-specific change features to the 64 × 64 level before fusion, thereby combining progressively stronger semantics with fine spatial detail.
The encoder adopts four downsampling stages built from MLLA blocks. After linear embedding, features are processed through two branches. One branch enhances local texture and edge information with shallow convolution, and the other branch captures broader dependencies with linear attention. Layer normalization and gating are used to merge the two streams into multi-scale representations. This design helps reduce false responses caused by illumination and phenological variation while retaining boundary evidence. Deeper stages use channel projection, normalization, and positional encoding to improve cross-temporal semantic alignment. The four resulting feature levels are passed to the decoder for pixel-wise change prediction.

2.2. Dual-Axis Change Feature Extraction Decoder

The decoder receives four pairs of multi-scale features from the Siamese encoder. At each scale, the features from the two dates are processed by the Dual-Axis Change Extractor (DACE), which generates a scale-specific change representation. The decoder then upsamples these outputs to the highest spatial resolution and fuses them with convolution. This process combines high-level semantics with local spatial evidence, allowing the final change map to reflect both the stand-level context and boundary detail.
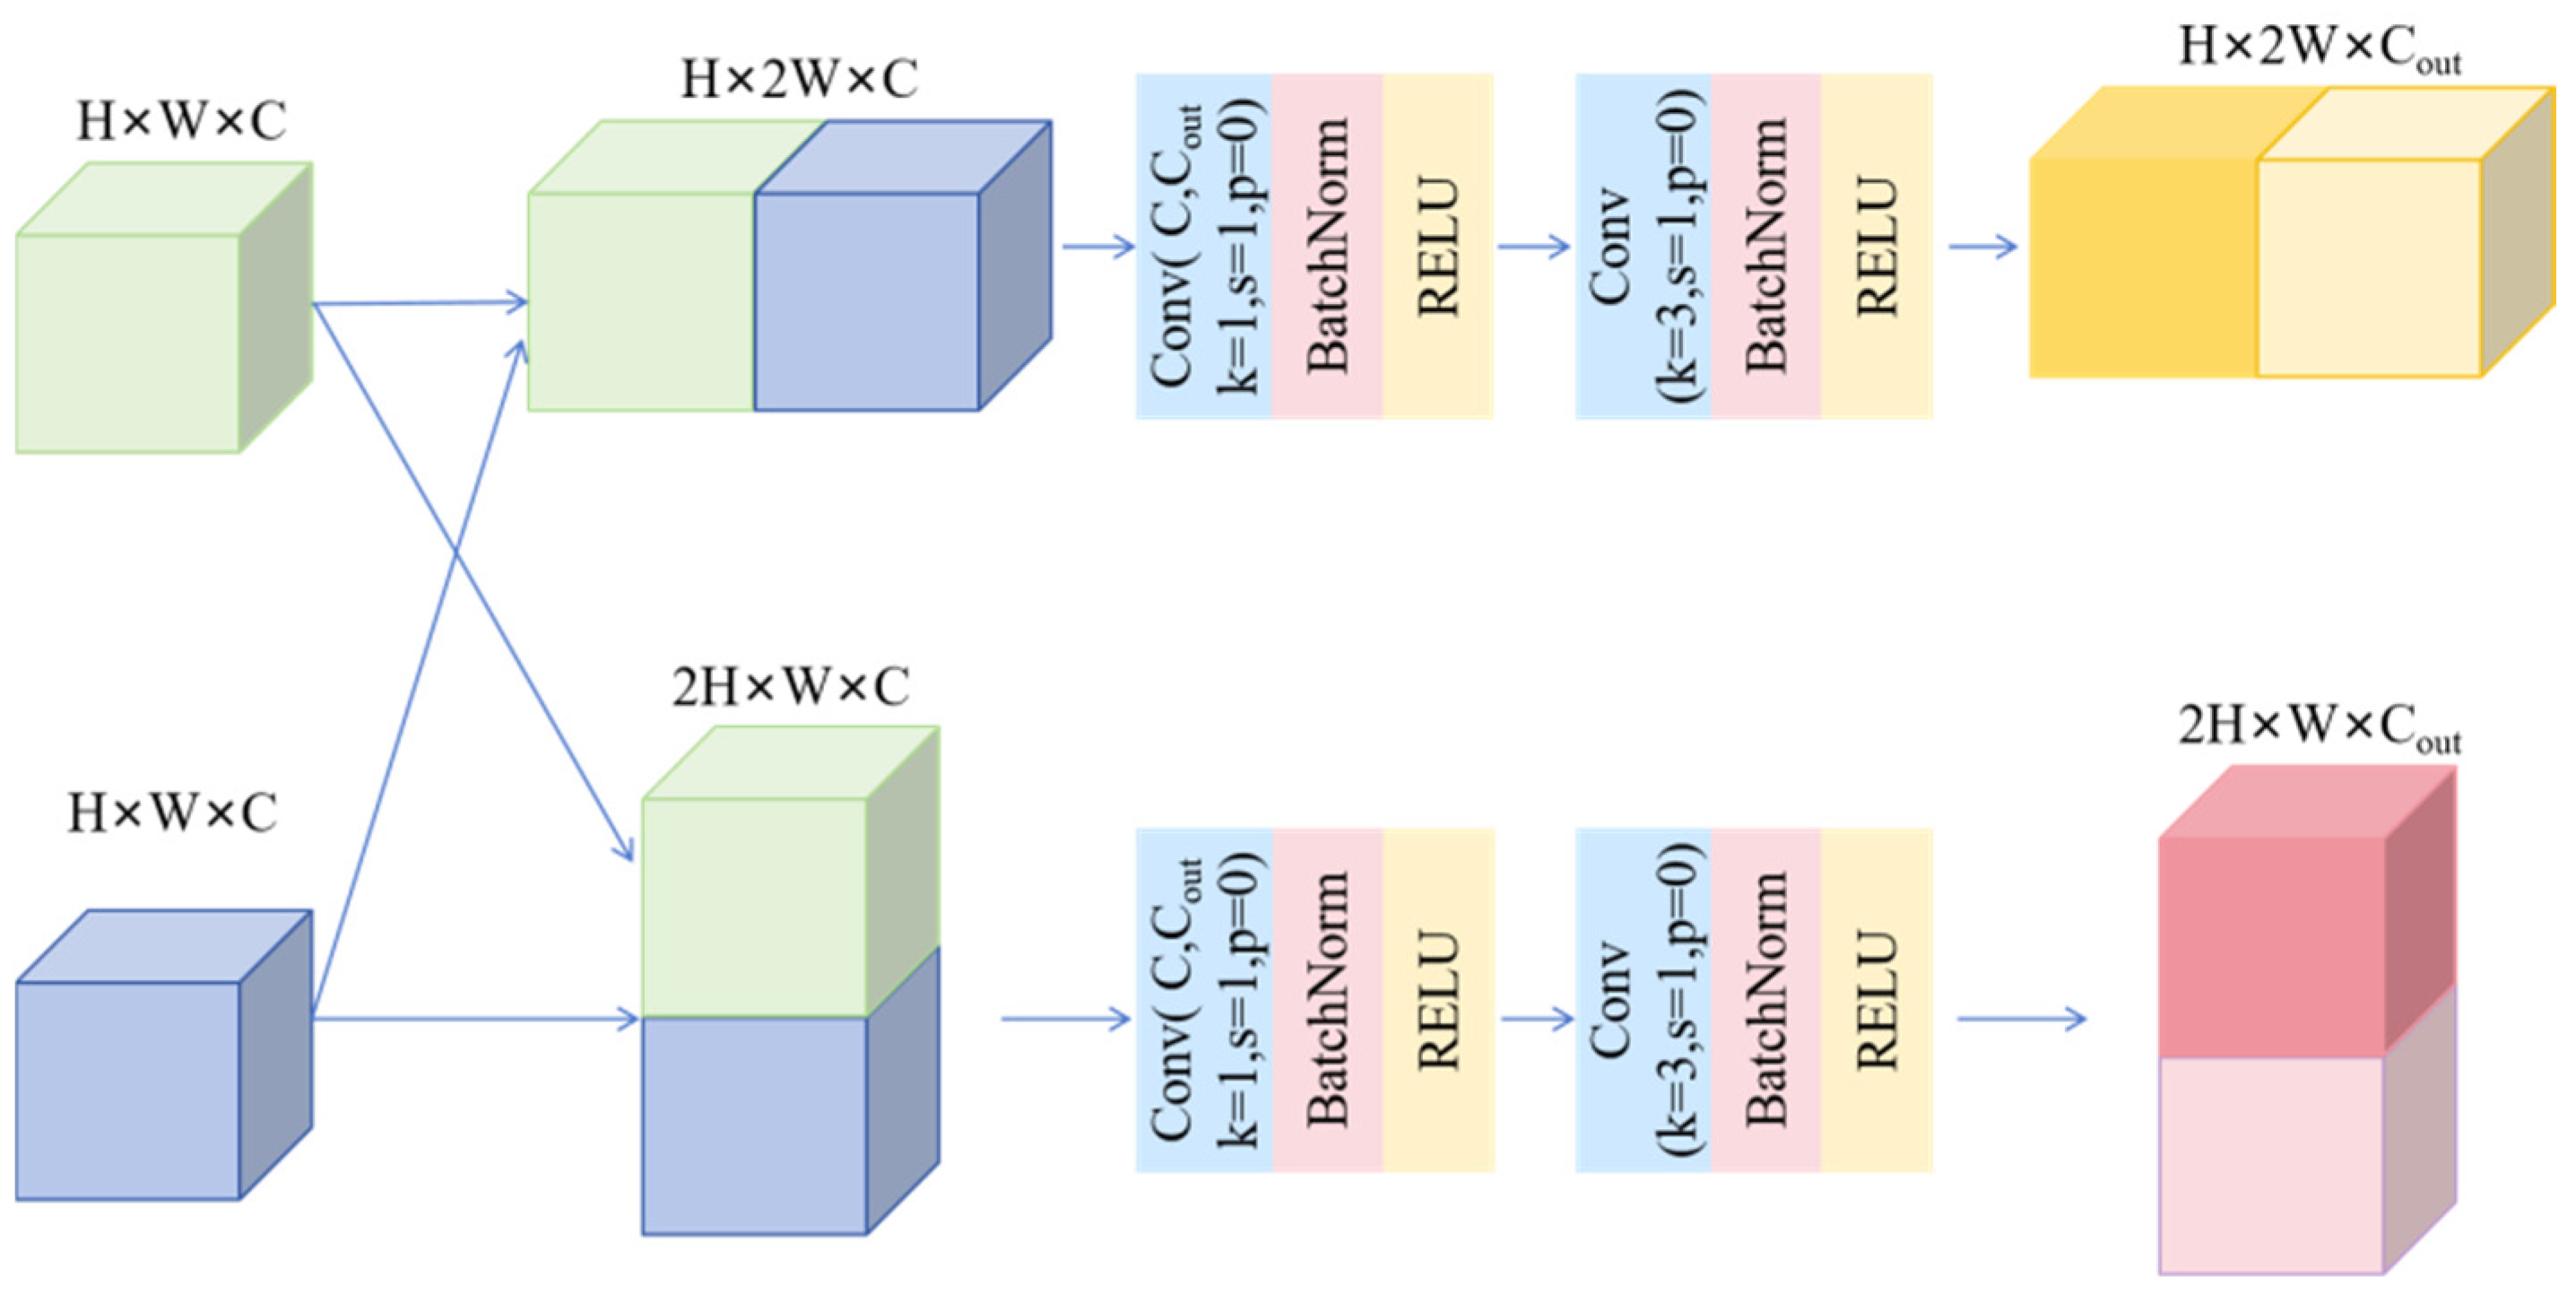
Let F1s and F2s ∈ R(Cs×Hs×Ws) denote the paired feature maps at scale s. DACE first constructs a horizontal spatial arrangement by placing the two dates side by side along the width dimension. A shared projection-and-convolution operator φₕ is then applied to the resulting tensor:
F h s = C a t _ W ( F 1 s , F 2 s ) R ^ ( C s × H s × 2 W s )
Z h s = φ h ( F h s )
The transformed horizontal tensor is split at its original width so that the two temporal parts return to the same Hs × Ws geometry. The split outputs are therefore position-aligned before temporal fusion:
The vertical branch performs the analogous operation along the height dimension:
( Z h , 1 s , Z h , 2 s ) = S p l i t _ W ( Z h s ; W s )
F v s = C a t _ H ( F 1 s , F 2 s ) R ^ ( C s × 2 H s × W s )
After the shared vertical transformation, the tensor is split at the original height. The four restored outputs are concatenated along the channel dimension and projected by a 1 × 1 convolution:
The scale-specific DACE representation and the subsequent four-level fusion are written as follows:
Z v s = φ v ( F v s )
( Z v , 1 s , Z v , 2 s ) = S p l i t _ H ( Z v s ; H s )
D s = φ _ f ( C a t _ C [ Z h , 1 s , Z h , 2 s , Z v , 1 s , Z v , 2 s ] )
D s = D A C E ( F 1 s , F 2 s ) ,               s { 1 , 2 , 3 , 4 }
D = φ _ m ( C a t _ C [ U p ( D 1 ) , U p ( D 2 ) , U p ( D 3 ) , U p ( D 4 ) ] )
The structure of the Dual-Axis Change Extractor is shown in Figure 3. These equations clarify that a local convolution does not directly span two corresponding pixels separated by a full feature-map width or height. Instead, each spatially arranged tensor undergoes a shared transformation; the two temporal parts are then split, restored to identical coordinates, and compared through channel-wise fusion. The spatial arrangement may also introduce branch-specific boundary context. Accordingly, the advantage of this design is treated as an empirical question and is evaluated against absolute differencing, ordinary channel concatenation, and a parameter-matched channel-concatenation control in Section 3.1. The horizontal-only and vertical-only controls test whether either spatial organization is sufficient; they do not establish intrinsic directional sensitivity.
For cross-scale fusion, the four change features are bilinearly upsampled to the same resolution, concatenated, and integrated based on a 1 × 1 convolution. This step brings together semantic information from deeper layers and spatial detail from shallower layers. The classification head converts the fused representation into a three-class pixel-level semantic change map. Region-level summaries may be derived via post-processing, but the network does not output instances or attribute change causes.

2.3. Loss Function

The final retained training configuration uses unweighted cross-entropy together with Dice loss to address pixel-wise class prediction and region overlap. Class-weighted cross-entropy was not used. The total objective is L = LCE + 3LDice, where the Dice-loss weight is 3.0.
The cross-entropy component is defined as follows:
L o s s = i = 1 N y i l o g ( p i )
where N denotes the number of classes, the ground-truth label is encoded as a one-hot vector, and the predicted probability is obtained from the final softmax layer. The Dice component is computed from the predicted probabilities and one-hot reference masks as follows:
LDice = 1 − (1/C) Σc=1C [(2⟨pc, yc⟩ + ε)/(‖pc22 + ‖yc22 + ε)].
where C = 3; p and y denote the predicted-probability and one-hot reference vectors for each class, respectively; and ε is a numerical-stability term. The weighted objective above is used for optimization.

2.4. Datasets and Experimental Design

The experiments were designed to evaluate MLLAForestCD from three perspectives. First, matched ablation experiments examine the MLLA encoder, the DACE comparison strategy, multi-scale fusion, and DACE-specific diagnostic controls. Second, MLLAForestCD is compared with five representative change-detection methods based on the ECDD. Third, all methods are trained and evaluated separately based on WHU-CD to assess dataset-specific architectural applicability in a contrasting task. The Precision, Recall, F1-score, and IoU are reported for a quantitative assessment.

2.4.1. ECDD Dataset

Task-specific datasets are important for developing change-detection models in forestry scenes. Existing deep-learning benchmarks have advanced building and disaster-related change detection, but public datasets for Eucalyptus plantation monitoring remain limited. This data gap makes it difficult to evaluate whether a model can detect weak canopy and stand-structure changes.
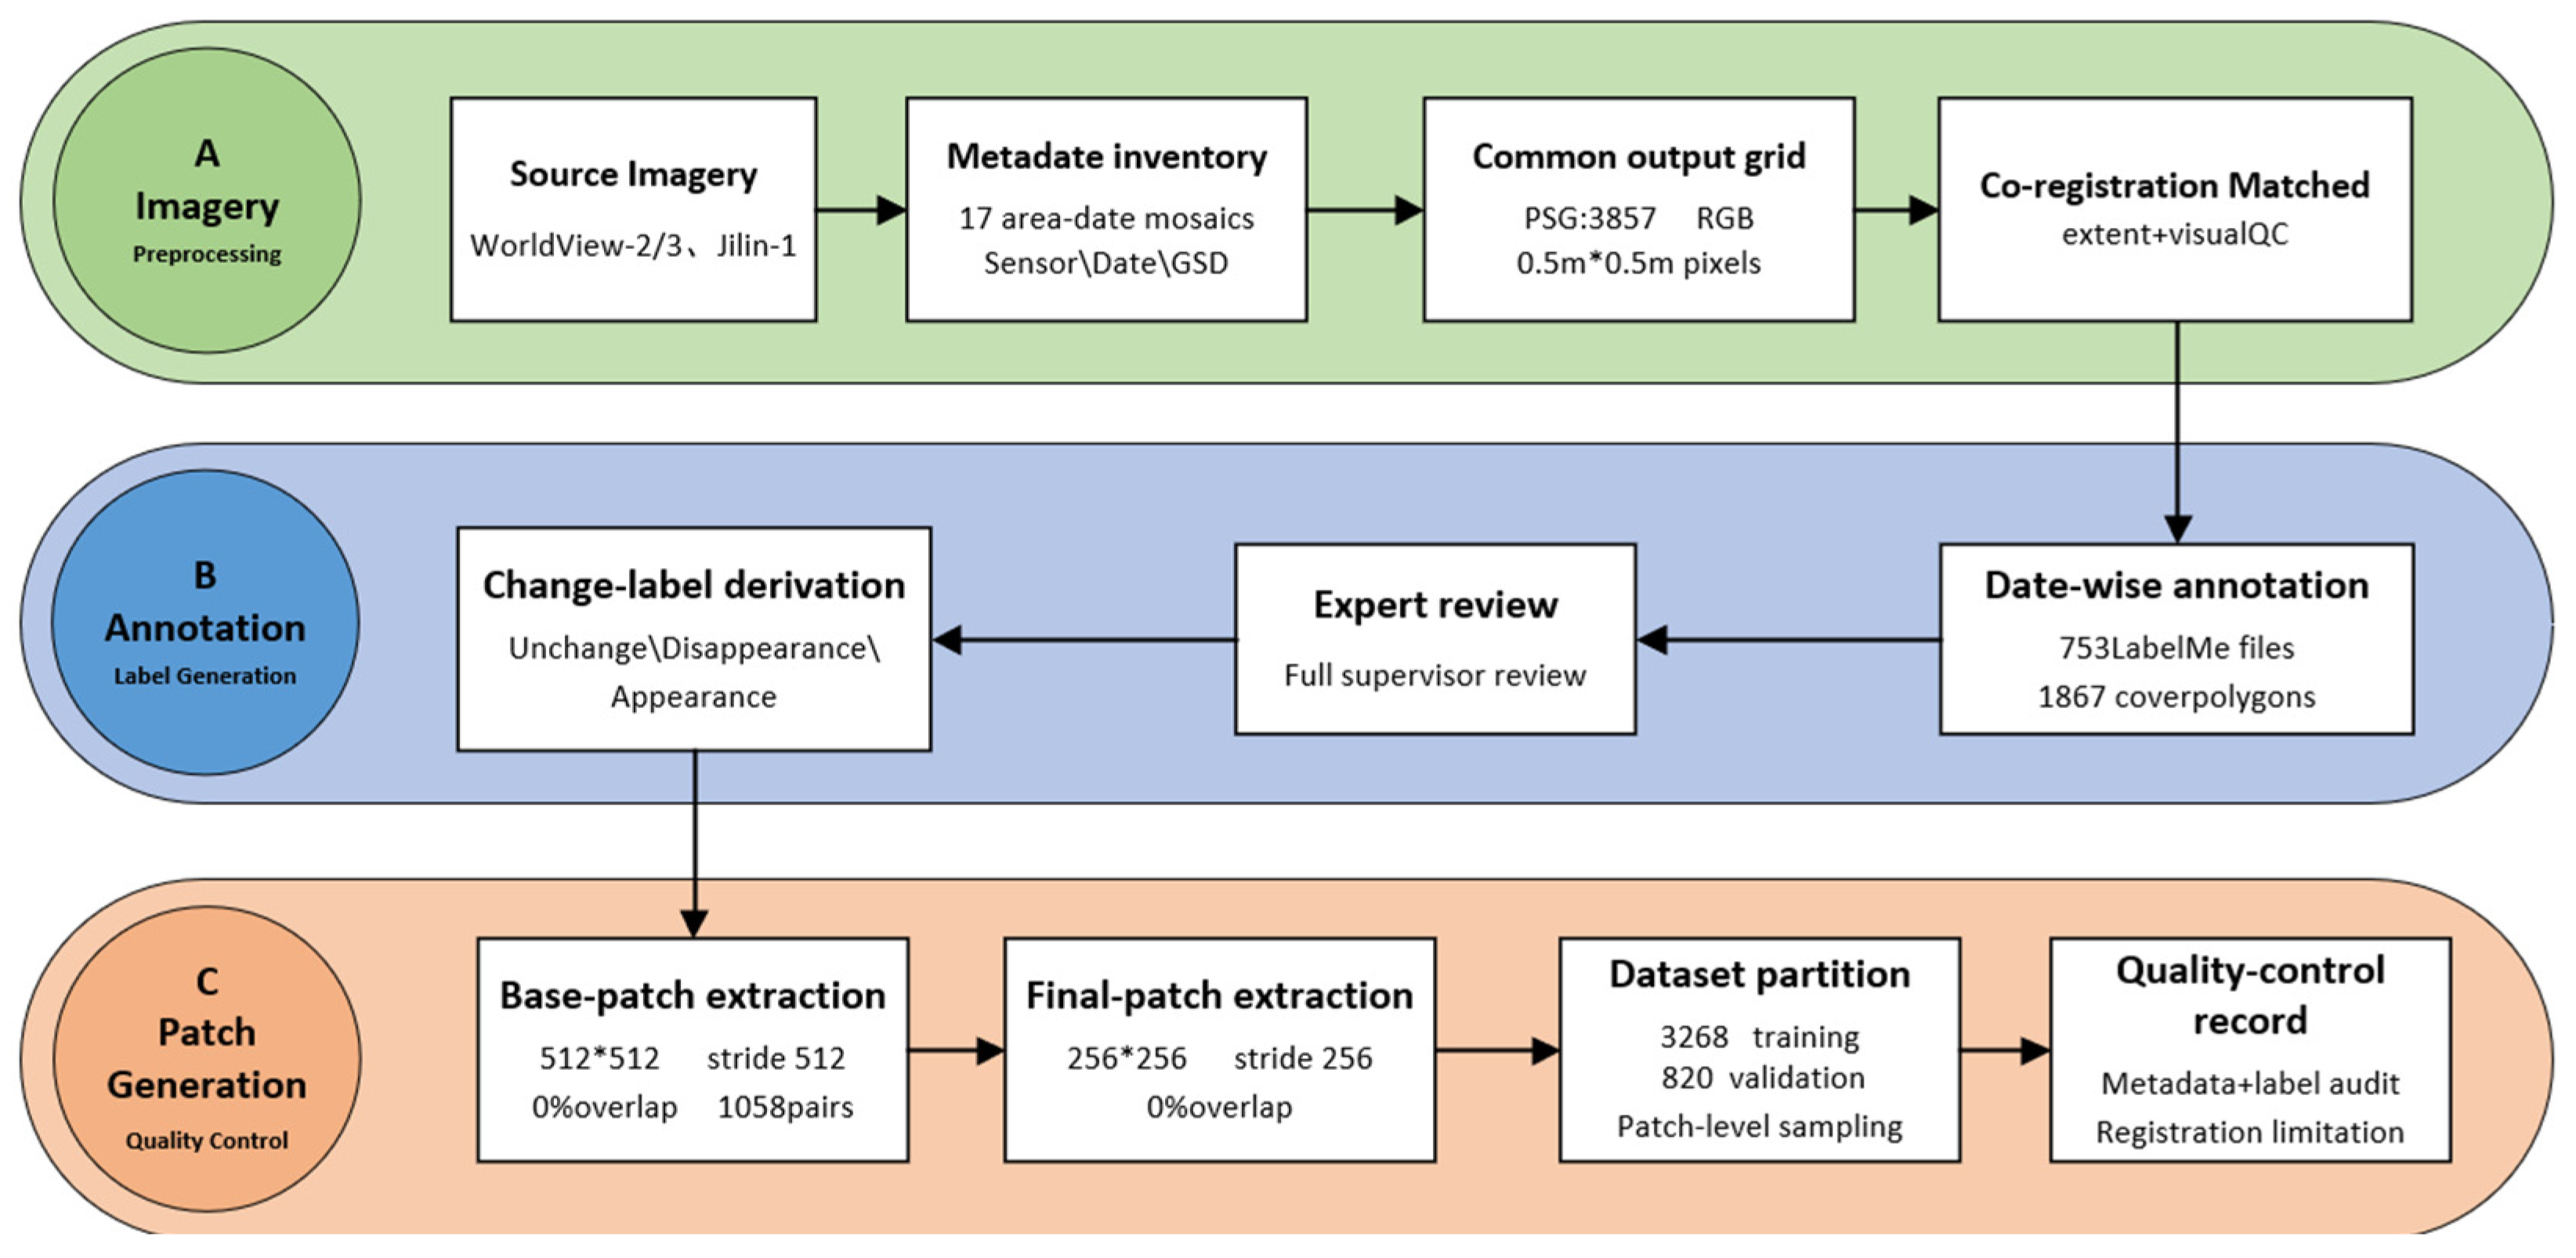
To support this task, we independently constructed the Eucalyptus Change Detection Dataset (ECDD) from author-processed high-resolution optical satellite imagery rather than by cleaning or relabeling an existing public benchmark. ECDD contains three pixel-level semantic classes: unchanged, disappearance, and appearance. The recovered preparation record contains 16 area–date source mosaics and 28 available bi-temporal area combinations. Initial non-overlapping cropping generated 1058 paired 512 × 512 base patches with a stride of 512 pixels (0% overlap). Each retained base patch was subsequently divided into four 256 × 256 patches using a stride of 256 pixels (0% overlap). After retained filtering and partitioning, the current archive contains 3268 training pairs and 820 validation pairs. The workflow is shown in Figure 4.
The ECDD source archive covers four non-contiguous Eucalyptus plantation areas (Area1, Area2, Area4, Area5) in the Liuzhou–Laibin region of central Guangxi Zhuang Autonomous Region, southern China, spanning approximately 109.5043–109.6635°E and 23.8636–24.5242°N. The available paired samples therefore originate from Areas1, 2, 4, and 5. Archived metadata identify Jilin-1 and WorldView products at approximately a 0.5–1.2 m source resolution, but a complete sensor–acquisition-date table cannot be reconstructed from the retained files.
To make the ECDD construction procedure reproducible, we compiled the sensor/date combinations, source ground sampling distances, and the common output grid in Table 1. The 16 area–date mosaics were transformed to EPSG:3857 and exported as RGB rasters on a common 0.5 m × 0.5 m pixel grid. The retained archive contains 28 available bi-temporal combinations and 1058 non-overlapping 512 × 512 paired base patches.
Before label generation, each available bi-temporal image pair was co-registered, resampled onto a common 0.5 m output grid within its geographic area, and clipped to identical extents. RGB bands were retained and normalized with the mean and standard deviation used by the training configuration. No additional radiometric correction or pan-sharpening was applied beyond the processing contained in the delivered source products. Stable roads, compartment boundaries, and other persistent features were visually inspected for residual offsets. Because a quantitative registration RMSE was not retained, no numerical RMSE is reported.
Initial ECDD polygons were delineated by a graduate researcher from the same research group who had been trained to interpret Eucalyptus plantation patterns; the complete label set was then repeatedly reviewed by the supervising professor. The two dates were examined side by side using the canopy tone, planting-row texture, crown density, compartment continuity, and surrounding spatial context. A pixel was labeled unchanged when its plantation/non-plantation state remained the same at both dates, disappearance when plantation cover was present only at the earlier date, and appearance when plantation cover was present only at the later date. Boundaries were traced conservatively along the clearest consistent canopy or compartment edge. Ambiguous areas were jointly re-examined at both dates and corrected after supervisor review. No independent field inventory, UAV survey, or external stand-history record was available for label validation, which is acknowledged as a limitation.
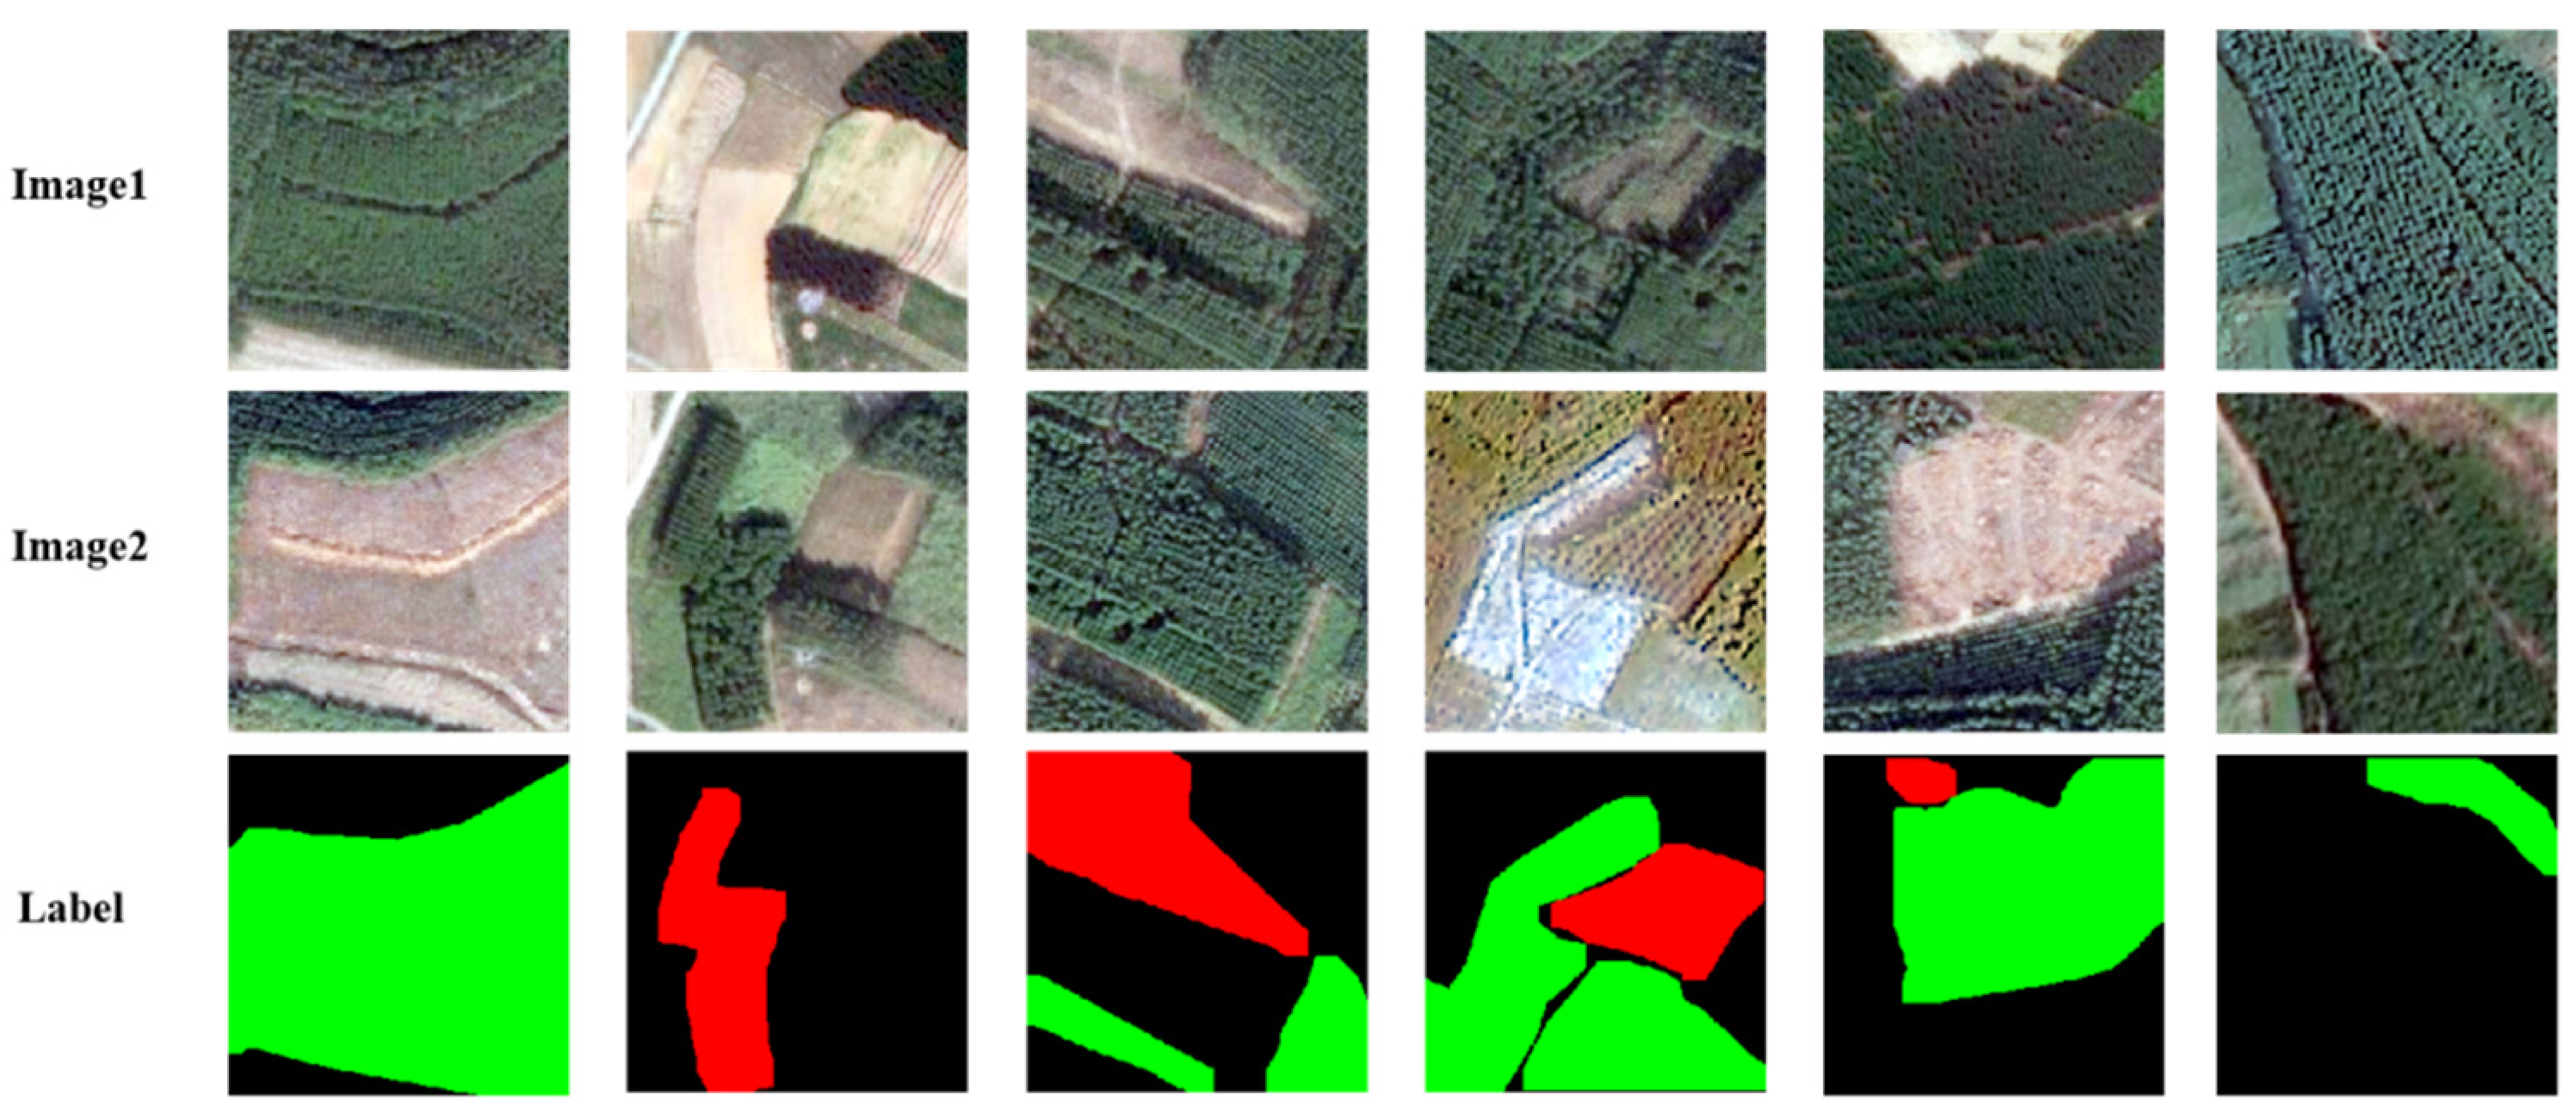
Unlike urban datasets dominated by hard changes, ECDD focuses on soft forest changes. Changed patches often have vague boundaries, irregular shapes, and strong sensitivity to illumination and phenology. These properties increase the demand for robust feature extraction and detailed boundary perception. ECDD therefore provides a plantation-specific benchmark for methodological research on fine-grained semantic change mapping. Example image pairs are shown in Figure 5.

2.4.2. WHU-CD Dataset for Cross-Scenario Validation

To assess the architecture in a contrasting building-change task, MLLAForestCD and all comparison methods were independently trained, validated, and tested using the WHU-CD split [29]. No ECDD-trained weights were evaluated based on WHU-CD; therefore, this experiment evaluates only performance obtained under an independent WHU-CD training protocol.
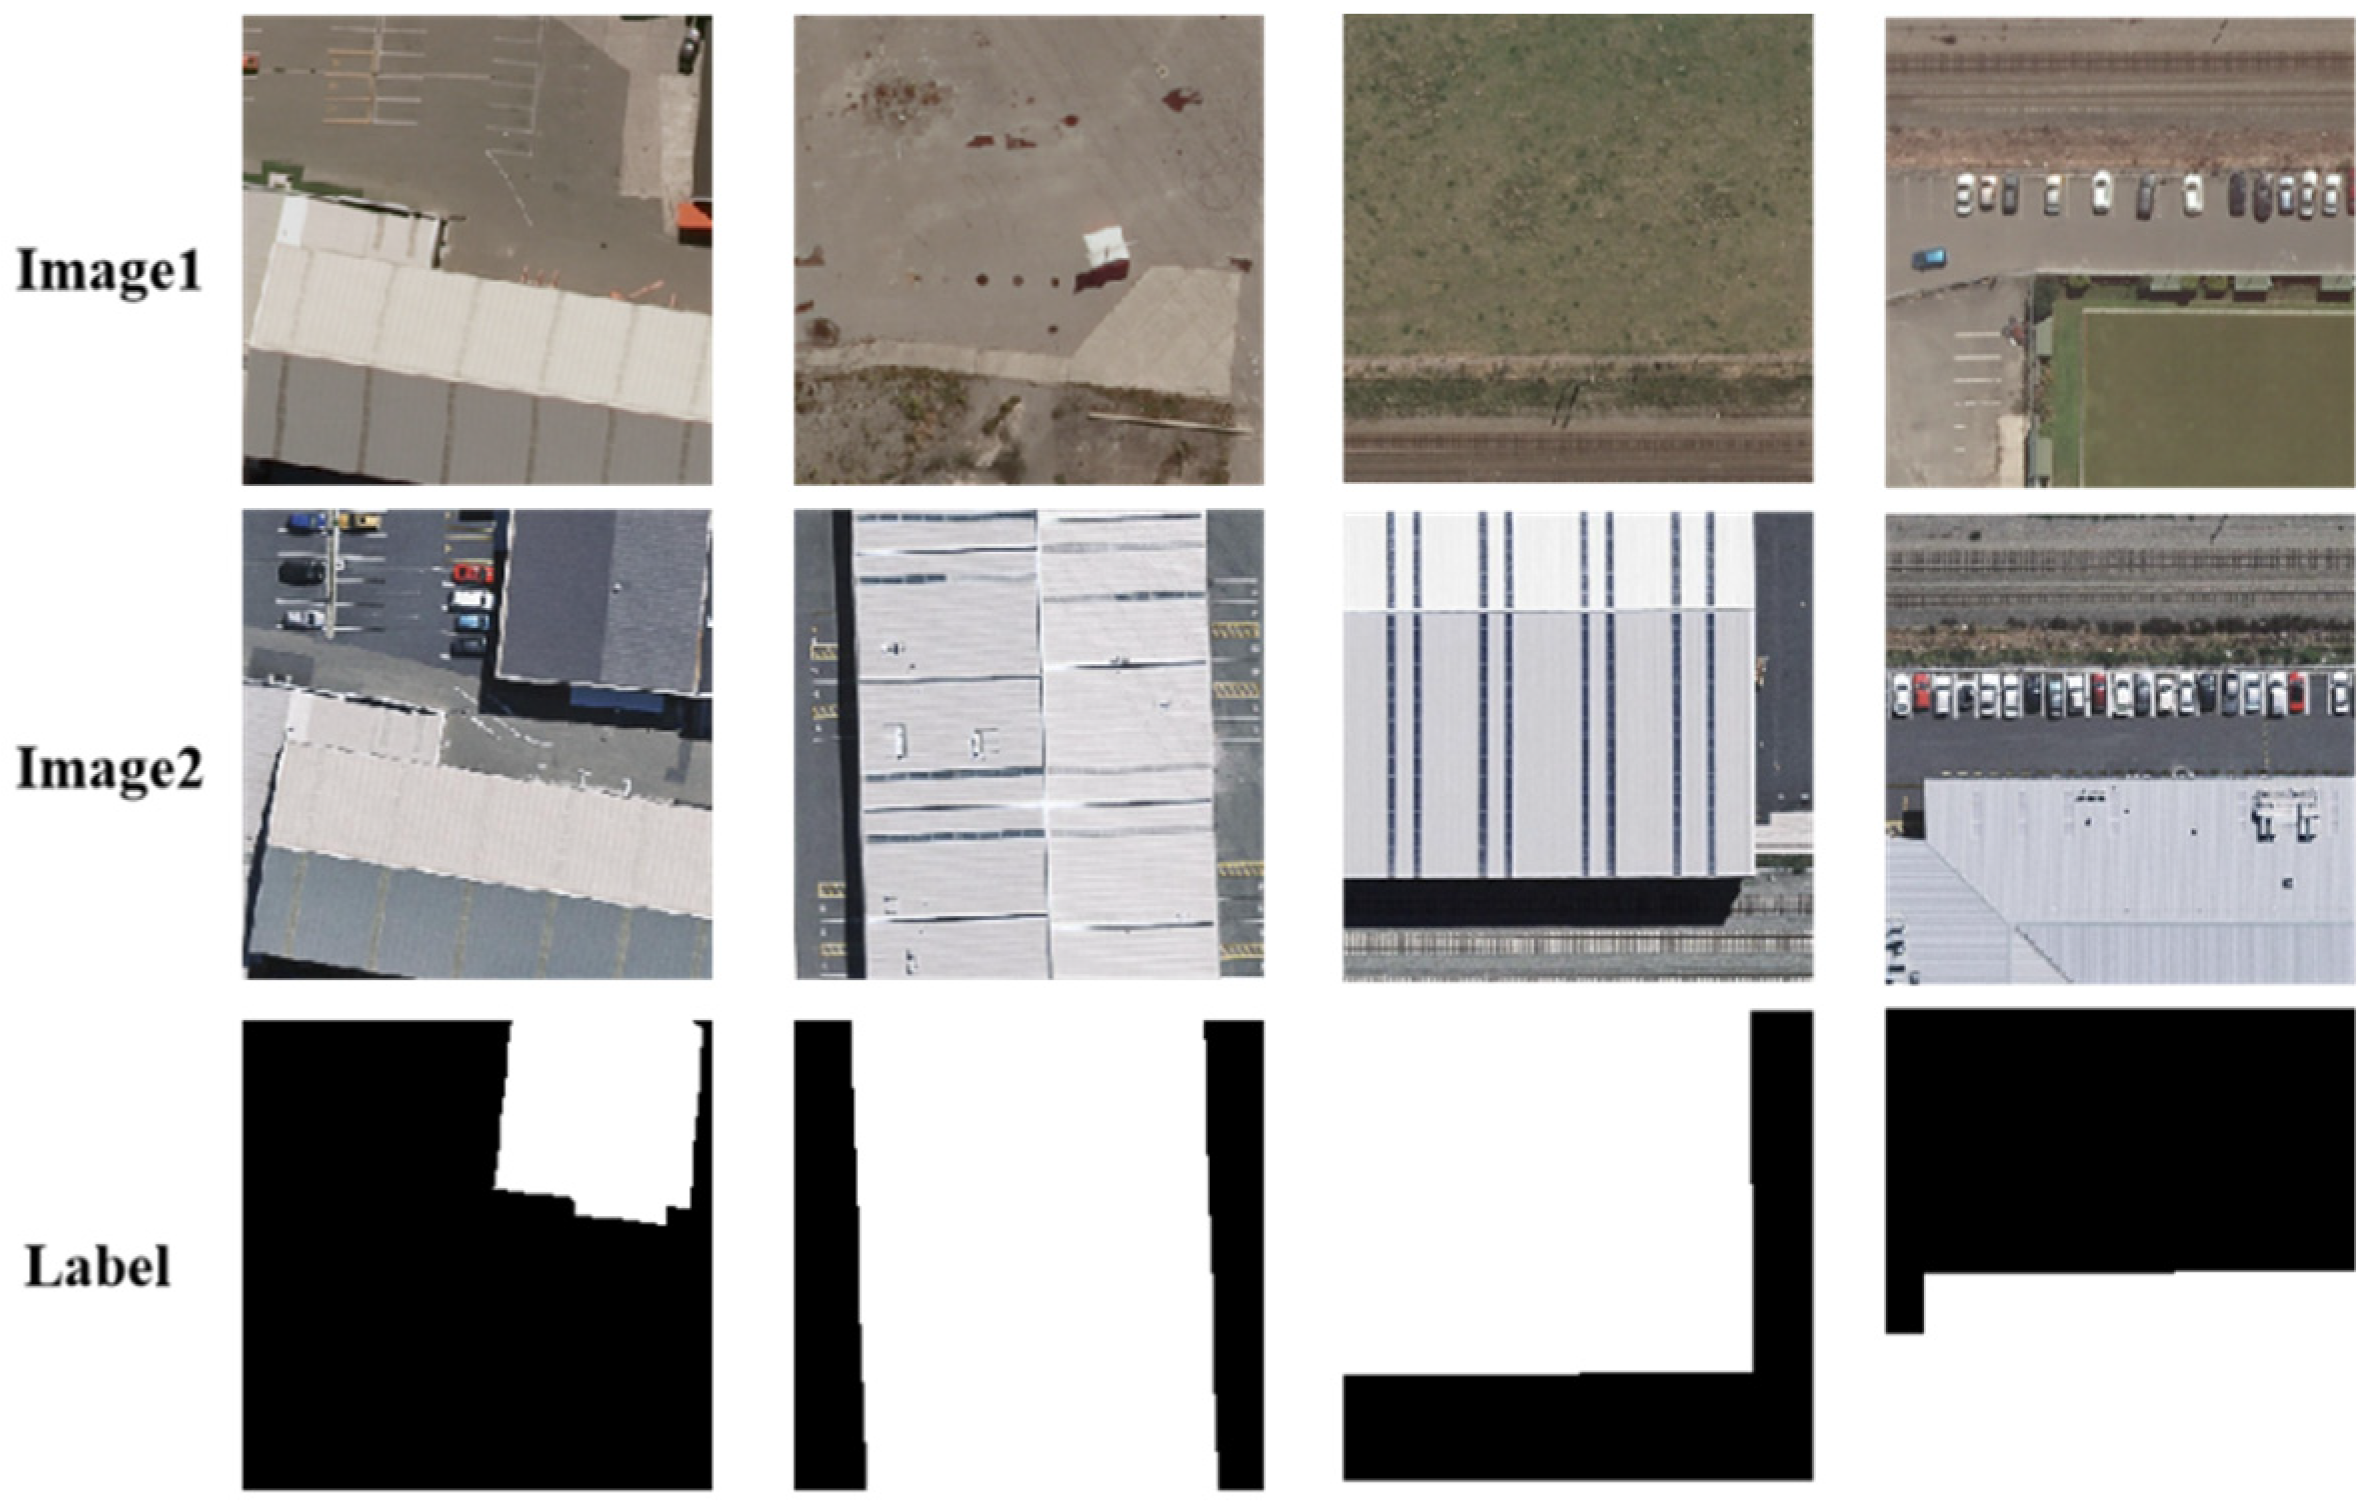
WHU-CD contains two high-resolution aerial images of the same area acquired in 2012 and 2016. The spatial resolution is 0.2 m, and binary change masks are provided. The original images, with a size of 32,507 × 15,354 pixels, were cropped into 256 × 256 patches and divided into training, validation, and test sets. Examples are shown in Figure 6.
WHU-CD mainly represents building changes, which usually have a regular geometry and clearer boundaries than plantation changes. It therefore provides a contrasting hard-change scenario for a separate dataset-specific evaluation of the architecture. Because all models are retrained on WHU-CD and no ECDD-trained weights are tested directly, these results support only WHU-CD-specific performance after retraining and should not be interpreted beyond that experimental setting.

2.5. Implementation Details and Evaluation Metrics

All principal method-comparison experiments were conducted in PyTorch 1.13.1 (CUDA 11.7 and cuDNN 8.5) on an NVIDIA RTX 4090 GPU and used the retained 60,000-iteration protocol. The matched ablation experiments in Section 3.1 were conducted separately for 20,000 iterations with a batch size of 8, validation every 2000 iterations, AdamW, an initial learning rate of 6 × 10⁻⁵, weight decay of 0.01, and seed of 3407. For every ablation variant, the best checkpoint was selected according to validation-set mIoU. All variants used unweighted cross-entropy plus Dice loss with a Dice weight of 3.0 and the same 256 × 256 bi-temporal RGB inputs. MLLAForestCD contains approximately 73.28 million parameters and requires approximately 0.24 TFLOPs for one input pair. The inference latency, peak GPU memory, and complete hardware-normalized per-baseline complexity logs were not retained, so no unsupported efficiency advantage is claimed.
Model performance is evaluated with four confusion-matrix metrics: Precision (Pre), Recall (Rec), F1-score, and Intersection over Union (IoU). Precision describes the reliability of predicted change pixels, whereas Recall measures the proportion of real changes detected. The F1-score balances Precision and Recall, and IoU measures the overlap between the predicted and reference change regions. The metrics are defined as follows:
P r e = T P T P + F P × 100 %  
R e c = T P T P + F N × 100 %  
F 1 -Score = 2 P r e × R e c P r e + R e c
I o U = T P F P + T P + F N × 100 %  
where TP, TN, FP, and FN represent true positives, true negatives, false positives, and false negatives, respectively.
For ECDD, Precision, Recall, F1-score, and IoU are computed separately for unchanged, disappearance, and appearance in a one-versus-rest manner. The reported mean values are unweighted arithmetic macro averages across the three classes; disappearance and appearance are not merged. Table 2 reports the class-specific metrics and training-split pixel proportions. For WHU-CD, the benchmark remains a binary changed/unchanged task, and the reported binary metrics follow its standard protocol.

3. Results

The results are presented in four parts: DACE pathway ablation, comparison based on ECDD, independent dataset-specific evaluation based on WHU-CD, and recent stand-renewal event mapping from annual change outputs. These experiments evaluate model accuracy and illustrate a potential downstream use of the pixel-level outputs.

3.1. Ablation Study

Table 3 presents the five matched component controls. Under the common 20,000-iteration protocol, the full MLLA–DACE model with four-level fusion obtains 92.40% mIoU. Replacing MLLA with ResNet-34 reduces mIoU by 1.56 percentage points. Replacing DACE with ordinary channel concatenation reduces mIoU by 1.59 points, while absolute differencing yields 70.04% mIoU. Restricting DACE to the finest feature level reduces mIoU by 14.31 points. These controls support contributions from the MLLA encoder, the DACE comparison strategy, and multi-scale fusion under the tested patch-level protocol.
Table 4 further examines the DACE mechanism. The complete horizontal–vertical DACE obtains 92.40% mIoU, compared with 90.81% for ordinary channel concatenation and 90.85% for a parameter-matched channel-concatenation control. The 1.55-point advantage over the parameter-matched control indicates that the improvement is not explained solely by a larger comparator. The horizontal-only and vertical-only variants obtain 92.62% and 92.36%, respectively.
The single-branch results require a restrained interpretation. Both spatial arrangements are effective, but the complete two-branch model does not outperform the horizontal-only variant in this single-seed run. We therefore conclude only that spatial rearrangement followed by restoration and aligned fusion is more effective than the tested channel-concatenation controls; the present experiment does not demonstrate an additional complementary gain from combining both directions. The absolute-difference comparator also has lower capacity and removes signed temporal information, so its large decrease should not be attributed exclusively to the spatial arrangement.

3.2. Comparison with Existing Change Detection Methods Based on ECDD

MLLAForestCD is compared with five representative change-detection methods based on ECDD: SNUNet [30], ChangeFormer, Changer [31], BAN [32], and ChangeMamba. The quantitative results are listed in Table 5.
The methods show clear performance differences on ECDD. SNUNet and BAN produce lower scores, suggesting that their architectures are less suited to weak and irregular forestry changes. Changer and ChangeFormer perform better, with F1-scores of 90.08% and 93.00% and mIoU values of 82.37% and 87.15%, respectively. These results show the value of global-context modeling. ChangeMamba further improves the performance, reaching an F1-score of 94.95% and an mIoU of 90.84%, which reflects the strength of near-linear sequence modeling for high-resolution imagery.
MLLAForestCD obtains the highest values for all reported metrics. It achieves an F1-score of 96.66%, Precision of 97.16%, Recall of 96.17%, and mIoU of 93.59%. Relative to ChangeMamba, the second-best method, the gains are 1.71 percentage points in the F1-score and 2.75 percentage points in mIoU. These improvements indicate better semantic consistency and region overlap in Eucalyptus plantation scenes.
The matched component ablations in Section 3.1 separately evaluate the MLLA encoder, DACE comparison strategy, and multi-scale fusion under a common 20,000-iteration protocol. Together with the DACE-specific diagnostic controls, these results support module-level attribution within the retained patch-level split. Because all retained experiments use a single seed, multi-seed testing is still required before claiming statistical significance.
The observed baseline behavior is consistent with architectural differences. ChangeFormer is a Transformer-based change-detection framework, but patch aggregation may smooth weak plantation boundaries. ChangeMamba uses a Mamba-based backbone for the long-range context, but it does not organize each bi-temporal feature pair in the two DACE arrangements before comparison. These frameworks provide useful references for feature extraction and contextual modeling. MLLAForestCD combines linear attention, local convolution, and dual-axis bi-temporal organization, consistent with its stronger boundary and region scores. These statements are architecture-based interpretations, not direct causal proof.
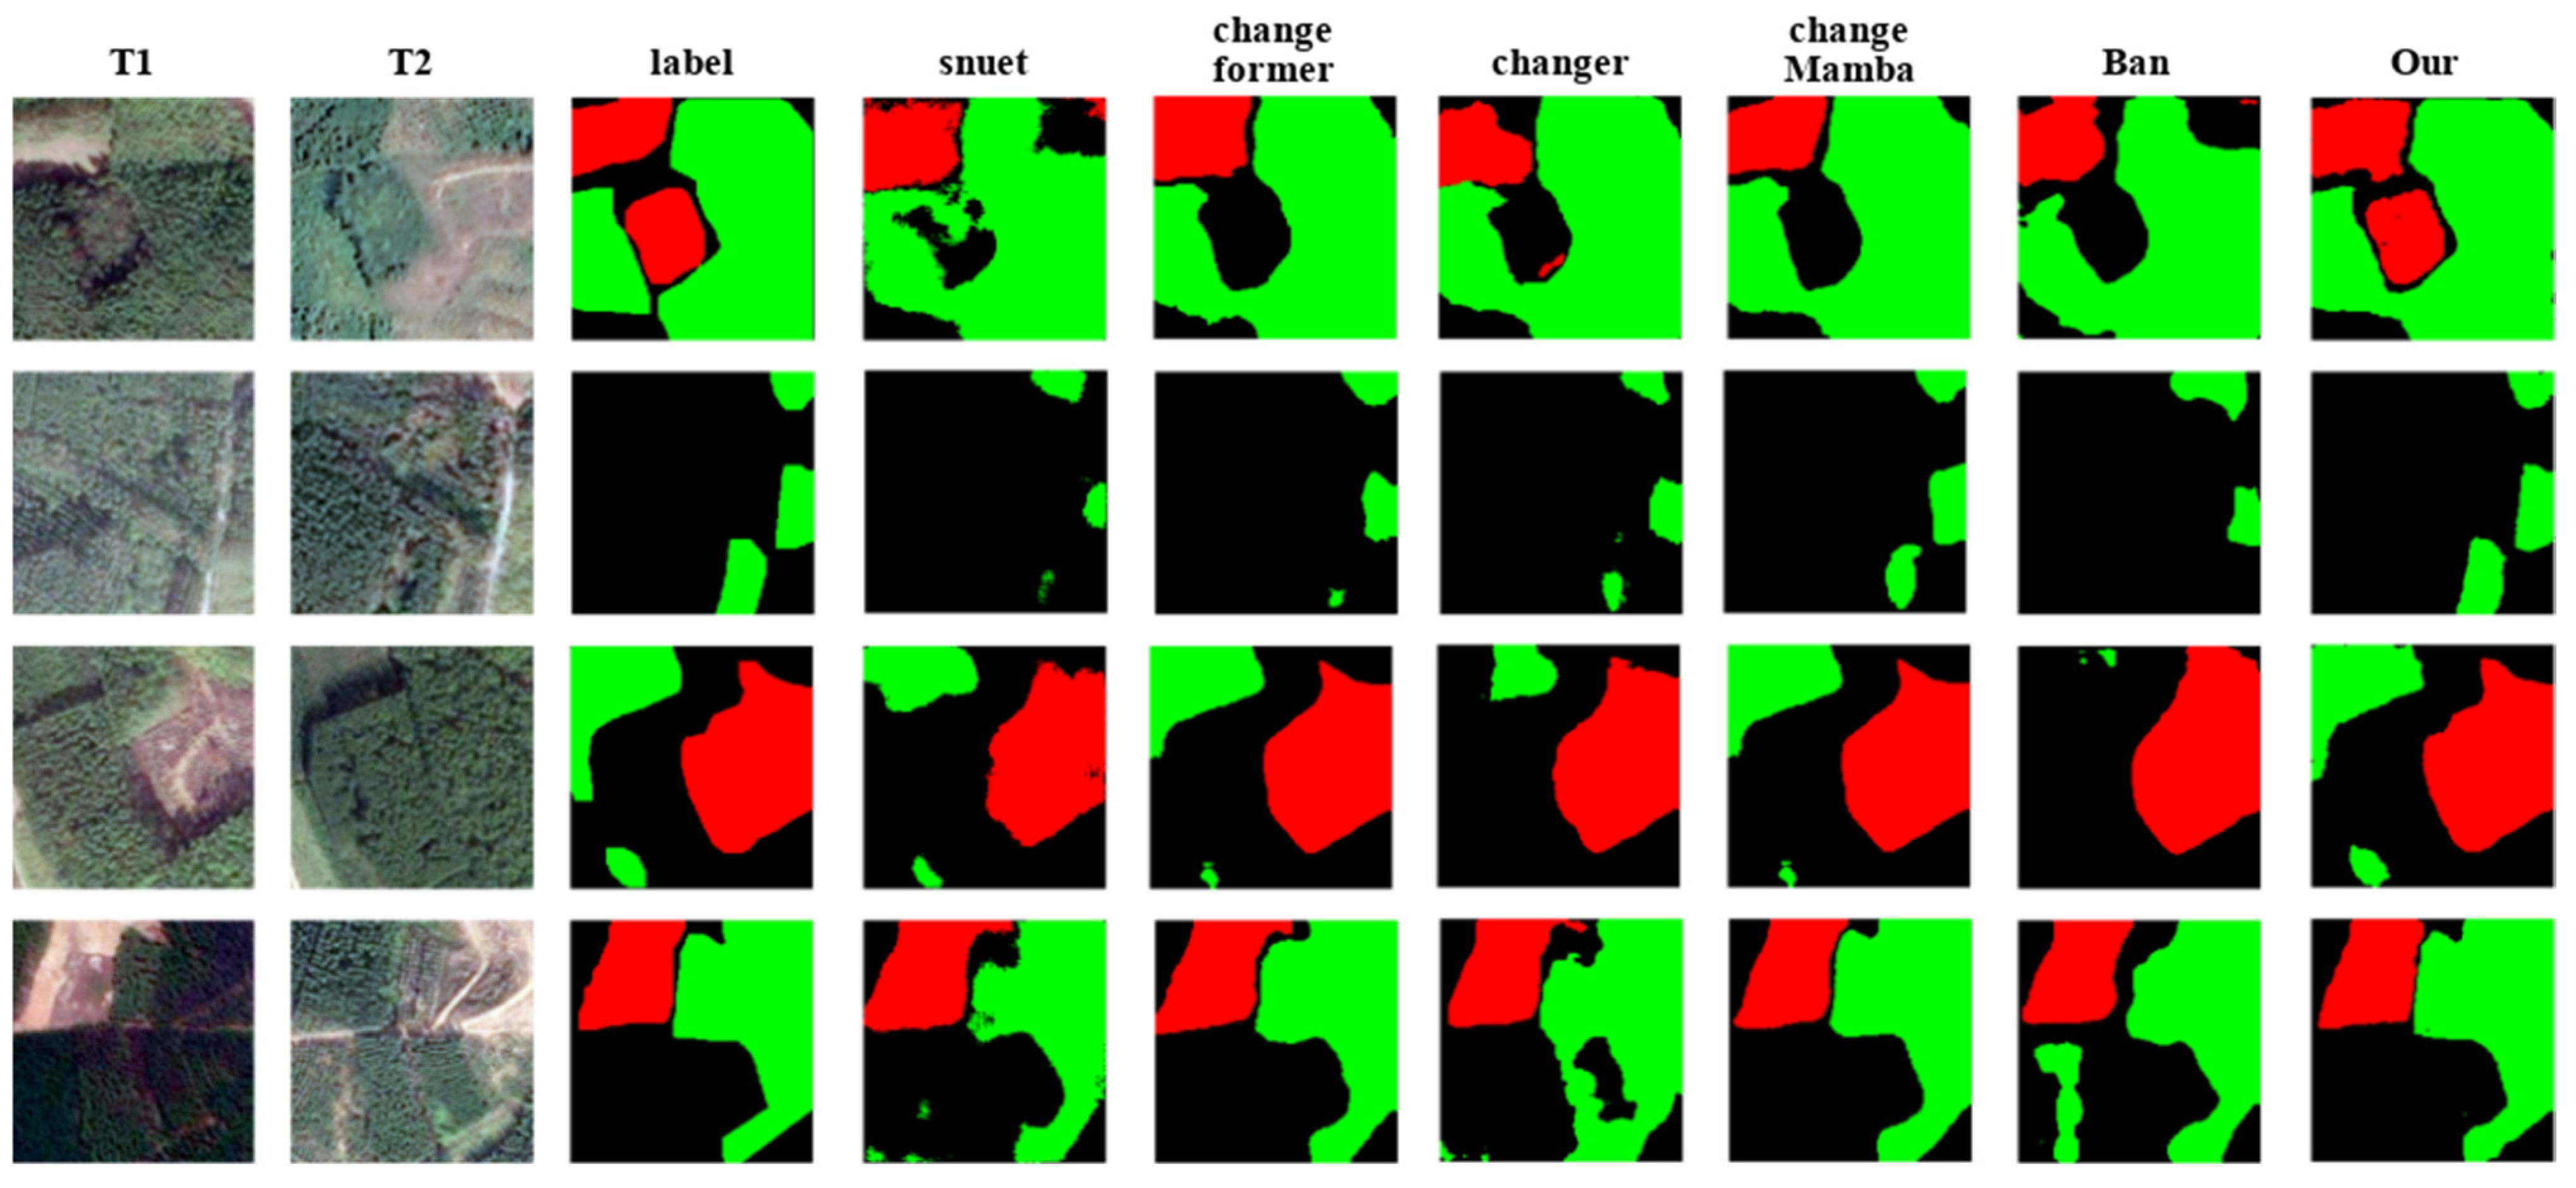
Qualitative results based on ECDD are shown in Figure 6 to further examine the spatial behavior of each model.
In Figure 7, most methods identify regions with obvious spectral and textural contrast, but their boundary quality differs. MLLAForestCD produces more complete interiors and more continuous contours in the illustrated cases. A plausible architectural explanation is that multi-scale fusion combines deep semantic context with shallow spatial detail, while the long-range context and a dual-axis bi-temporal comparison help suppress local texture and illumination differences that would otherwise produce false alarms. This interpretation remains qualitative and should be verified by future diagnostic experiments.

3.3. Independent Dataset-Specific Evaluation Based on WHU-CD

To examine the architecture in a contrasting building-change task, MLLAForestCD, SNUNet, ChangeFormer, Changer, BAN, and ChangeMamba are independently trained, validated, and tested based on WHU-CD. Table 6 summarizes the results. No ECDD-trained weights are evaluated based on WHU-CD, so the experiment evaluates only performance after independent training on that dataset.
Based on WHU-CD, all methods detect building changes to some extent, but the quantitative scores vary. BAN obtains an F1-score of 85.30% and an IoU of 74.36%, while ChangeFormer reaches 86.21% and 75.76%. SNUNet and Changer perform better, with F1-scores of 89.34% and 90.64% and IoU values of 80.73% and 82.88%. ChangeMamba achieves an F1-score of 91.27% and an IoU of 83.95%, making it the strongest baseline in this comparison.
After independent training on WHU-CD, MLLAForestCD achieves an F1-score of 97.29%, Precision of 97.97%, Recall of 96.63%, and IoU of 90.10%. Compared with ChangeMamba under the reported WHU-CD protocol, the differences are 6.02 percentage points in the F1-score and 6.15 percentage points in IoU. These results indicate strong dataset-specific performance under the independent WHU-CD training and evaluation protocol.
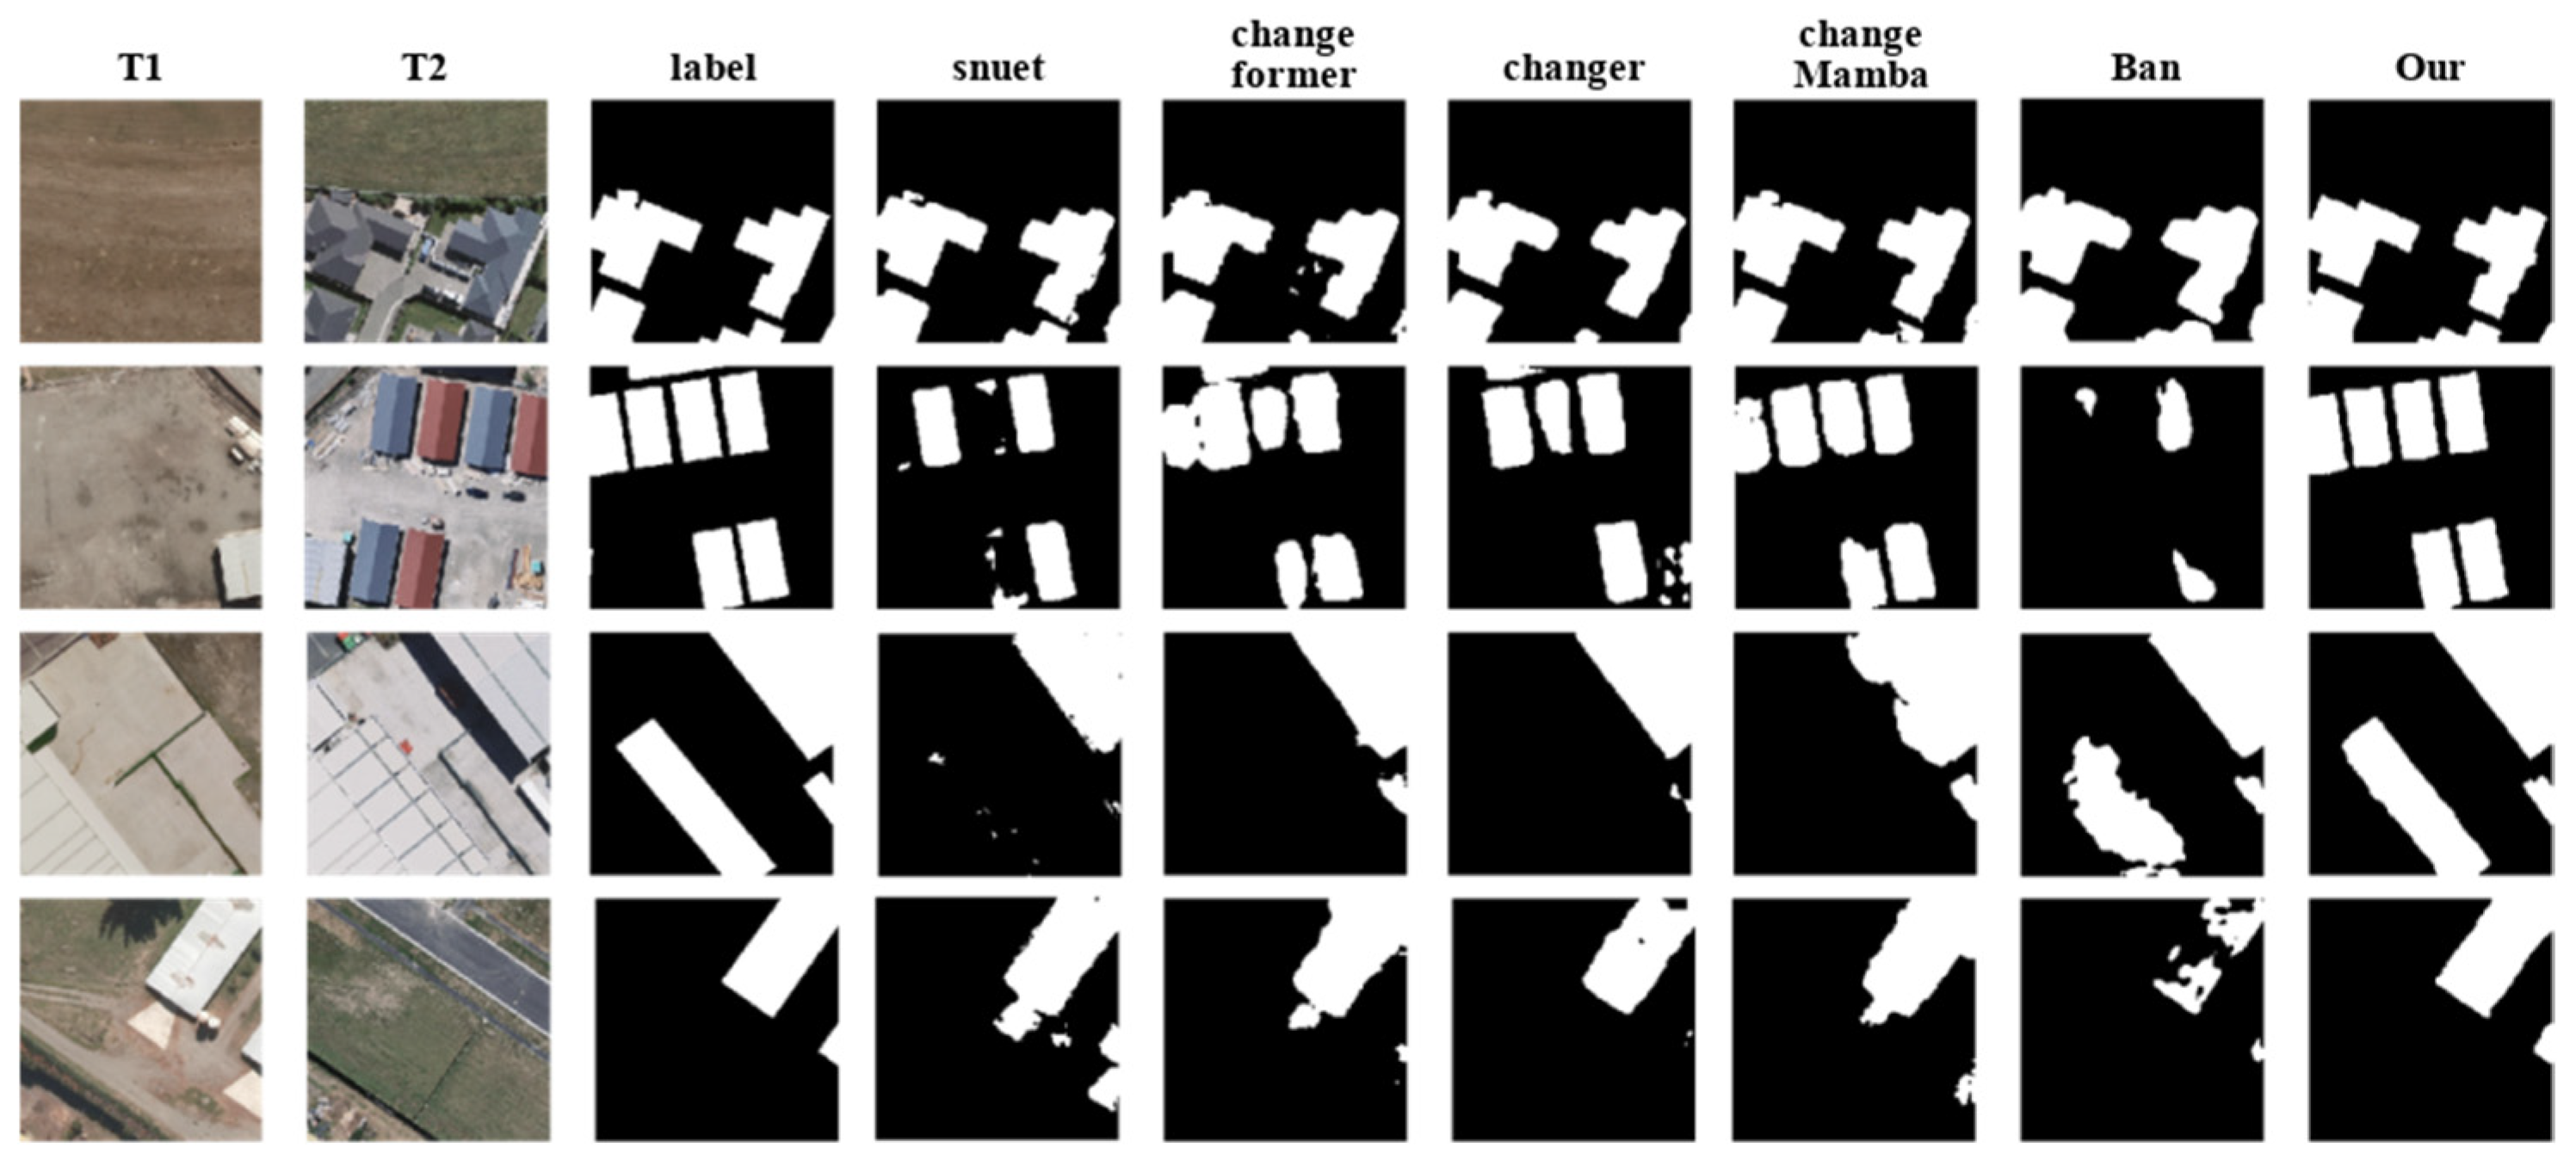
The WHU-CD experiment shows that the architecture can be optimized effectively for a second change-detection dataset with a different geometry and appearance. Qualitative examples from this separately trained setting are presented in Figure 7. Any claim beyond this independently trained setting would require additional experiments without retraining and under controlled dataset shifts.
Figure 8 shows that all methods locate large and obvious building changes, but several baselines produce fragmented masks in dense built-up areas or false alarms when temporal differences are subtle. MLLAForestCD yields more complete regions and cleaner contours in the examples. This behavior is consistent with the combination of the long-range context, the local detail, and an explicit bi-temporal comparison, although the figure alone does not establish causality.

3.4. Recent Stand-Renewal Event Mapping from Time-Series Change Detection

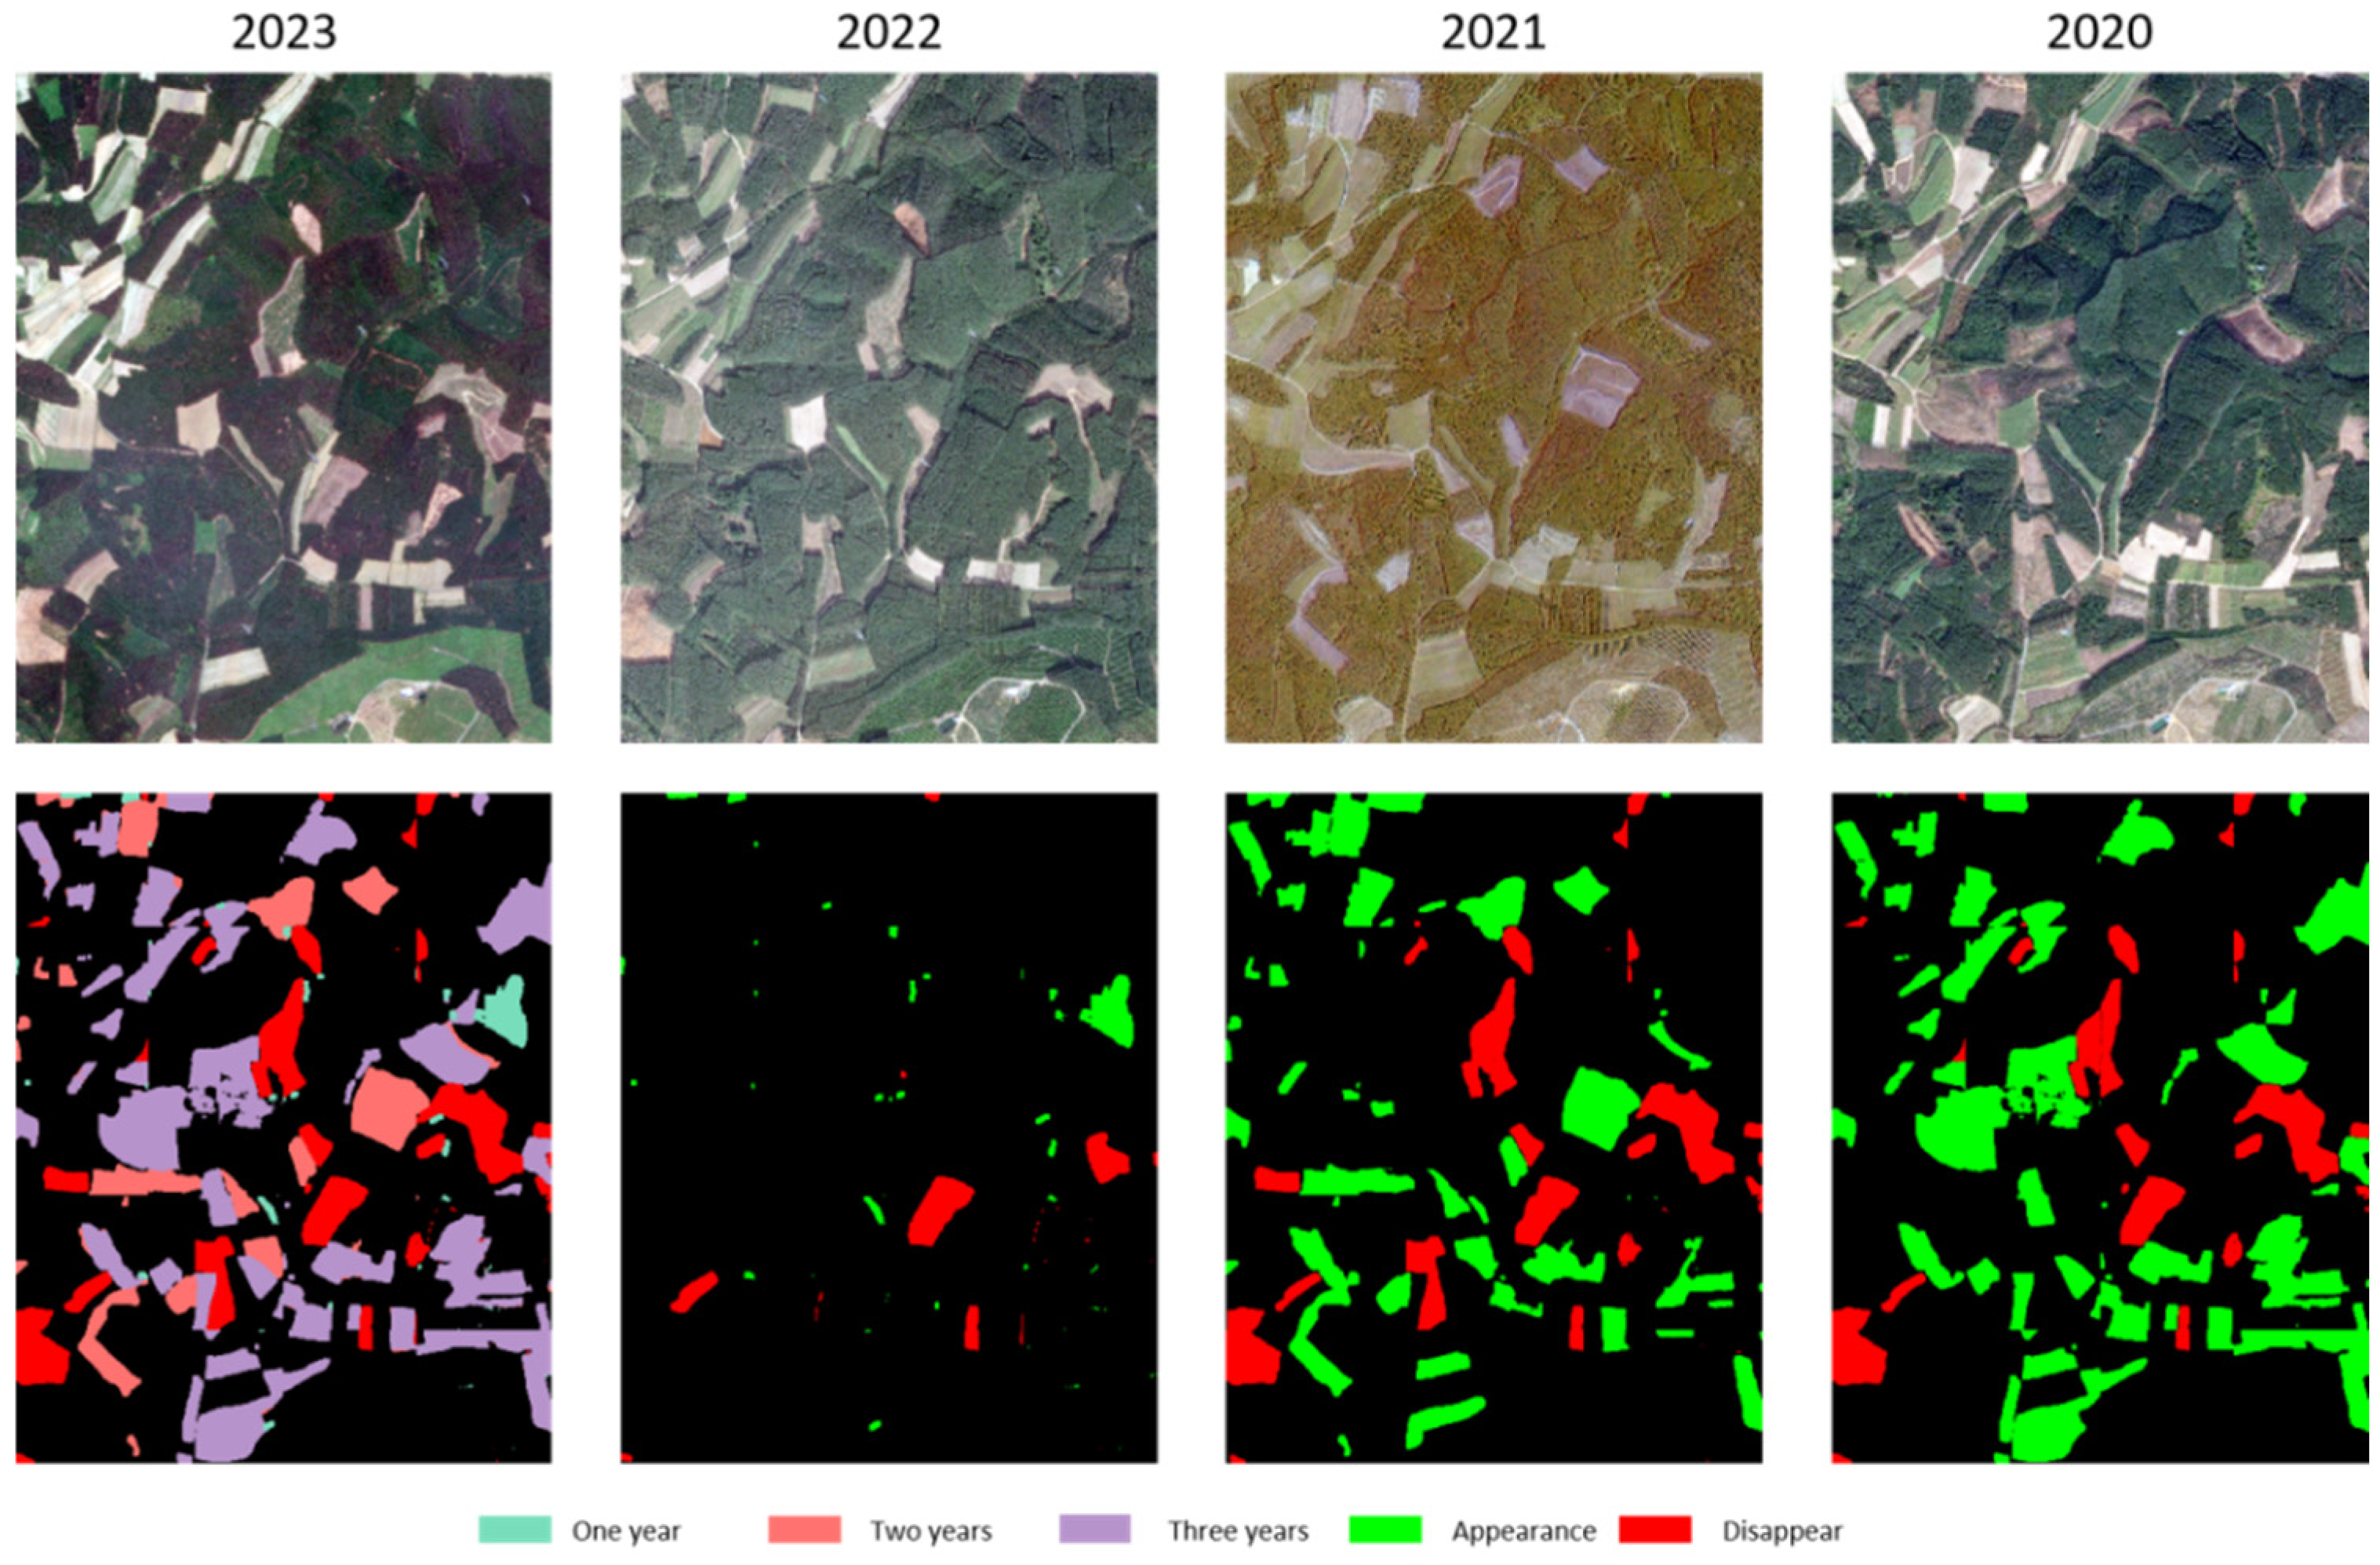
The annual change-detection outputs were further used to generate a recent stand-renewal event map. Each mapped class records the number of years since the most recent plantation appearance detected within the 2020–2023 observation window. The output is not a complete or independently validated biological stand-age estimate.
We use a time-series retrospective framework based on MLLAForestCD to summarize recent detected plantation-appearance events. The model predicts annual semantic changes from sequential images, and the most recent appearance event is used to assign an observation-window renewal class. The workflow is shown in Figure 9.
The workflow starts with the 2023 image as the reference. Newly appearing stands detected between 2022 and 2023 are assigned to the most recent (1-year-since-detection) class; unassigned appearances detected between 2021 and 2022 and between 2020 and 2021 are assigned to the 2-year-since-detection and 3-year-since-detection classes, respectively. Stands already present in 2020 and unchanged through 2023 are retained as pre-2020/renewal time unknown rather than being assigned a biological age.
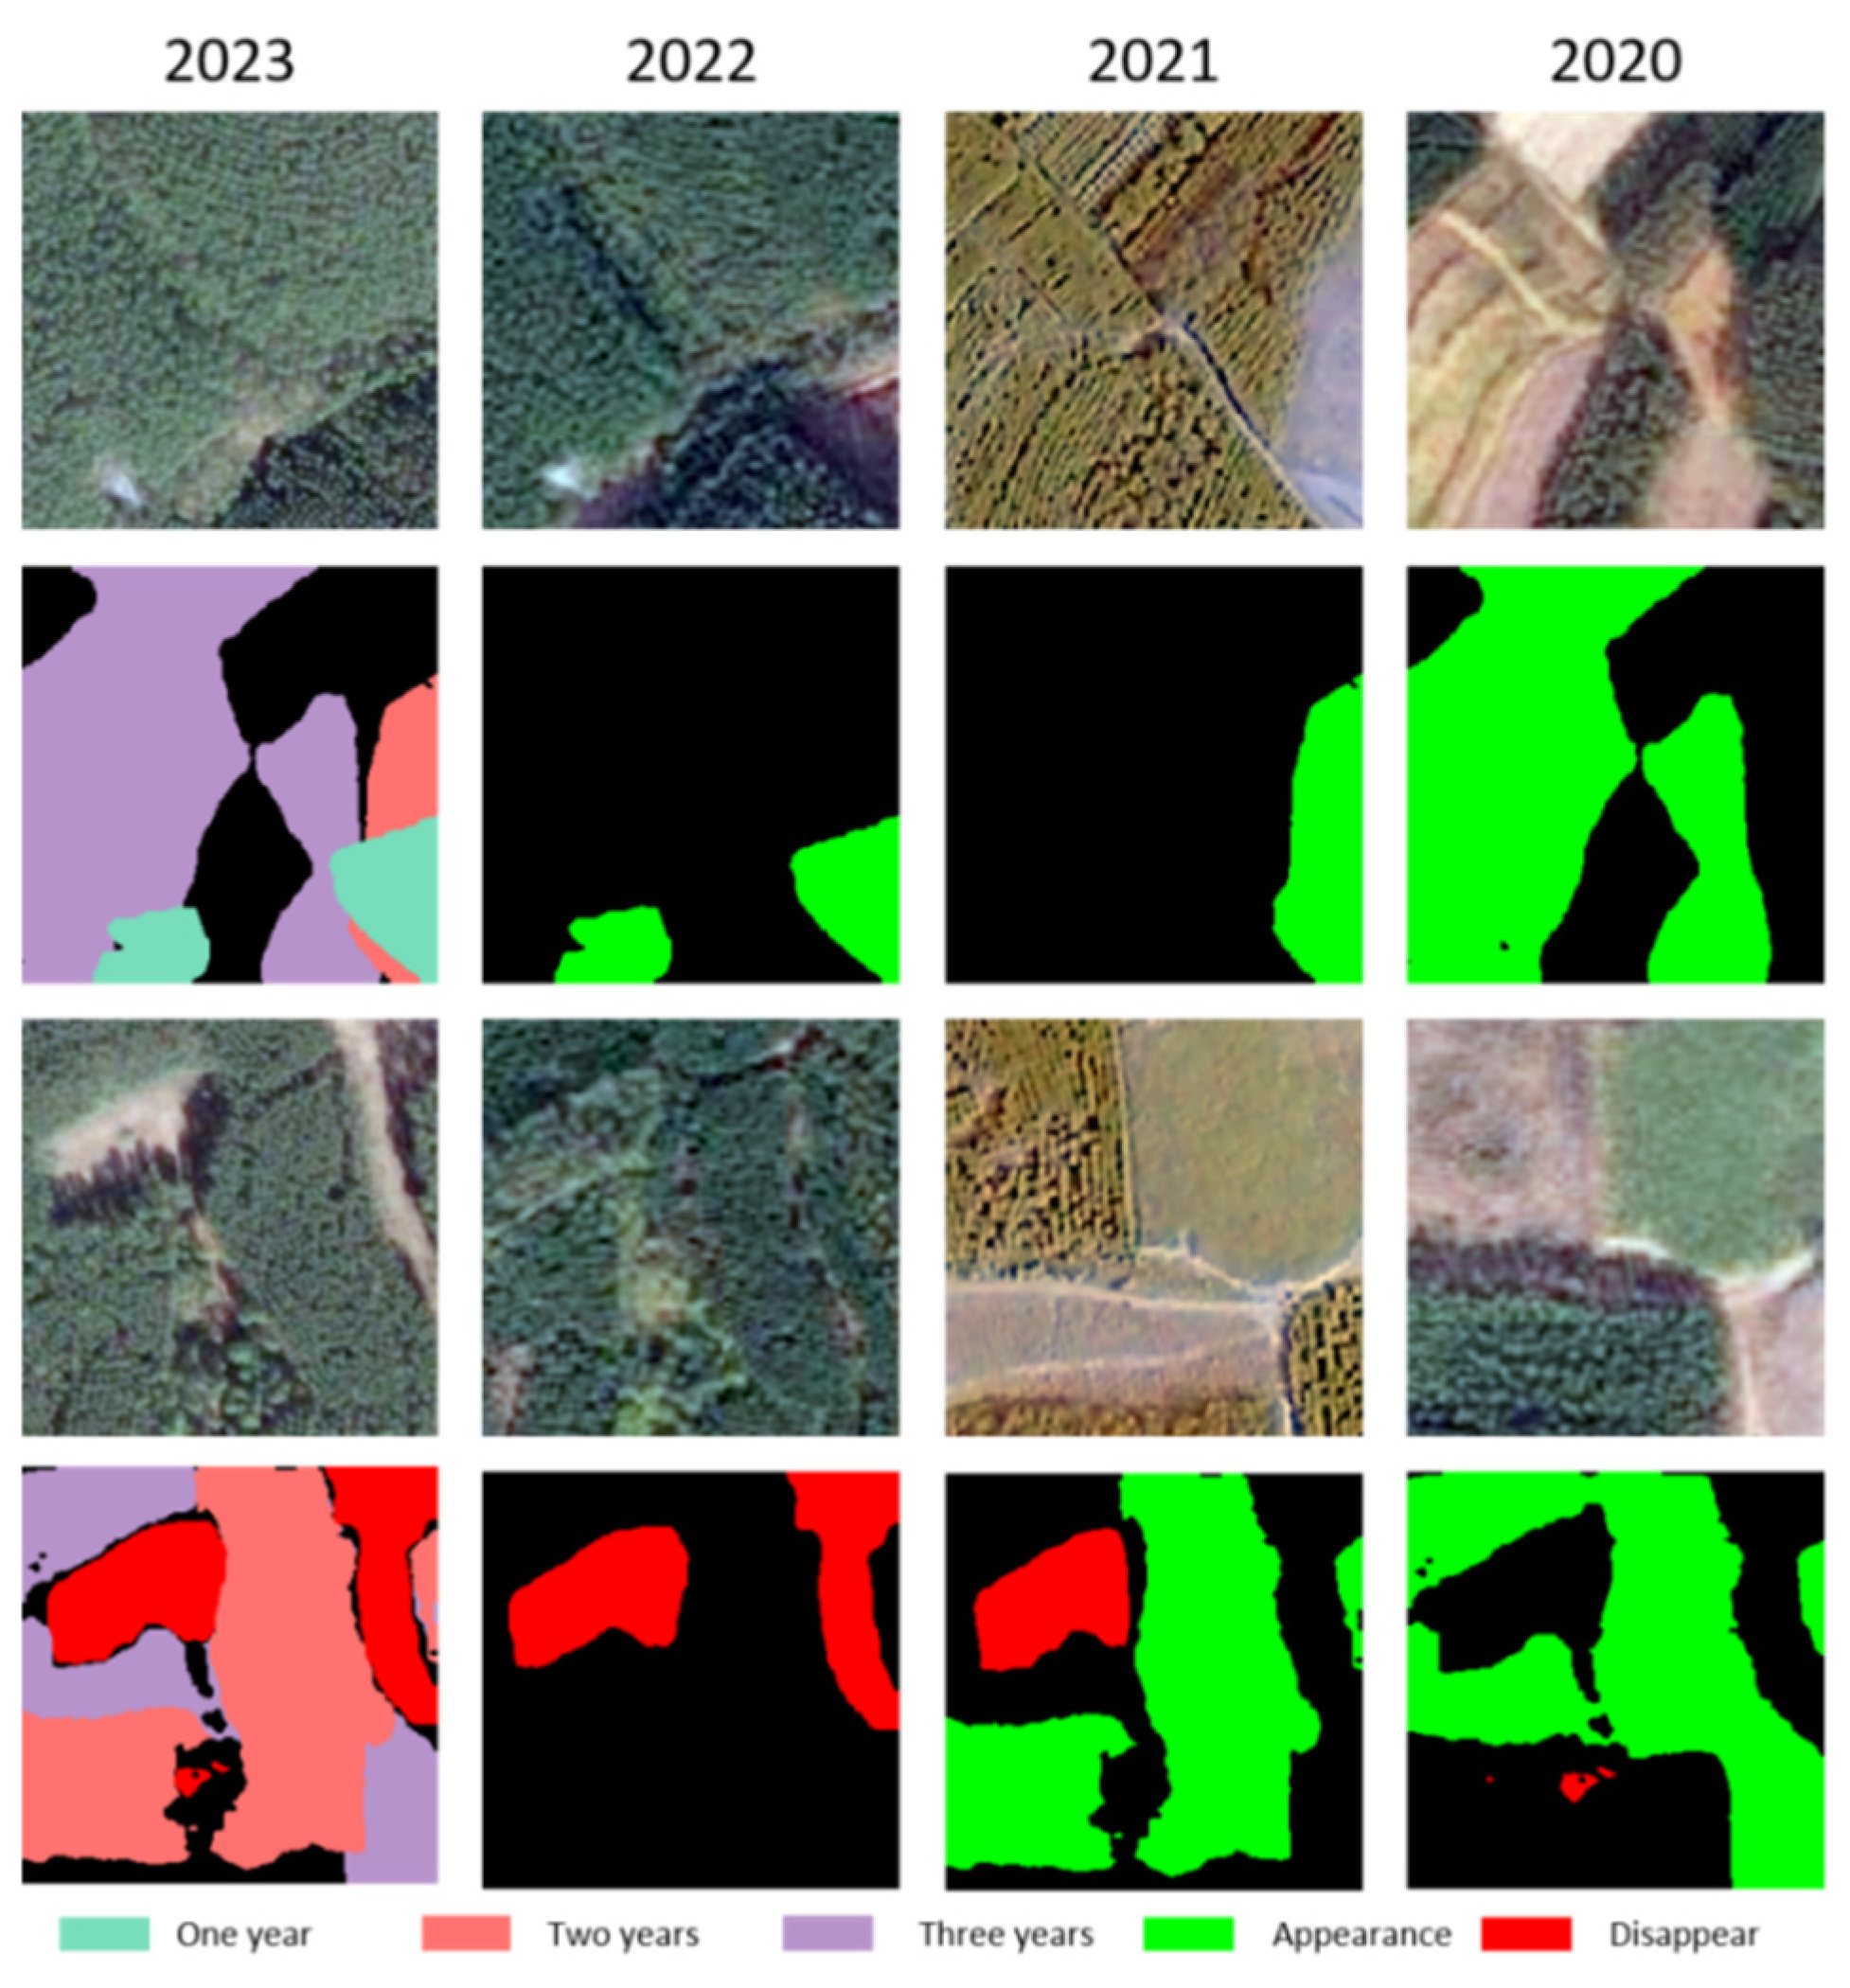
Using the four image dates from 2020 to 2023, we generated an observation-window stand-renewal event map. In Figure 10, the left panel contains the 1-, 2-, and 3-year-since-detection classes. Appearance and disappearance refer to the three annual change maps on the right: appearance determines the most recently detected establishment event, whereas disappearance is retained for an interannual comparison and is not converted into an age class.

4. Discussion

4.1. Mechanisms Underlying Improved Fine-Grained Change Detection

This study treats Eucalyptus plantation monitoring as a fine-grained semantic change-detection problem rather than a coarse forest/non-forest conversion task. Managed plantations can retain vegetation-like spectra after harvesting, thinning, replanting, early regrowth, and seasonal canopy change. Consequently, the more informative cues often lie in the planting-row texture, crown density, shadow patterns, compartment continuity, and boundary geometry rather than in greenness alone.
The matched ablations support three observations under the retained patch-level protocol. First, replacing MLLA with ResNet-34 reduces mIoU by 1.56 percentage points. Second, DACE exceeds ordinary and parameter-matched channel concatenation by 1.59 and 1.55 points, respectively. Third, removing four-level fusion reduces mIoU by 14.31 points. However, the horizontal-only result is slightly higher than the complete dual-axis result, so the experiments support effective spatial rearrangement but not a significant complementary gain from combining both orientations.
These mechanisms are consistent with remote-sensing change-detection studies showing that attention, feature interaction, and multi-scale representation improve the modeling of heterogeneous bi-temporal information [19,25,31]. However, plantation monitoring has a different emphasis. In urban change detection, attention mechanisms often help distinguish buildings from roads, shadows, and other artificial objects. In Eucalyptus plantations, the key difficulty is the similarity among different plantation states. Thus, the proposed model emphasizes weak within-class changes, the directional canopy texture, and fine boundary differences.
The results also show that the choice of temporal comparison is consequential. Absolute differencing performs substantially worse in the present three-class task, plausibly because it removes the signed temporal information needed to distinguish disappearance from appearance; its lower comparator capacity is an additional confound. More importantly, DACE remains 1.55 mIoU points above the parameter-matched channel-concatenation control. This controlled comparison supports the feature-organization and aligned-fusion strategy without claiming that local convolution directly connects spatially distant corresponding pixels.

4.2. Comparison with Existing Remote Sensing Change-Detection Studies

Compared with general remote-sensing change-detection studies, this work focuses on a specific forestry scenario. Many classical and deep-learning methods aim to identify clear land-cover transitions or discrete target changes [1,12,21]. Eucalyptus plantation monitoring is more difficult because changed and unchanged pixels may have similar vegetation spectra. The present task is strictly limited to three-class pixel-level semantic change detection and does not classify instances or management causes.
Transformer- and state-space-based methods have improved the ability to model long-range spatial relationships in high-resolution images [16,19]. Nevertheless, plantation scenes also require detailed boundary preservation. MLLAForestCD follows this direction by combining efficient contextual modeling, dual-axis feature comparison, and multi-scale fusion. The comparison with baseline methods indicates that this design improves both the overall accuracy and boundary consistency, suggesting that plantation change detection benefits from integrating the global context with local structural information.
This study is also related to time-series forest monitoring. Annual remote-sensing observations have been widely used to detect forest disturbance and recovery trends [23,24]. Here, high-resolution bi-temporal semantic change maps are combined to summarize the most recently detected stand-renewal events within a four-year window. This produces fine spatial event boundaries but should be regarded as an unvalidated observation-window summary that requires independent field evidence before biological or operational interpretation.
The separately trained WHU-CD experiment indicates that the architecture can also be optimized for a building-focused dataset. Because WHU-CD differs from plantation landscapes in the geometry and change mechanism, the result supports only performance after separate retraining on WHU-CD. Broader applicability across independent regions, seasons, and data sources remains untested and requires dedicated evaluation.

4.3. Practical Implications for Eucalyptus Plantation Monitoring and Smart Forestry

The annual outputs may be considered only as unvalidated candidate layers for prioritizing field verification because they delineate pixel-level disappearance and appearance events. They have not been validated against independent field or forestry records and should not be treated as operational forestry products or carbon-accounting inputs.
This application summarizes the spatial patterns of recent detected appearance events by grouping them into time-since-detection classes. The classes may be compared with independent forestry records in future validation; in the present study, they remain unvalidated event summaries rather than forest-age classes or operational decision products.
First, the method works at a fine pixel scale suited to delineating the boundaries of pixel-level disappearance and appearance regions. Second, annual appearance predictions can be summarized as recent renewal-event classesfor subsequent comparison with independent forestry records. Such records and dedicated validation remain necessary before the predictions can be interpreted biologically or used in operational decisions.
When annual or seasonal imagery is available, the model can update pixel-level semantic change layers and flag candidate areas for field verification. After independent validation, these layers may support the subsequent investigation of possible change causes. The present network output alone does not identify individual management entities, determine change causes, or support inventory and scheduling decisions.

4.4. Limitations and Future Work

Several limitations should be considered. First, ECDD was constructed mainly from Eucalyptus plantation scenes in a specific regional context. The plantation spacing, rotation length, terrain condition, understory vegetation, soil background, and management practices may differ across regions. The current model may therefore require calibration, model adjustment, or retraining before being applied to other plantation species, mixed forests, or natural forests. Future work should expand the dataset to include more regions, seasons, plantation ages, and management regimes.
Validation samples were selected at the patch level by choosing two samples from each consecutive group of ten identifiers; they were not held out based on the complete scene or geographic area. Consequently, the reported accuracy is interpreted as patch-level validation performance and not as evidence from a leakage-controlled Area1, 2, 4, 5 spatial split. Future releases should use complete-scene or area-level holdouts and publish immutable manifests.
Second, the experiments rely primarily on high-resolution optical imagery. Optical images are affected by clouds, shadows, illumination differences, phenology, atmospheric conditions, and registration errors. These factors may generate pseudo changes unrelated to harvesting or replanting or cause missed detections when young stands and surrounding vegetation have similar spectral responses. Future studies should investigate the integration of SAR, LiDAR, and UAV imagery or other multi-source data to improve robustness under complex observation conditions.
Third, the time-series mapping experiment is limited by the temporal length and annual frequency of the available image sequence. The four-year sequence can identify the most recently detected plantation-appearance event at an annual scale, but it cannot determine the biological stand age, older establishment history, within-year events, or gradual development between observations. The output should therefore be interpreted as a recent stand-renewal event product. Independent validation using field plots, management records, UAV surveys, or forestry inventory data is required before age-related or operational interpretation.
Fourth, ECDD is a three-class pixel-level semantic change-detection task (unchanged, disappearance, and appearance), but it does not classify change causes. The model does not distinguish harvesting, replanting, disease, storm damage, fire, road construction, or natural regrowth, nor does it perform object-instance recognition. Future work may investigate cause attribution and region-level aggregation with dedicated labels and independent validation.
Finally, broader validation and reproducibility testing remain necessary. The retained experiments represent single training records, so the manuscript does not claim statistical significance over ChangeMamba; future work should repeat all methods across multiple random seeds and report means, standard deviations, and appropriate significance tests. The inference latency, peak memory, and complete hardware-normalized baseline complexity logs should also be measured. A practical coarse-to-fine pathway is to use long-term Landsat and Sentinel-2 archives to reconstruct the pre-2020 change history and then use high-resolution MLLAForestCD outputs to delineate candidate pixel-level disappearance and appearance regions. The attribution of these regions to specific forestry events would require dedicated labels and independent field or administrative evidence. Future datasets should cover more regions and species and integrate SAR, LiDAR, UAV, field, and independent forestry observations.

5. Conclusions

This study developed MLLAForestCD for three-class pixel-level semantic change detection in Eucalyptus plantations. Its contribution is a task-specific integration of efficient linear-attention context modeling, complementary bi-temporal feature organization, and multi-scale boundary preservation for weak spectral contrast and an irregular plantation geometry.
Under the retained patch-level split, the integrated architecture represents subtle plantation changes effectively and also achieves strong performance after separate training based on WHU-CD. Annual pixel-level outputs further illustrate how the most recently detected plantation-appearance events can be summarized within the 2020–2023 observation window. This event product is intended for subsequent verification and is not a validated biological stand-age or management-decision product.
Future research should broaden regional and species coverage, establish complete-scene or area-level holdouts, publish full sensor/date and patch-generation records, quantify registration error, validate event products against field and inventory records, evaluate region-level outputs, compare efficiency under unified hardware, and repeat the matched ablations across multiple random seeds with appropriate statistical testing.

Author Contributions

G.L.: Conceptualization, methodology, writing—original draft preparation, writing—review and editing. L.Y.: formal analysis, writing—original draft preparation. J.D.: formal analysis, supervision. X.T.: validation. J.C.: formal analysis, validation. H.W.: validation. H.Y.: Conceptualization, methodology, writing—original draft preparation, writing—review and editing. All authors have read and agreed to the published version of the manuscript.

Funding

This research was supported by the National Natural Science Foundation of China (42261063), Guangxi Natural Science Foundation under Grant No. 2025GXNSFAA069561, BaGui Young Outstanding Talents Cultivation Program of the provincial government of Guangxi, and Scientific Research Foundation of Guilin University of Technology (GLUTQD2017094).

Data Availability Statement

The Eucalyptus Change Detection Dataset (ECDD), trained model weights, and source code are available from the corresponding author upon reasonable request. Public release of the complete raw satellite imagery is subject to data licensing and institutional restrictions; representative samples and derived annotations can be provided for academic verification. The implementation is based on the Open-CD/MMSegmentation framework, and the final training configurations, model definitions, and inference scripts are available from the corresponding author upon reasonable request.

Acknowledgments

The authors thank the institutions and collaborators who supported data preparation and manuscript revision.

Conflicts of Interest

The authors declare no conflicts of interest.

References

  1. Singh, A. Review Article Digital change detection techniques using remotely-sensed data. Int. J. Remote Sens. 1989, 10, 989–1003. [Google Scholar] [CrossRef] [Scilit]
  2. Huang, X.; Zhang, L.; Zhu, T. Building Change Detection from Multitemporal High-Resolution Remotely Sensed Images Based on a Morphological Building Index. IEEE J. Sel. Top. Appl. Earth Obs. Remote Sens. 2014, 7, 105–115. [Google Scholar] [CrossRef] [Scilit]
  3. Naceur, Y.; Bouzidi, S.; Zaouali, M. U-Net for Remote Sensing: A Spectral Index-Based Approach with Explainable AI for Robust Change Detection. IEEE Trans. Geosci. Remote Sens. 2025, 63, 4420607. [Google Scholar] [CrossRef] [Scilit]
  4. Zhang, H.; Zhang, Y.; Wang, D.; Ma, G. Damaged Building Object Detection from Bitemporal Remote Sensing Imagery: A Cross-Task Integration Network and Five Datasets. IEEE Trans. Geosci. Remote Sens. 2024, 62, 5648827. [Google Scholar] [CrossRef] [Scilit]
  5. Ouyang, S.; Du, S.; Zhang, X.; Wang, H. Object-Based Urban Land-Use Change Detection with Siamese Network and Hierarchical Clustering. IEEE Trans. Geosci. Remote Sens. 2025, 63, 4702715. [Google Scholar] [CrossRef] [Scilit]
  6. Wang, S.; Yuan, G.; Li, J. GSSR-Net: Geo-Spatial Structural Refinement Network for Remote Sensing Change Detection. IEEE Trans. Geosci. Remote Sens. 2025, 63, 5909715. [Google Scholar] [CrossRef] [Scilit]
  7. Zhou, Y. Research on Forest Resource Change Detection Based on Decision Tree Algorithm. In Proceedings of the 2022 International Conference on Artificial Intelligence and Autonomous Robot Systems (AIARS), Bristol, UK, 29–31 July 2022; pp. 363–367. [Google Scholar]
  8. Jenny, H.; Liem, J.; Lucash, M.S.; Scheller, R.M. 4-D Statistical Surface Method for Visual Change Detection in Forest Ecosystem Simulation Time Series. IEEE J. Sel. Top. Appl. Earth Obs. Remote Sens. 2014, 7, 4505–4511. [Google Scholar] [CrossRef] [Scilit]
  9. Bhatt, A.; Ghosh, S.K.; Kumar, A. Automated change detection in satellite images using machine learning algorithms for Delhi, India. In Proceedings of the 2015 IEEE International Geoscience and Remote Sensing Symposium (IGARSS), Milan, Italy, 26–31 July 2015; pp. 1678–1681. [Google Scholar]
  10. Yamanishi, K.; Miyaguchi, K. Detecting gradual changes from data stream using MDL-change statistics. In Proceedings of the 2016 IEEE International Conference on Big Data (Big Data), Washington, DC, USA, 5–8 December 2016; pp. 156–163. [Google Scholar]
  11. Zou, C.; Wang, Z. A semi-parallel CNN-transformer fusion network for semantic change detection. Image Vis. Comput. 2024, 149, 105157. [Google Scholar] [CrossRef] [Scilit]
  12. Daudt, R.C.; Saux, B.L.; Boulch, A. Fully Convolutional Siamese Networks for Change Detection. In Proceedings of the 2018 25th IEEE International Conference on Image Processing (ICIP), Athens, Greece, 7–10 October 2018; pp. 4063–4067. [Google Scholar]
  13. Zhang, H.; Yang, S.; Ning, X.; He, Y.; Huang, X.; Zhang, R.; Hao, M. Hyper-neighborhood context-aware transformer network for high-resolution remote sensing change detection. Int. J. Appl. Earth Obs. Geoinf. 2025, 144, 104861. [Google Scholar] [CrossRef] [Scilit]
  14. Dosovitskiy, A. An image is worth 16x16 words: Transformers for image recognition at scale. In Proceedings of the Computer Vision and Pattern Recognition 2020, Seattle, WA, USA, 13–19 June 2020. [Google Scholar]
  15. Vaswani, A.; Shazeer, N.; Parmar, N.; Uszkoreit, J.; Jones, L.; Gomez, A.N.; Kaiser, Ł.; Polosukhin, I. Attention is all you need. In Proceedings of the Advances in Neural Information Processing Systems, Long Beach, CA, USA, 4–9 December 2017; Volume 30. [Google Scholar]
  16. Bandara, W.G.C.; Patel, V.M. A Transformer-Based Siamese Network for Change Detection. In Proceedings of the Computer Vision and Pattern Recognition, New Orleans, LA, USA, 18–24 June 2022. [Google Scholar]
  17. Liu, Y.; Tian, Y.; Zhao, Y.; Yu, H.; Xie, L.; Wang, Y.; Ye, Q.; Jiao, J.; Liu, Y. VMamba: Visual State Space Model. In Proceedings of the Computer Vision and Pattern Recognition, Seattle, WA, USA, 16–22 June 2024. [Google Scholar]
  18. Gu, A.; Dao, T. Mamba: Linear-Time Sequence Modeling with Selective State Spaces. arXiv 2023, arXiv:2312.00752v2. [Google Scholar]
  19. Chen, H.; Song, J.; Han, C.; Xia, J.; Yokoya, N. ChangeMamba: Remote Sensing Change Detection with Spatiotemporal State Space Model. IEEE Trans. Geosci. Remote Sens. 2024, 62, 4409720. [Google Scholar] [CrossRef] [Scilit]
  20. Chen, K.; Chen, B.; Liu, C.; Li, W.; Zou, Z.; Shi, Z. RSMamba: Remote Sensing Image Classification with State Space Model. IEEE Geosci. Remote Sens. Lett. 2024, 21, 8002605. [Google Scholar] [CrossRef] [Scilit]
  21. Lv, Z.; Huang, H.; Li, X.; Zhao, M.; Benediktsson, J.A.; Sun, W.; Falco, N. Land Cover Change Detection with Heterogeneous Remote Sensing Images: Review, Progress, and Perspective. Proc. IEEE 2022, 110, 1976–1991. [Google Scholar] [CrossRef] [Scilit]
  22. Basavaraju, K.S.; Sravya, N.; Kevala, V.D.; Lal, S. Recent Advances in Urban Expansion Monitoring Through Deep Learning-Based Semantic Change Detection Techniques from Satellite Imagery. In Proceedings of the 2024 IEEE Space, Aerospace and Defence Conference (SPACE), Bangalore, India, 22–23 July 2024; pp. 169–173. [Google Scholar]
  23. Vogelmann, J.E.; Gallant, A.L.; Shi, H.; Zhu, Z. Perspectives on monitoring gradual change across the continuity of Landsat sensors using time-series data. Remote Sens. Environ. 2016, 185, 258–270. [Google Scholar] [CrossRef] [Scilit]
  24. Kennedy, R.E.; Yang, Z.; Cohen, W.B. Detecting trends in forest disturbance and recovery using yearly Landsat time series: 1. LandTrendr—Temporal segmentation algorithms. Remote Sens. Environ. 2010, 114, 2897–2910. [Google Scholar] [CrossRef] [Scilit]
  25. Tang, Y.; Feng, S.; Zhao, C.; Fan, Y.; Shi, Q.; Li, W.; Tao, R. An Object Fine-Grained Change Detection Method Based on Frequency Decoupling Interaction for High-Resolution Remote Sensing Images. IEEE Trans. Geosci. Remote Sens. 2024, 62, 5600213. [Google Scholar] [CrossRef] [Scilit]
  26. Han, D.; Wang, Z.; Xia, Z.; Han, Y.; Pu, Y.; Ge, C.; Song, J.; Song, S.; Zheng, B.; Huang, G. Demystify mamba in vision: A linear attention perspective. Adv. Neural Inf. Process. Syst. 2024, 37, 127181–127203. [Google Scholar] [CrossRef] [Scilit]
  27. Su, J.; Ahmed, M.; Lu, Y.; Pan, S.; Bo, W.; Liu, Y. RoFormer: Enhanced transformer with Rotary Position Embedding. Neurocomputing 2024, 568, 127063. [Google Scholar] [CrossRef] [Scilit]
  28. Dong, X.; Bao, J.; Chen, D.; Zhang, W.; Yu, N.; Yuan, L.; Chen, D.; Guo, B. Cswin transformer: A general vision transformer backbone with cross-shaped windows. In Proceedings of the IEEE/CVF Conference on Computer Vision and Pattern Recognition, New Orleans, LA, USA, 18–24 June 2022; pp. 12124–12134. [Google Scholar]
  29. Ji, S.; Wei, S.; Lu, M. Fully Convolutional Networks for Multisource Building Extraction from an Open Aerial and Satellite Imagery Data Set. IEEE Trans. Geosci. Remote Sens. 2019, 57, 574–586. [Google Scholar] [CrossRef] [Scilit]
  30. Fang, S.; Li, K.; Shao, J.; Li, Z. SNUNet-CD: A densely connected Siamese network for change detection of VHR images. IEEE Geosci. Remote Sens. Lett. 2021, 19, 8007805. [Google Scholar] [CrossRef] [Scilit]
  31. Fang, S.; Li, K.; Li, Z. Changer: Feature Interaction is What You Need for Change Detection. IEEE Trans. Geosci. Remote Sens. 2023, 61, 5610111. [Google Scholar] [CrossRef] [Scilit]
  32. Li, K.; Cao, X.; Meng, D. A New Learning Paradigm for Foundation Model-Based Remote-Sensing Change Detection. IEEE Trans. Geosci. Remote Sens. 2024, 62, 5610112. [Google Scholar] [CrossRef] [Scilit]
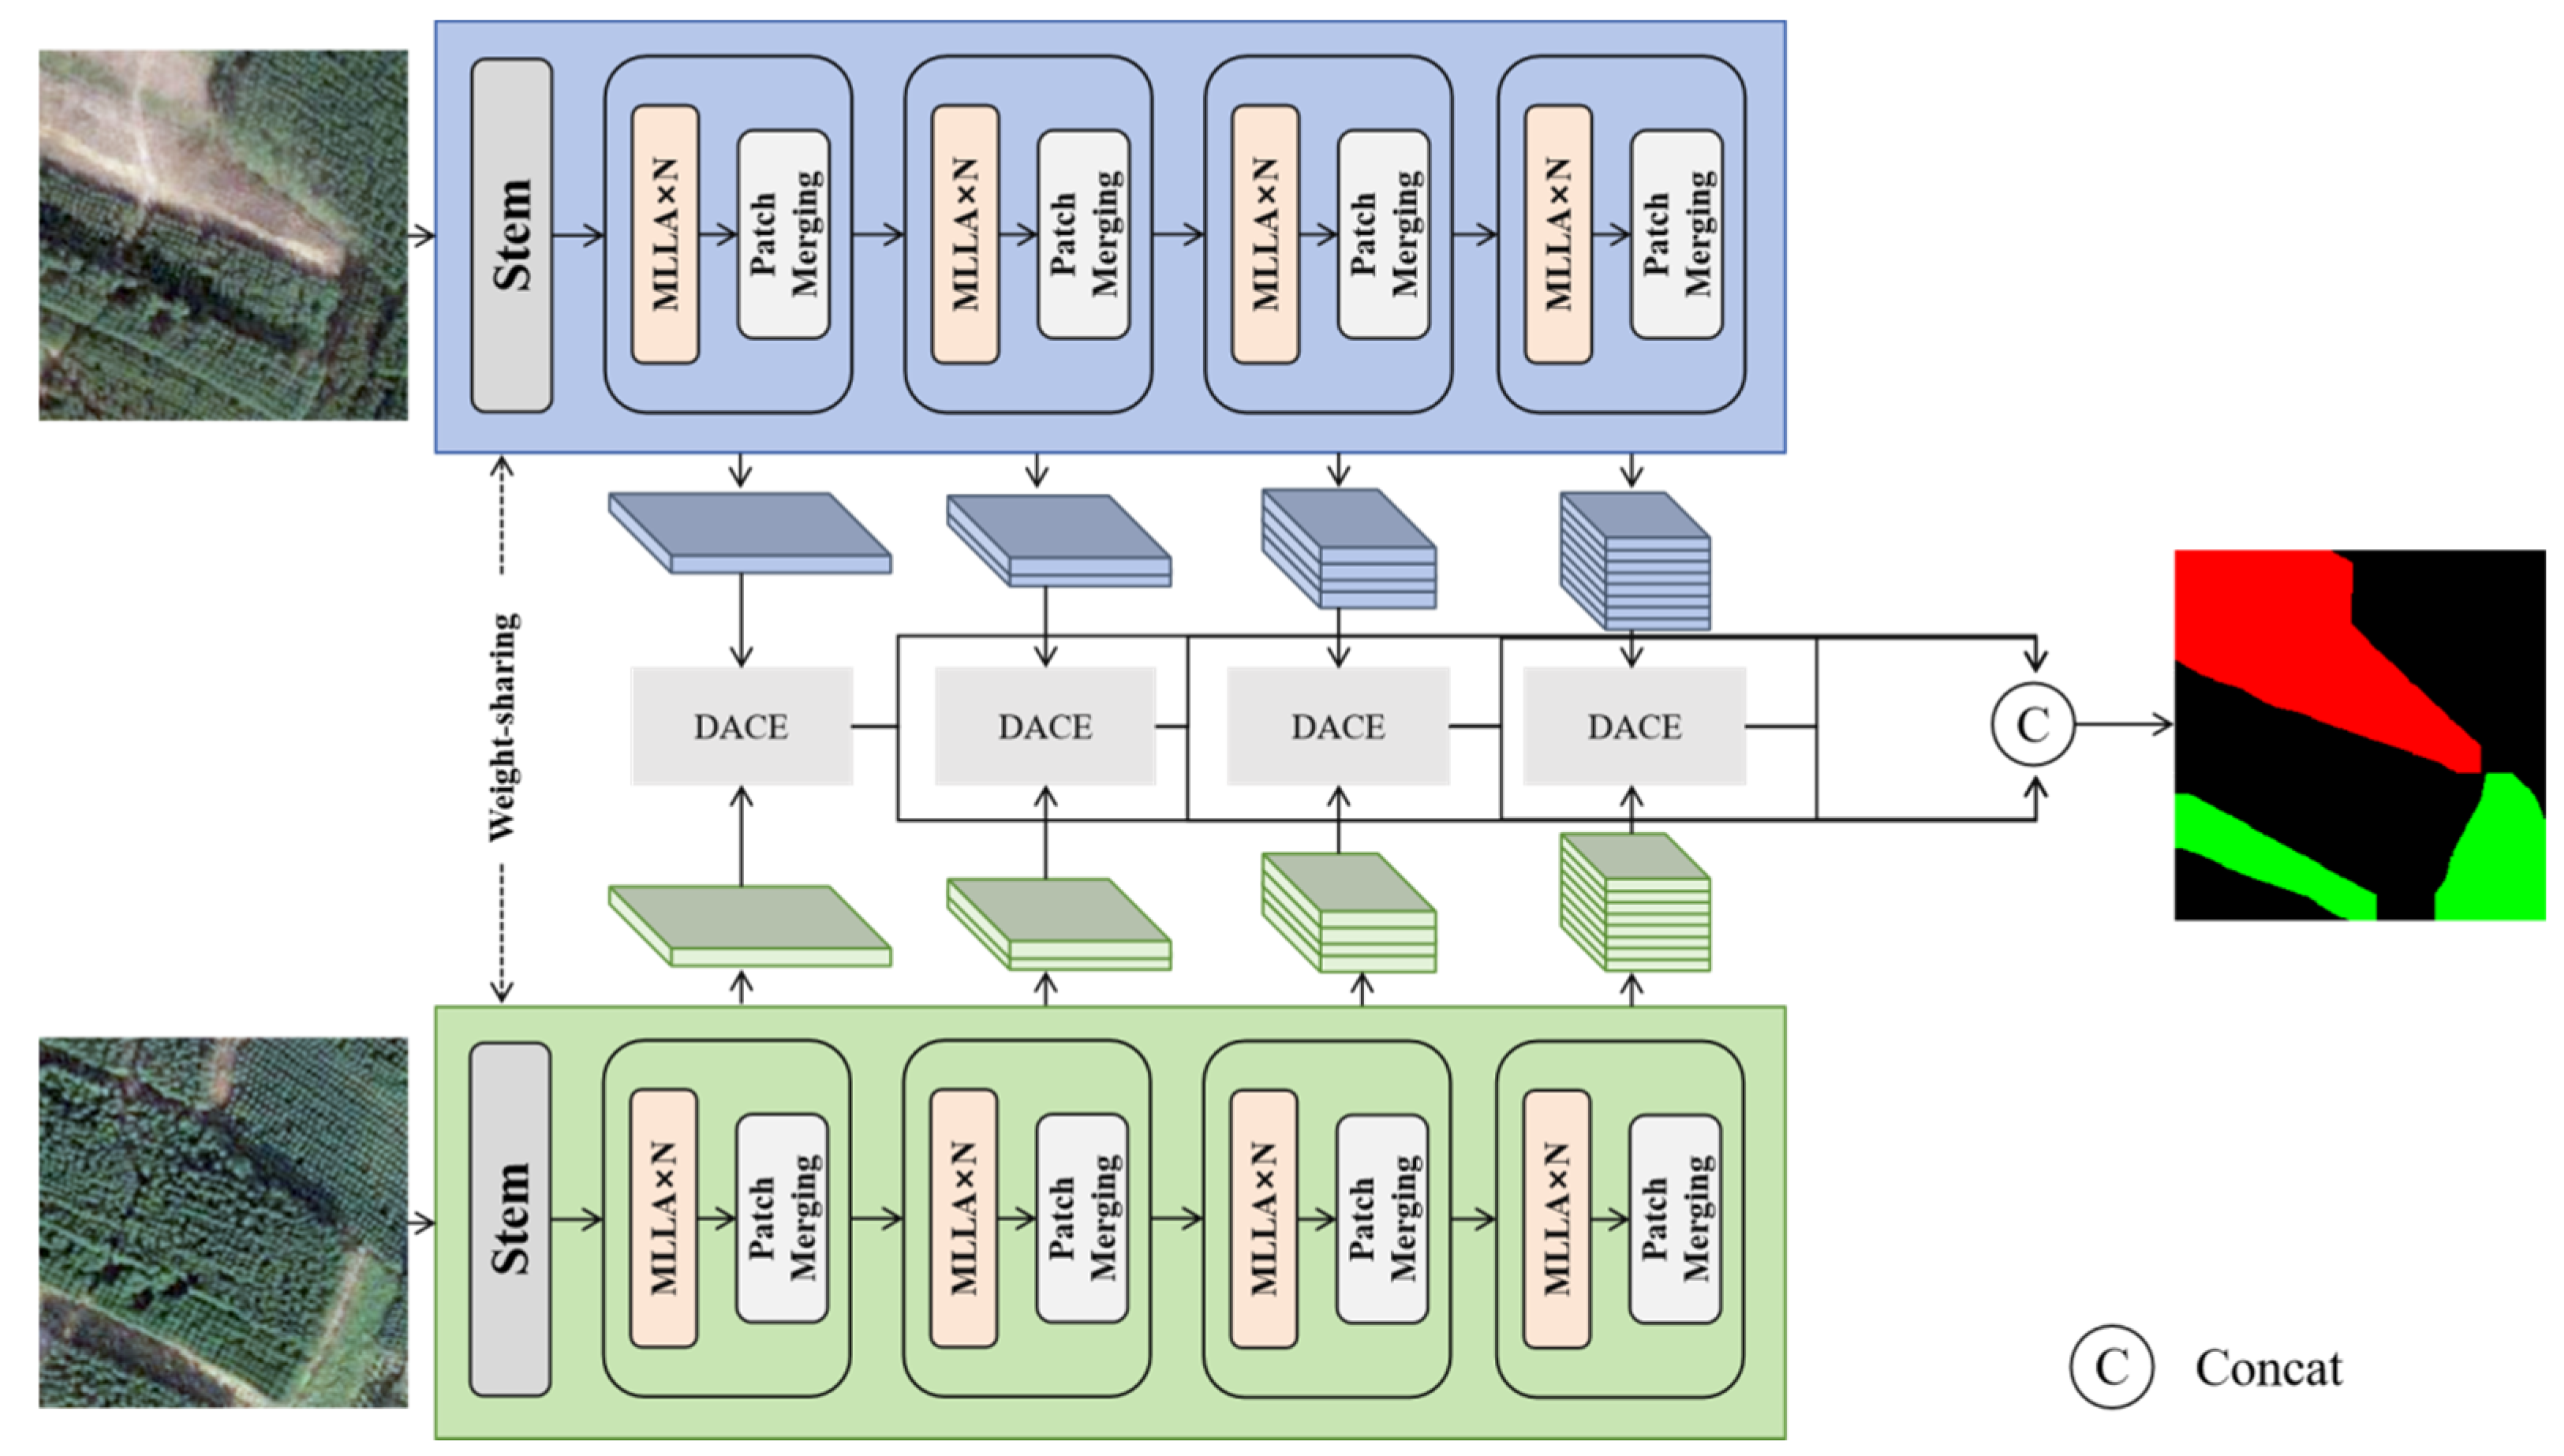
Figure 1. Overall architecture of the MLLAForestCD model. The blue and green branches represent the two temporal inputs; red, green, and black in the output mask denote disappearance, appearance, and unchanged pixels, respectively.
Remotesensing 18 02944 g001
Figure 2. (a) MLLA structure. (b) MLLA block structure. The plus sign denotes residual addition, the circled dot denotes element-wise multiplication, and σ denotes the gating operation.
Remotesensing 18 02944 g002
Figure 3. Structure of the Dual-Axis Change Extractor. Green and blue blocks denote the paired temporal features, arrows indicate feature flow, and the yellow and pink blocks denote the horizontally and vertically arranged branches, respectively.
Remotesensing 18 02944 g003
Figure 4. Workflow of the Eucalyptus Change Detection Dataset (ECDD). Green, blue, and orange denote imagery preprocessing, annotation, and patch generation, respectively; the asterisk in an image dimension denotes multiplication.
Remotesensing 18 02944 g004
Figure 5. Illustrative examples from the ECDD dataset. Red, green, and black denote disappearance, appearance, and unchanged pixels, respectively.
Remotesensing 18 02944 g005
Figure 6. Illustrative examples from the WHU-CD dataset.
Remotesensing 18 02944 g006
Figure 7. Comparison of detection results from different change-detection models based on the ECDD. Red, green, and black denote disappearance, appearance, and unchanged pixels, respectively.
Remotesensing 18 02944 g007
Figure 8. Comparison of detection results from different change-detection models based on the WHU-CD dataset. White and black denote changed and unchanged pixels, respectively.
Remotesensing 18 02944 g008
Figure 9. Recent stand-renewal event mapping based on annual MLLAForestCD change outputs.
Remotesensing 18 02944 g009
Figure 10. Spatial distribution of the most recently detected Eucalyptus plantation-appearance events within the 2020–2023 observation window.
Remotesensing 18 02944 g010
Table 1. Sensor and acquisition-date metadata recovered for the 16 ECDD area–date source mosaics. ArcGIS Wayback metadata was inspected using ArcGIS Pro 3.4.2 (Esri, Redlands, CA, USA).
AreaNominal YearAcquisition DateSatellite/SensorSource Resolution (m)Metadata Evidence
Area1202014 November 2020WorldView-2 (WV02)0.50ArcGIS Wayback metadata
Area1202110 September 2021Jilin-1 JL1KF01A/PMS060.75Archived Jilin-1 product XML
Area1202219 December 2022WorldView-2 (WV02)0.50ArcGIS Wayback metadata
Area1202312 June 2023Jilin-1 JL1KF01C/PMSR50.50Archived Jilin-1 product XML
Area2202025 December 2020WorldView-2 (WV02)0.50ArcGIS Wayback metadata
Area2202110 September 2021Jilin-1 JL1KF01A/PMS060.75Archived Jilin-1 product XML
Area2202219 December 2022WorldView-2 (WV02)0.50ArcGIS Wayback metadata
Area2202316 April 2023WorldView-3 (WV03)0.31ArcGIS Wayback metadata
Area4202025 December 2020WorldView-2 (WV02)0.50ArcGIS Wayback metadata
Area4202110 September 2021Jilin-1 JL1KF01A/PMS060.75Archived Jilin-1 product XML
Area4202219 December 2022WorldView-2 (WV02)0.50ArcGIS Wayback metadata
Area4202316 April 2023WorldView-3 (WV03)0.31ArcGIS Wayback metadata
Area5202025 December 2020WorldView-2 (WV02)0.50ArcGIS Wayback metadata
Area5202110 September 2021Jilin-1 JL1KF01A/PMS060.75Archived Jilin-1 product XML
Area5202219 December 2022WorldView-2 (WV02)0.50ArcGIS Wayback metadata
Area5202316 April 2023WorldView-3 (WV03)0.31ArcGIS Wayback metadata
Table 2. Class-wise ECDD performance of MLLAForestCD and training-split pixel proportions (%).
ClassPixel Proportion (%)Precision (%)Recall (%)F1-Score (%)IoU (%)
Unchanged83.5098.9799.2599.1198.24
Disappearance4.5096.5094.3995.4391.26
Appearance12.0096.0294.8895.4591.29
Macro averageN/A97.1696.1796.6693.59
Table 3. Matched component ablation results under the 20,000-iteration protocol based on ECDD.
IDEncoderTemporal ComparisonFusionmIoU (%)mFscore (%)
AMLLADACE-HV4 levels92.4096.01
BResNet-34DACE-HV4 levels90.8495.14
CMLLAAbsolute difference4 levels70.0481.02
DMLLAChannel concatenation4 levels90.8195.12
EMLLADACE-HVFinest only78.0987.30
Table 4. DACE-specific diagnostic ablation results under the 20,000-iteration protocol based on ECDD.
IDTemporal ComparisonParameter ControlmIoU (%)mFscore (%)
AHorizontal + verticalFull DACE92.4096.01
FHorizontal onlySingle branch92.6296.13
GVertical onlySingle branch92.3695.98
DChannel concatenationStandard90.8195.12
HChannel concatenationMatched to DACE90.8595.14
Table 5. Performance comparison based on the ECDD dataset.
F1
(%)
Pre
(%)
Rec
(%)
IoUUnchanged
(%)
IoUDisappear
(%)
IoUAppear
(%)
mIoU
(%)
SNUNet87.6189.8585.5894.6367.2672.1478.68
ChangeFormer93.0093.6792.3596.6682.1482.6687.15
Changer90.0891.6788.694.9476.5275.6782.37
BAN86.9689.4684.7393.970.568.5477.65
ChangeMamba94.9595.4994.4397.3186.4587.6990.84
MLLAForestCD96.6697.1696.1798.2491.2691.2993.59
Table 6. Performance comparison after independent training and evaluation based on the WHU-CD dataset.
F1-Score (%)Pre (%)Rec (%)IoU (%)
SNUNet89.3490.7387.9980.73
ChangeFormer86.2191.3681.6175.76
Changer90.6493.7187.7682.88
BAN85.3086.1684.4574.36
ChangeMamba91.2792.8289.7783.95
MLLAForestCD97.2997.9796.6390.10
Disclaimer/Publisher’s Note: The statements, opinions and data contained in all publications are solely those of the individual author(s) and contributor(s) and not of MDPI and/or the editor(s). MDPI and/or the editor(s) disclaim responsibility for any injury to people or property resulting from any ideas, methods, instructions or products referred to in the content.