Article

Groundwater Storage Dynamics and Attribution in the Wei River Basin Based on Dynamic Downscaling

1
College of Water Sciences, Beijing Normal University, Beijing 100875, China
2
Gansu Water Investment Group Co., Ltd., Lanzhou 730050, China
3
School of Natural Resources, Faculty of Geographical Science, Beijing Normal University, Beijing 100875, China
*
Author to whom correspondence should be addressed.
Remote Sens. 2026, 18(17), 3013; https://doi.org/10.3390/rs18173013
Submission received: 24 June 2026 / Revised: 3 August 2026 / Accepted: 26 August 2026 / Published: 4 September 2026

Highlights

What are the main findings?
  • In this study, a dynamically downscaling groundwater storage model, specifically corrected for soil erosion mass loss, was developed and revealed a west-to-east decreasing gradient in groundwater storage across the Wei River Basin.
  • Human activities are the primary driver of regional groundwater dynamics, contributing over 80% to storage changes in most years, far exceeding natural climate factors like precipitation and evapotranspiration.
What are the implications of the main findings?
  • Integrating soil erosion corrections into GRACE data processing provides a critical methodological reference for accurately isolating groundwater signals in loess plateaus or other severe erosion-prone basins globally.
  • The dominance of human-induced depletion and significant seasonal volatility in the mid-lower reaches urgently require policymakers to prioritize strict anthropogenic extraction controls over relying on natural recharge.

Abstract

Intensive groundwater exploitation in the Wei River Basin (WRB) has caused severe depletion. While Gravity Recovery and Climate Experiment (GRACE) satellites monitor these changes, their coarse resolution fails to account for soil erosion-induced mass loss on the Loess Plateau limit basin-scale accuracy. To address this, we developed the groundwater storage model to dynamically downscale GRACE data to the resolution of 0.05° grid. This physically based model integrates Darcy’s law, water-balance principles, and an innovative correction for soil erosion mass migration. Validated against well data with maximum correlative coefficient of 0.73, the model reveals a severe groundwater decline of 55.89 × 10⁸ m3/year from 2003 to 2023. The high-resolution results successfully capture localized over-extraction hotspots in the Guanzhong Plain, showing a west-to-east decreasing gradient in groundwater storage along the Wei River channel. Furthermore, quantitative analysis indicates that human activities, including primarily agricultural and urban extraction, are the overwhelming drivers, accounting for over 80% of storage depletion. This framework provides a robust methodological reference for isolating groundwater signals in erosion-prone regions and supports refined water management in semi-arid basins.

1. Introduction

As the largest accessible reservoir of liquid freshwater on Earth, groundwater supplies drinking water for approximately 50% of the global population and irrigation water for nearly 40% of agricultural demand. It is therefore a strategic resource for maintaining ecosystem stability and supporting socioeconomic development, with direct implications for global food and water security [1]. However, under the combined pressures of rising water demand and climate change, overexploitation has become widespread, threatening economic and social sustainability [2]. The resulting depletion of groundwater storage (GWS) has attracted increasing international attention. Accordingly, a more comprehensive understanding of the temporal evolution of GWS and the mechanisms driving it is essential for developing science-based water conservation strategies and interregional cooperative policies.
With the advancement of modern observation technologies, satellite remote sensing and gravimetric inversion have become increasingly important for monitoring groundwater fluxes and storage [3,4]. Among these technologies, Gravity Recovery and Climate Experiment (GRACE) and its follow-on mission (GRACE-FO) have established a framework for evaluating regional water storage changes by measuring spatiotemporal variations in the Earth’s gravity field [5]. By capturing terrestrial water storage changes (TWSC), GRACE and GRACE-FO provide a unique perspective on large-scale hydrologic variability and have been widely used to infer groundwater storage changes (GWSC) at global and regional scales [6,7]. Their longtime series can reveal persistent trends in groundwater storage, thereby supporting early warning of overextraction, optimization of agricultural irrigation, and sustainable resource management [8,9]. These satellite products are particularly valuable in data-sparse regions, including remote arid and semiarid areas where hydrogeologic observations remain limited [10].
GRACE-based gravity observations and conventional hydrologic models are highly complementary in groundwater studies. The former provides large-scale constraints on mass redistribution, whereas the latter represents groundwater dynamics through process-based simulation [11,12]. In practice, GRACE observations are often used to calibrate regional groundwater flow models or to correct simulation bias through data assimilation, thereby reducing parameter uncertainty [13]. This integrated framework, which combines satellite gravimetry, physically based hydrologic modeling, and in situ well observations, has become an important paradigm for improving the quantification of groundwater resources. Nevertheless, the coarse native resolution of GRACE data, together with its inherent spatial smoothing, severely limits its direct application to local water management, irrigation-area overexploitation assessment, and small-scale hydrologic response analysis [14]. Therefore, the development of high-resolution downscaling approaches that translate basin-scale satellite signals into locally resolved spatiotemporal datasets has become a central objective in regional groundwater sustainability research [15].
To address this limitation, a variety of downscaling frameworks have emerged in recent years, including machine-learning models based on statistical regression [6,8,10], physically informed hybrid models that integrate multisource remote sensing data [11,12], and intelligent sensing paradigms incorporating deep learning and physical constraints [10,15,16]. At present, two major technical pathways are commonly used to overcome the limited spatial resolution of GRACE data: statistical downscaling and dynamical downscaling [12]. Statistical downscaling methods, such as random forest (RF), eXtreme Gradient Boosting (XGBoost), support vector machines (SVM), and multiscale geographically weighted regression, construct nonlinear mappings between GRACE signals and high-resolution environmental covariates (e.g., precipitation, evapotranspiration, and land use) to reconstruct GWSC at finer scales [6,7,8,10]. Many studies have reported substantial progress with these approaches. Adam et al. [17] applied a RF model in the Breede River Basin, South Africa, and improved GWSC estimates from 1.00° to 0.25°, while also identifying storage heterogeneity associated with complex topography. Raza et al. [6] used a spatially explicit machine-learning approach in Germany and increased the correlation between downscaled results and in situ observations by 24.00%. For areas subject to intensive anthropogenic disturbance, Chen et al. [18] employed a deep-learning framework to characterize groundwater responses to land-use change in a desert photovoltaic base. Despite their effectiveness in increasing spatial resolution, statistical downscaling methods have clear limitations. They are often treated as black-box models, with internal physical mechanisms that remain insufficiently explained; they frequently do not fully account for fundamental hydrologic processes or water-balance closure [13,18]; and their accuracy depends strongly on the density of in situ observations and the strength of their correlations with driving factors [19]. In regions with pronounced spatial heterogeneity or sparse observations, these models are also prone to bias or overfitting and may fail to capture hydrologic responses to extreme climate events [7].
By contrast, dynamical downscaling and physics-informed data fusion methods incorporate stronger physical consistency by combining GRACE observations with hydrologic models or water-balance equations [11,13]. These approaches exploit the process representation of the hydrologic cycle in physical models to calibrate and assimilate gravity satellite signals, thereby inferring the spatial distribution of groundwater storage within a physically based framework [11,12]. Because they are driven by explicit physical relationships, regional models constrained by basin-scale information can provide higher-resolution estimates at smaller scales while remaining less dependent on the spatial distribution of observations. Moreover, their more complete representation of hydrologic processes helps ensure that simulated results remain physically reasonable. For example, Pellet et al. [20] developed a physics–statistics fusion framework based on water budget closure, dynamically reconstructing GRACE data to a daily resolution of 1 km in the Po River Basin and effectively addressing high-resolution TWSC estimation under strongly underdetermined conditions. Sun et al. [21,22] developed a groundwater flow numerical model and achieved dynamical reconstruction from 1.00° to 0.05° in the Beijing–Tianjin–Hebei region and the northwestern inland areas, successfully characterizing local inter-aquifer-exchange patterns. Tangdamrongsub et al. [23,24,25] assimilated GRACE and multisource remote-sensing observations into a land surface model using the ensemble Kalman smoother (EnKS), obtaining results in Australia and the North China Plain that were markedly superior to those of a single physical model. However, dynamical downscaling also faces several challenges. The model is highly sensitive to hydrogeologic parameters such as specific yield and hydraulic conductivity, and parameter uncertainty directly affects downscaling accuracy [25]. In addition, some models simplify groundwater as a linear reservoir and do not fully account for aquifer heterogeneity or the effects of intensive human pumping on simulation outcomes [26].
The Wei River Basin, particularly the semiarid Guanzhong Basin, faces severe water scarcity and pronounced spatial and temporal unevenness in water availability [27,28]. With the intensification of socioeconomic activities, the pressure on regional groundwater development and utilization has become increasingly prominent [29]. Existing studies have analyzed groundwater changes from the perspectives of water resource distribution characteristics, anthropogenic water withdrawal and consumption processes, ecological effects induced by groundwater extraction, and resource development potential assessment [30]. Wei and Wan showed that total water storage in the Wei River Basin exhibited an overall declining trend from 2002 to 2020 and discussed its relationship with vegetation change [31]. In basin hydrologic modeling, Wu et al., based on an improved WetSpa model, analyzed the effects of surface-water and groundwater withdrawals in the upper and middle reaches of the Wei River Basin on runoff processes and showed that human water use had substantially altered regional hydrologic responses [30]. Chen et al. further demonstrated that groundwater extraction, under the combined influence of climate change and irrigation demand, exacerbates runoff deficits in the Wei River Basin [29]. However, the potential influence of soil erosion on the groundwater system has received insufficient attention, limiting a comprehensive explanation of the mechanisms underlying groundwater dynamics. In addition, studies that integrate high-resolution human water-use data and quantitatively distinguish natural variability from anthropogenic forcing remain limited [30]. Therefore, downscaling studies are needed to provide subregional groundwater storage estimates at higher spatial resolution.
The objective of this study is to develop a groundwater storage model using freely available GRACE data and to downscale GWSC from 1.00° to 0.05°. The proposed groundwater storage model differs from conventional groundwater flow models in that it uses changes in groundwater storage, rather than hydraulic head, as the key variable in the governing equations, thereby providing a more explicit physical interpretation. The next section introduces the study area, data sources, and the downscaling methodology, followed by the model evaluation approach. Section 3 presents the calibration and validation procedures, as well as the downscaling results and their verification. Section 4 discusses the results. It compares the simulated regional groundwater imbalance change rates with the estimated water balance values and analyzes groundwater spatial heterogeneity, driving factors, and model limitations. Section 5 summarizes the research conclusions.

2. Study Area and Methods

2.1. Study Area

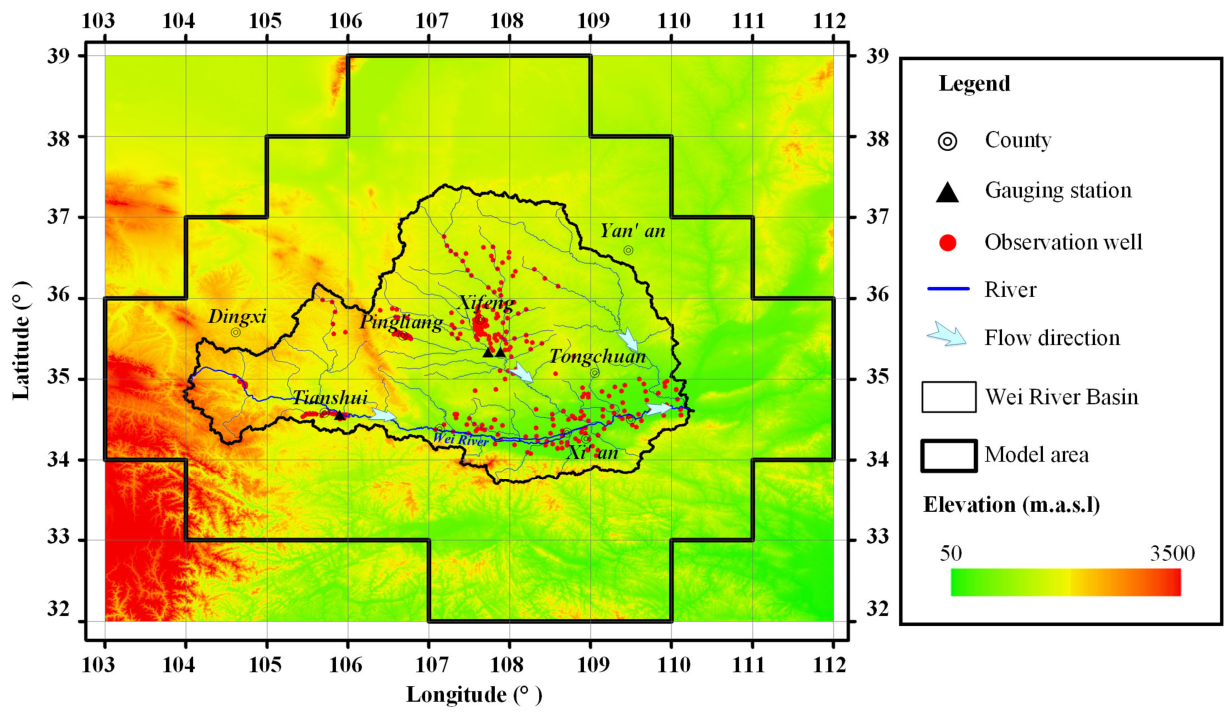
The study area is the Wei River Basin, located between 103°58′18″E and 110°16′28″E and between 33°41′47″N and 37°24′30″N (Figure 1). It spans Gansu, Shaanxi, and Ningxia and covers an area of approximately 134,800 km2. The Wei River main stem extends 818 km. Its channel is broad and contains numerous sandbars, with a dispersed flow pattern. The 208 km downstream reach is characterized by a gentle gradient, low flow velocity, and pronounced sediment deposition. The basin lies in the transition zone between semiarid and subhumid climates, and more than 60% of annual precipitation occurs from July through October. Mean annual precipitation is approximately 572.00 mm, exceeding 800.00 mm in the Qinling Mountains but generally remaining below 500.00 mm in the northern part of the basin. Mean annual evapotranspiration is 892.60 mm. The long-term mean natural runoff is approximately 6.29 × 10⁹ m3, total groundwater recharge is about 5.18 × 10⁹ m3, and the estimated long-term mean exploitable groundwater resource is 3.31 × 10⁹ m3. Based on long-term meteorological observations in the Wei River Basin, Liu [32] reported a significant upward trend in regional temperatures, with a warming rate of approximately 0.25–0.35 °C per decade, followed by an abrupt change in the mid-1990s. Taking Qingyang County in Tianliu District as an example, the western and northwestern regions exhibited relatively modest temperature increases, with annual average temperatures remaining within the range of 7.5–10.5 °C.
Taking the Tianshui, Pingliang, and Qingyang stations as examples, Tianshui showed the weakest warming signal, and the annual mean temperatures at all three stations reached their minimum in 1984, with values of 10.30, 7.79, and 7.47 °C, respectively. Topographically, the basin is higher in the west and lower in the east, with elevations ranging from approximately 3495 m in the west to 323.00–340.00 m in the east. The terrain forms a stepped pattern from north to south, transitioning from the Longxi Loess Plateau to the Qinling Mountains. Major landforms include loess hills, loess tablelands, earth–rock mountains, loess terraces, and fluvial alluvial plains. The main aquifer units in the basin include unconsolidated porous aquifers, metamorphic fractured-rock aquifers, clastic fractured-rock aquifers, and carbonate fractured-karst aquifers. The unconsolidated porous aquifers are mainly distributed in valley areas of the Loess Plateau, where the aquifer materials are dominated by aeolian and alluvial–proluvial sand, gravel, and cobbles. The mean annual runoff of the Wei River main stem is approximately 7.57 × 10⁹ m3. Among its tributaries, the Jing River is the largest, with a runoff of about 2.14 × 10⁹ m3 and a high sediment load, followed by the Beiluo River, with a runoff of approximately 9.96 × 10⁸ m3. Southern tributaries at the northern foot of the Qinling Mountains, such as the Heihe and Bahe rivers, are short and characterized by steep flow regimes. Water resources in the basin are primarily developed and utilized through surface–water diversion, agricultural irrigation, urban and rural water supply, and reservoir regulation. As a result, the basin faces persistent problems of water scarcity, overdevelopment, water pollution, and ecological degradation. To address regional groundwater overdraft, China has implemented large-scale interbasin water-transfer projects, such as the Hanjiang-to-Weihe Diversion Project and the Tao River Diversion Project, both of which have promoted groundwater-level recovery.

2.2. Downscaling Methods of Groundwater Storage

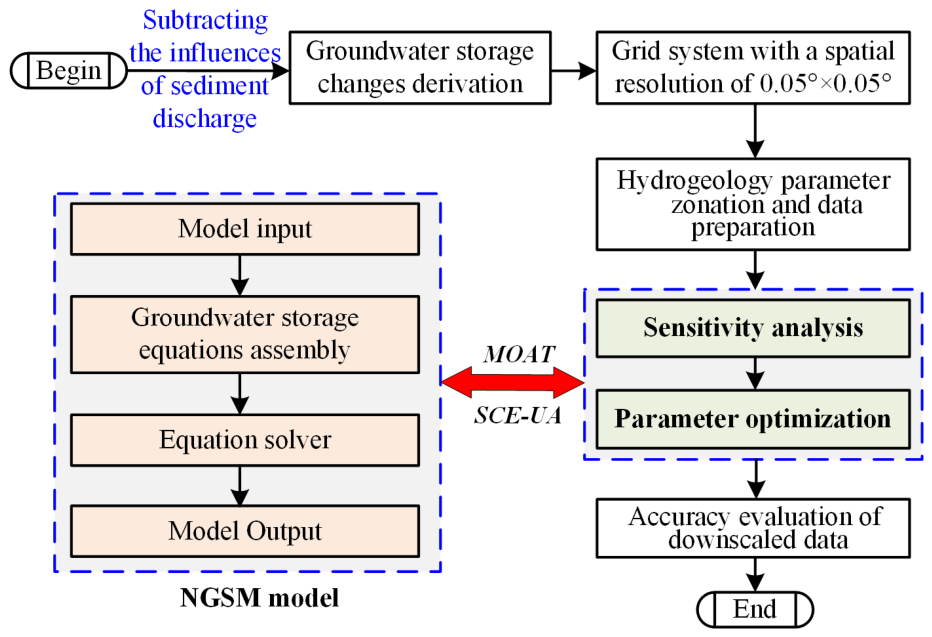
The flowchart (Figure 2) presents the framework used to construct and apply the groundwater storage model. The procedure begins by removing the influence of sediment discharge to isolate the groundwater storage signal. Groundwater storage changes are then derived and discretized onto a 0.05° × 0.05° grid to ensure spatial consistency for numerical modeling. Hydrogeological parameters are subsequently zoned and prepared for model parameterization. The framework is composed of two coupled components. The first is the Nest-based Groundwater Storage Model (NGSM), which integrates boundary and initial conditions, formulates the groundwater storage equations, and solves them numerically to generate model outputs. In parallel, sensitivity analysis is conducted using the Morris One-At-a-Time (MOAT) screening method [33], and parameter optimization is performed using Shuffled Complex Evolution–University of Arizona (SCE-UA) [34]; the two processes are iteratively linked to improve parameter estimation and model performance. Finally, the calibrated model is evaluated against the downscaled data to assess the reliability of the simulated groundwater storage changes. This workflow provides a structured basis for simulating and optimizing groundwater storage dynamics for scientific analysis and resource management.

2.2.1. Principle of Groundwater Storage Model

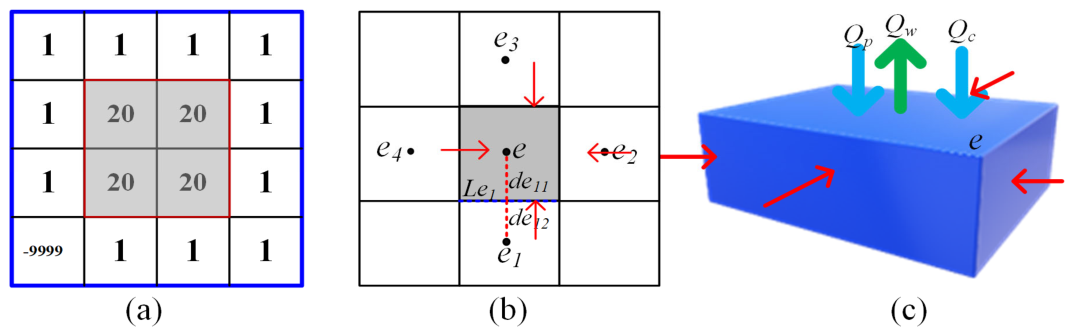
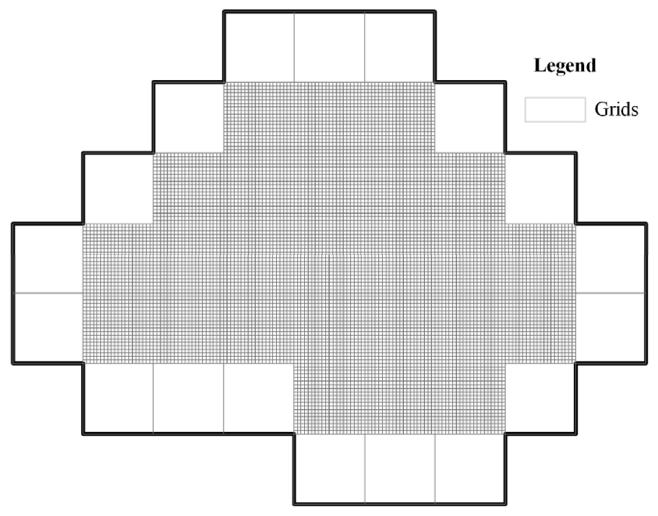
As shown in Figure 3a, the study domain was discretized into square grid cells. A value of −9999 indicates a no-data region, 1 represents a cell retained at its original size, and 20 denotes a cell further subdivided into 400 equal subcells. Temporal variation in groundwater storage was derived from Darcy’s law and the principle of water balance. Vertically, the model adopts a single simulation layer, with each planar square treated as a representative unit. Although the Wei River Basin is underlain by a complex multi-layered aquifer system, GRACE-derived groundwater storage anomalies represent vertically integrated mass variations over the entire saturated thickness. Therefore, the subsurface is conceptualized as an equivalent single-layer model to simulate integrated groundwater storage dynamics rather than layer-specific hydraulic heads. For a grid cell e centered at node i, as illustrated in Figure 3b, the discrete form of Darcy’s law combined with the water-balance principle is expressed as:
Q e e 1 = T e 1 h e 1 n + 1 h e n + 1 d e 1 L 1
where Te1 is the average hydraulic conductivity between cells e and e1, de1 is the distance between their centers, L1 is the length of the shared boundary, and Qe−e1 is the flow from cell e1 to cell e.
Summing the contributions from all neighboring cells of e (i = 1, 2, 3, …, m) yields the total lateral inflow (Qlat):
Q lat = i = 1 m T e i h e i n + 1 h e n + 1 d e i L e i
Assuming a total of N cells, the groundwater balance equation for cell e is written as:
i T e i h e i n + 1 h e n + 1 d e i L e i + α e A e Q p n β e A e Q w n + Q c n = S y e h e n + 1 h e n Δ t A e
where h e n + 1 is the groundwater head in cell e at time step n + 1 , h e i n + 1 is the head in the i -th neighboring cell, T e i is the hydraulic conductivity between cell e and its neighbor, S y e is the comprehensive specific yield, A e is the cell area, α e is the precipitation infiltration coefficient, Q c n is additional monthly groundwater recharge and discharge from such activities as local pumping, Q p n is the precipitation at time step n , β e is the evaporation coefficient, Q w n is the evaporation at time step n, L e i is the shared boundary length, d e i is the distance between cell centers, and Δ t is the time step.
Groundwater storage derived from GRACE/GRACE-FO inversion is defined as:
G W g e n = S y e ( h e n h a v g e )
where h a v g e is the mean groundwater level (GWL) from 2004 to 2009.
Consequently, the groundwater balance equation can be reformulated as:
i T e i G W g e i n + 1 / S y e i + h a v g e i G W g e n + 1 / S y e h a v g e d e i L e i + α e A e Q p n β e A e Q w n + Q c n = G W g e n + 1 G W g e n Δ t A e
When observed water levels are unavailable, the land-surface slope derived from surface elevations is used to approximate the hydraulic gradient, and a hydraulic gradient coefficient C h y d r o is introduced for parameter estimation:
T e i h a v g e i h a v g e d e i L e i T e i Z a v g e i Z a v g e d e i C hydro L e i
where Zavge and Zavgei are the average surface elevations at cell e and the neighboring cell ei.
For each grid cell, a closed system of equations is established under Dirichlet boundary and initial conditions. Solving this system yields groundwater storage anomaly G W g for each cell e . The developed model is referred to as NGSM.

2.2.2. Principle of Water Balance

Based on the water-balance principle, precipitation (P), actual evapotranspiration (AET), runoff depth (R), and human-induced impacts (Q) are the main drivers of terrestrial water storage variation in the Wei River Basin, where human activities are intensive. The terrestrial water storage change can be expressed as:
d S d t = P AET R Q
where dS/dt denotes the change in terrestrial water storage over the time interval dt.
Thus, the water storage variation attributable to human activities (Q) can be estimated as:
Q = P AET R d S d t
The change in terrestrial water storage over dt can be derived from the GRACE-retrieved TWSC differences:
d S d t = T W S C ( t + d t ) T W S C ( t ) d t

2.2.3. Separation of Solid Mass Components in GRACE Data

The physical quantity measured by GRACE gravity satellites is the change in total mass anomaly at the Earth’s surface. In most hydrological applications, this total mass change is assumed to arise entirely from hydrologic fluxes. In the Wei River Basin, however, intense soil erosion and sediment transport on the Loess Plateau introduce a substantial non-hydrologic component. Consequently, the total mass change detected by GRACE in this region is the superposition of hydrologic mass variation and solid sediment loss.
In standard GRACE products, all mass changes are converted to equivalent water height (EWH) to ensure consistency with hydrological analyses. Based on this, groundwater storage change (ΔGWS) can be calculated using GRACE-FO-based terrestrial water storage change (ΔTWS), together with modeled changes in soil moisture (ΔSM), snow water equivalent (ΔSWE), and solid mass changes ( Δ S o l i d ), as expressed in Equation (10).
Δ G W S = Δ T W S Δ S M Δ S W E Δ S o l i d
where Δ denotes monthly change, and Δ S o l i d denotes the apparent equivalent water height obtained by converting solid mass loss using the density of liquid water, and it can be expressed as:
Δ S o l i d = Δ M s o l i d ρ w A
where Δ M s o l i d is the change in sediment mass over the time step, ρ w is the water density, and A is the area of solid.
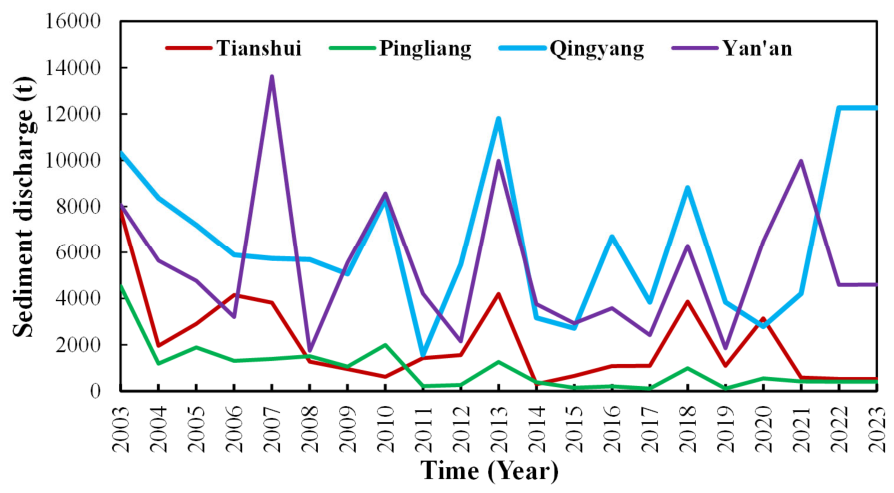
In this study, Δ S o l i d was treated as a correction term to account for the non-hydrologic mass component associated with erosion and sediment export. To minimize its influence on the GRACE-derived signal, a detrending procedure was applied during data preprocessing to remove the long-term monotonic sediment-loss trend. This step does not alter the short-term interannual variability of sediment flux but suppresses the secular component that would otherwise be mixed into the terrestrial water storage anomaly. The Loess Plateau portion of the Wei River Basin is characterized by severe soil erosion. Figure 4 shows interannual variations in sediment flux across different regions from 2003 to 2023, with Yan’an and Qingyang exhibiting pronounced soil and water loss. The sediment-loss information was assigned to the corresponding administrative regions, converted into equivalent water height using Equation (11), and then subtracted from the terrestrial water storage change at the same spatial scale. Accordingly, the groundwater storage change for these administrative regions was corrected by removing the solid-mass contribution, thereby reducing the systematic bias in groundwater inversion caused by geomorphic and erosional conditions.

2.2.4. Downscaling Method

Because groundwater storage anomaly data derived from GRACE represent anomalies integrated over the full aquifer thickness, the model was formulated as a two-dimensional system with a single vertical layer. The model domain spans 104–113°E and 33–40°N and was implemented as a two-dimensional saturated transient-flow model. The study area was discretized into 18 outer grid cells with a resolution of 1.00° × 1.00° and 10,000 inner grid cells with a spatial resolution of 0.05° × 0.05° (Figure A1). Dirichlet boundary conditions were imposed along the outer grid cells, and GWSC was simulated for the 10,000 interior grid cells. For variables originally available at the administrative-unit scale, the values were spatially disaggregated to the 0.05° × 0.05° grid cells using an area-weighted allocation approach, so that the total value of each administrative unit was preserved after downscaling.
In this study, the main recharge source was precipitation infiltration, whereas the principal discharge components were evapotranspiration and groundwater abstraction. Changes in surface water were small and were therefore neglected. Based on the analysis and calculations, groundwater recharge in the study area was estimated as precipitation multiplied by the precipitation-infiltration recharge coefficient. Because field measurements of groundwater evapotranspiration and abstraction are difficult to obtain, groundwater discharge was approximated by multiplying actual land-surface evapotranspiration by the phreatic evapotranspiration coefficient.
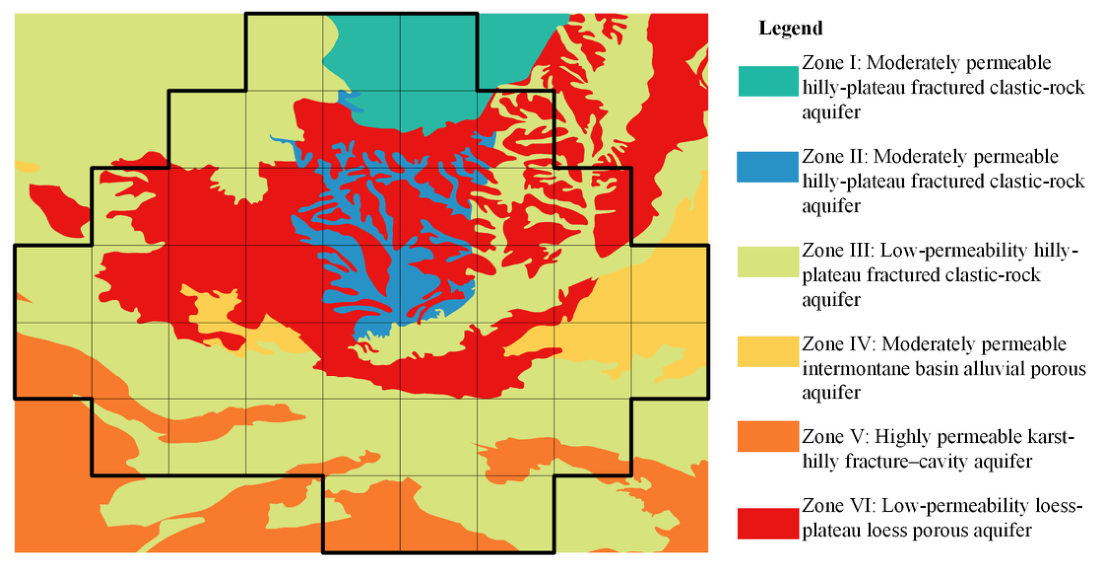
The groundwater system in the study area was conceptualized according to its hydrogeologic conditions. On the basis of hydrogeologic characteristics, the region was divided into six zones (Figure 5): karst hills with strongly permeable fractured-cavernous water, intermontane basins with moderately permeable alluvial porous water, hilly plateaus with moderately permeable clastic-rock fracture water, hilly plateaus with clastic-rock fracture water, hilly plateaus with weakly permeable clastic-rock fracture water, and the Loess Plateau with weakly permeable loess porous water. Model parameters included transmissivity (T), specific yield (Sy), precipitation infiltration recharge coefficient (α), phreatic evapotranspiration coefficient (β), and hydraulic gradient coefficient (Chydro). These parameters were assigned on the basis of published empirical values for the corresponding aquifer types. Parameter calibration was carried out using the MOAT, which is computationally efficient and straightforward to implement [33,34].
The simulation period was January 2003 to December 2023. A monthly time step was adopted to match the temporal resolution of the GRACE-based data. The fitting target was the GWSC time series constructed from GRACE data for the inner grid cells, excluding the Dirichlet boundary cells. GWSC for the study area was calculated using the NGSM. In the second step, the model was run on the optimized grid with a spatial resolution of 0.05° to obtain GWSC at a finer scale. In both steps, the hydrogeologic parameters were held constant; they were estimated only in the first step and then transferred to the 0.05° grid. The model was driven by precipitation and evapotranspiration data at 0.05° spatial resolution to generate fine-scale GWSC.

2.3. Evaluation Indexes

The performance of the model outputs was evaluated using the root mean square error (RMSE) and the Nash–Sutcliffe efficiency coefficient (NSE). RMSE was used to quantify the discrepancy between simulated values and both GRACE-derived observations and ground-based measurements for each grid cell. NSE was used to assess model fit. An RMSE approaching 0.00 and an NSE approaching 1.00 indicate reliable model performance.
RMSE = i = 1 n ( X i Y i ) 2 n
NSE = 1 i = 1 n ( X i Y i ) 2 i = 1 n ( X i X ¯ ) 2
where Xi denotes the observation-based value or ground measurement, Yi denotes the modeled value, and X ¯ is the mean of X, while Y ¯ is the mean of Y.
In addition, correlation analysis was used to examine the relationships among variables and characterize the strength of their linear association, expressed by the Pearson correlation coefficient:
r = i = 1 n ( X i X ¯ ) ( Y i Y ¯ ) i = 1 n ( X i X ¯ ) 2 i = 1 n ( Y i Y ¯ ) 2
where Y ¯ is the corresponding means of modeled value.

2.4. Data Sources

The datasets used in this study are summarized in Table 1 and described below. The variables integrated in the analysis include TWS, soil moisture, snow water equivalent, canopy water storage, runoff depth, precipitation, AET, land cover classification, groundwater withdrawals, and limited groundwater-level observations. Terrestrial water storage anomalies were obtained from GRACE/GRACE-FO products. Specifically, we used the CSR mascon dataset, accessed as a monthly netCDF series at 1.00° spatial resolution, covering January 2003 to December 2023 (220 months in total). During the transition from GRACE to GRACE-FO (July 2017 to May 2018), TWS data were missing. However, other short-term gaps were filled using simple linear interpolation based on the 2 adjacent months. Land-surface hydrologic components, including soil moisture, snow–water equivalent, canopy storage, and AET, were mainly derived from the Global Land Data Assimilation System 2.1 (GLDAS-2.1) multimodel dataset. NOAH v2.10 was used at 1.00° and monthly resolution for January 2003 to December 2023; this configuration has relatively low bias in simulating land-surface hydrologic processes [35]. In parallel, Catchment Land Surface Model (CLSM) v2.20 was incorporated at 0.25° and daily resolution for February 2003 to December 2023. Using two model formulations in parallel helps reduce parameterization uncertainty, while their complementary spatiotemporal resolutions improve the representation of land-surface processes.
Precipitation was taken from the PENG monthly precipitation dataset for China at 1 km resolution [36], released by the National Tibetan Plateau Data Center. The dataset was generated over China using delta spatial downscaling based on CRU global 0.50° meteorological data and WorldClim high-resolution climate data, and it performed well against observations at 496 independent meteorological stations. Actual evapotranspiration was obtained from the USGS SSEBop product, which is designed for rapid and stable detection of changes and anomalies. Version 5 (V5) provides monthly data at 0.05° resolution from January 2003 to April 2022, and Version 6 (V6) provides monthly data at the same resolution from May 2022 to December 2023.
Groundwater abstraction data were compiled from prefecture-level statistics reported in the 2003–2023 Water Resources Bulletins of Shaanxi Province, Gansu Province, and the Ningxia Hui Autonomous Region. In general, abstraction rates were relatively high in Xi’an, Baoji, Xianyang, Weinan, Hanzhong, Yulin, and Yinchuan; moderate but declining in recent years in Shangluo, Lanzhou, Baiyin, Pingliang, Qingyang, Wuzhong, and Guyuan; and relatively low in Tongchuan, Yan’an, Ankang, Tianshui, Dingxi, Longnan, and Zhongwei, where interannual variability was more pronounced. Groundwater-level monitoring data were obtained from monitoring wells operated by the Ministry of Natural Resources for the period from January 2021 to December 2023. The administrative groundwater extraction totals were uniformly assigned to the 0.05° grid cells within each administrative unit. This procedure preserves the total withdrawal amount at the administrative scale, but it does not represent actual pumping well locations. Therefore, the resulting grid-level anthropogenic forcing should be interpreted as an approximate spatial disaggregation used for basin-scale attribution rather than a georeferenced distribution of pumping centers.

3. Results

3.1. Temporal Validation and Comparison with Observed Data

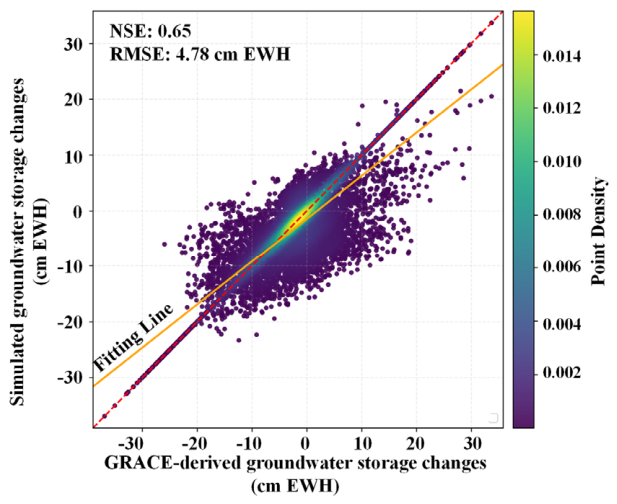
High-precision monitoring-well observations in the Wei River Basin are available only from 2021 to 2023. Given this limited temporal coverage, the primary validation of the 20-year transient simulation relies on the GRACE and GRACE-FO-retrieved groundwater storage change dataset, which provides continuous basin-wide constraints across the full period. The monitoring wells thus serve as a supplementary point-scale confirmation of recent regional dynamics, as presented in the well-comparison below. GRACE-derived GWSC data from 2003–2023 were used to validate the numerical model. Figure 6 presents the correlation and point-density distribution between simulated GWSC and GRACE satellite observations. Most points cluster tightly around the 1:1 line, indicating strong agreement between the simulations and the GRACE data. The model evaluation metrics yield an NSE of 0.65 and an RMSE of 4.78 cm, with a EWH between the simulated values and the GRACE observations. Although a small number of outliers occur at the extremes of storage change (< −20.00 cm EWH or > 20.00 cm EWH), the overall fit remains close to the 1:1 line. The zonation of the study area (Figure 5) shows the optimal parameters for each zone, which are detailed in Table A1. These results indicate that the groundwater model developed in this study can reproduce the spatiotemporal evolution of groundwater storage in the Wei River Basin with relatively high accuracy and reliability.
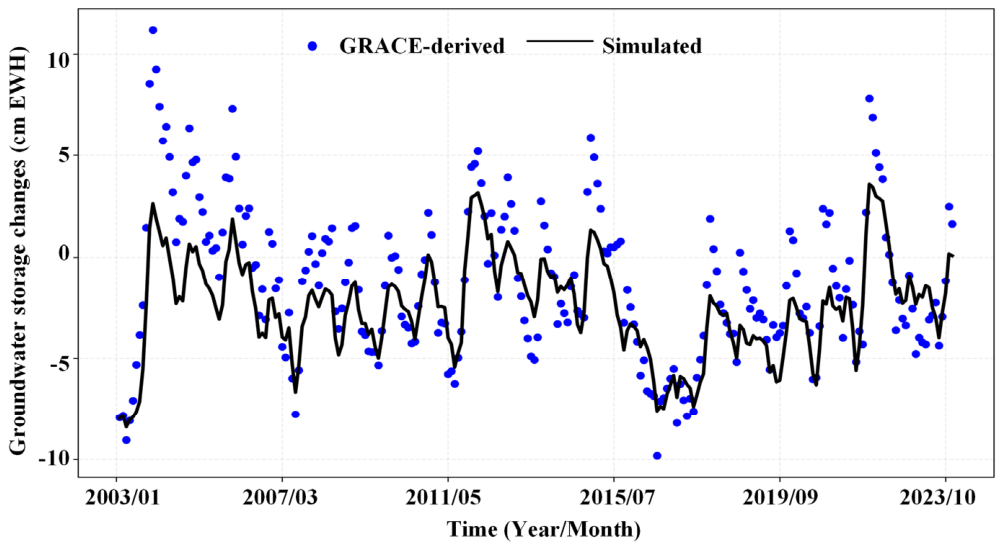
To further validate the reliability of the model at the regional scale, the simulated groundwater storage changes (GWSC) were compared with GRACE-derived GWSC data (Figure 7). Overall, the simulation effectively captures the seasonal fluctuations and interannual variations in groundwater storage. Notably, the model demonstrates a strong capability to track the timing of storage peaks and troughs, reflecting the complex evolution of groundwater dynamics driven by both climatic forcing and human activities. Although minor discrepancies exist between the simulated values and GRACE data at local extrema in certain years, the two-time series exhibit a high degree of consistency throughout the study period. This strongly confirms that the numerical model reliably reproduces the long-term evolution of regional groundwater storage.
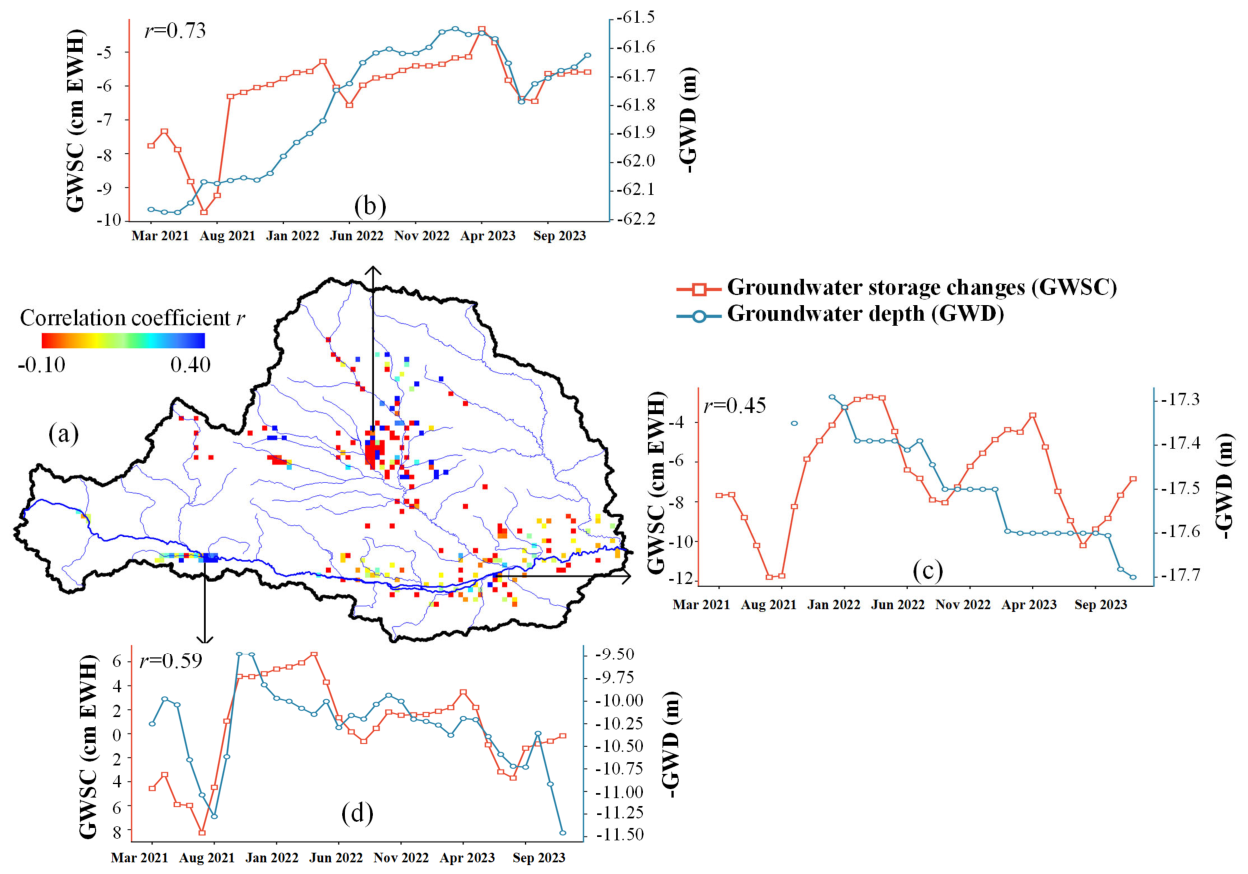
Simulated GWSC was also compared with observed groundwater depth (GWD) data from representative monitoring wells in the Wei River Basin (Figure 8). Based on groundwater-level observations from monitoring wells operated by the Ministry of Natural Resources from January 2021 to December 2023, a total of 173 wells were included in the analysis. The monitoring wells used in this study represent available groundwater-level observations within the Wei River Basin. Considering that this study focuses on basin-scale groundwater storage estimation rather than local-scale hydrostratigraphic characterization, these observations were used to evaluate the consistency between simulated and observed regional groundwater dynamics. Figure 8a shows the spatial distribution of the correlation coefficient between the simulated results and the observed water-level series across the basin. Most monitoring sites exhibit significant positive correlations, confirming the model’s ability to capture local groundwater dynamics.
To examine model performance under different hydrogeological conditions, we selected three representative monitoring sites (Figure 8b–d) for detailed analysis. The results show that the simulated GWSC curves reproduce the seasonal and interannual variability of the observed GWD reasonably well. At the three representative sites, the correlation coefficients between the simulated and observed values are 0.73, 0.45, and 0.59, respectively. Although local deviations remain because of differences in pumping intensity, aquifer heterogeneity, and the completeness of the observed time series, the simulated and observed data are broadly consistent in their spatiotemporal trends. This comparison supports the accuracy and applicability of the high-resolution groundwater model developed in this study for refined regional water-resources management.

3.2. Spatial Patterns After Downscaling

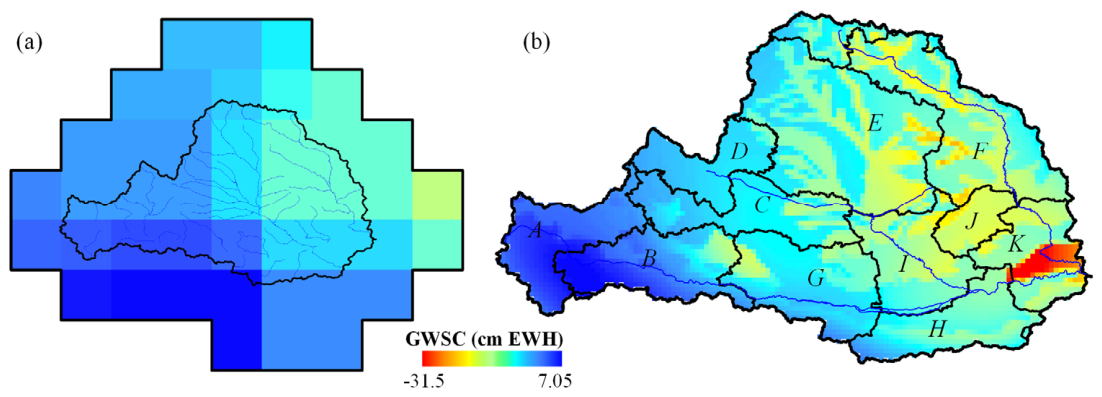
Compared with the relatively smooth storage pattern at the original GRACE resolution (Figure 9a), the downscaled results (Figure 9b) clearly reveal substantial spatial heterogeneity among the sub-basins (A–K) of the Wei River Basin. Through spatial refinement, the model successfully identified local extrema in groundwater storage, including a pronounced depletion hotspot in the southeastern part of the study area near Region K, which contrasts sharply with the smoother distribution in the original GRACE data. This refined spatial representation not only confirms the ability of the downscaling model to capture intra-basin hydrologic processes but also provides spatially explicit support for identifying groundwater depletion across different subregions of the Wei River Basin.

4. Discussion

4.1. Spatial Heterogeneity Analysis

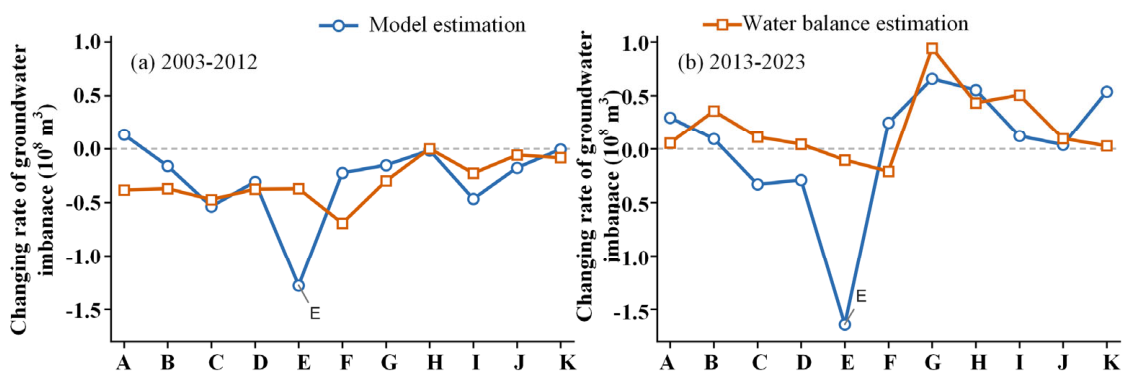
Figure 10 compares the simulated groundwater imbalance change rate with the water-balance estimates for different regions from 2003–2023. The groundwater imbalance change rate is derived based on the water balance equation (Equation (10)). Spatially, groundwater imbalance in the Wei River Basin exhibits pronounced differences among administrative regions. Qingyang (Region E) shows the most severe negative imbalance, reflecting sustained groundwater depletion pressure in this area. Both the model-based estimates and the water-balance estimates reach local minima in this region, which is consistent with its location in the core area of the Loess Plateau, where intensive agricultural irrigation demand has long coexisted with insufficient groundwater recharge. This result validated the working hypothesis of this study, namely that the dynamic downscaling model incorporating physical mechanisms can more accurately capture local water storage variations compared to traditional methods. Compared with the RF statistical regression model employed by Adam et al. [17], the NGSM model not only improves resolution but also overcomes the black-box limitations of statistical models through the principle of water balance closure. This finding aligns with the dynamic reconstruction conclusions achieved by Sun et al. [21,22] in northern inland China, demonstrating the superiority of physical consistency constraints when dealing with regions exhibiting significant spatial heterogeneity. Baoji (Region G) shows a positive trend in groundwater storage from 2013–2023, which may be associated with the gradual effects of recent grain-for-green programs and water-resource protection measures. The imbalance conditions in Weinan (Region K) and Tongchuan (Region J) from 2013–2023 are less severe than those over the full 2003–2023 period, consistent with the contraction of groundwater depletion hotspots shown in Figure 9 over the past decade. Depletion hotspots such as Regions E, K, and J, including Qingyang, Weinan, and Tongchuan, have remained under sustained groundwater stress because of excessive reliance on groundwater for agricultural irrigation. In these areas, stricter groundwater abstraction controls and precision water-saving irrigation technologies are necessary. In contrast, recovery areas such as Regions A, B, and G, including Lanzhou, Tianshui, and Baoji, show a more favorable groundwater recovery trajectory. This pattern is supported not only by relatively favorable hydrologic recharge conditions, but also by the early effects of regional water-transfer projects and water-resource management policies. The interregional contrast highlights the uneven development and use of groundwater resources across the basin. In the economically developed and irrigation-dependent Guanzhong Plain, including Xi’an, Xianyang, and Weinan, groundwater stress is driven primarily by anthropogenic activities. By comparison, the interior of the Loess Plateau, such as Qingyang and Guyuan, is more vulnerable to the combined stress of climatic variability and groundwater abstraction.

4.2. Drivers of Groundwater Storage Change

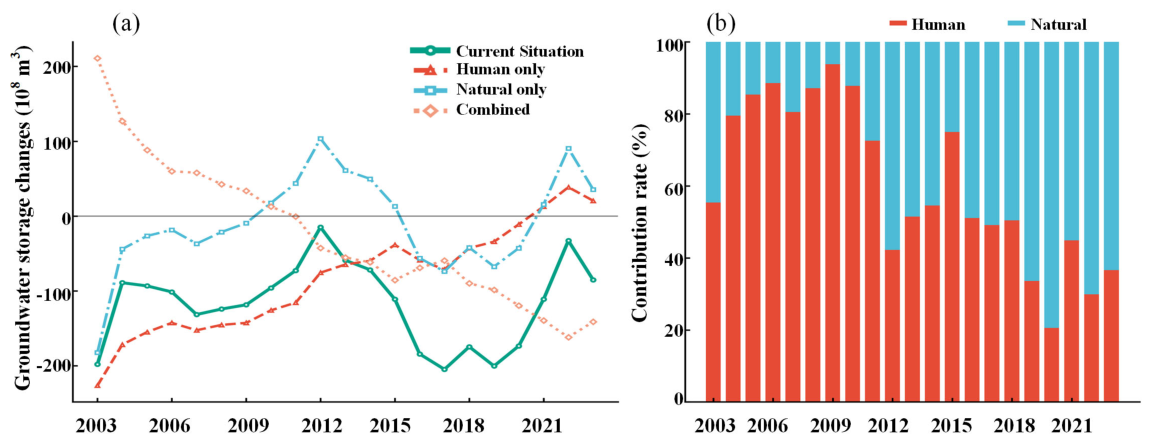
Based on Equations (7) and (8), this study quantified the contributions of natural climatic factors and human activities to groundwater storage change (Figure 11). The results show that, in most years from 2003 to 2023, human activities were the dominant driver of the continued decline in groundwater storage in the Wei River Basin, contributing the largest share in most years. In particular, from 2005–2010, the contribution of human activities exceeded 80%, which is closely related to the rapid expansion of agricultural irrigation and the sharp increase in groundwater pumping during the industrialization process. This finding supports the hypothesis that human-induced forcing dominates regional reserve evolution and is highly consistent with the attribution analyses by Chen et al. [29] and Wu et al. [30] regarding how irrigation water demand exacerbates groundwater depletion.
The contribution of human activities, primarily groundwater abstraction, increased markedly during 2010–2016, coinciding with the expansion of irrigation demand and the acceleration of urbanization. Although human activities dominated the system, climate variability, especially reduced precipitation and increased evapotranspiration, provided the background conditions for groundwater fluctuation. The trend line on the left side of Figure 11 shows that the natural-only component increased around 2010, consistent with higher precipitation during that period, which partially slowed the rate of groundwater depletion. However, this natural recovery signal was often masked by intensive human impacts. Only after 2018, when the contribution of human activities declined, did the positive effect of natural recharge become visible in the current-situation groundwater storage trend. This method of quantitatively separating natural fluctuations from human-induced disturbances examines the vulnerability and restoration potential of the groundwater system in the Wei River Basin across as broad a range of contexts as possible, providing a reference for attribution studies of similarly affected watersheds worldwide [30,31].

4.3. Limitations and Outlook

The NGSM model developed in this study enabled a downscaled reconstruction of groundwater storage in the Wei River Basin from 1.00° to 0.05°. The calibration-period performance metrics, with an NSE of 0.65 and an RMSE of 4.78 cm EWH, indicate that the model is well suited to the complex topographic and hydrogeologic conditions of the basin. Although a small number of departures occur in the extreme range of storage change, these discrepancies likely reflect aquifer heterogeneity associated with the Loess Plateau landforms and the strong spatial localization of human activities. This mirrors the challenges faced by the physical–statistical fusion framework proposed by Pellet et al. [20], namely that simplifying models to characterize nonlinear responses still requires further refinement. The sensitivity analysis further confirms that the regional groundwater flow regime exerts decisive control on model accuracy, suggesting that future high-resolution modeling should incorporate more accurate groundwater-level observations to improve parameter calibration.
Although this study effectively removed the sediment-loss interference specific to the Loess Plateau by introducing the sediment-mass correction term, several limitations remain. First, the estimates of groundwater abstraction rely mainly on statistics reported in water resources bulletins, and their spatial allocation is constrained by administrative boundaries. Accordingly, the anthropogenic forcing was derived from these administrative extraction statistics and uniformly downscaled to the grid scale, which may smooth local depletion near concentrated pumping areas. Therefore, the human contribution estimated in this study should be interpreted at the basin scale under the adopted downscaling assumption. Second, the spatiotemporal coverage of monitoring-well data is insufficient, as observations are available only from 2021–2023, which limits independent point-scale validation of long-term dynamics. To overcome this limitation, our study employs the GRACE/GRACE-FO-retrieved GWSC as the basin-wide, full-period validation benchmark, which constitutes the central methodological advance of this work and compensates for the short well record. Third, the single-layer assumption smooths localized hydraulic responses in deep confined aquifers, particularly in intensive pumping areas such as Qingyang and Weinan, thereby affecting the simulated depletion rates and spatial heads. Consequently, the simulated groundwater storage changes should be interpreted as integrated regional responses rather than detailed groundwater-level variations of individual aquifer units. Future work should integrate higher-precision satellite products, such as GRACE-FO, with ground-based monitoring networks, couple the model with dynamic feedback from human activities, and improve temporal resolution from monthly to daily scales. These developments would further enhance the model’s capacity for fine-scale simulation and provide stronger scientific support for sustainable water-resources management in the Loess Plateau.

5. Conclusions

A dynamic downscaling model for groundwater storage in the Wei River Basin was successfully developed by integrating GRACE satellite gravity data, surface hydrologic observations, and soil properties. Using Darcy’s law and the water-balance principle, the model downscaled the original 1.00° resolution to 0.05°. After downscaling, the simulated and observed values showed a significant correlation (r = 0.73, RMSE = 4.78 cm EWH), demonstrating that the model effectively captures the spatial heterogeneity of groundwater storage in the basin. The simulated results represent integrated groundwater storage responses at the basin scale and should therefore be interpreted as regional groundwater variations rather than detailed hydraulic-head changes of individual wells or aquifer units.
From 2003 to 2023, groundwater storage in the Wei River Basin showed a pronounced declining trend, with an average annual decrease of 55.89 × 10⁸ m3. Spatially, the decline follows a west-to-east decreasing gradient along the main river channel. The overexploitation zones in the middle and lower reaches largely coincide with urban agglomerations, and the basin exhibits strong seasonal fluctuations. Intra-annual variation is jointly controlled by precipitation recharge and groundwater abstraction; water levels rise during the flood season, whereas evapotranspiration and pumping dominate discharge during the non-flood season.
Human activities are the dominant driver of groundwater storage change. The results show that, from 2003 to 2023, the contribution of human activities to groundwater storage change exceeded 50% in most years, and even surpassed 80% during 2005–2010, far exceeding the contribution of natural climatic factors such as precipitation and evapotranspiration. Although increased precipitation after 2010 partially slowed the depletion rate, groundwater abstraction associated with agricultural irrigation and urbanization remained the primary cause of storage decline.


Author Contributions

Conceptualization, X.W. and L.H.; methodology, X.W. and L.H.; software, X.W., J.Z., and Z.Z.; validation, X.W., L.H., and J.S.; formal analysis, X.W. and L.H.; investigation, X.W., S.L., and J.S.; resources, S.L., J.Z., and Z.Z.; data curation, X.W., S.L., and J.Z.; writing—original draft preparation, X.W., J.S., and L.H.; writing—review and editing, X.W., L.H., and J.S.; visualization, J.S., J.Z., and Z.Z.; supervision, L.H.; project administration, L.H.; funding acquisition, L.H. All authors have read and agreed to the published version of the manuscript.

Funding

This study was supported by the National Natural Science Foundation of China (Grant number: U2167211).

Data Availability Statement

This study provides the model program and input data files as well as the downscaled GWSA datasets, which can be downloaded from https://doi.org/10.6084/m9.figshare.33350607 (uploaded on 27 August 2026) or are available from the first author upon request.

Conflicts of Interest

Author Shengjie Liu was employed by the company Gansu Water Investment Group Co., Ltd. The remaining authors declare that the research was conducted in the absence of any commercial or financial relationships that could be construed as a potential conflict of interest.

Abbreviations

The following abbreviations are used in this manuscript:
GRACEGravity Recovery and Climate Experiment
TWSCTerrestrial Water Storage Changes
GWSGroundwater Storage
GWSCGroundwater Storage Changes
GLDASGlobal Land Data Assimilation System
CLSMCatchment Land Surface Model
NGSMNest-based Groundwater Storage Model
MOATMorris One-At-a-Time
EWHEquivalent Water Height
RMSERoot Mean Square Error
NSENash-Sutcliffe efficiency coefficient
AETActual Evapotranspiration
GWDGroundwater Depth

Appendix A

Figure A1. Schematic diagram of the model grid system and zonation of parameters.
Remotesensing 18 03013 g0a1
Table A1. Optimal parameters of each zone.
Optimal ParameterZone I Zone IIZone IIIZone IVZone VZone VI
T 6200.731002.581001.98107.88395.50509.59
S y 9.98 × 10−61.68 × 10−62.76 × 10−61.70 × 10−61.95 × 10−61.06 × 10−6
α 0.100.250.330.100.370.22
β 0.700.550.170.890.290.45
Chydro4.60 × 10−35.10 × 10−35.20 × 10−38.70 × 10−31.10 × 10−31.10 × 10⁻³

References

  1. The United Nations Educational Scientific and Cultural Organization (UNESCO). The United Nations World Water Development Report 2022: Groundwater: Making the Invisible Visible; UNESCO: Paris, France, 2022; ISBN 978-92-3-100507-7. [Google Scholar]
  2. Qu, J.; Qin, C.; Wang, H.; Zhao, Y.; He, F.; Guan, Z.; Chang, H.; Shi, L. Water stress evolution and redistribution pathways under global inequality in consumption. Water Res. 2025, 291, 125112. [Google Scholar] [CrossRef] [Scilit]
  3. Yin, W.; Han, S.-C.; Zheng, W.; Yeo, I.-Y.; Hu, L.; Tangdamrongsub, N.; Ghobadi-Far, K. Improved water storage estimates within the North China Plain by assimilating GRACE data into the CABLE model. J. Hydrol. 2020, 590, 125348. [Google Scholar] [CrossRef] [Scilit]
  4. Steward, D.R.; Peterson, J.M.; Yang, X.; Bulatewicz, T.; Herrera-Rodriguez, M.; Mao, D.; Hendricks, N. Groundwater economics: An object-oriented foundation for integrated studies of irrigated agricultural systems. Water Resour. Res. 2009, 45, W05701. [Google Scholar] [CrossRef] [Scilit]
  5. Chen, J.; Cazenave, A.; Dahle, C.; Llovel, W.; Panet, I.; Pfeffer, J.; Moreira, L. Applications and Challenges of GRACE and GRACE Follow-On Satellite Gravimetry. Surv. Geophys. 2022, 43, 305–345. [Google Scholar] [CrossRef] [Scilit]
  6. Raza, A.; Ryo, M.; Ghazaryan, G.; Baatz, R.; Inforsato, L.; Nendel, C. Using spatially explicit machine learning to enhance assessment of the Global Gravity-based Groundwater Product for groundwater storage change in Germany. J. Hydrol. Reg. Stud. 2026, 65, 103363. [Google Scholar] [CrossRef] [Scilit]
  7. Rodell, M.; Famiglietti, J.S.; Wiese, D.N.; Reager, J.T.; Beaudoing, H.K.; Landerer, F.W.; Lo, M.-H. Emerging trends in global freshwater availability. Nature 2018, 557, 651–659. [Google Scholar] [CrossRef] [Scilit]
  8. Khalaj, M.R.; Noor, H.; Sharif, M.A. A machine learning framework for downscaling and predicting groundwater levels using random forest and satellite data: A case study in Iran. Hydrogeol. J. 2026, 34, 591–605. [Google Scholar] [CrossRef] [Scilit]
  9. Deng, X.; Wang, G.; Han, F.; Gong, Y.; Hao, X.; Zhang, G.; Zhang, P.; Shan, Q. Groundwater storage anomalies projection by optimized deep learning refines groundwater management in typical arid basins. J. Hydrol. 2025, 649, 132452. [Google Scholar] [CrossRef] [Scilit]
  10. Youssefi, F.; Ali, S.; Khorrami, B.; Khan, M.M.; Jehanzaib, M.; Mahmood, T.; Han, Z.; Wu, H.; Faisal, M. Bridging the resolution gap: Machine learning for local-scale groundwater drought monitoring in Punjab, Pakistan. Groundw. Sustain. Dev. 2025, 31, 101545. [Google Scholar] [CrossRef] [Scilit]
  11. Khan, A.H.; Rahman, K.U.; Ejaz, N.; Ali, M.Z.; Jadoon, K.Z.; Mao, D.; Shang, S. Understanding groundwater dynamics of the depleted aquifer in the Indus Basin based on the downscaled GRACE data and groundwater modelling. J. Hydrol. Reg. Stud. 2026, 64, 103278. [Google Scholar] [CrossRef] [Scilit]
  12. Solovey, T.; Bronowicz, J.Ś.; Janica, R.; Stradczuk, A.; Brzezińska, A. Temporal and spatial variability of groundwater storage derived from downscaled GRACE data in the transboundary Bug River Basin. Sci. Total Environ. 2025, 1009, 181023. [Google Scholar] [CrossRef] [Scilit]
  13. Xiong, Y.; Liang, J.; Feng, W. Evaluating terrestrial water storage, fluxes, and drivers in the Pearl River Basin from downscaled GRACE/GFO and hydrometeorological data. Remote Sens. 2025, 17, 3816. [Google Scholar] [CrossRef] [Scilit]
  14. Chahal, M.; Kalu, I.; Adeyeri, O.E.; Majumdar, S.; Helfer, F.; Ndehedehe, C. Machine learning downscaling of GRACE satellite data for local-scale water storage assessment in South-East Queensland, Australia. Geomatica 2026, 78, 100094. [Google Scholar] [CrossRef] [Scilit]
  15. Li, Y.; Zhong, X.; Gong, H.; Chen, B.; Zhou, C.; Li, H.; Wang, X.; Xu, L. Spatiotemporal evolution and attribution analysis of groundwater drought in the North China Plain. J. Hydrol. Reg. Stud. 2026, 63, 103103. [Google Scholar] [CrossRef] [Scilit]
  16. Hu, Y.; Cai, X.; Xu, Y.P.; Gu, H.; Xie, J.; Dai, S. A semi-supervised LSTM framework for spatiotemporal downscaling of GRACE-derived terrestrial water storage anomalies. J. Hydrol. 2026, 671, 135275. [Google Scholar] [CrossRef] [Scilit]
  17. Adam, M.A.; Enslin, S.E.S.; Ali, K.A. Application of random forest modeling to evaluate groundwater storage changes in the Breede Water Management Area, South Africa. Hydrogeol. J. 2026, 34, 1339–1354. [Google Scholar] [CrossRef] [Scilit]
  18. Chen, R.; Huang, X.; Onn, C.C.; Jian, F.; Hou, Y.; Lu, C. Groundwater storage variations in the Huadian photovoltaic base of the Tengger Desert based on machine learning-downscaled GRACE data. Water 2026, 18, 781. [Google Scholar] [CrossRef] [Scilit]
  19. Ghaffari, Z.; Awawdeh, A.R.; Easson, G.; Yarbrough, L.D.; Heintzman, L.J. Evaluating an ensemble-based machine learning approach for groundwater dynamics by downscaling GRACE data. Limnol. Rev. 2025, 25, 39. [Google Scholar] [CrossRef] [Scilit]
  20. Pellet, V.; Aires, F.; Alfieri, L.; Bruno, G. A physical/statistical data-fusion for the dynamical downscaling of GRACE data at daily and 1 km resolution. J. Hydrol. 2024, 628, 130565. [Google Scholar] [CrossRef] [Scilit]
  21. Sun, J.; Hu, L.; Cao, X.; Liu, D.; Liu, X.; Sun, K. A dynamical downscaling method of groundwater storage changes using GRACE data. J. Hydrol. Reg. Stud. 2023, 50, 101558. [Google Scholar] [CrossRef] [Scilit]
  22. Sun, J.; Hu, L.; Chen, F.; Sun, K.; Yu, L.; Liu, X. Downscaling simulation of groundwater storage in the Beijing, Tianjin, and Hebei regions of China based on GRACE data. Remote Sens. 2023, 15, 1490. [Google Scholar] [CrossRef] [Scilit]
  23. Tangdamrongsub, N.; Dong, J.; Shellito, P. Assessing performances of multivariate data assimilation algorithms with SMOS, SMAP, and GRACE Observations. Water 2022, 14, 621. [Google Scholar] [CrossRef] [Scilit]
  24. Tangdamrongsub, N.; Han, S.-C.; Yeo, I.-Y.; Dong, J.; Steele-Dunne, S.C.; Willgoose, G.; Walker, J.P. Multivariate data assimilation of GRACE, SMOS, SMAP measurements for improved regional soil moisture. Adv. Water Resour. 2020, 135, 103477. [Google Scholar] [CrossRef] [Scilit]
  25. Tangdamrongsub, N.; Han, S.-C.; Tian, S.; Schmied, H.M.; Sutanudjaja, E.H.; Ran, J.; Feng, W. Evaluation of groundwater storage variations estimated from GRACE data assimilation. Remote Sens. 2018, 10, 483. [Google Scholar] [CrossRef] [Scilit]
  26. Li, B.; Rodell, M.; Kumar, S.V.; Beaudoing, H.K.; Getirana, A.; Zaitchik, B.F.; de Goncalves, L.G.; Cossetin, C. Global GRACE data assimilation for groundwater and drought monitoring: Advances and challenges. Water Resour. Res. 2019, 55, 7564–7586. [Google Scholar] [CrossRef] [Scilit]
  27. Wang, Z.; Wang, J.; Yu, D.; Chen, K. Groundwater potential assessment using GIS-based ensemble learning models in Guanzhong Basin, China. Environ. Monit. Assess. 2023, 195, 690. [Google Scholar] [CrossRef] [Scilit]
  28. Wu, X.J.; Li, H.E.; Dong, Y. The study on distribution characteristics of water resources in Guanzhong region of Weihe River. Appl. Mech. Mater. 2012, 212–213, 531–535. [Google Scholar] [CrossRef] [Scilit]
  29. Chen, H.; Fan, L.; Li, Q.; Wang, Y.; Liu, D.; Zhao, F. Future climate change exacerbates streamflow depletion in the Wei River Basin, China. J. Hydrol. 2025, 663, 134146. [Google Scholar] [CrossRef] [Scilit]
  30. Wu, M.; Liu, P.; Lei, X.; Liao, W.; Cai, S.; Xia, Q.; Zou, K.; Wang, H. Impact of surface and underground water uses on streamflow in the upper-middle of the Weihe River basin. J. Hydrol. 2023, 616, 128840. [Google Scholar] [CrossRef] [Scilit]
  31. Wei, Z.; Wan, X. Spatial and temporal characteristics of NDVI in the Weihe River Basin and its correlation with terrestrial water storage. Remote Sens. 2022, 14, 5532. [Google Scholar] [CrossRef] [Scilit]
  32. Liu, S.; Huang, S.; Xie, Y.; Huang, Q.; Leng, G.; Hou, B.; Zhang, Y.; Wei, X. Spatial-temporal changes of maximum and minimum temperatures in the Wei River Basin, China: Changing patterns, causes and implications. Atmos. Res. 2018, 204, 1–11. [Google Scholar] [CrossRef] [Scilit]
  33. Morris, M.D. Factorial sampling plans for preliminary computational experiments. Technometrics 1991, 33, 161–174. [Google Scholar] [CrossRef]
  34. Wang, C.; Duan, Q.; Tong, C.H.; Di, Z.; Gong, W. A GUI platform for uncertainty quantification of complex dynamical models. Environ. Model. Softw. 2016, 76, 1–12. [Google Scholar] [CrossRef] [Scilit]
  35. Famiglietti, J.S.; Lo, M.; Ho, S.L.; Bethune, J.; Anderson, K.J.; Syed, T.H.; Swenson, S.C.; Linage, C.R.d.; Rodell, M. Satellites measure recent rates of groundwater depletion in California’s Central Valley. Geophys. Res. Lett. 2011, 38, L03403. [Google Scholar] [CrossRef] [Scilit]
  36. Ding, Y.; Peng, S. Spatiotemporal trends and attribution of drought across China from 1901–2100. Sustainability 2020, 12, 477. [Google Scholar] [CrossRef] [Scilit]
Figure 1. Map of study area.
Remotesensing 18 03013 g001
Figure 2. Flowchart of model construction.
Remotesensing 18 03013 g002
Figure 3. Schematic figure of model development. (a) grid properties; (b) plain view of grids; (c) water balance for a grid.
Remotesensing 18 03013 g003
Figure 4. Change of sediment discharges in different districts from 2003 to 2023.
Remotesensing 18 03013 g004
Figure 5. Parameter zonation of the study area.
Remotesensing 18 03013 g005
Figure 6. Kernel density Distribution of GRACE-derived and simulated groundwater storage changes from 2003 to 2023.
Remotesensing 18 03013 g006
Figure 7. Comparison of GRACE-derived and simulated groundwater storage changes in the study area from 2003 to 2023.
Remotesensing 18 03013 g007
Figure 8. Comparison of simulated groundwater storage changes with field observation data in the study area from 2021 to 2023. (a) Distribution of observation wells; (bd) represents comparison of simulated GWSC with well data in three wells, respectively.
Remotesensing 18 03013 g008
Figure 9. Comparison of downscaled yearly average groundwater storage changes with GRACE-derived data in the Wei River Basin from 2003 to 2023. (a) before the downscaling; (b) after the downscaling. Zone A, B, C, D, E, F, G, H, I, J, K represent Dingxi, Tianshui, Pingliang, Guyuan, Qingyang, Yan’an, Baoji, Xi’an, Xianyang, Yinchuan and Weinan, respectively.
Remotesensing 18 03013 g009
Figure 10. Comparison of changing rate of simulated groundwater imbalance with water balance estimation in the different districts from 2003 to 2023. (a) groundwater imbalance from 2003–2023; (b) groundwater imbalance from 2013–2023. Zone A, B, C, D, E, F, G, H, I, J, K represent Dingxi, Tianshui, Pingliang, Guyuan, Qingyang, Yan’an, Baoji, Xi’an, Xianyang, Yinchuan and Weinan, respectively.
Remotesensing 18 03013 g010
Figure 11. Contribution rate of human-induced and natural causes in the study area from 2003 to 2023. (a) groundwater storage changes under human-induced and natural causes with time; (b) contribution rate of human-induced and natural causes.
Remotesensing 18 03013 g011
Table 1. Data used in the study.
Data TypeSourcesSpatial ResolutionTime ScaleTime Period
Terrestrial water storage changes (cm EWH)GRACE (CSR mascon)1.00°Monthly~2003–2023
GLDAS
(kg/m2)
NOAH V2.101.00°Monthly~2003–2023
CLSM V2.200.25°Daily~2003–2023
Precipitation
(mm)
PENG0.01°Monthly~2003–2023
Actual Evapotranspiration
(mm)
USGS SSEBopV50.05°Monthly~2003–2022
USGS SSEBopV60.05°Monthly~2012–2023
Groundwater level data (m)National observation wellsMonthly~2021–2023
Sediment dischargesProvincial Water Resources BulletinMonthly2003–2023
Groundwater withdrawalsProvincial Water Resources BulletinYearly2003–2023
Potential Evapotranspiration (mm)PENG0.01°Monthly~2003–2023
ERA50.25°Monthly~2003–2020
Disclaimer/Publisher’s Note: The statements, opinions and data contained in all publications are solely those of the individual author(s) and contributor(s) and not of MDPI and/or the editor(s). MDPI and/or the editor(s) disclaim responsibility for any injury to people or property resulting from any ideas, methods, instructions or products referred to in the content.