Article

DDEF-Net: A Difference-Guided Detail Enhancement Fusion Network for UAV-Based RGB-T Object Detection

1
Graduate School, PLA Rocket Force University of Engineering, Xi’an 710025, China
2
College of Operational Support, PLA Rocket Force University of Engineering, Xi’an 710025, China
*
Author to whom correspondence should be addressed.
Remote Sens. 2026, 18(17), 3032; https://doi.org/10.3390/rs18173032
Submission received: 5 August 2026 / Revised: 29 August 2026 / Accepted: 4 September 2026 / Published: 5 September 2026

Highlights

What are the main findings?
  • DDEF-Net improves mAP@0.5 from 81.4% to 84.9% and mAP@0.5:0.95 from 68.6% to 72.6% on the DroneVehicle dataset.
  • The completemodel achieves 72.6%mAP@0.5:0.95with 4.4Mparameters and 12.5 GFLOPs.
What are the implications of the main findings?
  • Discrepancy-aware calibration and spatial–frequency detail enhancement provide a compact fusion strategy for UAV-based visible–thermal object detection.
  • The method improves robustness to Gaussian blur and motion blur, although severe Gaussian noise remains challenging.

Abstract

This paper proposes a Difference-guided Detail Enhancement Fusion Network (DDEF-Net) for UAV-based RGB–thermal (RGB-T) object detection, which enables effective complementary exploitation of visible and infrared information in complex scenarios. A Difference-guided Kolmogorov–Arnold Network (KAN) Calibration Fusion module (DKCF) is designed to explicitly model cross-modal discrepancies and incorporate KAN-based nonlinear calibration, improving the selection of informative features and reducing redundant feature interference during multimodal fusion. Furthermore, a Scharr–Fourier Detail Enhancement module (SFDE) is introduced to jointly leverage Scharr edge priors and Fourier-domain information to strengthen low-level visible feature representations and preserve fine-grained structural cues. On the DroneVehicle dataset, DDEF-Net achieves 84.9% mAP@0.5 and 72.6% mAP@0.5:0.95, improving the RGB–IR baseline by 3.5 and 4.0 percentage points, respectively, with 4.4 M parameters and 12.5 GFLOPs. An additional experiment on the VEDAI visible–near-infrared (NIR) aerial dataset after dataset-specific training provides supplementary evidence that the proposed modules remain beneficial under a different paired multimodal imaging setting. Corruption experiments show improved robustness to Gaussian and motion blur, whereas the model remains sensitive to strong Gaussian noise.

1. Introduction

In recent years, with the rapid development of computer vision and deep learning technologies, object detection has become one of the fundamental tasks in intelligent remote sensing analysis and has been widely applied in autonomous driving, intelligent surveillance, and target search. In particular, unmanned aerial vehicle (UAV)-based remote sensing platforms have gradually become an important data source for fine-grained ground object detection due to their advantages of high mobility, flexible deployment, and diverse imaging perspectives. These platforms can acquire large-scale and time-sensitive surface information at relatively low costs.
However, compared with traditional ground-based or satellite remote sensing imagery, UAV aerial images exhibit more complex and unstructured characteristics, making object detection tasks considerably more challenging. Complex imaging conditions can significantly degrade image quality, resulting in the loss of object textures and edge information and consequently affecting the stability of feature representation. Meanwhile, UAV imagery typically contains a large proportion of small objects with limited pixel information, which further increases the difficulty of feature learning for detection models. Current detection approaches mainly rely on single imaging modalities. Visible images can provide rich color and texture information but are highly sensitive to illumination conditions during image acquisition. In contrast, infrared images are more robust to illumination variations but usually suffer from insufficient texture details and weak edge representations. Owing to the inherent complementarity between these two modalities, visible–infrared fusion methods have been widely investigated to improve UAV-based object detection performance.
Existing methods mainly employ strategies such as feature concatenation, weighted fusion, attention-guided fusion, and cross-modal interaction to integrate multimodal information, achieving improved detection performance to some extent. However, due to the different imaging mechanisms of visible and infrared sensors, the two modalities exhibit inherent discrepancies in feature distribution, response characteristics, and semantic representation. Direct feature fusion may introduce redundant information and modality conflicts, thereby limiting the effective utilization of complementary cross-modal information. Meanwhile, objects in UAV remote sensing images usually suffer from small scales, weak boundaries, and insufficient texture information. These fine-grained details are further degraded after repeated feature downsampling, making it difficult for existing fusion methods to simultaneously preserve global semantic information and local structural details.
To address the insufficient cross-modal information utilization and detail degradation issues in UAV-based RGB-T object detection, we propose a Difference-guided Detail Enhancement Fusion Network (DDEF-Net). The proposed framework achieves effective visible–infrared information fusion through cross-modal difference modeling and detail feature enhancement. Specifically, the Difference-guided KAN Calibration Fusion Module (DKCF) learns the discrepancy responses between different modalities and incorporates radial basis function-based Kolmogorov–Arnold Network (RBF-KAN) adaptive channel calibration [1,2] to improve the utilization of complementary information. Meanwhile, the Scharr–Fourier Detail Enhancement Module (SFDE) enhances low-level feature representations by jointly exploiting spatial gradient priors and frequency-domain information, alleviating the problems of weak boundaries and missing textures in UAV aerial scenarios. Experimental results demonstrate that the proposed method improves RGB–T detection accuracy while maintaining a compact model architecture. The proposed modules also improve performance under Gaussian and motion blur, although sensitivity to strong Gaussian noise remains.
The contributions of this article are as follows:
  • We formulate cross-modal discrepancy as an explicit calibration signal for RGB–thermal feature fusion. Rather than directly treating all RGB–IR differences as useful complementary information, DKCF summarizes the discrepancy responses at the channel level, maps them to adaptive nonlinear calibration weights, and selectively reinjects the calibrated discrepancy into the two modality streams.
  • We introduce a low-level spatial–frequency detail-enhancement formulation that jointly exploits fixed Scharr-gradient priors and learnable Fourier-domain representations. The two branches provide complementary structural cues and are integrated before multi-scale cross-modal fusion to strengthen low-level feature representation.
  • Experimental results on DroneVehicle demonstrate that DDEF-Net achieves 84.9% mAP@0.5 and 72.6% mAP@0.5:0.95 with 4.4 M parameters. A supplementary experiment on the VEDAI visible–NIR aerial dataset after dataset-specific training further examines the applicability of the proposed modules under a different paired multimodal imaging setting; this experiment is not intended as evidence of cross-dataset RGB-T generalization. Under synthetic image corruptions, the method improves detection performance under Gaussian and motion blur, but remains sensitive to strong Gaussian noise.

2. Related Work

2.1. Visible Object Detection

In recent years, significant progress has been achieved in visible object detection based on single-modal images. For example, SOO-YOLO enhances the perception capability of weak signals by introducing a reconstructed feature extraction strategy and a task-interactive detection head [3]. Swift-YOLO improves the representation ability of objects with different scales through adaptive multi-scale convolution and deformable mechanisms [4]. SCRDet++ addresses the challenges of arbitrary object orientations and severe background interference in remote sensing scenarios by incorporating spatial and channel decoupled attention mechanisms, thereby improving detection performance in complex environments [5]. Furthermore, with the rapid development of Transformer architectures, researchers have introduced global self-attention mechanisms into UAV object detection tasks. By combining convolutional neural networks (CNNs) with Transformer-based structures, these methods enhance the modeling capability of long-range dependencies and achieve promising performance in multi-scale object detection [6].
More recently, increasing attention has been devoted to preserving fine-grained structural information for small-object detection in UAV imagery. Wu et al. proposed ED-DETR, which separately extracts high-frequency texture and low-frequency structural information and further introduces edge-guided feature enhancement to improve the perception and localization of small aerial objects [7]. Similarly, EAGLE-DET employs adaptive high–low-frequency decomposition and edge-aware multi-scale enhancement to alleviate edge attenuation and detail loss during hierarchical feature propagation [8]. These studies demonstrate the importance of preserving shallow structural cues for UAV small-object detection. Nevertheless, they are designed for single-modal visible imagery and therefore do not address the complementary interaction between visible and infrared information.
Although the aforementioned methods have achieved promising performance in visible-light UAV object detection, their robustness remains considerably limited due to the strong dependence of visible imaging on environmental illumination conditions. In complex scenarios such as nighttime, rainy weather, and haze, visible images are prone to texture degradation, reduced object contrast, and loss of fine details. Therefore, relying solely on visible information is insufficient to meet the requirements of all-weather UAV object detection.

2.2. Infrared Object Detection

To improve object detection under complex environmental conditions, infrared imaging has gradually become an important information source for UAV-based object detection. Since infrared sensors can directly capture the thermal radiation emitted by objects and are insensitive to illumination variations, they provide inherent advantages in nighttime, low-light, and adverse weather scenarios. Consequently, increasing research efforts have been devoted to infrared object detection. For example, HMANet improves weak target detection performance by jointly exploiting spatial attention and frequency-domain modeling [9]. WSNet adopts a lightweight and efficient network architecture, significantly reducing computational costs while maintaining real-time inference capability for infrared small target detection [10]. SCTransNet combines convolutional networks with Transformer architectures to enhance global context modeling capability [11]. UIU-Net improves the feature representation of infrared weak targets through cross-layer information interaction and achieves promising detection performance in complex backgrounds [12].
Recent UAV infrared detectors have further focused on preserving weak target responses during hierarchical feature extraction. DNR-YOLO improves the YOLO11 architecture by strengthening shallow-feature propagation and boundary localization for infrared small objects under complex backgrounds [13]. SFCD-Det introduces a spatial–frequency collaborative architecture to preserve fragile thermal responses during early encoding and multi-scale aggregation [14]. These approaches improve the representation of weak and small infrared targets; however, infrared-only detection remains limited by insufficient texture and fine-grained structural information.
Overall, although existing infrared object detection methods have achieved certain progress in small object enhancement and weak signal representation, their capability in perceiving weak and small targets as well as their cross-scenario generalization ability still require further improvement, especially in highly complex background environments. The single infrared modality still suffers from inherent limitations in fine-grained detail representation and feature stability, making it difficult to satisfy the requirements of high-precision and robust detection in complex scenarios. Therefore, integrating complementary information from multiple modalities has become an effective strategy to overcome the limitations of individual sensors and achieve more reliable object perception.

2.3. Visible–Infrared Object Detection

The aforementioned studies demonstrate that single-modal object detection methods suffer from inherent limitations in practical applications, as visible and infrared modalities exhibit complementary advantages and disadvantages. Visible images contain rich color information and fine-grained texture details with relatively high spatial resolution. However, their imaging quality is highly dependent on illumination conditions, and the captured target features are prone to severe degradation or even complete loss under low-light or adverse weather conditions. In contrast, infrared sensors can capture thermal radiation information from objects and maintain relatively stable imaging performance under extremely weak or absent illumination, providing all-weather perception capabilities. Nevertheless, due to the inherent physical limitations of infrared sensors, infrared images generally suffer from low signal-to-noise ratios and poor contrast, while small targets are easily degraded into smooth bright spots, leading to confusion between targets and backgrounds [15]. In practical applications, UAV platforms are often required to perform all-weather detection tasks under extreme weather conditions and low-light environments. However, due to the inherent representation limitations of individual modalities, detection methods relying solely on visible or infrared information are vulnerable to severe feature degradation, resulting in significant performance drops in terms of robustness and detection accuracy. Therefore, visible–infrared multimodal object detection has gradually become an important research direction in the computer vision community. Meanwhile, the continuous release of high-quality visible–infrared benchmark datasets, such as KAIST [16], LLVIP [17], and DroneVehicle [18], has provided essential support for the development of multimodal object detection research.
To overcome the limitations of individual sensors and develop high-precision detection algorithms with all-weather perception capability, researchers have explored various network architectures and fusion strategies. For example, SuperYOLO jointly optimizes the target responses from infrared images and the high-resolution texture information from visible images, effectively improving the model’s ability to perceive small objects [19]. To address the dynamically changing reliability of different modalities under complex illumination conditions, recent studies have further introduced deep semantic priors and illumination-aware mechanisms. By constructing adaptive fusion weights, these methods dynamically adjust the contribution of different modalities. Such strategies effectively integrate global semantic information and local fine-grained details, improving the stability of cross-modal feature fusion under low-light, strong illumination, and adverse weather conditions, thereby alleviating modality imbalance caused by environmental variations [20,21].
In recent years, the development of state space models (SSMs) has provided new perspectives for modeling long-range dependencies in cross-modal feature interactions. In particular, the selective scanning mechanism introduced by the Mamba model maintains global modeling capability while reducing the quadratic complexity of traditional Transformers to linear complexity, making it increasingly applicable to multimodal crowd counting. Recent studies have incorporated Mamba into cross-modal feature interaction processes, effectively preserving long-range semantic correlations between different modalities while reducing computational costs, thereby providing a new solution for lightweight RGB-T object detection [22,23,24]. Furthermore, spatial misalignment and viewpoint discrepancies are common in UAV-based dual-sensor imaging. To alleviate this problem, MROS jointly models local spatial and global semantic information in the feature space, enabling cross-modal calibration under non-strict registration conditions and improving robustness to modality misalignment [25].
Recent studies have increasingly shifted from direct feature aggregation toward explicit cross-modal interaction and adaptive calibration. ICAFusion employs iterative dual cross-attention to capture complementary information, C 2 Former combines cross-modal attention with adaptive feature sampling for feature calibration, and DAMSDet introduces modality-aware query selection and deformable cross-attention to adaptively exploit complementary multispectral features [26,27,28].
For UAV-based RGB-T detection, increasing attention has also been paid to small-object representation and cross-modal misalignment. IM-CMDet combines intra-modal enhancement with difference-guided fusion, while CMAI-Det explicitly performs cross-modal alignment and adaptive interaction for unaligned drone imagery [29,30]. More recently, CrossWeaver addresses weakly aligned multispectral detection through shared-semantic learning, modality-conditioned deformation, and cross-hierarchical interaction, further demonstrating the importance of jointly considering modality consistency and complementarity [31].
Recent approaches have also explored alternative representations and condition-aware fusion. WaveMamba integrates wavelet decomposition with Mamba-based cross-modal interaction to exploit complementary frequency information, whereas the prompt-guided condition-aware dynamic fusion framework adaptively adjusts modality contributions according to imaging conditions [32,33].
Meanwhile, efficient and detail-preserving fusion has received growing attention. CrossModalNet combines convolutional interaction with bidirectional cross-modal attention, while CTFLS performs local cross-modal Transformer interaction on high-resolution features to better preserve fine-grained information for small-object detection [34,35]. Collectively, these studies indicate a clear trend toward adaptive cross-modal interaction, misalignment-aware fusion, and preservation of fine-grained information in RGB-T detection.

3. Materials and Methods

3.1. Overall Structure

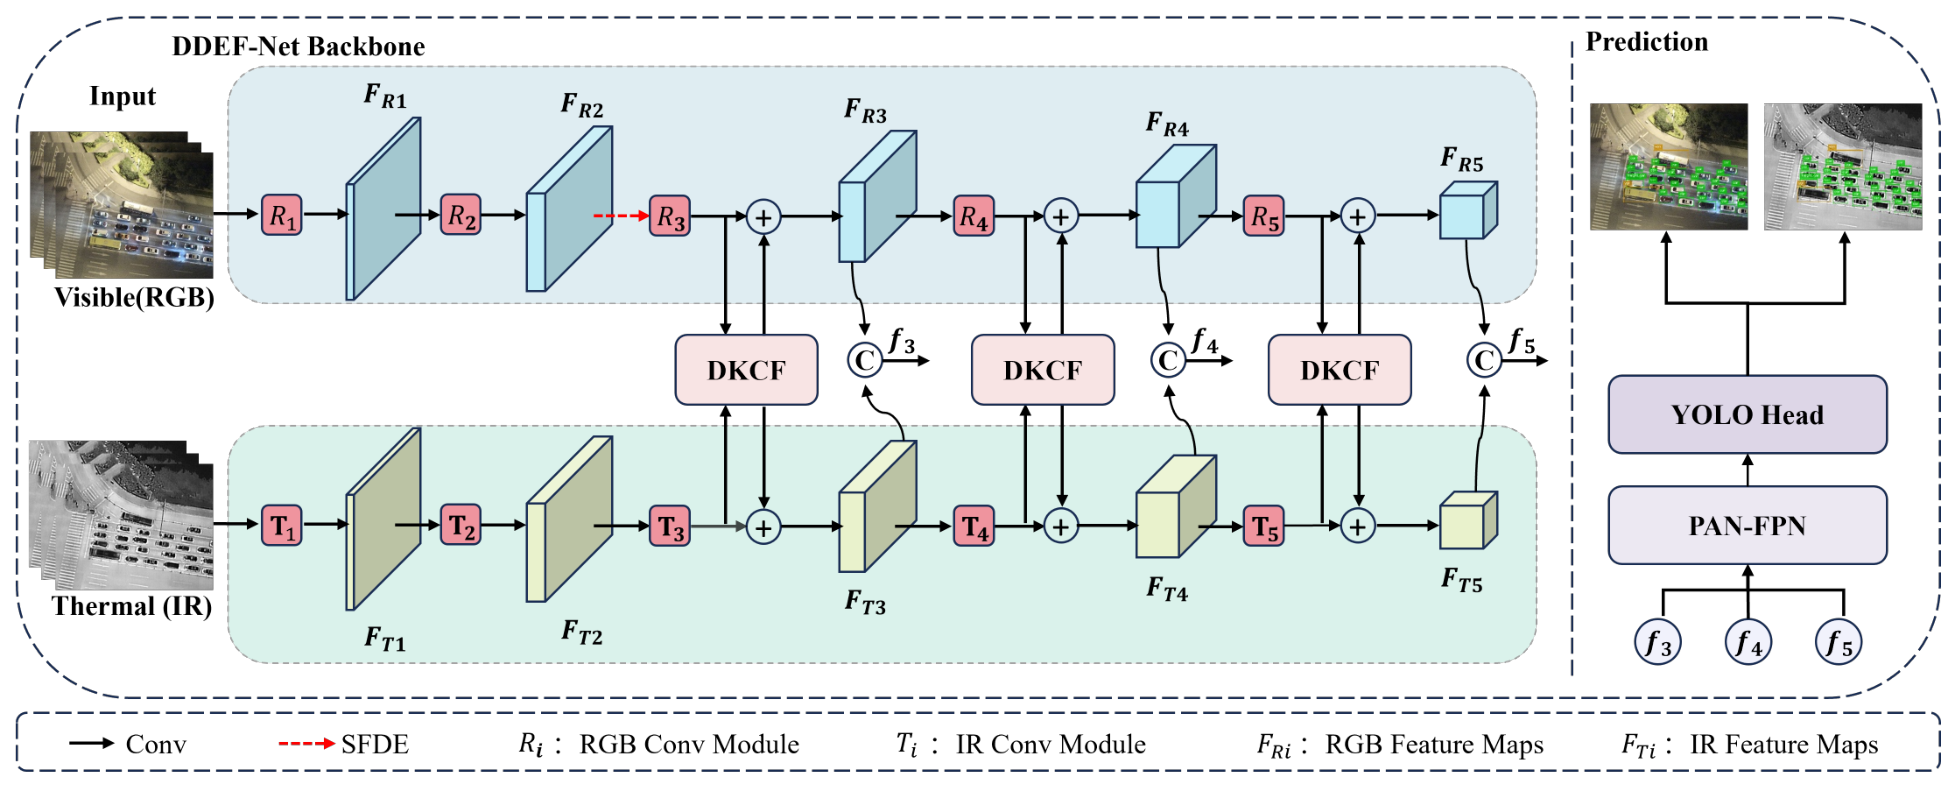
YOLO11n (nano) is adopted as the baseline detector because of its favorable trade-off between detection accuracy and computational efficiency [36]. Based on the YOLO11n framework, we propose DDEF-Net to enhance the object detection capability of UAV platforms in complex scenarios. The overall architecture of the proposed network is illustrated in Figure 1.
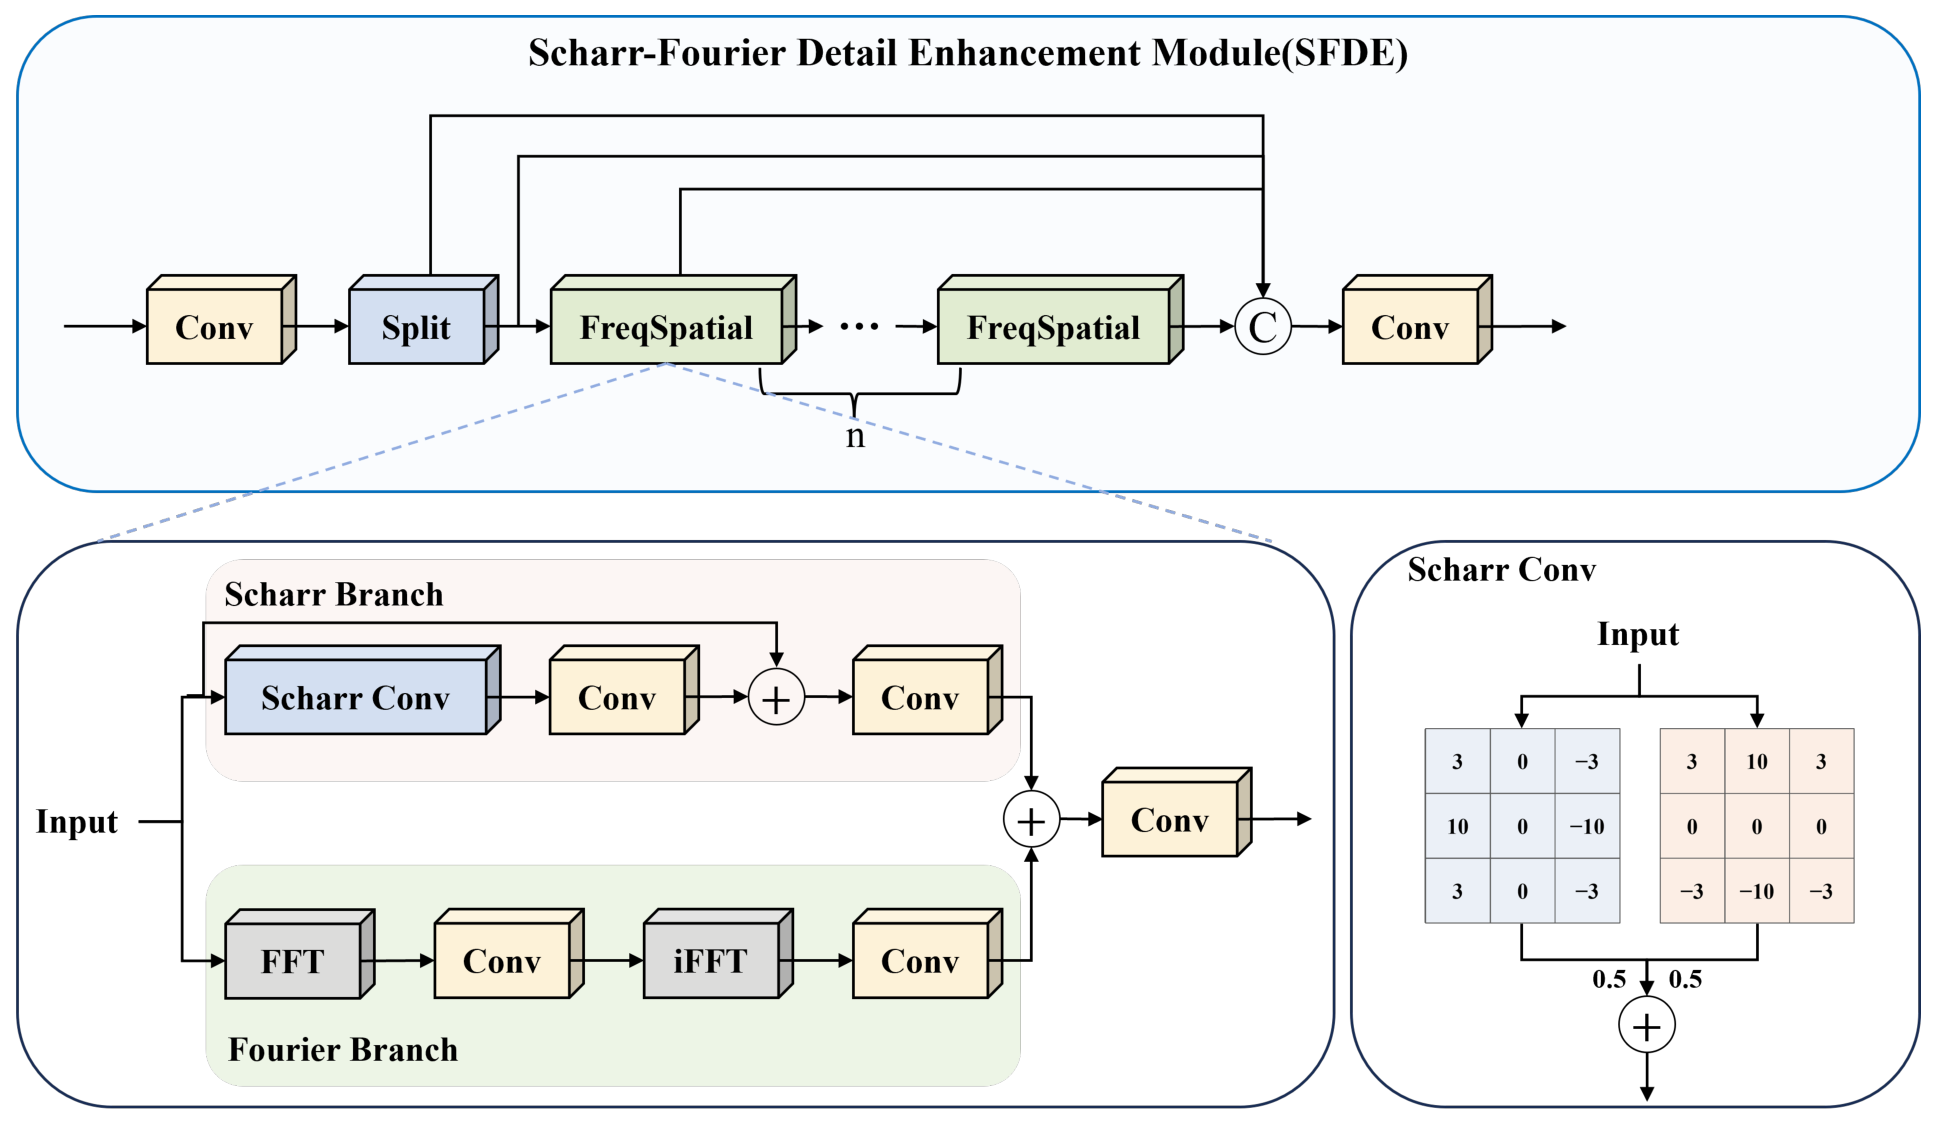
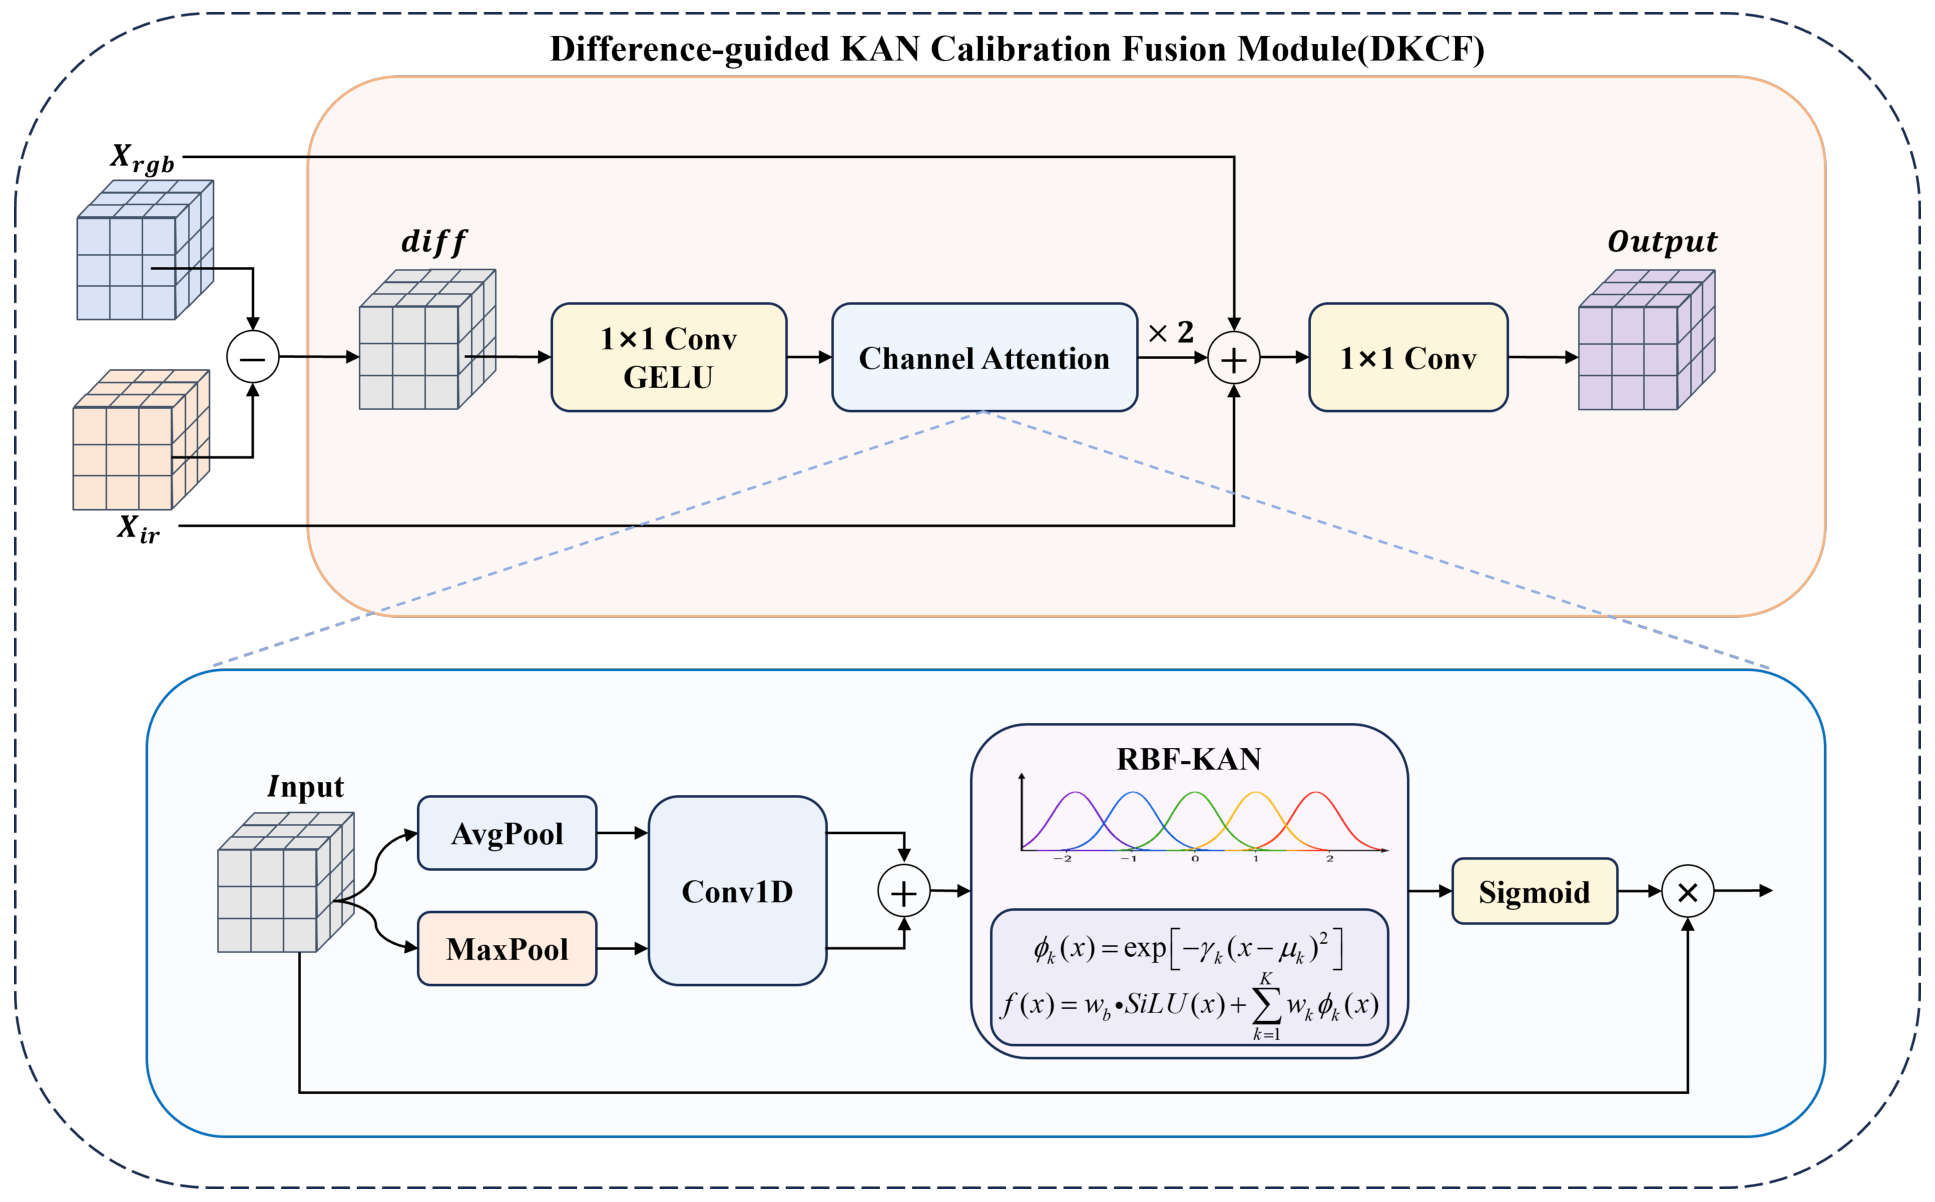
First, the proposed model adopts a dual-branch YOLO11n architecture to extract features from visible and infrared images separately, obtaining multi-scale bimodal feature representations. The SFDE module is introduced into the P 2 layer of the visible branch. The detailed structure of the SFDE module is illustrated in Figure 2. By exploiting the Scharr operator to enhance edge contours and local structural information, and incorporating Fourier frequency-domain modeling to learn complementary frequency-domain structural representations, the SFDE module enhances low-level edge, contour, and frequency-domain structural representations. Subsequently, the DKCF modules are introduced into the P 3 , P 4 , and P 5 feature levels. Through cross-modal discrepancy modeling and RBF-KAN-based nonlinear channel calibration, which maps channel-wise discrepancy descriptors to adaptive calibration weights, the DKCF module selectively emphasizes informative cross-modal discrepancies while suppressing redundant or less informative responses, thereby achieving more effective bimodal feature fusion. The detailed structure of the DKCF module is shown in Figure 3.
It should be noted that the proposed SFDE and DKCF modules only optimize the feature extraction and feature fusion processes of YOLO11n, without modifying its overall detection pipeline. Therefore, the original detection head, loss function, and training strategy of YOLO11n are retained. While maintaining a lightweight design and high inference efficiency, the proposed method improves UAV-based bimodal object detection in complex environments.

3.2. SFDE Module

Low-level features mainly contain edge, texture, contour, and local structural information, which provide essential foundations for subsequent object localization and small object recognition. In UAV aerial imagery, low-level structural information can be degraded by multiple factors, including illumination variations and shadows, motion or defocus blur, sensor noise, atmospheric interference, and lossy compression artifacts. Illumination-related degradation and motion blur are particularly relevant to UAV imaging because of changing acquisition conditions and platform or target motion, while sensor noise may become more pronounced under low-light conditions. Although existing convolutional architectures can extract texture features by exploiting local receptive fields, their edge feature modeling capability lacks explicit structural priors. Meanwhile, conventional spatial convolutions mainly focus on local neighborhood responses and have limited ability to exploit image frequency-domain structures. To address these issues, we propose the SFDE module. As illustrated in Figure 2, the proposed module consists of two branches: the Scharr branch explicitly introduces gradient structural priors, while the Fourier branch jointly models the real and imaginary components of features. By enhancing visible low-level representations from both spatial edge and frequency-domain perspectives, the SFDE module improves the model’s capability to capture fine-grained structural information.
Compared with conventional convolution kernels, the Scharr operator has explicit edge detection characteristics and can enhance regions with significant local response variations. Therefore, the Scharr operator is employed to extract gradient responses in the horizontal and vertical directions. The Scharr convolution kernels adopted in this work are defined as:
K x = 3 0 3 10 0 10 3 0 3
K y = 3 10 3 0 0 0 3 10 3
where K x and K y represent the Scharr convolution kernels in the horizontal and vertical directions, respectively.
For the input feature X from the P 2 layer of the visible branch, the horizontal and vertical gradient responses are calculated as:
G x = K x X
G y = K y X
Subsequently, the signed horizontal and vertical gradient responses are averaged with equal weights to obtain the directional edge response E:
E = 1 2 G x + 1 2 G y
The current implementation adopts signed directional fusion rather than gradient-magnitude aggregation. Although horizontal and vertical responses with opposite signs may partially attenuate each other under this formulation, the signed response preserves the polarity of directional gradients. To examine whether such potential cancellation adversely affects detection performance, we further compare signed averaging with absolute-response averaging and gradient-magnitude fusion in Section 4.4.2.
In the implementation, the Scharr convolution is performed using group convolution, where each channel independently conducts gradient computation. This strategy avoids interference among edge responses from different channels and allows each channel to preserve its own detailed variations. Meanwhile, the Scharr kernels are set as fixed weights without participating in back-propagation updates, thereby introducing negligible additional learnable parameters.
After obtaining the edge detail feature E, the module further performs feature reconstruction through convolution and introduces the original input feature using a residual connection:
F s = ϕ s 2 ( ϕ s 1 ( E ) + X )
where ϕ s 1 ( · ) and ϕ s 2 ( · ) denote the two convolutional mappings in the spatial branch, respectively.
Spatial convolution mainly models local neighborhood information. To complement the spatial representation, the Fourier branch transforms the input feature into the frequency domain and learns the interactions between the real and imaginary components. In the implementation, the Fast Fourier Transform (FFT)-related operations are performed in FP32 for numerical stability, whereas the convolutional mappings retain the original feature data type.
For an input feature X R B × C × H × W , the real-valued two-dimensional Fourier transform is first computed as
F = rFFT2 Cast FP 32 ( X ) ; norm = ortho ,
where F C B × C × H × ( W / 2 + 1 ) denotes the non-redundant complex spectrum. No frequency-shift operation is applied in the implementation.
The real and imaginary components are concatenated along the channel dimension:
F cat = Concat c Re ( F ) , Im ( F ) .
A 3 × 3 convolutional block is then employed to learn frequency-domain representations:
F ˜ cat = ϕ f 1 3 × 3 F cat ,
where ϕ f 1 3 × 3 ( · ) maps the 2 C -channel concatenated representation to another 2 C -channel representation.
The mapped feature is subsequently divided into real and imaginary parts:
F ˜ Re , F ˜ Im = Split c F ˜ cat ,
and the complex spectrum is reconstructed as
F ˜ = F ˜ Re + j F ˜ Im ,
where j denotes the imaginary unit.
The reconstructed spectrum is transformed back to the spatial domain using
X f = irFFT2 F ˜ ; s = ( H , W ) , norm = ortho .
A second 3 × 3 convolutional block is used to obtain the Fourier-branch feature:
F f = ϕ f 2 3 × 3 ( X f ) .
Finally, the spatial and Fourier representations are added and processed by a 1 × 1 convolutional block:
F FS = ϕ o 1 × 1 F s + F f ,
where F FS denotes the output of one spatial–frequency enhancement unit.
To maintain the lightweight characteristic of the network and ensure stable gradient propagation, the SFDE module is embedded into the C2f structure of YOLO11, replacing the standard Bottleneck units used in the original C2f implementation [36]. Given the input feature, it is first processed by the initial convolution and then divided into two feature groups:
X 1 , X 2 = S p l i t ( ϕ c 1 ( X ) )
The second feature group is sequentially processed by n spatial–frequency enhancement units:
Y 0 = X 2 , Y k = FreqSpatial ( Y k 1 ) , k = 1 , , n .
where Y k denotes the output of the k-th spatial–frequency enhancement unit.
Finally, the features from different stages are concatenated and processed through the output convolution to obtain the enhanced feature representation:
Y o u t = ϕ c 2 ( C o n c a t [ X 1 , X 2 , Y 1 , , Y n ] )
where Y o u t represents the low-level detail-enhanced feature generated by the C2f-SFDE structure. This embedding strategy preserves the feature reuse advantage of the original C2f structure while introducing the Scharr edge prior and Fourier frequency-domain reconstruction capabilities into the low-level feature extraction process. Compared with directly stacking complex attention modules in the backbone network, the SFDE module has a more specific objective, namely enhancing the detail representation of visible images at low levels rather than performing high-level semantic selection. Therefore, deploying the SFDE module at the P 2 stage better matches its functional characteristics and also helps control the overall model complexity.

3.3. DKCF Module

Due to the different imaging mechanisms of visible and infrared modalities, significant discrepancies exist in their feature distributions, response intensities, and spatial representations. Directly applying feature concatenation or simple element-wise addition for feature fusion may lead to redundant information, noise interference, and insufficient exploitation of complementary characteristics. To address these issues, we propose the DKCF module. As illustrated in Figure 3, the proposed module utilizes the difference features between the two modalities as guidance and consists of three sequential stages: explicit difference modeling, RBF-KAN-based nonlinear channel calibration [1,2], and residual fusion. Here, nonlinear channel calibration refers to learning a nonlinear mapping from the channel-wise statistics of cross-modal discrepancy features to adaptive channel weights. These weights are used to selectively reweight the discrepancy responses before they are incorporated into the subsequent fusion process.
For the l-th scale, the visible and infrared features are denoted as F r g b l and F i r l , respectively. The difference response between the two modalities is first calculated as:
D l = F r g b l F i r l
In the implementation, the modality order is fixed: the first input is the visible feature and the second input is the infrared feature. Therefore, the difference representation is directional, and reversing the modality order changes the sign of the difference response. The effect of this directional formulation is further examined in Section 4.4.2 by comparing the default signed RGB–IR discrepancy with absolute and reverse-signed alternatives while keeping all remaining components unchanged.
Subsequently, a 1 × 1 convolution is employed to perform channel mapping on the difference features, and the GELU activation function is utilized to enhance the nonlinear representation capability:
D p l = G E L U ( W 1 D l )
where W 1 denotes the 1 × 1 convolution operation, ∗ represents the convolution operation, and G E L U ( · ) denotes the GELU activation function.
For the processed difference feature D p l , global average pooling and global maximum pooling are applied to obtain two channel descriptors:
z avg l = GAP ( D p l ) ,
z max l = GMP ( D p l ) .
A shared one-dimensional convolution is then employed to model local interactions between adjacent channels. Its kernel size is adaptively determined following
t = log 2 C + b γ eca , k = t , t is odd , t + 1 , t is even ,
where C is the number of channels, and b = 1 and γ eca = 2 are used in the implementation.
The pooled descriptors are processed by the same one-dimensional convolution ψ k ( · ) and then added:
s l = ψ k ( z avg l ) + ψ k ( z max l ) .
A channel-wise RBF-KAN mapping is subsequently applied. For the response of the c-th channel, the mapping is defined as
ϕ c ( s c ) = w c b SiLU ( s c ) + k = 1 K w c , k s exp γ ¯ k ( s c μ k ) 2 ,
where
γ ¯ k = | γ k | + 10 4 .
In the implementation, K = 5 . The RBF centers are initialized as five uniformly spaced values over [ 2 , 2 ] , and the width parameters are initialized to K / 4 = 1.25 . The centers μ k and width parameters γ k are learnable but shared across channels, whereas the spline weights w c , k s and base weights w c b are independently learned for each channel. The base weights are initialized to one, while the spline weights are initialized from a zero-mean normal distribution scaled by 0.1.
The channel calibration weights and calibrated difference feature are computed as
A l = σ ϕ ( s l ) ,
D ^ l = D p l A l .
Through the above process, the RBF-KAN establishes a nonlinear mapping between the channel-wise discrepancy descriptors and the calibration weights, rather than directly treating all discrepancy responses equally. The resulting weights adaptively reweight the discrepancy features on a channel-by-channel basis, enabling the subsequent fusion process to emphasize more informative cross-modal discrepancies while reducing the contribution of less informative responses.
After obtaining the calibrated difference feature D ^ l , it is reintroduced into the original bimodal features to form a discrepancy-refined fusion structure:
F D K C F l = W 2 ( F v l + F i l + λ D ^ l )
where W 2 denotes the output 1 × 1 convolution, which is used for channel adjustment and fused feature compression. F v l and F i l represent the original semantic information from the visible and infrared modalities, respectively.
λ is a fixed gain controlling the contribution of the calibrated discrepancy feature. The default DDEF-Net uses λ = 2 . This value is empirically selected rather than learned during training. To examine the sensitivity of the model to this setting, additional experiments with λ = 0.5 , 1, 2, and 3 are reported in Section 4.4.2.
During the feature fusion stage, the proposed DKCF module is embedded into the neck network at the P 3 , P 4 , and P 5 feature levels. For each scale, the visible and infrared branches first extract modality-specific features independently. Then, the DKCF module generates fusion-guided features, which are subsequently fed back into the two branches:
F ˜ v l = F v l + F D K C F l
F ˜ i l = F i l + F D K C F l
where l { P 3 , P 4 , P 5 } .
Through this design, the two modality branches can maintain their independent feature extraction capabilities while performing enhanced interactions at multiple semantic levels. The P 3 layer mainly contains rich local structural information, which is beneficial for small object detection. The P 4 layer simultaneously integrates spatial and semantic information, making it suitable for medium-scale object recognition. The P 5 layer provides stronger high-level semantic representations, which facilitate the recognition of large-scale objects and high-level semantic discrimination in complex backgrounds.

4. Experimental Results

4.1. Datasets

All images used in the present experiments are obtained from publicly available benchmark datasets. Experiments are conducted using one primary UAV-based RGB-T benchmark and one supplementary paired multimodal aerial dataset. DroneVehicle contains visible–thermal image pairs and serves as the primary benchmark for evaluating the proposed method in UAV-based RGB-T object detection. In contrast, the adopted VEDAI subset contains visible–near-infrared image pairs and is used only as a supplementary evaluation under a different paired multimodal imaging setting.
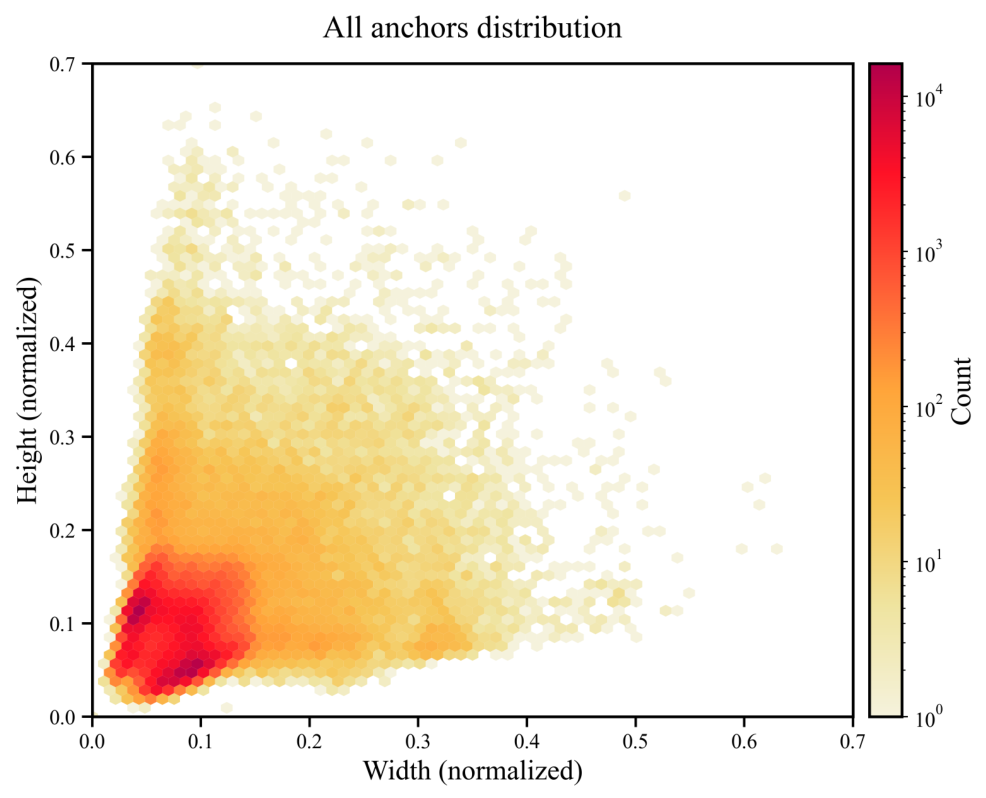
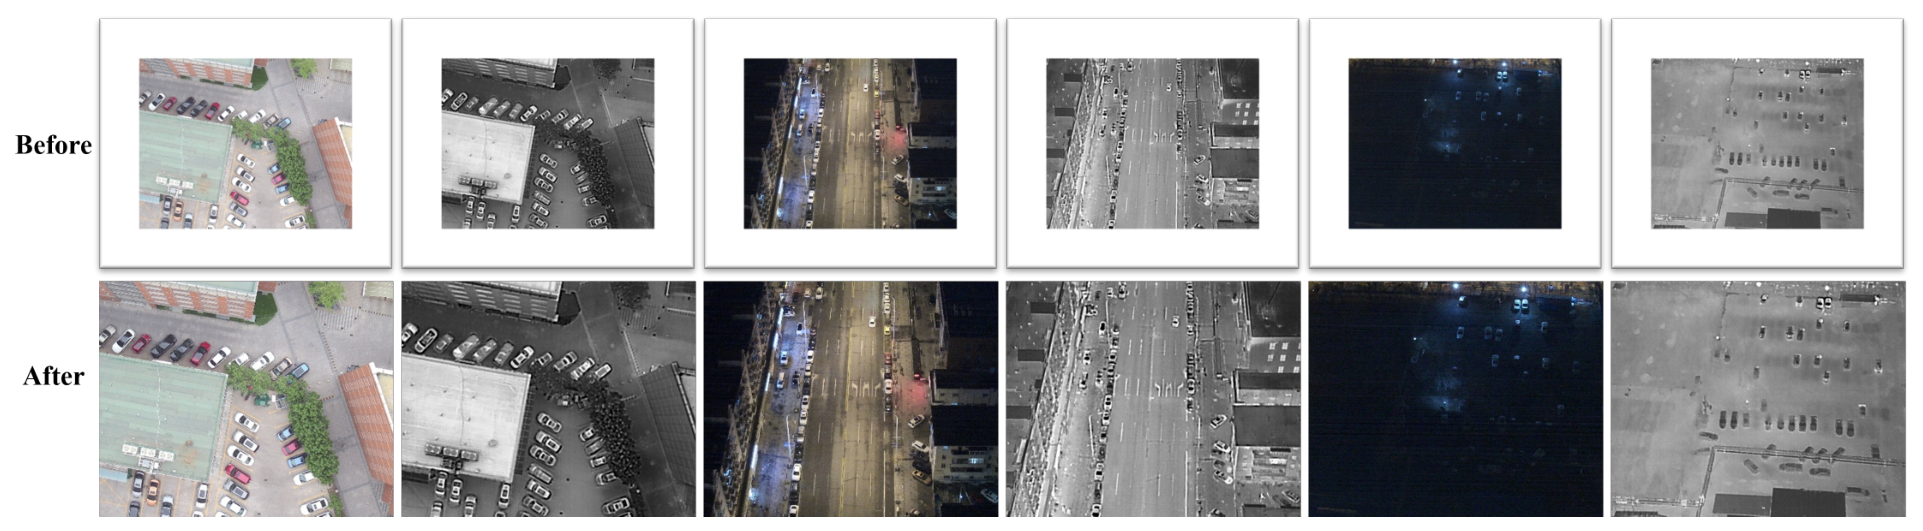
  • DroneVehicle: As one of the largest UAV-based RGB-T vehicle detection datasets, DroneVehicle contains 28,439 pairs of visible–infrared images, including five major traffic object categories: Car, Bus, Van, Truck, and Freight car. Figure 4 shows the distribution of normalized bounding-box widths and heights, where the bounding-box width and height are divided by the corresponding image width and height, respectively. Most instances are concentrated in relatively small normalized width and height ranges, indicating that many vehicle instances occupy limited spatial regions within the images. This scale distribution increases the difficulty of accurate localization and feature representation. It should be noted that the original dataset images contain a white border around the image boundaries. To avoid introducing redundant information, this study removes the 100-pixel-wide white border surrounding the original images and correspondingly adjusts the coordinates of all bounding boxes. The spatial resolution is uniformly resized to 640 × 512 . The comparison of the dataset before and after preprocessing is shown in Figure 5. It should be noted, however, that identical image dimensions do not imply perfect pixel-level registration. Owing to differences in sensor position, optics, and imaging mechanisms, residual cross-modal spatial misalignment may still exist. The proposed method assumes approximate spatial correspondence between the two modalities rather than strict pixel-wise registration. Furthermore, since visible images in complex environments contain a large number of missing annotations, all training and inference stages in this study consistently adopt the annotation files of the infrared modality to ensure the stability of model optimization and the objectivity of evaluation.
  • VEDAI: To provide a supplementary evaluation under a different paired multimodal imaging setting, we use a subset of the Vehicle Detection in Aerial Imagery (VEDAI) dataset [37], containing 874 training pairs and 248 validation pairs, for a total of 1122 visible–NIR image pairs. All experiments are conducted using the same subset and identical data partition to ensure a consistent comparison among the evaluated model variants. VEDAI is an aerial vehicle detection dataset containing visible and near-infrared imagery, with nine object categories, including boat, car, camping car, plane, pickup, tractor, truck, van, and other. It should be emphasized that VEDAI differs from DroneVehicle in both spectral characteristics and imaging modality; therefore, it is included only as a supplementary dataset rather than an independent UAV RGB-T benchmark.

4.2. Experimental Settings

The experimental environment settings used in this study are summarized in Table 1.

4.3. Evaluation Metrics

To objectively evaluate the detection performance of the proposed method, this study adopts mean Average Precision (mAP@0.5) and mean Average Precision over multiple intersection over union (IoU) thresholds (mAP@0.5:0.95) as the primary evaluation metrics.
Average Precision (AP) represents the area under the Precision–Recall (P-R) curve. The definitions of Precision (P) and Recall (R) are given as follows:
P = T P T P + F P
R = T P T P + F N
where T P (True Positives) represents the number of correctly detected targets, F P (False Positives) denotes the number of incorrectly detected targets, and F N (False Negatives) indicates the number of missed targets.
The area enclosed by the P-R curve is defined as Average Precision (AP). For a dataset containing N categories, AP and mAP are calculated as follows:
A P = P ( R ) d R
m A P = i = 1 N A P i N
where P ( R ) represents the precision function with recall R as the independent variable, A P i denotes the average precision of the i-th category, and N represents the total number of object categories.
In this study, mAP@0.5, calculated with an IoU threshold of 0.5, is used as the primary metric for evaluating detection performance. Additionally, mAP@0.5:0.95 is adopted as a comprehensive evaluation metric, which calculates the average mAP values under IoU thresholds ranging from 0.5 to 0.95 with an interval of 0.05.
Besides detection accuracy, computational complexity and model size are also considered. Specifically, GFLOPs and Params are employed as efficiency metrics. GFLOPs measure the computational cost during the forward inference process, while Params represent the total number of learnable parameters in the network, reflecting the model complexity and memory consumption.
To further evaluate detection performance across different object scales, AP S , AP M , and AP L are additionally reported following the COCO evaluation protocol. These metrics correspond to small, medium, and large objects defined by the standard COCO area ranges, respectively, and are averaged over IoU thresholds from 0.50 to 0.95 with an interval of 0.05.

4.4. Ablation Experiment

To verify the effectiveness of the proposed DKCF and SFDE modules, ablation experiments are conducted on the DroneVehicle dataset. The detailed results are presented in Table 2 and Table 3.

4.4.1. Effectiveness of Different Modalities

For the baseline experiments, the proposed RGB + IR Baseline adopts a dual-branch YOLO11n architecture to independently extract visible and infrared features. The features from the two modalities are fused through the Concat operation at three different scales, i.e., P 3 , P 4 , and P 5 , while the remaining network components are kept consistent with the original YOLO11n.
As shown in Table 2, when only RGB images are utilized, the model achieves an mAP@0.5 of 68.8% and an mAP@0.5:0.95 of 52.5%, indicating degraded detection performance caused by illumination variations, shadow occlusion, and complex backgrounds. In comparison, using only infrared images improves the detection performance, achieving 79.7% mAP@0.5 and 67.8% mAP@0.5:0.95. This improvement is mainly attributed to the lower sensitivity of thermal infrared imaging to illumination variations, which provides more stable target responses under low-light, shadowed, and nighttime conditions. However, the performance on the Van category remains limited, with an AP of only 60.1%, indicating that relying solely on infrared information still lacks sufficient discriminative capability for certain object categories.
Furthermore, the RGB + IR baseline achieves 81.4% mAP@0.5 and 68.6% mAP@0.5:0.95, which surpasses both single-modality baselines. These results demonstrate that RGB and infrared modalities provide complementary information, and effective cross-modal fusion is essential for improving RGB-T object detection performance.

4.4.2. Effectiveness of the Proposed Module

  • Effectiveness of the DKCF Module
As shown in Table 3, the baseline model contains 4.1 M parameters and requires 9.9 GFLOPs, achieving an overall mAP@0.5 of 81.4% and an mAP@0.5:0.95 of 68.6%. After introducing the DKCF module, the number of parameters increases to 4.3 M and the computational cost increases to 10.6 GFLOPs. Meanwhile, the overall mAP@0.5 improves to 83.1%, and the mAP@0.5:0.95 increases to 70.9%. This indicates that with only an additional 0.2 M parameters and approximately 0.7 GFLOPs of computational overhead, the proposed DKCF module achieves improvements of 1.7 and 2.3 percentage points in mAP@0.5 and mAP@0.5:0.95, respectively.
It is worth noting that the DKCF module provides more significant improvements for challenging object categories. As shown in Table 4, the AP of the Van category increases by 4.05 percentage points in A P @ 0.5 and 4.02 percentage points in A P @ 0.5 : 0.95 . Moreover, the Truck category achieves a 2.44 percentage-point improvement in A P @ 0.5 : 0.95 , while the Freight car category improves by 2.66 percentage points. In the DroneVehicle dataset, these categories generally exhibit larger scale variations, similar appearances, and severe occlusion problems. These results indicate that the DKCF module provides relatively larger improvements for several challenging and less frequent categories, particularly Van, Freight car, and Truck.
From the perspective of metric improvements, the gain in mAP@0.5:0.95 is generally higher than that in mAP@0.5. This indicates that the DKCF module not only improves the capability of object classification and localization but also contributes to more accurate localization under stricter IoU thresholds.
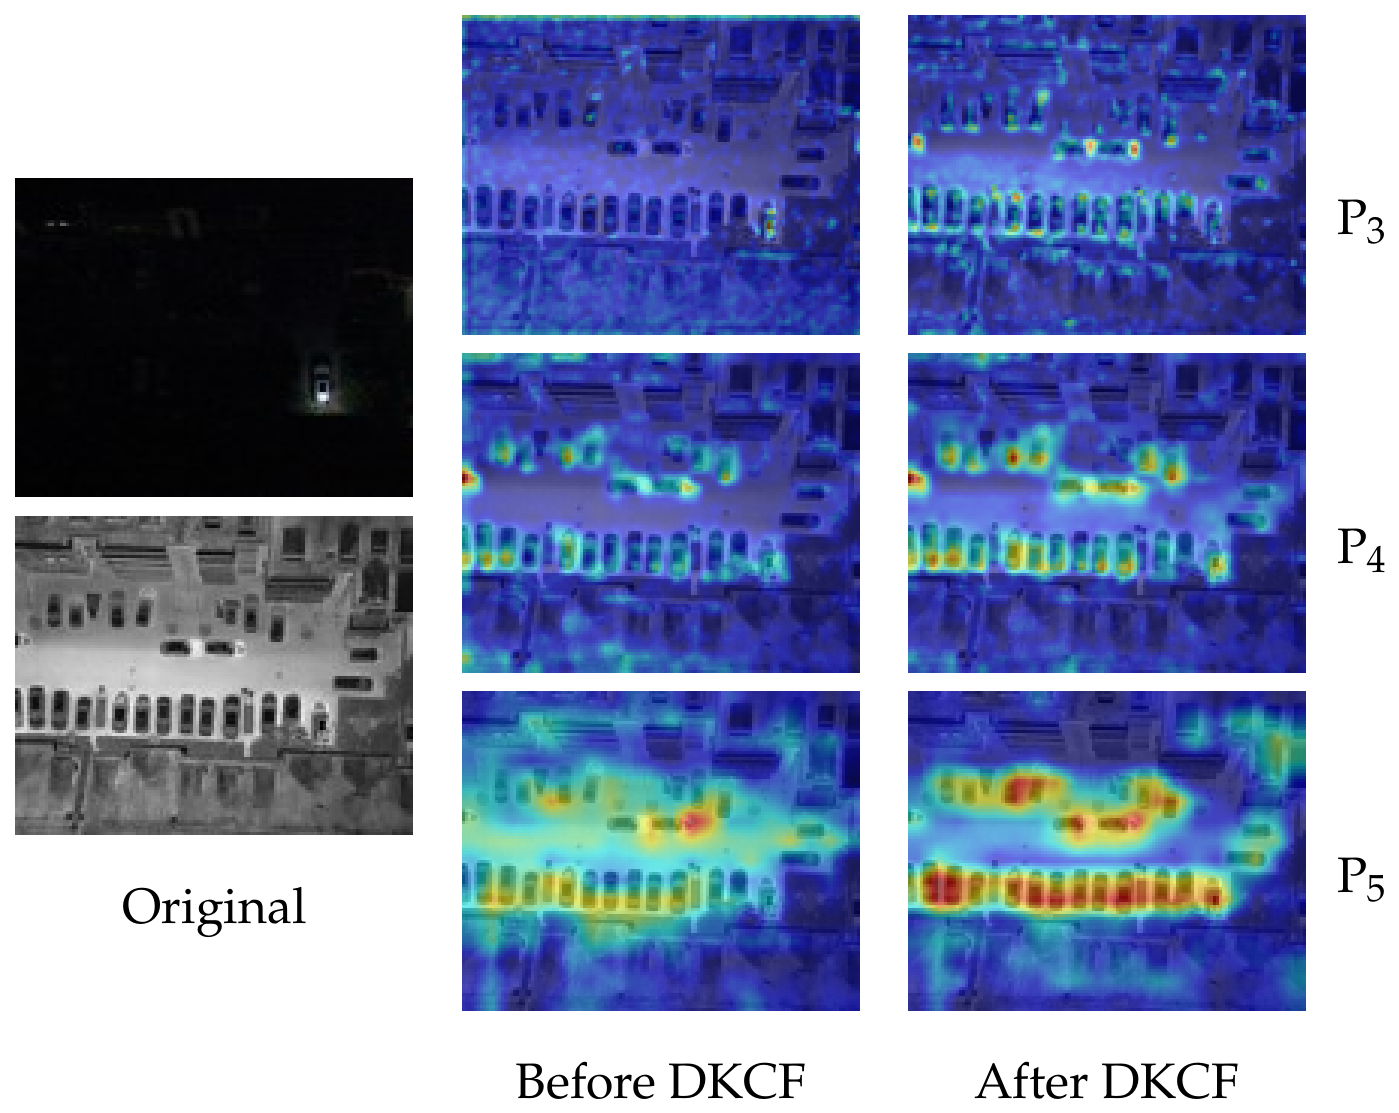
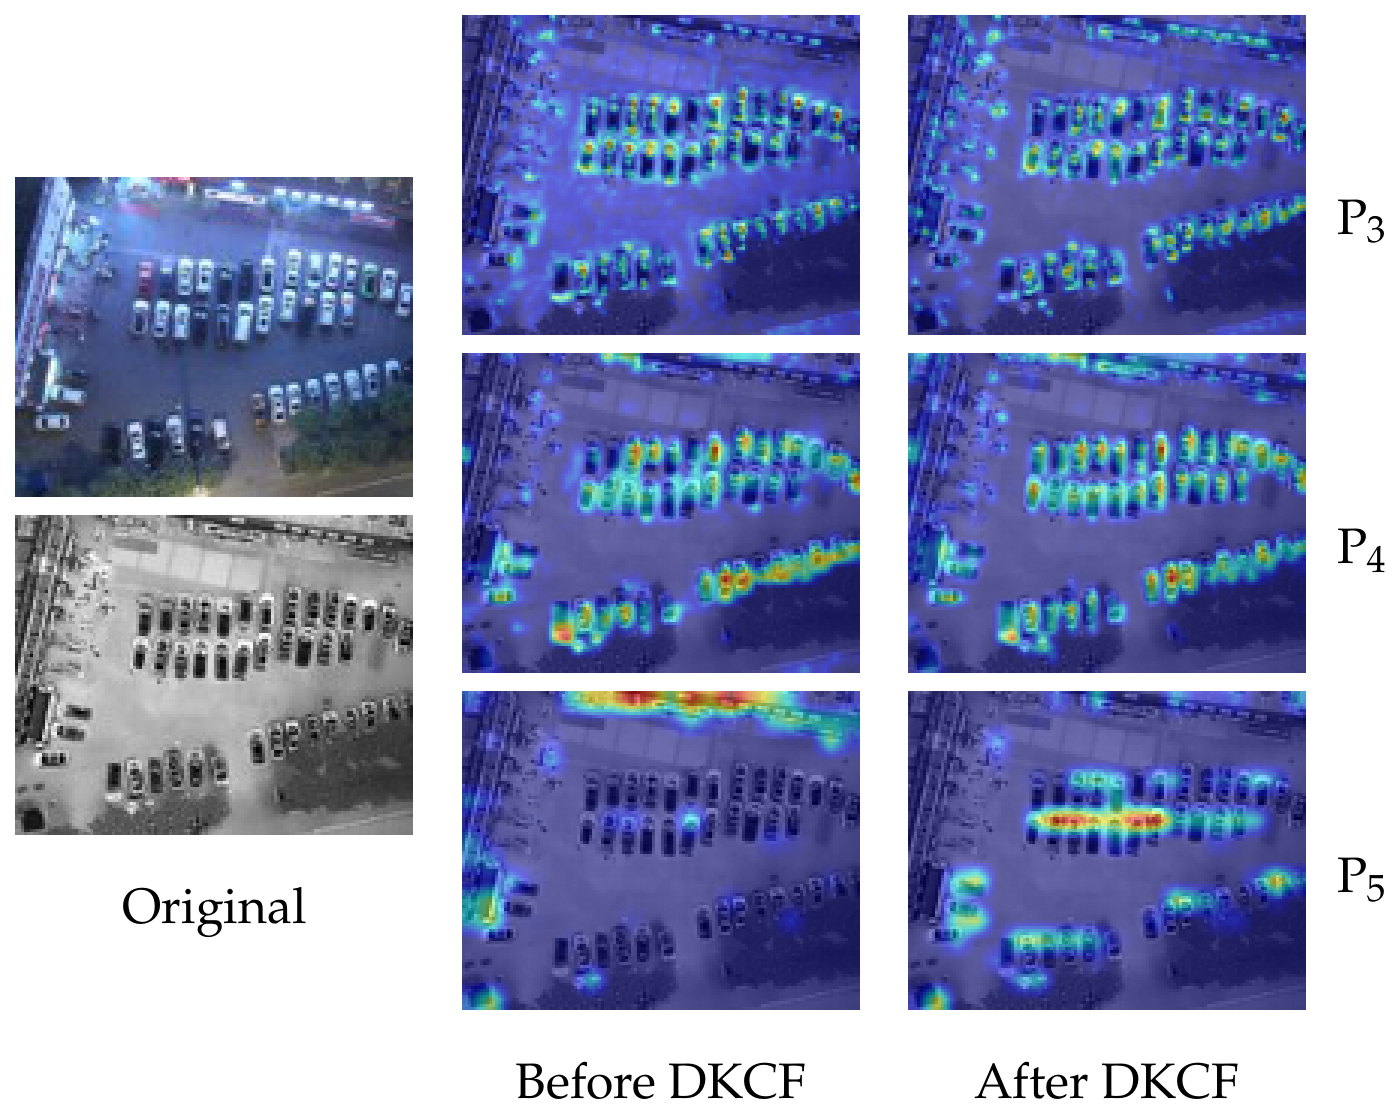
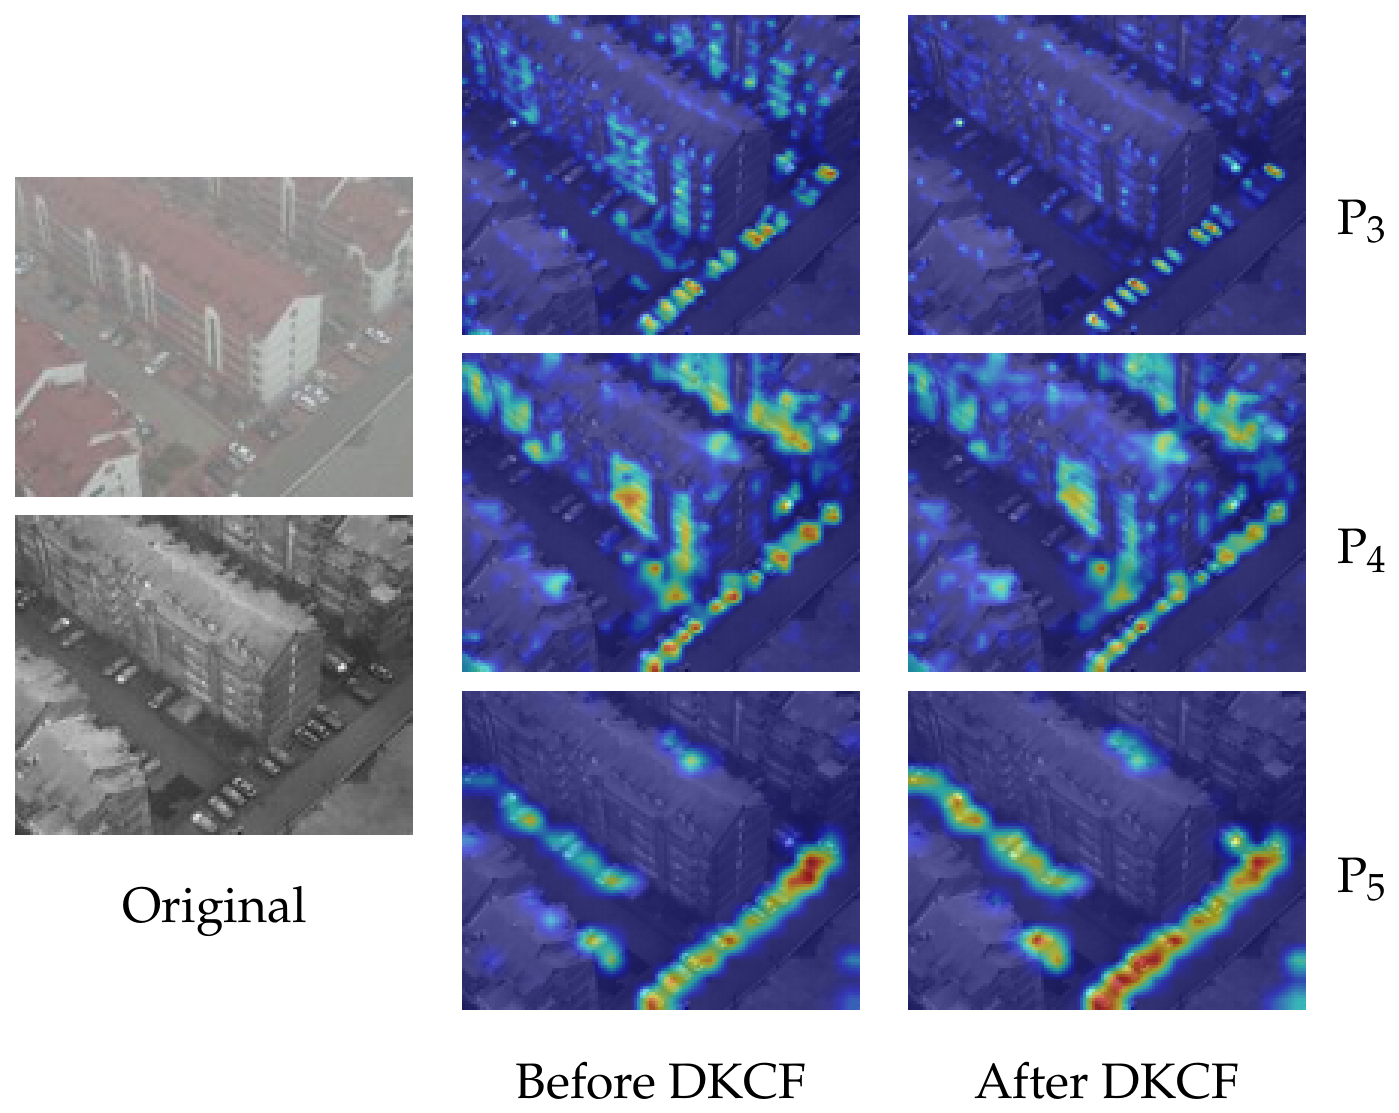
To intuitively demonstrate the effectiveness of the DKCF module, three representative complex scenarios from the DroneVehicle dataset are selected for visualization analysis. As shown in Figure 6, Figure 7 and Figure 8, the feature visualization results of the P 3 , P 4 , and P 5 levels before and after introducing the DKCF module are presented under extremely dark, nighttime, and foggy conditions.
Overall, after incorporating the DKCF module, the model is able to focus more effectively on informative complementary features within the target regions while suppressing background noise and redundant modal information. The visualization results under different scenarios indicate that, in challenging environments such as extremely dark conditions, nighttime scenes, and heavy fog, the originally scattered activation responses gradually concentrate on the regions containing vehicle targets. This demonstrates that the DKCF module enhances the model’s ability to capture discriminative target features and produces more concentrated target-region activations in the selected examples.
To further determine whether the improvement of DKCF originates from explicit discrepancy modeling, channel calibration, or simply from introducing an additional fusion structure, we conduct a controlled component-level ablation. The No-Difference variant removes cross-modal discrepancy modeling while retaining the corresponding fusion scaffold. The Raw-Difference variant directly introduces the processed signed discrepancy without channel calibration. The ECA-only variant retains pooled channel interaction but removes RBF-KAN, whereas the Multilayer Perceptron (MLP) variant replaces RBF-KAN with a conventional nonlinear mapping. The insertion positions and the remaining network structure are kept unchanged.
As shown in Table 5a, the No-Difference, Raw-Difference, ECA-only, and MLP variants achieve 80.9%, 81.2%, 81.5%, and 81.3% mAP@0.5, respectively, with corresponding mAP@0.5:0.95 values of 68.5%, 68.6%, 68.8%, and 68.7%. In contrast, the complete DDEF-Net achieves 84.9% mAP@0.5 and 72.6% mAP@0.5:0.95. In particular, compared with ECA-only and MLP calibration, the complete model improves mAP@0.5:0.95 by 3.8 and 3.9 percentage points, respectively, while introducing only a modest increase in model complexity. These results indicate that the performance gain cannot be attributed solely to an additional fusion scaffold, direct discrepancy injection, or conventional channel calibration. Under the present architecture, RBF-KAN-based nonlinear calibration provides additional benefit in selectively exploiting cross-modal discrepancy information.
We further investigate whether the benefit of DKCF originates merely from the magnitude of cross-modal discrepancy or from its directional representation. For this purpose, the default signed discrepancy F r g b F i r is compared with the absolute discrepancy | F r g b F i r | and the reverse-signed discrepancy F i r F r g b . All other components, including nonlinear calibration, residual fusion, insertion positions, and training settings, remain unchanged.
As shown in Table 5b, the absolute-difference variant achieves 81.7% mAP@0.5 and 69.1% mAP@0.5:0.95, while the reverse-signed variant obtains 81.4% and 68.8%, respectively. In comparison, the default RGB–IR signed formulation reaches 84.9% and 72.6%. Since the three variants have identical parameter counts and computational costs, the results indicate that retaining modality-order-dependent discrepancy information is more effective than using discrepancy magnitude alone under the current fusion architecture.
The influence of the discrepancy gain λ in Equation (28) is further evaluated by setting λ to 0.5, 1, 2, and 3 while keeping all other configurations unchanged. As shown in Table 5c, increasing λ from 0.5 to 2 progressively improves mAP@0.5 from 81.3% to 84.9% and mAP@0.5:0.95 from 68.6% to 72.6%. However, further increasing λ to 3 reduces the two metrics to 80.9% and 68.3%, respectively. This non-monotonic trend suggests that the discrepancy term should maintain an appropriate balance with the original visible and infrared features. An insufficient gain may limit the contribution of the calibrated complementary information, whereas excessive amplification may disturb the original bimodal representation. Therefore, λ = 2 , which provides the best performance among the evaluated settings, is retained as the default value.
  • Effectiveness of the SFDE Module
As shown in Table 3, the introduction of the SFDE module improves the detection performance of the model. Specifically, the overall mAP@0.5 increases from 81.4% to 83.1%, representing an improvement of 1.7 percentage points. Meanwhile, the mAP@0.5:0.95 increases from 68.6% to 70.8%, with a gain of 2.2 percentage points. Compared with mAP@0.5, the improvement in mAP@0.5:0.95 is more significant, indicating that the SFDE module not only enhances the object detection capability but also contributes to more accurate localization under stricter IoU thresholds. However, this overall improvement does not imply that the two internal branches are independently beneficial. We therefore further disentangle the contributions of the Scharr and Fourier branches through branch-wise ablation experiments, as reported in Table 6.
To further investigate the individual roles of the two branches within SFDE, we conducted branch-wise ablation experiments by constructing Scharr-only and Fourier-only variants while keeping the insertion position, training settings, and the remaining network architecture unchanged. The results are presented in Table 6. The Scharr-only variant achieves 80.5% mAP@0.5 and 67.5% mAP@0.5:0.95, while the Fourier-only variant achieves 80.3% and 67.6%, respectively. Both single-branch variants remain close to but below the RGB + IR baseline, indicating that neither branch alone provides a net performance improvement under the current architecture.
In contrast, jointly incorporating the Scharr and Fourier branches increases mAP@0.5 and mAP@0.5:0.95 to 83.1% and 70.8%, respectively, corresponding to improvements of 1.7 and 2.2 percentage points over the baseline. These results suggest that the effectiveness of SFDE primarily arises from the complementary interaction between spatial gradient priors and frequency-domain representations rather than from either branch independently. The Scharr branch emphasizes local edge and contour structures, whereas the Fourier branch provides complementary frequency-domain structural information. Their joint modeling therefore provides a more comprehensive representation of low-level object details, particularly under stricter localization criteria.
To directly examine whether the potential cancellation between signed horizontal and vertical Scharr responses adversely affects SFDE, we further compare the original signed averaging strategy with absolute-response averaging and gradient-magnitude fusion. Except for the directional fusion formulation, all network structures and training settings are kept unchanged.
As shown in Table 7, the absolute-average variant achieves 79.3% mAP@0.5 and 68.9% mAP@0.5:0.95, while the gradient-magnitude variant achieves 79.6% mAP@0.5 and 69.2% mAP@0.5:0.95. In comparison, the original signed-average formulation achieves 83.1% mAP@0.5 and 70.8% mAP@0.5:0.95. All three variants have the same parameter count of 4.2 M and computational cost of 11.8 GFLOPs.
Although signed averaging may theoretically attenuate responses when the horizontal and vertical gradients have opposite signs, explicitly avoiding such cancellation does not improve detection performance. Instead, the results suggest that preserving signed directional information is more beneficial under the current SFDE architecture, whereas absolute and magnitude formulations discard gradient polarity and alter the original response distribution. Therefore, the signed averaging formulation is retained in the final model.
To further examine the scale-specific effects of SFDE, AP S , AP M , and AP L were evaluated using the COCO area definitions. As shown in Table 8, the baseline achieves 26.30%, 65.89%, and 47.83% AP S , AP M , and AP L , respectively. Introducing SFDE alone results in 24.40% AP S , 67.12% AP M , and 57.03% AP L . Thus, although SFDE improves AP M and AP L by 1.23 and 9.20 percentage points, respectively, AP S decreases by 1.90 percentage points. The complete model achieves 25.76% AP S , 68.61% AP M , and 57.62% AP L . These results indicate that the performance gains of the current SFDE design are not concentrated in the COCO-defined small-object subset, but are more evident for medium- and large-scale objects.
As shown in Table 9, from the perspective of individual categories, the improvements introduced by the SFDE module are mainly concentrated in the Van, Freight car, and Truck categories. Among them, the Van category achieves the most significant improvement, with increases of 3.95 and 3.75 percentage points in A P @ 0.5 and A P @ 0.5 : 0.95 , respectively. These results indicate that the SFDE module can effectively enhance the representation capability of objects with large intra-class variations and complex visual characteristics.
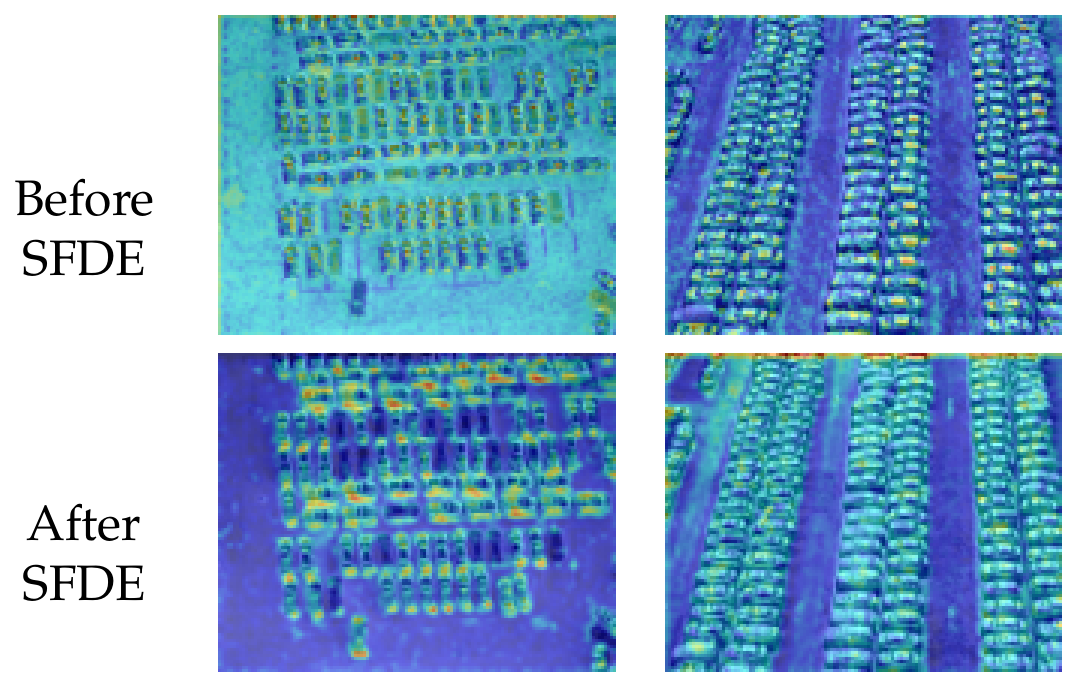
The feature activation maps in Figure 9 provide a qualitative illustration of the effect of SFDE in densely distributed vehicle scenes. By introducing Scharr-based edge priors and Fourier-domain feature modeling, SFDE produces more structured target-region responses and clearer contour-related activations in the selected examples.


4.5. Comparison Experiments

To validate the detection performance of the proposed method, we compare it with several representative state-of-the-art RGB-T object detection approaches. All models are trained for 150 epochs, with the batch size set to 64. The initial learning rate was set to 0.02, and the final learning-rate factor was set to 0.01. The SGD optimizer is adopted with a momentum of 0.937 and a weight decay of 0.0005. During training, the Close Mosaic strategy is activated with the parameter set to 10.
To ensure a fair comparison, the reproducible methods are retrained and evaluated under the same dataset partition, input resolution, and training strategy. For methods that cannot be reproduced due to unavailable source codes, the reported results from their original papers on the DroneVehicle dataset are directly cited and marked with “*” in the table. It should be noted that “-” indicates that the corresponding evaluation metrics are not reported in the original publications.
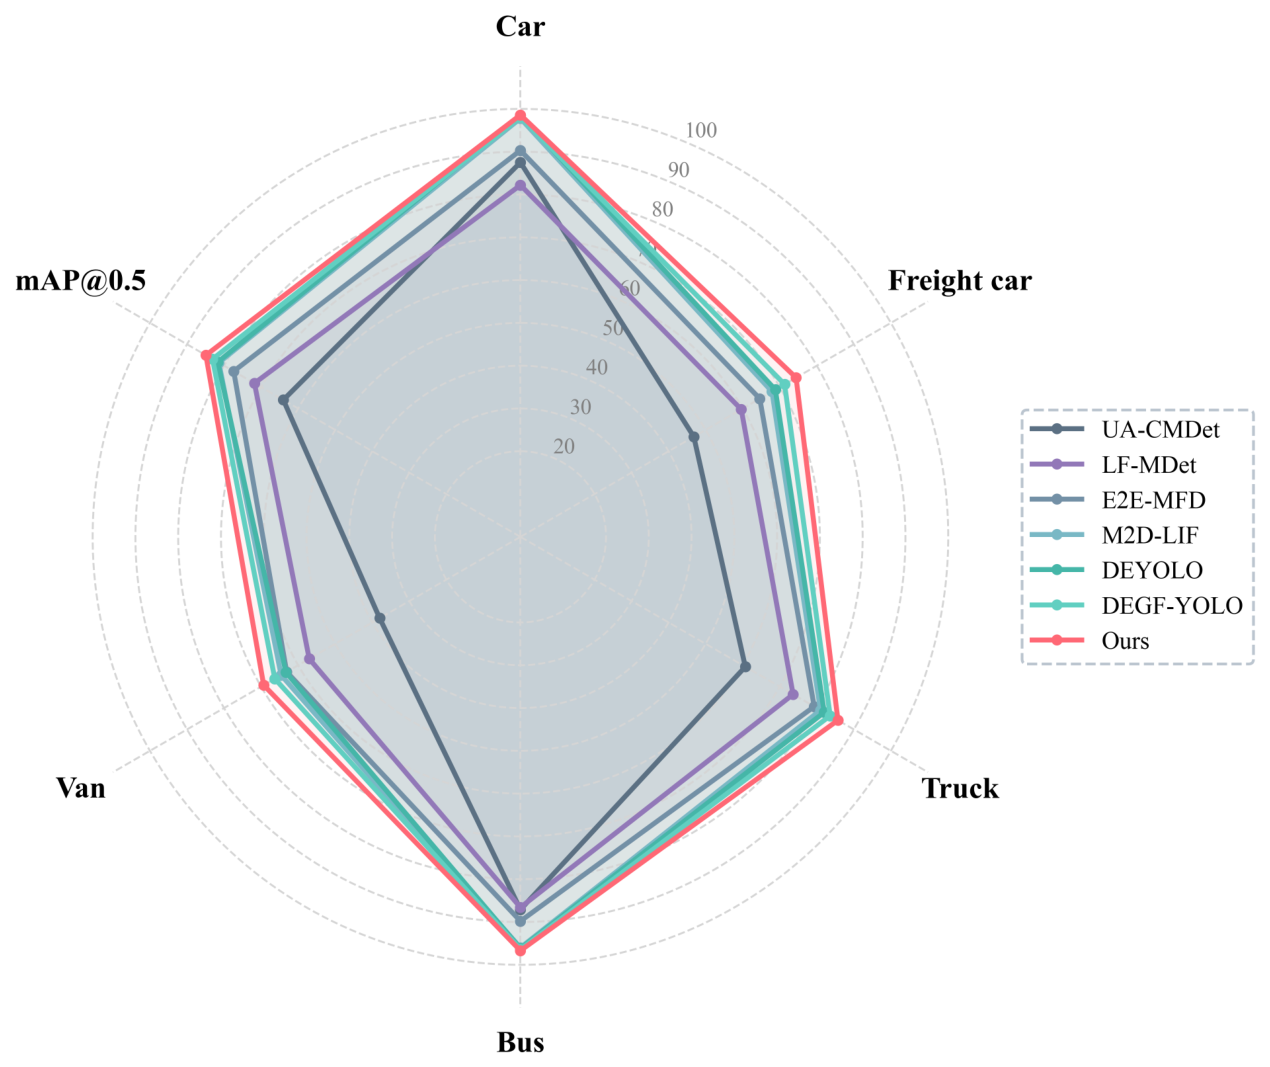
As shown in Table 10 and Figure 10, the proposed method achieves competitive detection performance on the DroneVehicle dataset. Specifically, the proposed method obtains an overall mAP@0.5 of 84.9% and an mAP@0.5:0.95 of 72.6%, outperforming the selected comparison methods. These results demonstrate that the proposed cross-modal fusion strategy can effectively exploit complementary information between visible and infrared modalities, thereby improving the detection accuracy of UAV-based RGB-T object detection.
Furthermore, the proposed method contains only 4.4 M parameters and requires only 12.5 GFLOPs, achieving a better balance between detection performance and computational efficiency compared with most competing methods.
To evaluate the inference efficiency, the proposed model is tested on a single RTX 4090D GPU. The input image resolution is set to 640 × 512 with a batch size of 1. To ensure stable measurement results, 200 forward inference iterations are first conducted for warm-up to eliminate the influence of initial loading overhead, followed by 1000 inference iterations for performance evaluation. The experimental results show that the proposed method achieves an average inference speed of 101.2 FPS on the RTX 4090D platform, with an inference latency of 9.88 ms per image. Overall, the proposed method achieves a favorable trade-off among detection accuracy, category-level detection accuracy, and model efficiency, demonstrating its effectiveness for UAV-based RGB-T object detection.
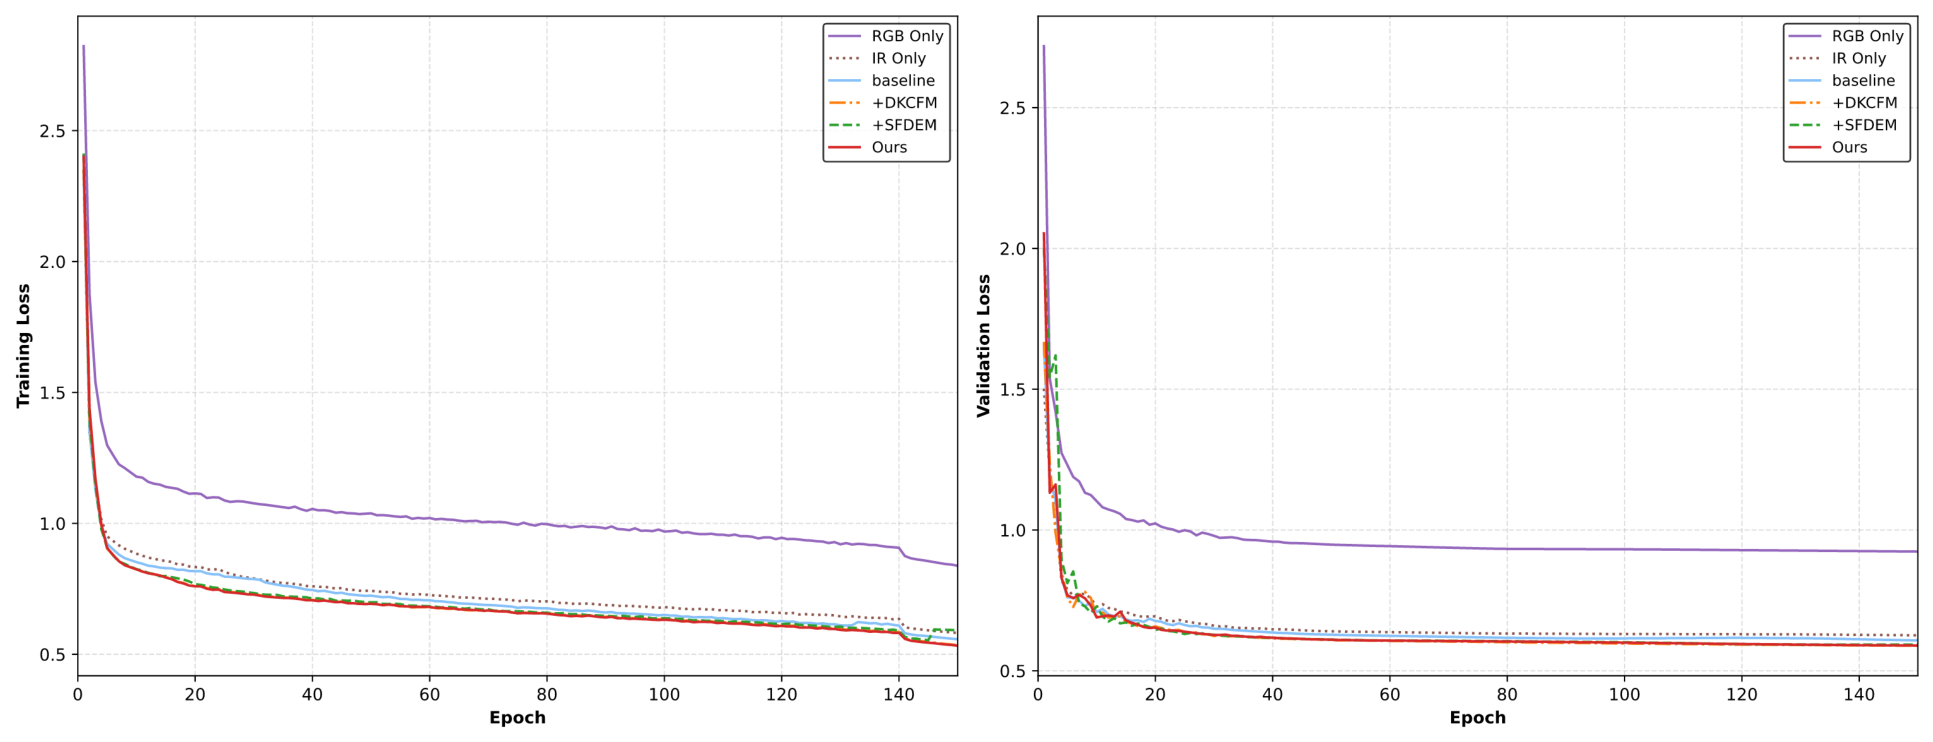
The training process of different models is further analyzed through visualization. As shown in Figure 11, after introducing the DKCF and SFDE modules, the model achieves lower training and validation losses, indicating that the proposed cross-modal difference calibration and fine-grained detail enhancement strategies facilitate more effective feature learning. In particular, after integrating both modules, the model maintains the lowest loss values on both the training and validation sets, demonstrating the complementary effects of DKCF and SFDE.
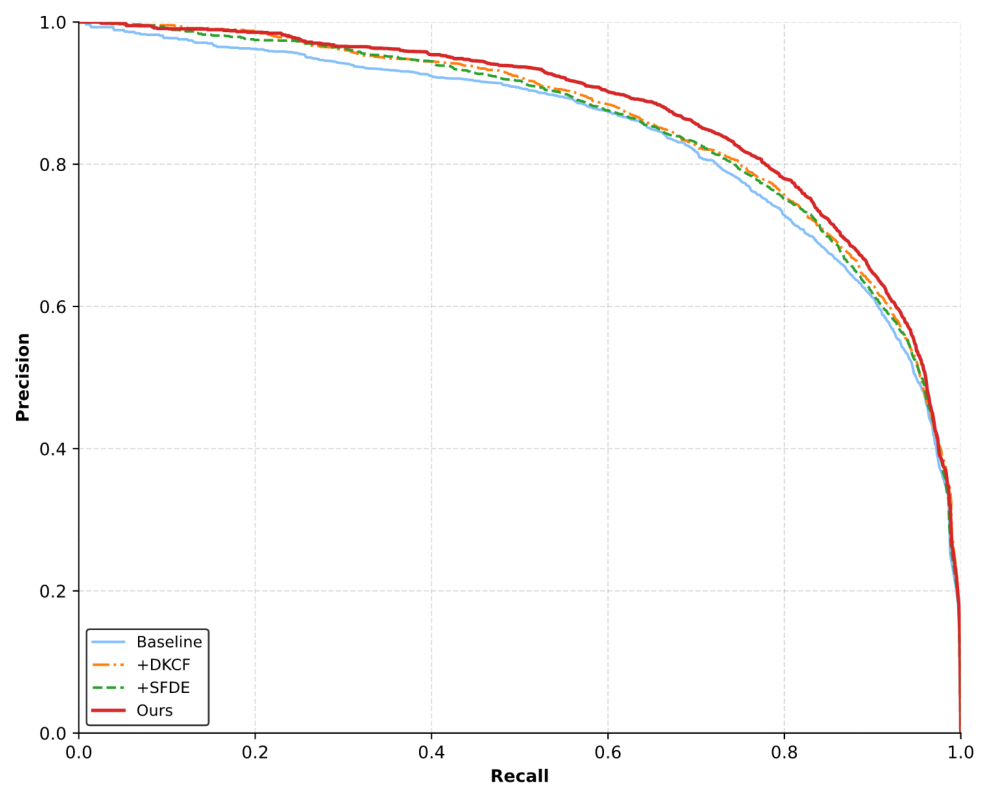
As illustrated in Figure 12, the proposed method achieves higher precision over the entire recall range compared with other models. This indicates that the proposed framework can improve target recall while reducing false detections, further demonstrating its effectiveness for RGB-T object detection.
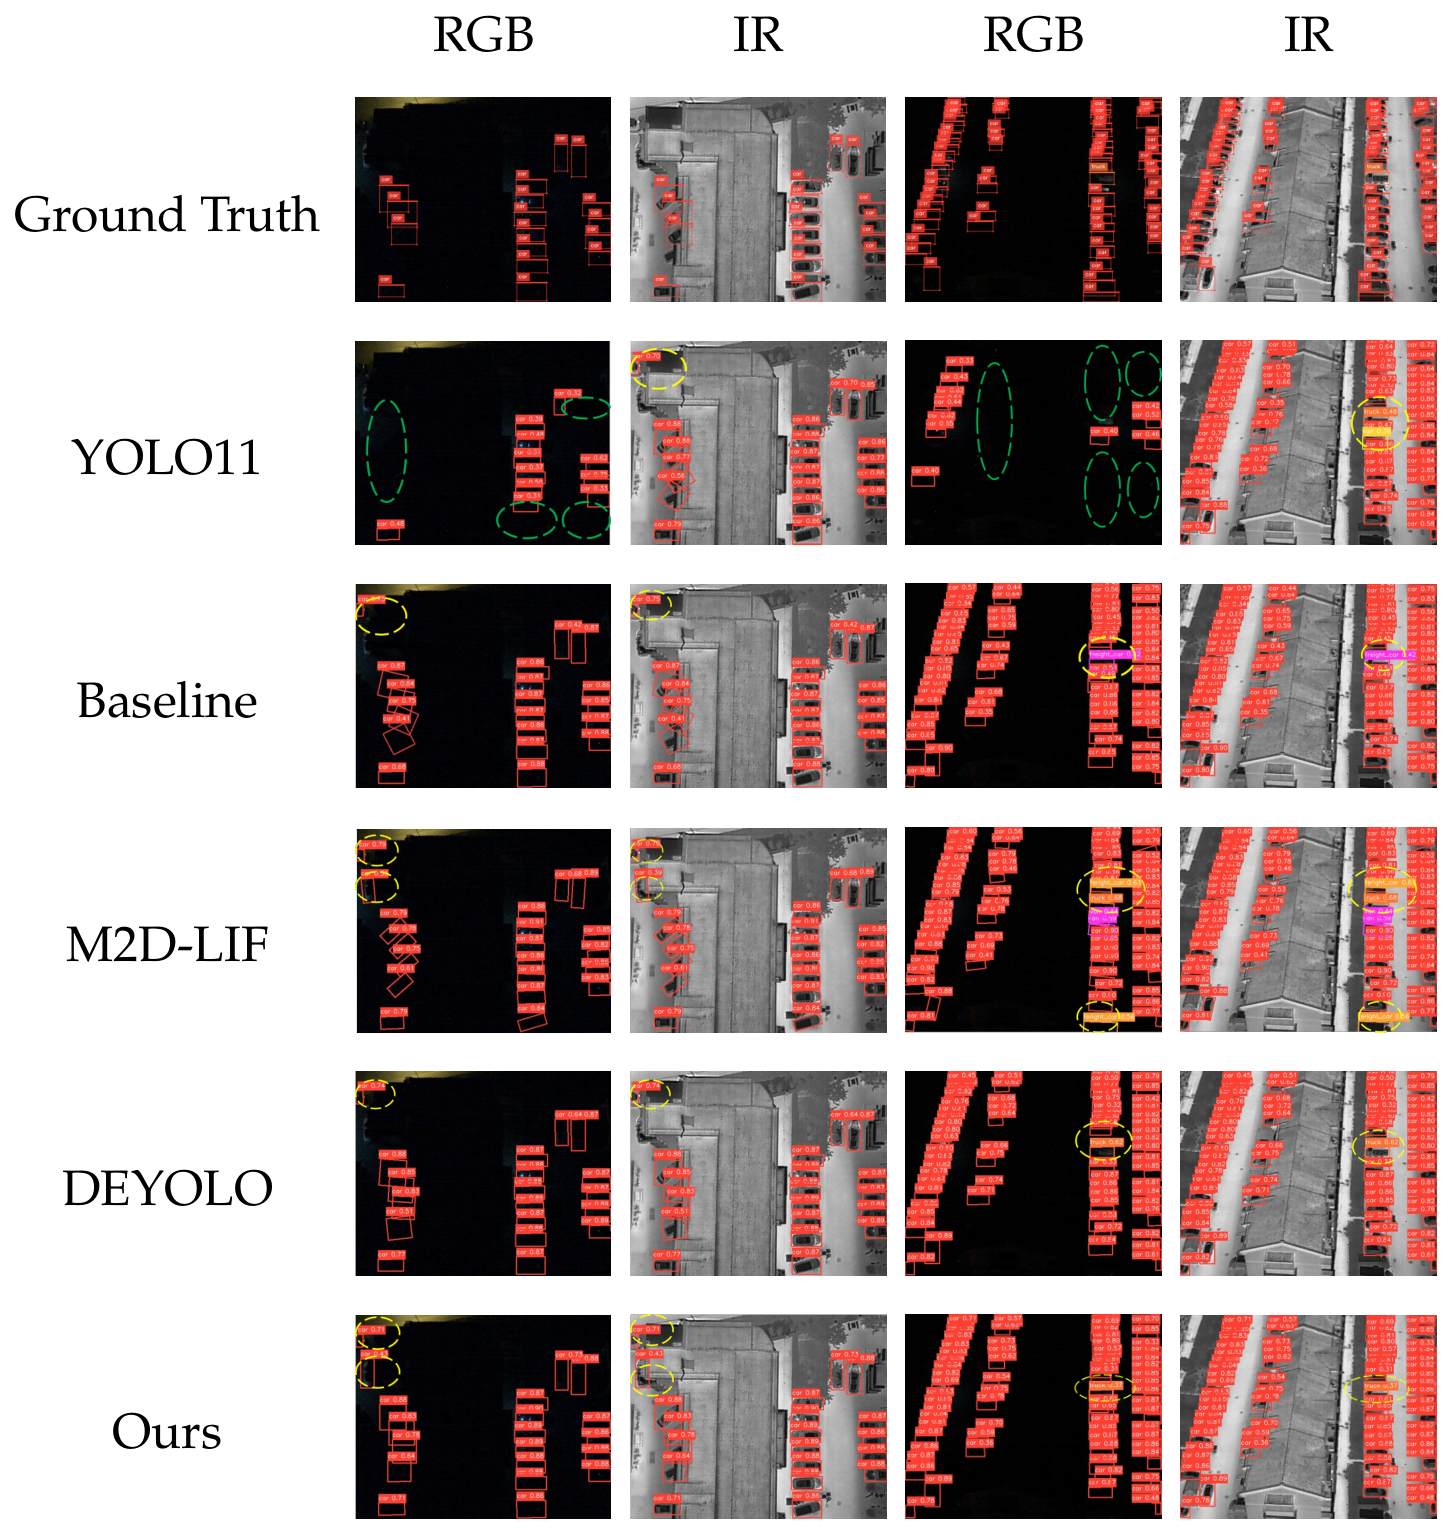
To further evaluate the detection performance of the proposed method under complex scenarios, several representative methods, including YOLO11, the Baseline model, M2D-LIF, DEYOLO, and the proposed method, were selected for comparison. The qualitative detection results of these methods are visualized and presented in Figure 13.
As shown in Figure 13, the target visibility in RGB images is relatively limited. YOLO11 exhibits apparent missed detections in both scenarios, especially in dark regions and densely distributed vehicle areas, where some small objects are not detected and the number of predicted bounding boxes is significantly lower than that of the ground truth.
For infrared images, YOLO11 achieves improved recall performance; however, a large number of overlapping bounding boxes are observed in densely populated regions, and the confidence scores and localization accuracy for some categories remain insufficient. Compared with YOLO11, the Baseline model detects more targets, indicating that RGB-IR feature fusion can improve the detection capability by exploiting complementary information from two modalities. Nevertheless, some missed detections remain, and several predicted boxes exhibit localization deviations or duplicate predictions.
The M2D-LIF method further increases the number of detected targets and reduces missed detections. However, noticeable overlapping boxes, duplicated predictions, and category confusion remain in dense regions of both RGB and infrared images, indicating that its performance is still affected by false positives and localization errors under high-density small-object scenarios.
The detection results of DEYOLO are generally more stable than those of M2D-LIF, with fewer false detections. However, missed detections of small objects and insufficient boundary alignment of some predicted boxes can still be observed. In comparison, the proposed method achieves detection results that are more consistent with the ground-truth annotations in both RGB and infrared images. The predicted bounding boxes are more complete and regularly distributed in densely populated vehicle regions, while background false responses are effectively suppressed. In addition, more stable confidence scores are obtained, demonstrating the effectiveness of the proposed method in integrating complementary visible and infrared information and improving RGB-T object detection reliability.

4.6. Additional Dataset and Corruption Evaluations

4.6.1. Supplementary Evaluation on the VEDAI Visible–NIR Aerial Dataset

To provide a supplementary assessment of the proposed modules under a different paired multimodal imaging setting, experiments were conducted on the visible–NIR subset of the VEDAI aerial dataset. The model was trained on the VEDAI training subset for 300 epochs with a batch size of 16 and an initial learning rate of 0.01. The remaining training configurations were kept consistent with those used in the DroneVehicle experiments. The VEDAI validation subset was used for checkpoint selection and performance evaluation. Therefore, the reported results represent dataset-specific validation performance rather than zero-shot cross-dataset generalization.
As shown in Table 11, the VEDAI baseline achieves 67.9% mAP@0.5 and 41.1% mAP@0.5:0.95. Introducing DKCF alone improves the two metrics to 70.4% and 42.8%, respectively, whereas introducing SFDE alone results in relatively limited improvements, reaching 68.0% and 41.7%. When both modules are incorporated, the complete model achieves the best performance of 72.4% mAP@0.5 and 44.2% mAP@0.5:0.95, corresponding to improvements of 4.5 and 3.1 percentage points over the baseline.
These results indicate that the proposed modules remain effective after dataset-specific training on the VEDAI visible–NIR subset. In particular, DKCF provides a larger individual improvement than SFDE, while their joint use produces the highest detection accuracy. Because the model is trained and selected using VEDAI data, this experiment provides only supplementary evidence of architectural applicability under a different paired multimodal imaging setting and should not be interpreted as independent validation of cross-dataset generalization for UAV-based RGB-T detection.

4.6.2. Robustness Under Image Degradation

To simulate various image degradation conditions that may occur in practical UAV imaging scenarios, 1000 visible–infrared image pairs were randomly selected from the DroneVehicle test set. Gaussian blur, motion blur, and Gaussian noise were applied to both modalities. Specifically, Gaussian blur was generated using a 7 × 7 kernel, while motion blur was simulated using a horizontal kernel with a length of 15 pixels. Gaussian noise with zero mean was evaluated at three noise levels, with standard deviations of σ = 10 , 15, and 25. Pixel values after noise addition were clipped to the valid range of [ 0 , 255 ] . The trained models were then directly evaluated on the degraded images.
As shown in Table 12, all evaluated models exhibit performance degradation under image corruption. Under Gaussian blur, the complete model achieves 76.7% mAP@0.5 and 64.1% mAP@0.5:0.95, outperforming the baseline by 5.1 and 4.6 percentage points, respectively. Under motion blur, the complete model achieves 58.7% and 45.8%, corresponding to improvements of 7.9 and 6.6 percentage points over the baseline. These results indicate improved robustness to the two evaluated blur corruptions.
A different trend is observed under Gaussian noise. The complete model achieves only 17.9% mAP@0.5 and 14.3% mAP@0.5:0.95, whereas the baseline achieves 30.4% and 24.2%, respectively. Thus, the complete model decreases by 12.5 and 9.9 percentage points relative to the baseline.
To further characterize the failure behavior under Gaussian noise, we evaluated the models under Gaussian noise with standard deviations of σ = 10 , σ = 15 , and σ = 25 , while the clean condition ( σ = 0 ) was included as a reference. As shown in Table 13, DDEF-Net remains superior to the baseline under mild Gaussian noise ( σ = 10 ), achieving 69.9% mAP@0.5 and 58.6% mAP@0.5:0.95, compared with 66.8% and 55.6% for the baseline. Therefore, the proposed model does not immediately lose its robustness advantage when Gaussian noise is introduced.
When the noise intensity increases to σ = 15 , however, the complete model decreases to 47.8% mAP@0.5 and 39.6% mAP@0.5:0.95, below the baseline values of 55.9% and 45.7%. At this noise level, the DKCF-only variant remains close to the baseline, achieving 55.5% and 46.7%, whereas the SFDE-only variant decreases to 48.9% and 40.4%. This result indicates that the sensitivity to moderate Gaussian noise emerges more prominently in the low-level detail-enhancement pathway associated with SFDE. Under severe noise ( σ = 25 ), both single-module variants deteriorate, and the complete model shows the largest degradation, suggesting an interaction between noise-sensitive low-level feature enhancement and subsequent discrepancy-guided fusion.
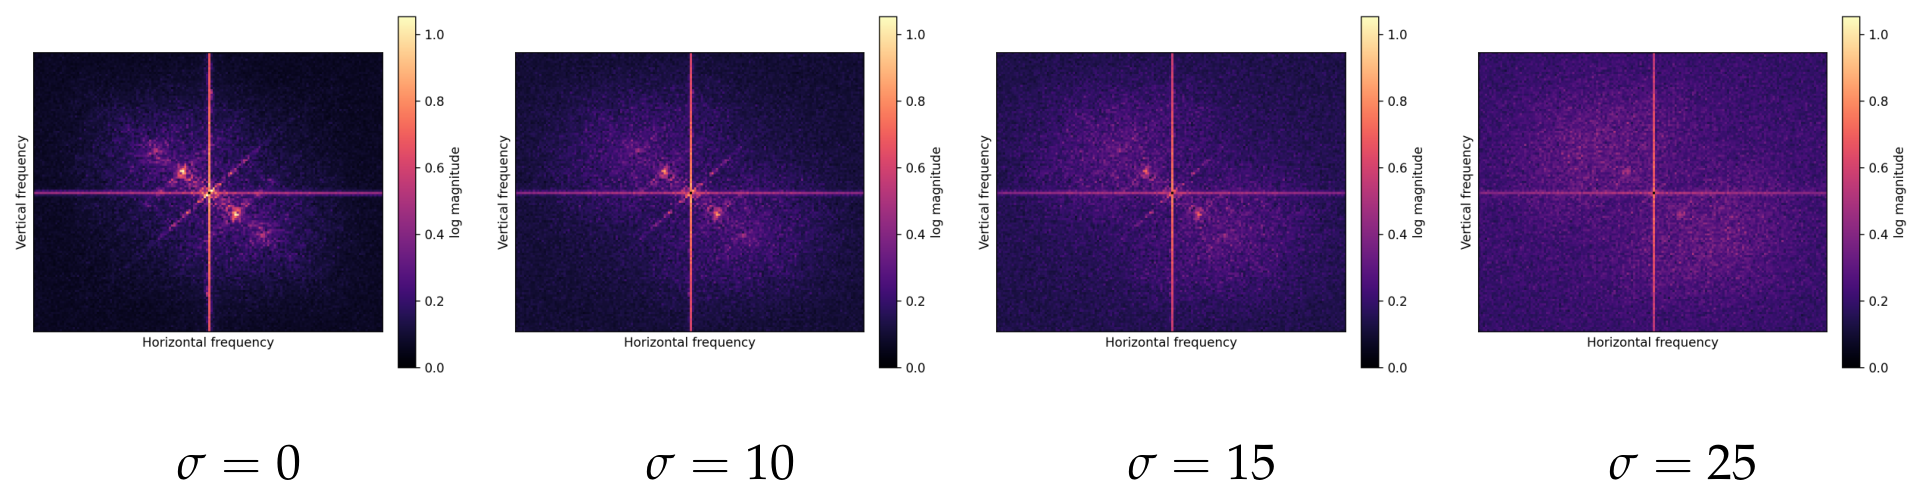
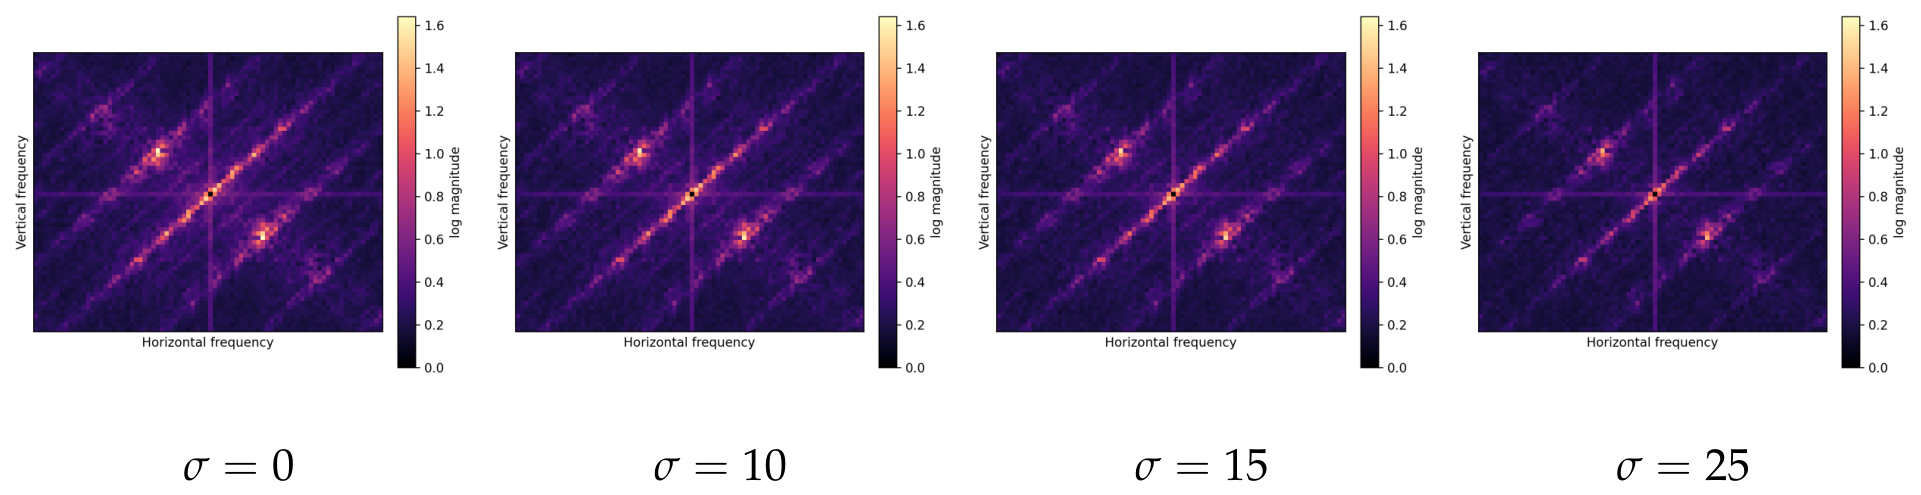
To further investigate this behavior, a frequency-response analysis was conducted using the same eight test samples under Gaussian noise with σ = 0 , 10, 15, and 25. The high-frequency power ratio (HFR), high-to-low frequency power ratio (H/L), and spectral centroid were measured for the SFDE features and DKCF discrepancy responses. Results are shown in Figure 14 and Figure 15, as well as Table 13. The HFR of the SFDE P 2 output progressively increases from 0.2088 under the clean condition to 0.2711, 0.3193, and 0.3784 as the noise intensity increases. The corresponding H/L ratio increases more markedly from 0.5039 to 1.8717, while the spectral centroid shifts from 0.2941 to 0.4064. These results demonstrate an increasingly high-frequency-dominant response in the SFDE output under stronger Gaussian noise.
A similar but weaker trend is observed in the DKCF discrepancy response at the early P 3 fusion level. Its HFR increases from 0.2641 to 0.3523, and the H/L ratio increases from 0.8754 to 1.3632 as σ increases from 0 to 25. In contrast, the HFR values at P 4 and P 5 remain nearly unchanged, changing from 0.2924 to 0.2820 and from 0.2021 to 0.2036, respectively. These observations indicate that noise-related high-frequency responses are concentrated primarily in the low-level SFDE representation and the subsequent early P 3 discrepancy modeling, rather than being uniformly amplified across all fusion scales.
5. Discussion

5.1. Detection Accuracy and Computational Efficiency

The experimental results demonstrate that DDEF-Net provides a favorable balance between detection accuracy and computational complexity. On the DroneVehicle dataset, the complete model improves mAP@0.5 from 81.4% to 84.9% and mAP@0.5:0.95 from 68.6% to 72.6%, corresponding to gains of 3.5 and 4.0 percentage points over the RGB–IR baseline, respectively. Meanwhile, the parameter count increases from 4.1 M to 4.4 M, and the computational cost increases from 9.9 to 12.5 GFLOPs. These results indicate that explicitly modeling cross-modal discrepancies and enhancing low-level structural information can improve multimodal detection without introducing excessive model complexity.
The comparison experiments show that DDEF-Net achieves competitive performance among the methods evaluated under the reported settings. However, the comparison table includes both methods retrained under the present experimental protocol and results directly reported in previous publications. Differences in data partitions, input resolutions, training schedules, preprocessing procedures, and evaluation implementations may affect the reported values. Therefore, the results should be interpreted as evidence of competitiveness under the reported settings rather than as a strictly controlled comparison with every existing method.

5.2. Mechanistic Interpretation and Complementary Roles of DKCF and SFDE

The ablation results in Table 3 indicate that DKCF and SFDE provide complementary improvements. Introducing DKCF alone increases mAP@0.5 from 81.4% to 83.1% and mAP@0.5:0.95 from 68.6% to 70.9%. Introducing SFDE alone produces 83.1% mAP@0.5 and 70.8% mAP@0.5:0.95. When both modules are incorporated, the complete model achieves 84.9% and 72.6%, respectively. The additional improvement obtained by their joint use suggests that the two modules operate at different stages of feature learning.
The SFDE branch-wise ablation shows that neither the Scharr-only nor Fourier-only variant outperforms the baseline, whereas their combination provides a clear improvement, indicating that its benefit mainly arises from complementary spatial-gradient and frequency-domain modeling. For DKCF, the newly added component-level experiments show that Raw Difference achieves 81.2% mAP@0.5 and 68.6% mAP@0.5:0.95, ECA-only achieves 81.5% mAP@0.5 and 68.8% mAP@0.5:0.95, and MLP calibration achieves 81.3% mAP@0.5 and 68.7% mAP@0.5:0.95. In contrast, the complete model achieves 84.9% mAP@0.5 and 72.6% mAP@0.5:0.95. The signed RGB–IR discrepancy also performs better than the absolute and reverse-signed alternatives. These results suggest that the effectiveness of DKCF is associated with directional cross-modal discrepancy modeling and RBF-KAN-based nonlinear channel calibration rather than simply adding an additional feature-calibration structure.
The Scharr directional-fusion ablation further shows that the original signed averaging formulation outperforms both absolute-response averaging and gradient-magnitude fusion while maintaining identical model complexity. This suggests that although signed horizontal and vertical responses may theoretically undergo partial cancellation, preserving gradient polarity is more beneficial than explicitly removing the cancellation effect under the current SFDE architecture.
The discrepancy-gain experiment further shows that λ = 2 provides the best performance among the tested values. Overall, the contribution of DDEF-Net lies in the task-oriented integration of discrepancy-aware calibration and spatial–frequency representation rather than in the novelty of the individual operators themselves.

5.3. Scope and Interpretation of the VEDAI Evaluation

After dataset-specific training on VEDAI, the complete model achieves 72.4% mAP@0.5 and 44.2% mAP@0.5:0.95, compared with 67.9% and 41.1% for the corresponding baseline. These improvements indicate that the proposed modules can also benefit an additional paired visible–NIR UAV dataset. DKCF produces a larger individual improvement than SFDE on VEDAI, while their joint use provides the best performance.
The VEDAI experiment should not, however, be interpreted as zero-shot cross-dataset generalization. The model is trained for 300 epochs on the VEDAI training subset, and the validation subset is used for checkpoint selection and final performance reporting. In addition, VEDAI contains visible and near-infrared imagery, whereas DroneVehicle is treated as a visible–thermal dataset. The sensing mechanisms and spectral characteristics of the two datasets are therefore not identical.
Accordingly, the current VEDAI experiment should be regarded as a supplementary architectural evaluation rather than a direct test of generalization across UAV-based RGB-T datasets. A more rigorous assessment of cross-dataset generalization requires evaluation on independent UAV RGB-T benchmarks with comparable sensing modalities and acquisition characteristics. In particular, validation on datasets such as RGB-T Tiny would provide stronger evidence for assessing the transferability of the proposed method and will be considered in our future work.

5.4. Robustness and Failure Under Image Corruption

The corruption experiments reveal that the robustness of DDEF-Net depends on the corruption type. Under Gaussian blur and motion blur, the complete model consistently outperforms the baseline. This result suggests that the structural-detail enhancement and cross-modal calibration mechanisms can partially alleviate feature degradation caused by blurred boundaries and weakened textures.
In contrast, the complete model performs substantially worse than the baseline under Gaussian noise. Its mAP@0.5 decreases from the baseline value of 30.4% to 17.9%, while mAP@0.5:0.95 decreases from 24.2% to 14.3%. The additional multi-intensity experiments and frequency-response analysis provide further insight into the Gaussian-noise failure mode. Under mild Gaussian noise ( σ = 10 ), DDEF-Net still outperforms the baseline, whereas its robustness advantage disappears as the noise intensity increases. At σ = 15 , the SFDE-only variant exhibits a substantially larger performance decrease than the DKCF-only variant, indicating that the low-level detail-enhancement pathway is more sensitive to moderate Gaussian noise. Under severe noise ( σ = 25 ), both modules are adversely affected, and their joint use results in the largest degradation.
The frequency-response results are consistent with this progressive failure behavior. As Gaussian noise increases from σ = 0 to 25, the SFDE output exhibits a pronounced shift toward high-frequency components, with its high-frequency power ratio increasing from 0.2088 to 0.3784 and its high-to-low frequency power ratio increasing from 0.5039 to 1.8717. Meanwhile, the high-frequency power ratio of the DKCF P 3 discrepancy response increases from 0.2641 to 0.3523, whereas the corresponding responses at P 4 and P 5 show no comparable monotonic increase. Taken together, these results suggest that strong Gaussian noise primarily affects the low-level spatial-frequency representation and can subsequently introduce noise-related responses into early cross-modal discrepancy modeling. The particularly poor performance of the complete model under severe noise is therefore consistent with an interaction between these two effects rather than with a failure of either module in isolation.
Accordingly, the robustness advantage of DDEF-Net should be restricted to the evaluated blur corruptions and mild Gaussian noise rather than generalized to severe random noise. Future work will investigate noise-aware feature gating, adaptive denoising, and modality-reliability estimation to suppress noise-sensitive high-frequency responses before discrepancy-guided fusion. Other practical related degradations, such as lossy compression artifacts, defocusing blur, haze, and sensor degradation of specific modes, were not explicitly evaluated in this study and deserve further investigation.

5.5. Limitations and Future Work

Several limitations should be considered when interpreting the current results. First, the primary UAV RGB-T evaluation in this study is conducted on the DroneVehicle dataset. Although VEDAI is included as a supplementary visible–NIR aerial dataset, it differs from DroneVehicle in sensing modality and spectral characteristics and is evaluated using dataset-specific training and validation. Therefore, the current experiments do not establish cross-dataset generalization across independent UAV RGB-T benchmarks. Future work will evaluate DDEF-Net on additional UAV-based RGB-T datasets, including RGB-T Tiny, to provide a more rigorous assessment of its generalization capability.
Second, the experiments focus primarily on UAV vehicle datasets, and the applicability of DDEF-Net to pedestrians, ships, buildings, and other remote-sensing objects remains unverified.
Third, although DDEF-Net is motivated partly by the difficulty of preserving fine-grained structures in UAV imagery, the COCO-scale evaluation shows that the current gains are more pronounced for medium- and large-scale objects, while AP S is not improved over the baseline. This indicates that the present design should not be interpreted as specifically optimized for COCO-defined small objects. Future work will investigate scale-adaptive detail enhancement and size-aware fusion strategies.
Fourth, the influence of visible–infrared spatial misregistration has not been quantified. Because discrepancy features are calculated at corresponding spatial positions, sensor displacement and viewpoint differences may introduce responses that do not represent meaningful modality complementarity. Artificial translation, rotation, and scale perturbations should therefore be used to evaluate sensitivity to misalignment. Modality-missing and single-modality degradation experiments would further assess fusion reliability.
Finally, the reported inference speed is measured on an RTX 4090D GPU. Although this result demonstrates efficiency on a desktop-class device, it does not directly establish real-time performance on resource-constrained UAV hardware. Future work will therefore evaluate the proposed method on an actual UAV platform equipped with co-mounted visible and thermal cameras. Paired RGB–thermal images will be acquired simultaneously during UAV flights under diverse illumination and environmental conditions. The two sensors will be rigidly mounted with overlapping fields of view, and temporal synchronization and geometric calibration will be performed to obtain spatially corresponding visible–thermal image pairs. The collected image pairs will then be registered, annotated, and used to further evaluate the generalization and practical applicability of DDEF-Net. In addition, latency, memory consumption, and energy usage will be evaluated on embedded computing platforms to assess the feasibility of onboard deployment.

6. Conclusions

This study proposes DDEF-Net, a lightweight difference-guided detail-enhancement fusion network for UAV-based visible–infrared object detection. The proposed DKCF module uses cross-modal discrepancy information to generate nonlinear channel-wise calibration responses, whereas SFDE combines Scharr-gradient priors and Fourier-domain modeling to strengthen low-level structural representations.
On the DroneVehicle dataset, DDEF-Net achieves 84.9% mAP@0.5 and 72.6% mAP@0.5:0.95, improving the RGB–IR baseline by 3.5 and 4.0 percentage points, respectively, while using 4.4 M parameters and 12.5 GFLOPs. Ablation experiments indicate that DKCF and SFDE provide complementary improvements. Additional experiments after dataset-specific training on the VEDAI visible–NIR subset provide supplementary evidence that the proposed modules can remain beneficial under a different paired multimodal aerial-imagery setting. However, these results should not be interpreted as independent evidence of cross-dataset generalization for UAV-based RGB-T detection.
The corruption experiments show improved robustness to Gaussian blur and motion blur. However, the complete model remains sensitive to severe Gaussian noise and performs worse than the baseline under this corruption. Future work will focus on validation across additional independent UAV RGB-T benchmarks, including RGB-T Tiny, as well as noise-aware feature modeling, robustness to cross-modal misregistration and modality failure, size-specific evaluation, multi-seed experiments, and deployment assessment on embedded UAV hardware.

Author Contributions

Conceptualization, Y.L. and Z.C.; methodology, Y.L. and Z.C.; software, Y.L. and Z.C.; validation, J.X.; formal analysis, Y.L. and J.X.; resources, D.M.; writing—original draft preparation, Y.L.; writing—review and editing, Z.C., J.X. and D.M.; visualization, Y.L.; supervision, Z.C. All authors have read and agreed to the published version of the manuscript.

Funding

This research received no external funding.

Informed Consent Statement

Not applicable.

Data Availability Statement

The original contributions and experimental results presented in this study are included in the article. The DroneVehicle dataset is publicly available at https://github.com/VisDrone/DroneVehicle (accessed on 1 April 2026), and the VEDAI dataset is publicly available at https://downloads.greyc.fr/vedai/ (accessed on 7 April 2026). Further inquiries can be directed to the corresponding author.

Conflicts of Interest

The authors declare no conflicts of interest.

References

  1. Liu, Z.; Wang, Y.; Vaidya, S.; Ruehle, F.; Halverson, J.; Soljačić, M.; Hou, T.Y.; Tegmark, M. KAN: Kolmogorov–Arnold Networks. In Proceedings of the Thirteenth International Conference on Learning Representations (ICLR 2025), Singapore, 24–28 April 2025. [Google Scholar]
  2. Li, Z. Kolmogorov–Arnold Networks Are Radial Basis Function Networks. arXiv 2024, arXiv:2405.06721. [Google Scholar]
  3. Chen, R.; Sun, H.; Fan, H.; Wu, P.; Zhang, Z.; Chen, Y. SOO-YOLO: An Efficient Small Object Detection Model for UAV Images. Clust. Comput. 2026, 29, 83. [Google Scholar] [CrossRef] [Scilit]
  4. Sui, Q.; Hosoda, Y.; Lee, J.-H. Swift-YOLO: A Lightweight Architecture for Small Target Detection in Drone Optical Sensors. IEEE Sens. J. 2026, 26, 4212–4224. [Google Scholar] [CrossRef] [Scilit]
  5. Yang, X.; Yan, J.; Liao, W.; Yang, X.; Tang, J.; He, T. SCRDet++: Detecting Small, Cluttered and Rotated Objects via Instance-Level Feature Denoising and Rotation Loss Smoothing. IEEE Trans. Pattern Anal. Mach. Intell. 2023, 45, 2384–2399. [Google Scholar] [CrossRef] [Scilit] [PubMed]
  6. Zhang, P.; Sun, L.; Li, C.; Wang, Q.; Hao, Q.; Lu, J.; Zuo, L.; Ma, X. HA-Tracker: A Hybrid Architecture Tracker with Spatiotemporal Mamba Motion Model for UAV-Based Video Multi-Object Tracking. Remote Sens. 2026, 18, 133. [Google Scholar] [CrossRef] [Scilit]
  7. Wu, J.; Yu, J.; Li, Q.; Tang, Y.; Zhu, M. ED-DETR: An edge-guided dual-branch feature optimization network for enhanced small object detection in UAV images. iScience 2026, 29, 115230. [Google Scholar] [CrossRef] [Scilit] [PubMed]
  8. Tao, Y.; Ding, Y.; Mo, B.; Zhang, B.; Zhao, C.; Li, D. EAGLE-DET: Edge-aware global–local enhancement for small object detection in UAV aerial imagery. Sensors 2026, 26, 3554. [Google Scholar] [CrossRef] [Scilit] [PubMed]
  9. Li, X.; Guo, L.; Shao, Y.; Wang, J.-Q.; Xiao, J.; Yong, B.; Liu, C. HMANet: Hierarchical Multi-Attention Enhancement Network for Infrared Small Target Detection. Infrared Phys. Technol. 2026, 152, 106180. [Google Scholar] [CrossRef] [Scilit]
  10. Lu, P.; Luo, Y.; Zhang, X.; Jia, H.; Xia, S.; Liu, Y. A Wide and Shallow Network Tailored for Infrared Small Target Detection. Remote Sens. 2026, 18, 307. [Google Scholar] [CrossRef] [Scilit]
  11. Yuan, S.; Qin, H.; Yan, X.; Akhtar, N.; Mian, A. SCTransNet: Spatial-Channel Cross Transformer Network for Infrared Small Target Detection. IEEE Trans. Geosci. Remote Sens. 2024, 62, 5002615. [Google Scholar] [CrossRef] [Scilit]
  12. Wu, X.; Hong, D.; Chanussot, J. UIU-Net: U-Net in U-Net for Infrared Small Object Detection. IEEE Trans. Image Process. 2023, 32, 364–376. [Google Scholar] [CrossRef] [Scilit] [PubMed]
  13. Li, J.; Pan, Y. DNR-YOLO: An Infrared Small Object Detection Algorithm for UAV-Based Imagery. Discov. Appl. Sci. 2026, 8, 423. [Google Scholar] [CrossRef] [Scilit]
  14. Li, Y.; He, Y.; Ji, L.; Ren, Q.; Lv, D. SFCD-Det: A Spatial–Frequency Collaborative Architecture for UAV Infrared Small-Object Detection. Appl. Sci. 2026, 16, 7594. [Google Scholar] [CrossRef] [Scilit]
  15. Tang, L.; Yuan, J.; Ma, J. Image Fusion in the Loop of High-Level Vision Tasks: A Semantic-Aware Real-Time Infrared and Visible Image Fusion Network. Inf. Fusion 2022, 82, 28–42. [Google Scholar] [CrossRef] [Scilit]
  16. Hwang, S.; Park, J.; Kim, N.; Choi, Y.; Kweon, I.S. Multispectral Pedestrian Detection: Benchmark Dataset and Baseline. In Proceedings of the IEEE Conference on Computer Vision and Pattern Recognition (CVPR), Boston, MA, USA, 7–12 June 2015; pp. 1037–1045. [Google Scholar] [CrossRef] [Scilit]
  17. Jia, X.; Zhu, C.; Li, M.; Tang, W.; Zhou, W. LLVIP: A Visible-Infrared Paired Dataset for Low-Light Vision. In Proceedings of the IEEE/CVF International Conference on Computer Vision Workshops (ICCVW), Montreal, QC, Canada, 11–17 October 2021; pp. 3496–3504. [Google Scholar] [CrossRef] [Scilit]
  18. Sun, Y.; Cao, B.; Zhu, P.; Hu, Q. Drone-Based RGB-Infrared Cross-Modality Vehicle Detection via Uncertainty-Aware Learning. IEEE Trans. Circuits Syst. Video Technol. 2022, 32, 6700–6713. [Google Scholar] [CrossRef] [Scilit]
  19. Zhang, J.; Lei, J.; Xie, W.; Fang, Z.; Li, Y.; Du, Q. SuperYOLO: Super Resolution Assisted Object Detection in Multimodal Remote Sensing Imagery. IEEE Trans. Geosci. Remote Sens. 2023, 61, 5605415. [Google Scholar] [CrossRef] [Scilit]
  20. Liu, Y.; Chen, Z.; Hu, C.; Li, S.E.; Zhang, X. Semantic-Guided Illumination-Aware Deformable Transformer for RGB-T Object Detection. IEEE Robot. Autom. Lett. 2025, 10, 11936–11943. [Google Scholar] [CrossRef] [Scilit]
  21. Song, K.; Wen, H.; Ji, Y.; Xue, X.; Huang, L.; Yan, Y.; Meng, Q. SIA: RGB-T Salient Object Detection Network with Salient-Illumination Awareness. Opt. Lasers Eng. 2024, 172, 107842. [Google Scholar] [CrossRef] [Scilit]
  22. Gu, A.; Dao, T. Mamba: Linear-Time Sequence Modeling with Selective State Spaces. arXiv 2023, arXiv:2312.00752. [Google Scholar]
  23. Chen, Y.; Zhao, H.; Huang, L.; Yang, Y.; Kang, W.; Zhang, J. TransMambaCC: Integrating Transformer and Pyramid Mamba Network for RGB-T Crowd Counting. Appl. Intell. 2025, 55, 989. [Google Scholar] [CrossRef] [Scilit]
  24. Gan, C.-L.; Jia, R.-S.; Sun, H.-M.; Song, Y.-C. Multi-Modal Mamba Framework for RGB-T Crowd Counting with Linear Complexity. Pattern Recognit. 2026, 172, 112522. [Google Scholar] [CrossRef] [Scilit]
  25. Song, K.; Wen, H.; Xue, X.; Huang, L.; Ji, Y.; Yan, Y. Modality Registration and Object Search Framework for UAV-Based Unregistered RGB-T Image Salient Object Detection. IEEE Trans. Geosci. Remote Sens. 2023, 61, 5531015. [Google Scholar] [CrossRef] [Scilit]
  26. Shen, J.; Chen, Y.; Liu, Y.; Zuo, X.; Fan, H.; Yang, W. ICAFusion: Iterative Cross-Attention Guided Feature Fusion for Multispectral Object Detection. Pattern Recognit. 2024, 145, 109913. [Google Scholar] [CrossRef] [Scilit]
  27. Yuan, M.; Wei, X. C2Former: Calibrated and Complementary Transformer for RGB-Infrared Object Detection. IEEE Trans. Geosci. Remote Sens. 2024, 62, 5403712. [Google Scholar] [CrossRef] [Scilit]
  28. Guo, J.; Gao, C.; Liu, F.; Meng, D.; Gao, X. DAMSDet: Dynamic Adaptive Multispectral Detection Transformer with Competitive Query Selection and Adaptive Feature Fusion. In Proceedings of the European Conference on Computer Vision (ECCV); Springer: Cham, Switzerland, 2024; pp. 464–481. [Google Scholar] [CrossRef] [Scilit]
  29. Luo, M.; Zhao, R.; Zhang, S.; Chen, L.; Shao, F.; Meng, X. IM-CMDet: An Intramodal Enhancement and Cross-Modal Fusion Network for Small Object Detection in UAV Aerial Visible-Infrared Imagery. IEEE Trans. Geosci. Remote Sens. 2025, 63, 5008316. [Google Scholar] [CrossRef] [Scilit]
  30. Wen, X.; Yin, H.; Li, K.; Nie, W.; Zhao, J.; Song, K. CMAI-Det: Cross-Modal Alignment and Interaction for RGB-T Object Detection in Drone Scenes. IEEE Trans. Geosci. Remote Sens. 2025, 63, 5408811. [Google Scholar] [CrossRef] [Scilit]
  31. Yang, H.; Fang, J.; Zhu, Y.; Zhao, X.; Guo, Y.; Zhang, X.; Hu, X.; Yang, X.; Ming, Q. CrossWeaver: Towards Efficient Cross-Modal Interweaving and Decoupling for Weakly-Aligned Multispectral Object Detection. In Proceedings of the IEEE/CVF Conference on Computer Vision and Pattern Recognition (CVPR) Findings; IEEE: Piscataway, NJ, USA, 2026; pp. 6361–6370. [Google Scholar]
  32. Zhu, H.; Dong, W.; Yang, L.; Li, H.; Yang, Y.; Ren, Y.; Zhu, Q.; Feng, Z.; Li, C.; Lin, S.; et al. WaveMamba: Wavelet-Driven Mamba Fusion for RGB-Infrared Object Detection. In Proceedings of the IEEE/CVF International Conference on Computer Vision (ICCV); IEEE: Piscataway, NJ, USA, 2025; pp. 11219–11229. [Google Scholar] [CrossRef] [Scilit]
  33. Chen, C.; Bin, K.; Hu, T.; Qi, J.; Liu, X.; Liu, T.; Liu, Z.; Liu, Y.; Zhong, P. Fusion Meets Diverse Conditions: A High-Diversity Benchmark and Baseline for UAV-Based Multimodal Object Detection with Condition Cues. In Proceedings of the IEEE/CVF International Conference on Computer Vision (ICCV); IEEE: Piscataway, NJ, USA, 2025; pp. 27958–27967. [Google Scholar] [CrossRef] [Scilit]
  34. Li, H.; Xiao, L.; Cao, L.; Wu, D.; Liu, Y.; Li, Y.; Zhang, Y.; Bao, H. CrossModalNet: A Dual-Modal Object Detection Network Based on Cross-Modal Fusion and Channel Interaction. Expert Syst. Appl. 2026, 298, 129677. [Google Scholar] [CrossRef] [Scilit]
  35. Qi, H.; Xiang, X.; Qin, H.; Tai, Y.; Tan, Y. Cross-Modal Transformer Fusion via Local Sampling for Drone RGB-Infrared Object Detection. Neural Netw. 2026, 202, 108997. [Google Scholar] [CrossRef] [Scilit] [PubMed]
  36. Jocher, G.; Qiu, J. Ultralytics YOLO11, version 11.0.0; Computer software; GitHub: San Francisco, CA, USA, 2024. Available online: https://github.com/ultralytics/ultralytics (accessed on 4 April 2026).
  37. Razakarivony, S.; Jurie, F. Vehicle Detection in Aerial Imagery: A Small Target Detection Benchmark. J. Vis. Commun. Image Represent. 2016, 34, 187–203. [Google Scholar] [CrossRef] [Scilit]
  38. Sun, X.; Yu, Y.; Cheng, Q. Low-Rank Multimodal Remote Sensing Object Detection with Frequency Filtering Experts. IEEE Trans. Geosci. Remote Sens. 2024, 62, 5637114. [Google Scholar] [CrossRef] [Scilit]
  39. Zhang, J.; Cao, M.; Xie, W.; Lei, J.; Li, D.; Huang, W.; Li, Y.; Yang, X. E2E-MFD: Towards End-to-End Synchronous Multimodal Fusion Detection. Adv. Neural Inf. Process. Syst. 2024, 37, 52296–52322. [Google Scholar] [CrossRef] [Scilit]
  40. Zhao, T.; Liu, B.; Gao, Y.; Sun, Y.; Yuan, M.; Wei, X. Rethinking Multi-Modal Object Detection from the Perspective of Mono-Modality Feature Learning. In Proceedings of the IEEE/CVF International Conference on Computer Vision (ICCV), Honolulu, HI, USA, 19–25 October 2025; pp. 6364–6373. [Google Scholar] [CrossRef] [Scilit]
  41. Chen, Y.; Wang, B.; Guo, X.; Zhu, W.; He, J.; Liu, X.; Yuan, J. DEYOLO: Dual-Feature-Enhancement YOLO for Cross-Modality Object Detection. In Pattern Recognition, Proceedings of the 27th International Conference on Pattern Recognition (ICPR 2024); Antonacopoulos, A., Chaudhuri, S., Chellappa, R., Liu, C.-L., Bhattacharya, S., Pal, U., Eds.; Lecture Notes in Computer Science; Springer: Cham, Switzerland, 2025; Volume 15317, pp. 236–252. [Google Scholar] [CrossRef] [Scilit]
  42. Gu, Y.; Chen, W.; Peng, D. UAV-Based Multimodal Object Detection via Feature Enhancement and Dynamic Gated Fusion. Pattern Recognit. 2026, 172, 112722. [Google Scholar] [CrossRef] [Scilit]
Figure 1. The overall architecture of the proposed DDEF-Net. ‘C’ denotes feature concatenation, and ‘+’ represents element-wise addition.
Remotesensing 18 03032 g001
Figure 2. Structure of the proposed SFDE module. ‘C’ denotes feature concatenation, and ‘+’ represents element-wise addition. FFT and iFFT denote fast Fourier transform and inverse fast Fourier transform, respectively.
Remotesensing 18 03032 g002
Figure 3. Structure of the proposed DKCF module. ‘×’ represents element-wise multiplication, ‘+’ represents element-wise addition, and ‘−’ represents element-wise subtraction.
Remotesensing 18 03032 g003
Figure 4. Distribution of bounding-box widths and heights normalized by the corresponding image dimensions in the DroneVehicle dataset.
Remotesensing 18 03032 g004
Figure 5. Comparison of DroneVehicle dataset before and after processing.
Remotesensing 18 03032 g005
Figure 6. Feature visualization comparison before and after introducing the DKCF module under extremely dark conditions. The color variations represent different activation intensities, with warmer colors indicating stronger feature responses.
Remotesensing 18 03032 g006
Figure 7. Feature visualization comparison before and after introducing the DKCF module under nighttime conditions. The color variations represent different activation intensities, with warmer colors indicating stronger feature responses.
Remotesensing 18 03032 g007
Figure 8. Feature visualization comparison before and after introducing the DKCF module under foggy conditions. The color variations represent different activation intensities, with warmer colors indicating stronger feature responses.
Remotesensing 18 03032 g008
Figure 9. Feature visualization comparison before and after introducing the SFDE module under small target cluster scenes. The color variations represent different activation intensities, with warmer colors indicating stronger feature responses.
Remotesensing 18 03032 g009
Figure 10. Radar comparison of the proposed DDEF-Net and other RGB-T object detection methods on the DroneVehicle dataset.
Remotesensing 18 03032 g010
Figure 11. Training and validation loss curves.
Remotesensing 18 03032 g011
Figure 12. Precision–recall curves.
Remotesensing 18 03032 g012
Figure 13. Comparison of detection results under different methods. Green dashed circles indicate missed detections, while yellow dashed circles indicate false detections.
Remotesensing 18 03032 g013
Figure 14. Frequency spectra of the SFDE output under different Gaussian noise intensities.
Remotesensing 18 03032 g014
Figure 15. Frequency spectra of the DKCF discrepancy response at the P 3 fusion level under different Gaussian noise intensities.
Remotesensing 18 03032 g015
Table 1. Experimental environment settings.
CategoryParameter
CPUAMD EPYC 9754
GPURTX 4090D
Python3.12
PyTorch2.3.0
RAM24 GB
Table 2. Performance comparison of different input modalities on the DroneVehicle dataset. The best results are highlighted in bold. ‘↑’ indicates that the higher the indicator, the better.
MethodModalityCarFreight CarTruckBusVanmAP@0.5 ↑mAP@0.5:0.95 ↑
YOLO11nRGB94.946.363.390.948.568.852.5
YOLO11nIR98.466.478.295.260.179.767.8
BaselineRGB + IR98.568.481.796.062.281.468.6
Table 3. Ablation study of the proposed DKCF and SFDE modules on the DroneVehicle dataset. The best results are highlighted in bold. ‘↑’ indicates that the higher the indicator, the better, and ‘↓’ indicates that the lower the indicator, the better. ‘✓’ indicates that the corresponding module is used.
MethodModulesmAP@0.5 ↑mAP@0.5:0.95 ↑Params (M) ↓GFLOPs ↓
DKCFSFDE
Baseline--81.468.64.19.9
A-83.170.94.310.6
B-83.170.84.211.8
C84.972.64.412.5
Table 4. Performance improvement after introducing the DKCF module. The best results are highlighted in bold.
CategoryAP@0.5AP@0.5:0.95
Car+0.03+0.72
Freight car+2.32+2.66
Truck+1.61+2.44
Bus+0.47+1.87
Van+4.05+4.02
Table 5. Controlled ablation analyses of the DKCF module on the DroneVehicle dataset. The SFDE module is retained, and only the internal formulation of DKCF is modified. The best results are highlighted in bold. ‘↑’ indicates that the higher the indicator, the better, and ‘↓’ indicates that the lower the indicator, the better.
(a) Component-level ablation
MethodsmAP@0.5 ↑mAP@0.5:0.95 ↑Params (M) ↓GFLOPs ↓
No Difference80.968.54.211.9
Raw Difference81.268.64.312.2
ECA Only81.568.84.312.2
MLP Calibration81.368.74.312.2
DDEF-Net84.972.64.412.5
(b) Discrepancy formulation
MethodsmAP@0.5 ↑mAP@0.5:0.95 ↑Params (M) ↓GFLOPs ↓
Absolute Difference81.769.14.412.5
Reverse81.468.84.412.5
DDEF-Net84.972.64.412.5
(c) Sensitivity to discrepancy gain λ
MethodsmAP@0.5 ↑mAP@0.5:0.95 ↑Params (M) ↓GFLOPs ↓
λ = 0.5 81.368.64.412.5
λ = 1 83.671.94.412.5
λ = 2 (DDEF-Net)84.972.64.412.5
λ = 3 80.968.34.412.5
Table 6. Branch-wise ablation study of the SFDE module on the DroneVehicle dataset. The best results are highlighted in bold. ‘↑’ indicates that the higher the indicator, the better, and ‘↓’ indicates that the lower the indicator, the better. ‘✓’ indicates that the corresponding module is used.
MethodBranchesmAP@0.5 ↑mAP@0.5:0.95 ↑Params (M) ↓GFLOPs ↓
ScharrFourier
Baseline--81.468.64.19.9
Scharr-only-80.567.54.19.9
Fourier-only-80.367.64.111.5
SFDE83.170.84.211.8
Table 7. Ablation study of Scharr directional fusion strategies in SFDE on the DroneVehicle dataset. Absolute Average denotes E absolute = ( | G x | + | G y | ) / 2 , Gradient Magnitude denotes E magnitude = G x 2 + G y 2 + ϵ , and Signed Average (Original) corresponds to the original formulation E signed = ( G x + G y ) / 2 , where ϵ = 10 6 . The best results are highlighted in bold. ‘↑’ indicates that the higher the indicator, the better, and ‘↓’ indicates that the lower the indicator, the better.
MethodmAP@0.5 ↑mAP@0.5:0.95 ↑Params (M) ↓GFLOPs ↓
Absolute Average79.368.94.211.8
Gradient Magnitude79.669.24.211.8
Signed Average (Original)83.170.84.211.8
Table 8. Scale-specific AP of the ablation models on the DroneVehicle dataset under the COCO area definitions. AP S , AP M , and AP L are averaged over IoU thresholds from 0.50 to 0.95. The best result in each column is highlighted in bold. ‘✓’ indicates that the corresponding module is used.
MethodsModules AP S (%) AP M (%) AP L (%)
DKCFSFDE
Baseline--26.3065.8947.83
A-26.1867.8455.70
B-24.4067.1257.03
C25.7668.6157.62
Table 9. Performance improvement after introducing the SFDE module. The best results are highlighted in bold.
CategoryAP@0.5AP@0.5:0.95
Car+0.01+0.52
Freight car+2.81+2.96
Truck+2.09+2.74
Bus−0.02+1.33
Van+3.95+3.75
Table 10. Comparison of different RGB-T object detection methods on the DroneVehicle dataset. The best results are highlighted in bold. ‘↑’ indicates that the higher the indicator, the better, and ‘↓’ indicates that the lower the indicator, the better.
MethodCarFreight CarTruckBusVanmAP@0.5 ↑mAP@0.5:0.95 ↑Params (M) ↓GFLOPs ↓
UA-CMDet * [18]87.546.860.787.138.064.0-138.7-
LF-MDet * [38]82.259.673.686.657.071.8-38.777.7
E2E-MFD * [39]90.364.679.389.863.177.4-31.3105.5
M2D-LIF * [40]97.867.981.096.064.681.468.137.1-
DEYOLO [41]98.568.882.096.263.381.769.55.815.6
DEGF-YOLO * [42]98.171.383.696.466.383.1-19.9-
DDEF-Net (Ours)98.674.485.796.769.384.972.64.412.5
Table 11. Ablation study of the proposed DKCF and SFDE modules on the VEDAI dataset. The best results are highlighted in bold. ‘↑’ indicates that the higher the indicator, the better, and ‘↓’ indicates that the lower the indicator, the better. ‘✓’ indicates that the corresponding module is used.
MethodModulesmAP@0.5 ↑ mAP@0.5:0.95 ↑Params (M) ↓GFLOPs ↓
DKCFSFDE
Baseline--67.941.14.19.7
A-70.442.84.310.3
B-68.041.74.111.6
C72.444.24.312.2
Table 12. Ablation study of the proposed DKCF and SFDE modules under different interference conditions. The best results are highlighted in bold. ‘↑’ indicates that the higher the indicator, the better. ‘✓’ indicates that the corresponding module is used.
MethodModulesGaussian BlurMotion BlurGaussian Noise
DKCFSFDEmAP@0.5 ↑mAP@0.5:0.95 ↑mAP@0.5 ↑mAP@0.5:0.95 ↑mAP@0.5 ↑mAP@0.5:0.95 ↑
Baseline--71.659.550.839.230.424.2
A-74.362.256.144.123.919.5
B-73.861.454.242.422.518.2
C76.764.158.745.817.914.3
Table 13. Ablation study under different Gaussian noise intensities. The best results are highlighted in bold. ‘↑’ indicates that the higher the indicator, the better. ‘✓’ indicates that the corresponding module is used.
MethodModules σ = 0 σ = 10 σ = 15 σ = 25
DKCFSFDEmAP@0.5 ↑mAP@0.5:0.95 ↑mAP@0.5 ↑mAP@0.5:0.95 ↑mAP@0.5 ↑mAP@0.5:0.95 ↑mAP@0.5 ↑mAP@0.5:0.95 ↑
Baseline--79.667.266.855.655.945.730.424.2
A-81.970.172.361.255.546.723.919.5
B-81.368.864.753.948.940.422.518.2
C82.870.269.958.647.839.617.914.3
Disclaimer/Publisher’s Note: The statements, opinions and data contained in all publications are solely those of the individual author(s) and contributor(s) and not of MDPI and/or the editor(s). MDPI and/or the editor(s) disclaim responsibility for any injury to people or property resulting from any ideas, methods, instructions or products referred to in the content.