Article

Identification of Snowfall Riming and Aggregation Processes Using Ground-Based Triple-Frequency Radar

1
Laboratory of Middle Atmosphere and Global Environment Observation, Institute of Atmospheric Physics, Chinese Academy of Sciences, Beijing 100029, China
2
University of Chinese Academy of Sciences, Beijing 101408, China
*
Author to whom correspondence should be addressed.
These authors contributed equally to this work.
Remote Sens. 2026, 18(17), 3034; https://doi.org/10.3390/rs18173034
Submission received: 26 May 2026 / Revised: 28 August 2026 / Accepted: 3 September 2026 / Published: 5 September 2026
(This article belongs to the Section Atmospheric Remote Sensing)

Highlights

What are the main findings?
  • Vertical gradients of triple-frequency DWR, Doppler velocity, spectral width, and LDR distinguish riming- and aggregation-dominated snow-growth layers.
  • The gradient-based method resolves mixed regimes and riming-to-aggregation transitions more clearly than fixed multi-parameter thresholds.
What are the implications of the main findings?
  • Tracking relative vertical changes yields a physically consistent classification that is less dependent on absolute radar thresholds and systematic offsets.
  • The framework can support improved snowfall retrievals, ice-phase microphysics parameterizations, and snowfall forecasts.

Abstract

Riming and aggregation are critical ice-phase microphysical processes in winter clouds, but their overlapping signatures and dynamic transitions pose challenges for conventional single-frequency radar detection. We introduce a novel gradient-based identification method using ground-based triple-frequency dual-polarization radar observations. By analyzing vertical gradients of triple-frequency radar variables, rather than their absolute values, we discern these microphysical processes through physically based thresholds that reflect particle growth regimes. This approach captures subtle spatiotemporal variations in riming and aggregation that conventional threshold methods would miss, particularly in resolving layered riming-aggregation transitions. The dynamic gradient-based method demonstrates enhanced physical consistency and adaptability near process boundaries, thereby improving the tracking of ice-particle evolution. These advances provide a pathway to refine microphysical parameterizations and enhance high-resolution snowfall forecasting.

1. Introduction

Ice-phase microphysical processes in winter snowfall clouds, particularly riming and aggregation as the critical ice particle growth mechanisms, significantly influence snowfall formation and prediction. However, substantial uncertainties remain in our current understanding and quantitative characterization of these processes [1]. Riming refers to the process where super-cooled cloud droplets rapidly freeze upon collision with ice crystals or snowflakes and adhere to their surfaces, while aggregation describes the microphysical process where ice crystals collide and bond within clouds to form larger snowflakes or snow clusters. The two processes markedly alter the size, shape, and density of snow particles, thereby affecting snowfall intensity and even precipitation phase. In winter snowfall clouds, riming and aggregation often occur simultaneously alongside other processes such as sedimentation and fragmentation. These complex and variable microphysical processes are difficult to effectively distinguish using single-band radar observations alone. The parameterization of ice-phase processes in numerical models remains inadequate, leading to significant uncertainties in snowfall forecasts. Therefore, utilizing advanced radar observations to identify the evolution of riming and aggregation processes in snowfall clouds is of great scientific significance for improving the understanding of ice-phase microphysics and enhancing snowfall prediction accuracy.
Advances in radar technology have enabled new possibilities for investigating the microphysical mechanisms of snowfall formation through dual- and triple-frequency radar observations [2]. By systematically analyzing the scattering and absorption differences of hydrometeors at different frequencies and comprehensively utilizing radar observation parameters, including radar reflectivity (Ze), mean Doppler velocity (MDV), spectral width (SW), and linear depolarization ratio (LDR), multi-dimensional microphysical information such as particle size, density, phase, and shape can be effectively retrieved [3]. Newly rimed particles are compact and nearly spherical (2–5 mm) with high density. In contrast, aggregated particles are formed by the collision and combination of multiple ice crystals, exhibiting characteristics such as larger sizes (up to ~20 mm), lower density, loose structure, and irregular shape [4,5,6,7,8]. These microphysical characteristics lead to pronounced differences in radar observations between riming- and aggregation-dominated regions. In riming-dominated areas with abundant liquid water, Ze typically ranges from 14 to 55 dBZ, consistent with the prevalence of graupel and other dense rimed snow particles. By contrast, in aggregation-dominated regions, owing to ice’s lower dielectric constant and the porous nature of aggregates, Ze typically ranges from 15 to 33 dBZ [9,10,11,12]. MDV, representing the mean fall velocity, and SW, indicating the spread of particle velocities, are closely related to particle size, density, and shape, making them widely useful for particle identification. Rimed particles are denser and more compact (often nearly spherical), leading to significantly faster fall speeds and broader velocity distributions than aggregates. Observations show that heavily rimed particles can have MDV exceeding 1.5 m/s [13,14]. In contrast, aggregate snowflakes are low-density clumps of ice crystals with large, irregular shapes. As aggregates grow larger, their increasing mass is largely offset by greater drag from their extended form, so their terminal velocities remain modest. Typically, aggregate-dominated snowfall exhibits moderate MDV on the order of 0.5–1.0 m/s and a narrow velocity spread (SW often <0.3 m/s) [15,16]. LDR quantifies a particle’s deviation from sphericity and the consistency of its orientation. Aggregated snowflakes are typically large and irregularly shaped, which leads to stronger depolarization returns. Consequently, the LDR values of aggregated snow are significantly less negative than those of rimed particles. Specifically, aggregated snowflakes exhibit LDR values around −15 to −18 dB, which can increase to about −10 dB as they near melting [17,18,19]. In contrast, rimed particles, being nearly spherical due to a smooth ice coating and high symmetry, produce virtually no cross-polarized return; as a result, their LDR values are extremely low, typically between −36 and −26 dB [5,19,20,21].
Beyond direct multi-frequency radar reflectivity measurements, dual-wavelength ratios (DWR) provide a new perspective for identifying riming and aggregation. When particle diameters are much smaller than radar wavelengths, all frequencies operate in the Rayleigh scattering regime, and DWR differences are minimal. For rimed particles (~2–5 mm), the W-band wavelength (~3 mm) is comparable to particle size, causing non-Rayleigh scattering (i.e., Ze is non-monotonic with particle size); at Ka-band (~8.6 mm), scattering lies in the transition between Rayleigh and Mie regimes; while at X-band (3 cm), particles still satisfy the Rayleigh approximation (Ze ∝ D6, where D denotes particle diameter). Consequently, riming leads to significant increases in DWRKa−W but only modest increases in DWRX−Ka [17,22,23,24]. For larger aggregated particles (~5–20 mm), both W- and Ka-band observations fall within the Mie regime—with Ze oscillating rather than increasing monotonically with size—causing DWRKa−W to saturate at roughly 7–10 dB [17]. However, at X-band, where scattering transitions from Rayleigh to Mie for these larger particles, Ze continues to grow significantly with aggregate size, driving continued increases in DWRX−Ka and producing the characteristic “triple-frequency DWR hook” pattern [22,25,26].
Given that the vertical gradients of radar observables contain rich information about precipitating particle evolution, Planat et al. [27] introduced the Process Identification based on Vertical Gradient Signs (PIVS) method using a single-frequency dual-polarization radar. Their pioneering work demonstrated that vertical gradients of Ze and its polarimetric profiles can effectively indicate zones where riming and aggregation processes coexist. Kumjian et al. [28] provide a comprehensive review illustrating that vertical gradients of dual-polarization radar observables serve as distinctive “fingerprints” of precipitation microphysical processes, including those in the ice phase. These studies provided an important foundation for radar-based snowfall microphysical classification. While PIVS successfully identified coexistence regions, it could not distinguish riming-dominated from aggregation-dominated layers.
Precipitation particles in winter clouds exhibit pronounced spatiotemporal variability in their microphysical properties (density, size, and shape). This variability makes it particularly challenging to distinguish rimed from aggregated particles using any single radar measurement alone [12,27,29]. To overcome these difficulties, we developed an improved identification method using ground-based triple-frequency radar observations. Building upon the vertical-gradient concept of Planat et al. [27], our technique exploits the vertical gradient signatures of multiple radar parameters. In particular, we incorporate DWR, MDV, SW, and LDR into the analysis. By simultaneously tracking changes in particle size, density, and shape with height, this multi-parameter, triple-frequency approach provides a more robust physical framework for process identification. As a result, it offers enhanced sensitivity to subtle microphysical process transitions and greater flexibility in capturing regions where riming and aggregation processes transition or coexist—capabilities beyond those of conventional threshold-based methods or the original single-frequency PIVS approach.
The paper is organized as follows: Section 2 describes the observational dataset and methodological framework; Section 3 presents the results and compares the two identification methods; Section 4 discusses method performance, limitations, and future applications; and Section 5 summarizes the main conclusions.

2. Materials and Methods

2.1. Data

The ground-based triple-frequency (X, Ka, W band) Doppler radar observations used in this study were collected from “The TRIple-frequency and Polarimetric radar Experiment for improving process observation of winter precipitation (TRIPEx)” (https://doi.org/10.5281/zenodo.1341389) campaign. TRIPEx was a joint field experiment by the University of Cologne, the University of Bonn, the Karlsruhe Institute of Technology (KIT), and the Jülich Research Centre (Forschungszentrum Jülich, FZJ). The radar instrumentation in TRIPEx consisted of three co-located Doppler radars at X, Ka, and W bands. The X-band radar (frequency 9.4 GHz) was a mobile Meteor 50DX precipitation radar manufactured by Selex ES (formerly Gematronik, Neuss, Germany). It operated in a simultaneous transmit and receive (STAR) polarimetric mode, measuring standard polarimetric variables (e.g., ZDR, φDP), with a sensitivity of approximately −10 dBZ at 5 km range and a native range resolution of 30 m. The Ka-band radar (35.5 GHz) was a JOYRAD-35 cloud radar of type MIRA-35 built by Metek (Meteorologische Messtechnik GmbH, Elmshorn, Germany). It transmitted linearly polarized pulses and received co- and cross-polarized signals to derive the linear depolarization ratio (LDR), with a sensitivity of around −39 dBZ at a range of 5 km and a range resolution of 28.8 m. The W-band radar (94 GHz), named JOYRAD-94, was a frequency-modulated continuous-wave (FMCW) cloud radar manufactured by Radiometer Physics GmbH (RPG, Meckenheim, Germany). This W-band system had no polarimetric capability and achieved about −33 dBZ sensitivity at 5 km, with a range resolution varying from 16 m to 34.1 m depending on altitude (due to its multi-chirp configuration). Their outputs were re-gridded onto a common time–height grid with 30 m vertical spacing to facilitate multi-frequency analysis.
For this study, we use the Level-2 processed TRIPEx dataset released by Dias Neto et al. [17]. The X-, Ka-, and W-band reflectivities were corrected for attenuation by atmospheric gases using PAMTRA together with the Rosenkranz gas-absorption model. In addition, the relative DWRs were adjusted using small ice particles in the upper frozen cloud, where Rayleigh scattering is expected. At the upper-cloud reference region, this adjustment accounts for the combined effects of cumulative frequency-dependent attenuation from lower levels, residual inter-radar calibration offsets, and radome or antenna attenuation. The processing was specifically optimized to improve the data quality in the ice and snow part of the cloud, which is the principal region analyzed in this study. Accordingly, the Level-2 processing includes atmospheric-gas attenuation correction and a Rayleigh-based relative DWR adjustment optimized for the upper frozen cloud. The Level-2 product provides separate quality flags for the X–Ka and Ka–W relative-offset estimates. Bit 15, indicating fewer than 300 valid reflectivity pairs for offset estimation, was excluded from the primary analysis. Profiles flagged by bit 14 in either DWR pair were retained, and the corresponding periods were shaded in the process-identification results presented in Section 3.3 to indicate additional relative-offset uncertainty. Bit 13 was retained because, although it indicates potential radar-volume mismatch, Dias Neto et al. [17] noted that its removal may also discard scientifically interesting measurements from strong-reflectivity-gradient regions.
For the vertically pointing observations analyzed in this study, the Doppler velocities at all three frequencies follow the same sign convention: negative MDV denotes radial motion toward the radar, corresponding to downward motion, whereas positive MDV denotes radial motion away from the radar, corresponding to upward motion. Myagkov et al. [30] utilized data from the later TRIPEx-pol campaign (2018–2019) to refine multi-frequency radar calibration techniques. Karrer et al. [29] analyzed triple-frequency radar signatures in melting precipitation using the TRIPEx-pol observations to investigate snow-to-rain transition processes. These efforts, although based on the follow-on TRIPEx-pol dataset, highlight the unique advantages of triple-frequency radar measurements for revealing detailed snowfall microphysical processes. In this paper, we focus on a case study from 3 to 4 January 2016 and use the triple-frequency radar observations from the TRIPEx 2015–2016 dataset to identify signatures of riming and aggregation during a winter snowfall event.
To provide the thermodynamic context for the sublimation analysis, hourly ERA5 pressure-level data [31] were examined over the full snowfall event from 12:00 UTC on 3 January to 12:00 UTC on 4 January 2016. Temperature, specific humidity, and geopotential data were extracted from the grid point nearest to the JOYCE site and its four adjacent grid points at the native pressure levels. Geopotential heights were converted to height above ground level using the JOYCE site elevation of 111 m. Relative humidity with respect to ice (RHi) was calculated from ERA5 temperature, specific humidity, and pressure using the ice-saturation vapor-pressure formulation of Murphy and Koop [32]. The five-grid-point median and interquartile range were used to characterize the humidity environment while accounting for the horizontal variability around the site.

2.2. Riming and Aggregation Identification Methods

Here, we adopt two methods to identify riming and aggregation during the snowfall event, focusing on the active ice particle growth zone extending from the melting layer to the altitude at which the temperature is approximately −15 °C [7,33].

2.2.1. Multi-Parameter Threshold Method

Unlike previous studies that relied on a single parameter or combinations of only two or three parameters, the Multi-Parameter Threshold Method uses six parameter groups: Ka-band Ze, MDV, SW, and LDR; the triple-frequency DWR signature; and the volume-weighted mean diameter D0. Although Ze, MDV, SW, and LDR are obtained from the Ka-band radar, the X- and W-band reflectivities are explicitly incorporated through D W R X K a and D W R K a W and indirectly through the multi-frequency retrieval of D0. D0 is retrieved iteratively based on the relationship between DWR and particle attenuation [34]. Gaussiat et al.’s method assumes that attenuation at W-band is dominated by liquid water, effectively neglecting any ice-induced attenuation. In the present study, the retrieval is applied to the TRIPEx Level-2 reflectivities after atmospheric-gas attenuation correction and Rayleigh-based relative DWR adjustment. The upper-frozen-cloud calibration substantially reduces relative DWR offsets associated with cumulative lower-level attenuation and inter-radar biases in the ice-phase region, making the Level-2 product more suitable for the present D0 retrieval. Mason et al. [26] showed that triple-frequency radar signatures at 10, 35, and 95 GHz converge for median volume diameters below approximately 2 mm because non-Rayleigh scattering is weak at all three frequencies, providing limited information on ice and snow particles in this size range. Therefore, to focus the analysis on samples with sufficiently distinguishable triple-frequency scattering signatures, only time–height samples with D0 > 2 mm were retained. Table 1 lists the specific criteria for identifying riming and aggregation using the six parameters: if a given parameter meets the criterion for riming or aggregation, it contributes a score of 1. To ensure robust identification, a total score greater than 3 (i.e., satisfying more than half of the six criteria) is required to classify the process as riming or aggregation; otherwise, it is labeled as “uncertain”. If the two scores are equal, or if neither score exceeds 3, the pixel is labeled as uncertain.

2.2.2. Gradient-Based Multi-Parameter Identification Method

To further improve the flexibility and robustness of the identification, we introduce a gradient-based multi-parameter vertical-gradient (VG) method that extends the single-frequency PIVS concept of Planat et al. [27] to a triple-frequency radar framework. This new VG approach leverages combined information from multiple radar observables to more comprehensively discriminate between regions dominated by riming and those dominated by aggregation. In particular, we jointly analyze the vertical gradients of various radar parameters (e.g., DWR, MDV, SW, and LDR). By exploiting these multi-parameter gradient signatures, the method becomes more sensitive to microphysical changes with height and more adept at capturing process transitions or coexistence of riming and aggregation than earlier single-parameter approaches. Before computing the vertical gradients, we applied temporal and vertical smoothing to the radar data to reduce small-scale fluctuations while preserving the underlying microphysical signal. Specifically, the radar variables were smoothed using a second-order Savitzky–Golay (SG) [35] filter with a 10 min temporal window and a five-gate vertical window. Given the 4 s temporal sampling, the temporal window contained 151 profiles and spanned 10 min, while the five vertical gates corresponded to 150 m on the common 30 m grid. Following the rationale of Planat et al. [27], the 10 min temporal window was selected as a compromise between suppressing short-period fluctuations and retaining microphysical variability on minute timescales. The five-gate vertical window was selected as the shortest odd window that produces nontrivial smoothing with a second-order SG filter, thereby reducing gate-to-gate fluctuations while limiting the loss of narrow vertical structures. To assess the sensitivity of the classification to these settings, the analysis was repeated using temporal windows of approximately 5, 10, and 15 min and vertical windows of 5, 7, and 9 gates, corresponding to 150, 210, and 270 m, respectively, while all other processing and classification criteria were held fixed. Relative to the fixed 10 min–five-gate baseline, the overall exact agreement across the eight alternative smoothing configurations ranged from 93.1% to 95.7%, while the classified coverage remained nearly constant at 20.9–21.1%. In addition, 93.5–96.5% of the changed pixels were located at or immediately adjacent to classification boundaries. These results indicate that the large-scale time–height distributions of riming and aggregation remained broadly consistent across the tested settings, whereas the precise locations of narrow process boundaries and short-duration local features showed moderate sensitivity.
The vertical gradient of a radar variable is defined as P = Δ P Δ h , where Δ P = P u p p e r P l o w e r is the change between two adjacent height levels for the variable P (e.g., DWR, MDV, SW, or LDR); Δh is the vertical height difference (m); the negative sign represents the gradient from top to bottom. To reduce the influence of potential measurement noise and scale-sensitive gate-to-gate fluctuations on gradient-sign determination, we introduced a three-scale vertical sign-stability screening step. With the temporal window fixed at 10 min, each gradient field was recalculated using vertical Savitzky–Golay windows of five, seven, and nine gates. For each gradient field, a positive or negative sign was retained only when all three vertical smoothing configurations produced the same strictly positive or strictly negative sign. Across the three vertical smoothing scales, the fractions of bins retaining a consistent gradient sign were 76.93% for D W R X K a , 72.52% for D W R K a W , 85.62% for MDV, 78.08% for SW, and 66.71% for LDR.
Given the importance of DWR in triple-frequency radar observations, this method retains the absolute DWR criterion from Table 1 and also uses D W R to provide additional information. For example, if the X–Ka band DWR increases downward ( D W R X K a > 0) while the change in Ka–W band DWR is negligible, it indicates that during the falling process, the particle size grows significantly, but the density does not increase proportionally, which is a characteristic of aggregation [36]. In contrast, if the D W R K a W increases markedly with little change in the D W R X K a , it implies that particles become denser (without a large size increase) as they fall, a signature more consistent with riming. For Doppler velocity, a negative vertical gradient ( M D V < 0, meaning fall speed increases with decreasing height) typically indicates the presence of the riming process. Ice particles become heavier and denser, leading to larger terminal fall velocities during the riming process [1]. Riming tends to introduce heavier, denser ice particles (graupel) that fall much faster than the original snow crystals. Thus, a riming-dominated layer often contains fast-falling rimed particles coexisting with remaining slower unrimed crystals, which produces a broad SW. Turbulence or updrafts associated with super-cooled liquid water can further enhance this spectral broadening. Consequently, SW typically increases with decreasing height in riming regions (i.e., ∇SW > 0), reflecting the growing velocity spread due to newly formed graupel. Conversely, one might expect a positive gradient (∇MDV > 0, slower fall speeds at lower altitudes) in an aggregation-dominated region, since aggregation produces large, fluffy snowflakes that experience greater drag and could fall more slowly. In practice, however, the increased mass of aggregated snowflakes often still yields slightly higher or nearly constant fall speeds with descent, so a pronounced ∇MDV > 0 is seldom observed. In other words, MDV tends to remain steady or increase marginally toward the ground in aggregation layers. As many small crystals coalesce into large aggregates, the diversity of fall speeds can actually diminish at lower altitudes. Aggregation-dominated layers are therefore characterized by a narrowing SW with descent, resulting in ∇SW < 0. In practice, radar sample volumes typically contain mixed hydrometeors, so riming and aggregation often occur simultaneously. Consequently, variations in LDR reflect changes in particle shape and orientation with height, providing probabilistic clues rather than definitive signatures of the dominant process. Generally, riming tends to make ice crystals more rounded and symmetric, which usually leads to a decrease in LDR with descent. Conversely, aggregation often produces larger and more irregular clumps, increasing particle non-sphericity and potentially causing LDR to increase toward the ground. However, different particle habits can produce counterintuitive LDR behavior: for example, an aggregate of needle-like crystals may exhibit a lower-than-expected LDR if the needles align into a symmetric cluster, whereas a heavily rimed aggregate can retain irregular features such as rime accretions on branches, which keep its LDR higher than that of a smooth graupel. Therefore, our classification scheme relies on multiple radar parameters rather than LDR alone. We require consistent signatures across several radar variables to conclusively identify riming- or aggregation-dominated regions, ensuring that no single parameter is used in isolation to make microphysical inferences.
Based on the above analysis of vertical gradients, we establish threshold criteria for identifying riming and aggregation from these gradient behaviors (Table 2).
The five criteria used in this method consist of the absolute DWR criterion retained from Table 1 and four gradient-based criteria based on DWR, MDV, SW, and LDR. Similar to the multi-parameter threshold method, to ensure reliable classification, we require a riming or aggregation total score > 2 (i.e., meeting more than half of the five criteria) to classify the process as riming or aggregation.

2.2.3. Quantitative DWR-Space Assessment and DWR-Withheld Analysis

To complement the visual interpretation of the triple-frequency diagrams, the positions of the radar observations relative to the reference riming and aggregation curves were quantified in the D W R K a W D W R X K a space. To place the two axes on comparable numerical scales, the observations and the fixed riming and aggregation reference polylines were transformed using axis-wise reference-curve-range scaling, x n = x s x and y n = y s y , where s x = 13.9137 dB and s y = 13.2522 dB were the full coordinate ranges spanned by the pooled vertices of the two reference curves. After this coordinate scaling, the minimum Euclidean distance from each transformed observation to all line segments of each transformed reference polyline was calculated and denoted by drime and dagg, respectively. A continuous DWR preference index was then defined as M = d r i m e d a g g d r i m e + d a g g . Positive M values indicate a greater proximity to the aggregation reference curve, whereas negative values indicate a greater proximity to the riming reference curve. Samples with ∣M∣ < 0.10 were treated as ambiguous. The 0.10 criterion was specified before the comparison analysis as a symmetric operational near-equidistance band; for non-tied samples, a directional preference was assigned only when the larger curve distance was at least approximately 1.222 times the smaller distance. Ambiguity thresholds of 0.05, 0.15, and 0.20 and calculations in the unscaled dB plane were additionally evaluated as sensitivity tests, without changing the principal interval interpretations or method-comparison directions. Descriptive confidence intervals for the four representative intervals were obtained using 2 min whole-profile block resampling, while whole-event differences were evaluated using 30 min time blocks.
Because DWR and the DWR-derived D0 contribute to the complete classifiers, an additional DWR-withheld analysis was performed to examine whether the remaining radar observables retained physically coherent process information without direct DWR input. During label generation, D W R X K a , D W R K a W , their vertical gradients and D0 were excluded. The reduced threshold classifier used Ka-band Ze, MDV, SW, and LDR, whereas the reduced gradient classifier used only the vertical gradients of MDV, SW, and LDR. The primary ablation used a conservative unanimity rule, requiring agreement of all four retained threshold indicators or all three retained gradient indicators. A relaxed majority-vote rule, requiring three of four threshold indicators or two of three gradient indicators, was additionally evaluated as a sensitivity test.

3. Results

3.1. Case Study Description

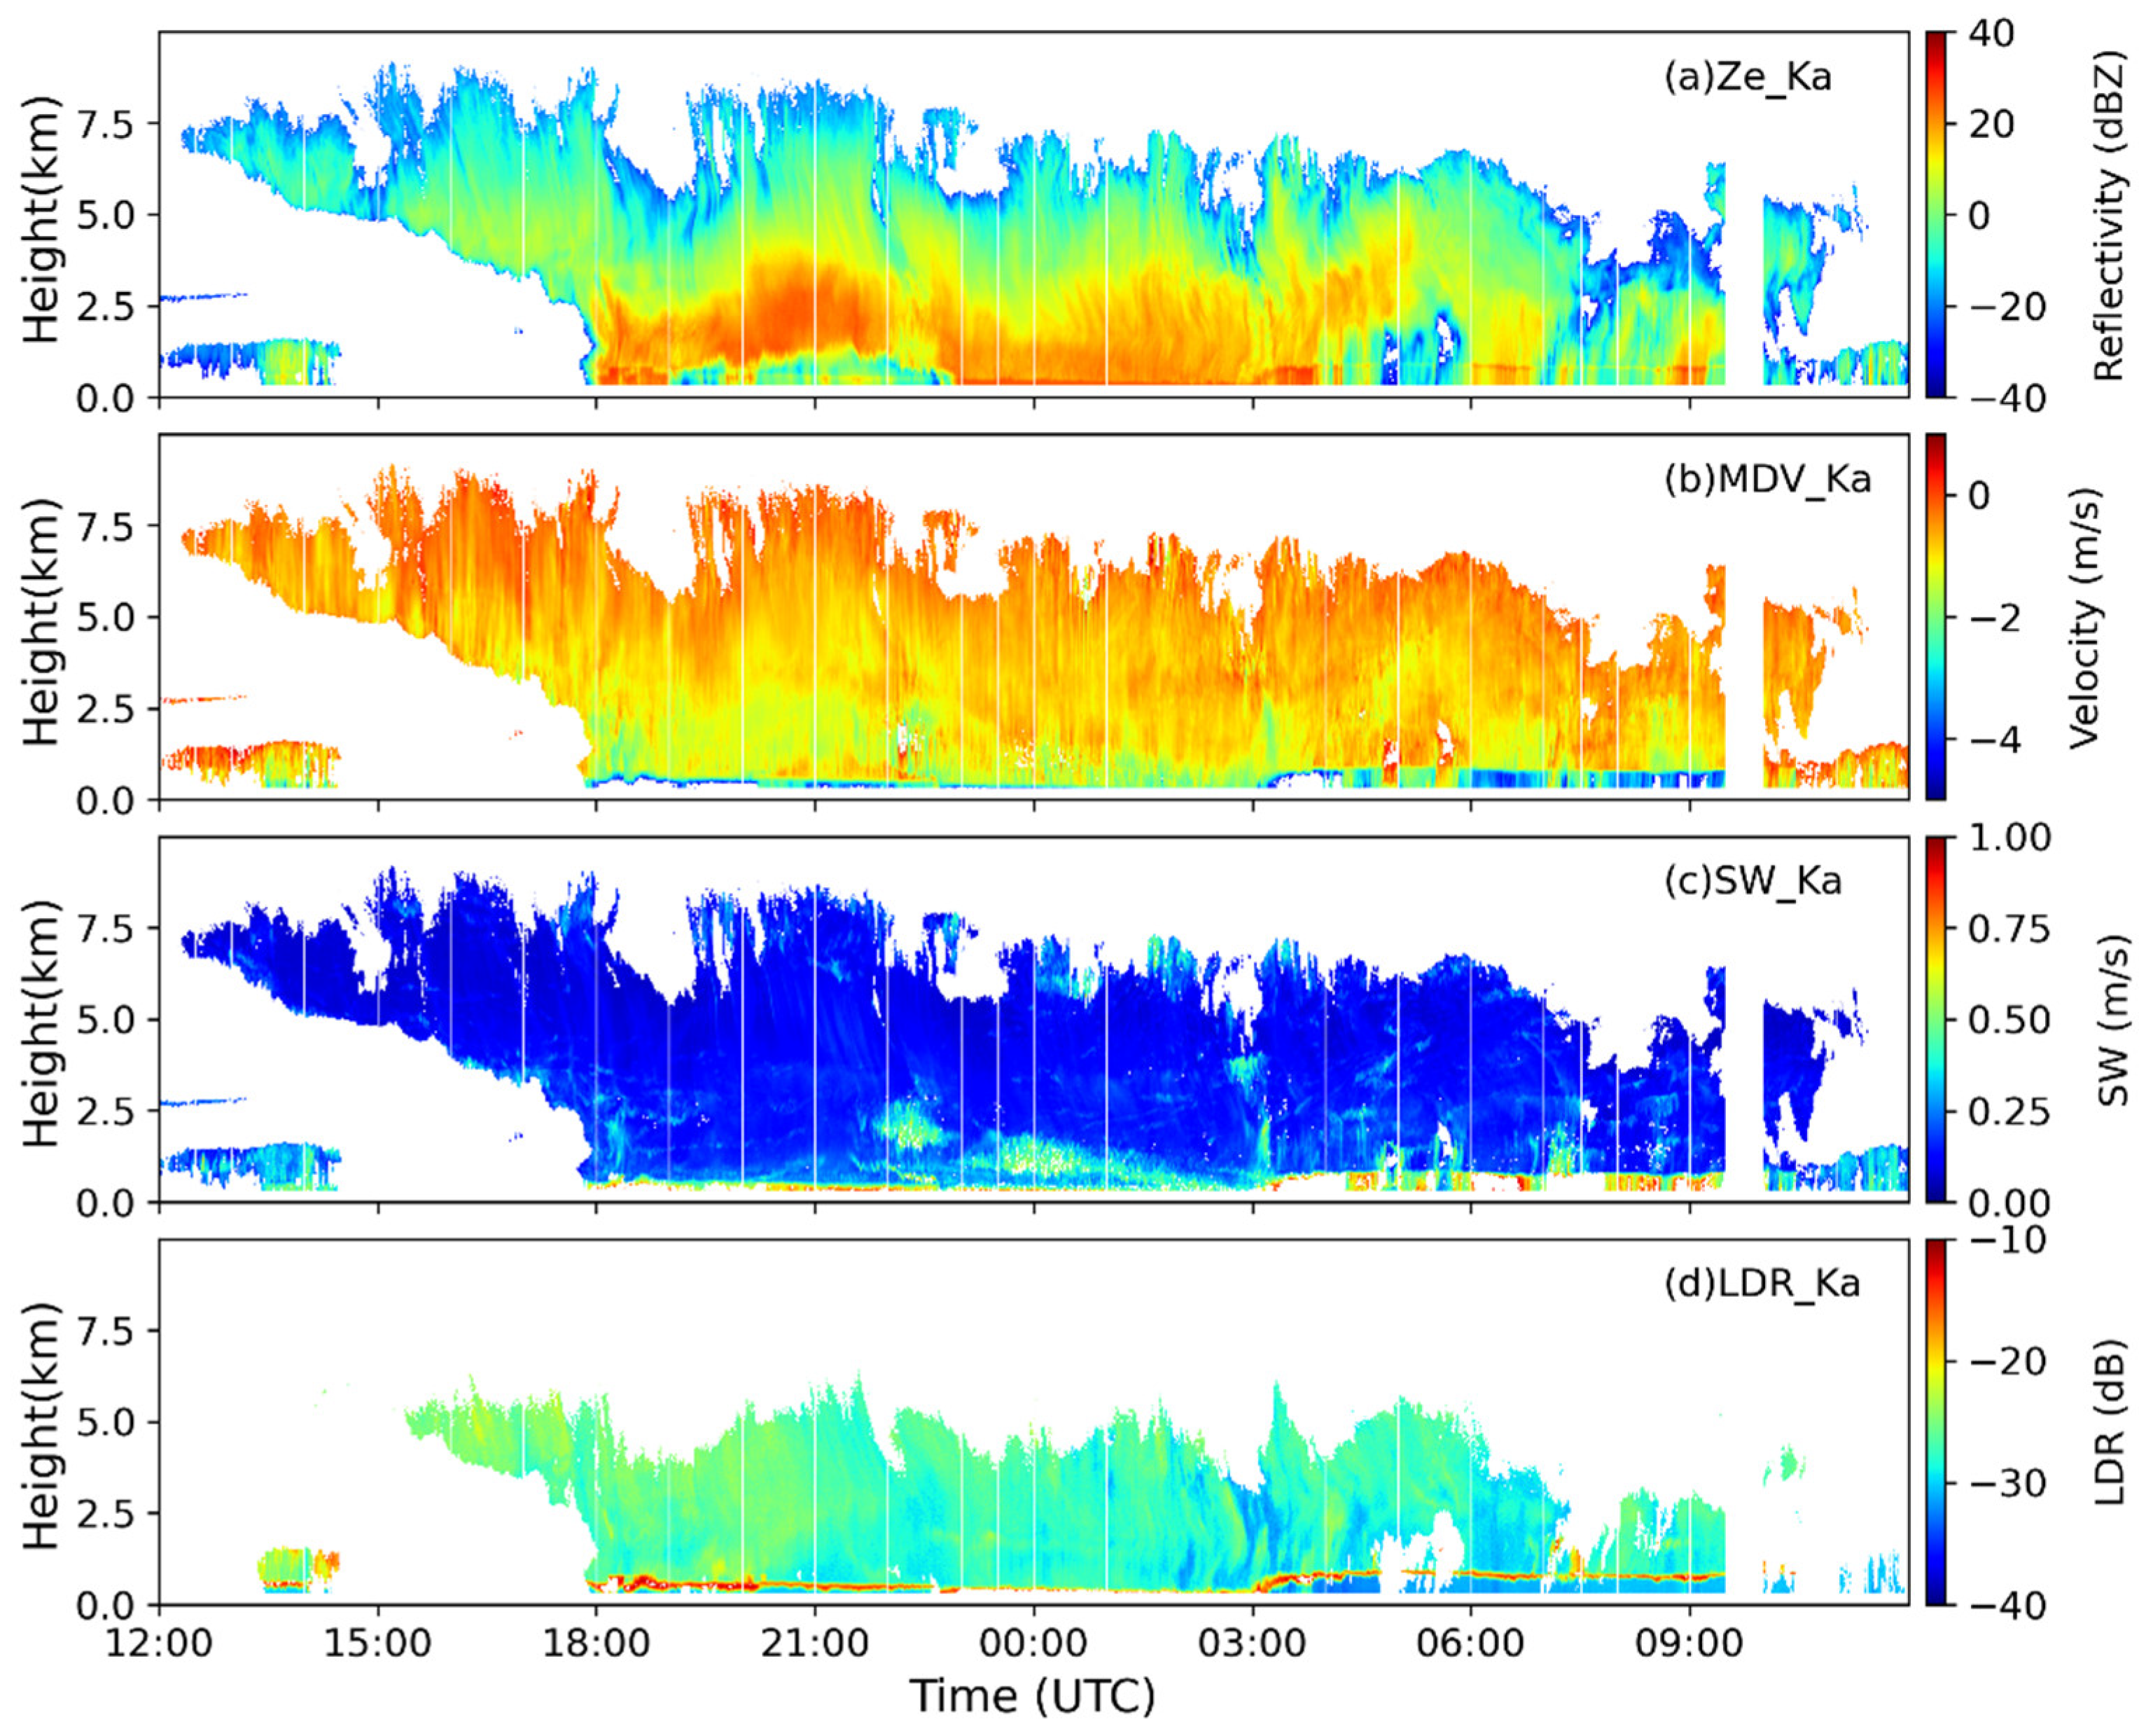
Figure 1 presents a snowfall event observed by the triple-frequency radar from 12:00 UTC on 3 January to 12:00 UTC on 4 January 2016. This event involved a variety of cloud and precipitation systems, including non-precipitating ice clouds, stratiform snowfall, and shallow mixed-phase clouds [17]. Selecting such a snowfall case is beneficial for comprehensively evaluating the practicality and stability of the identification methods under complex weather conditions.
Before 03:00 UTC on 4 January, a typical melting-layer structure was identifiable around 0.5 km altitude, manifested as a pronounced horizontal reflectivity band accompanied by a sharp decrease in MDV, a broadening of SW below that layer, and an increase in LDR. These multi-parameter signatures confirm the existence of a distinct ice–liquid phase transition at this height [38,39,40]. After 03:00, the melting layer rose to around 1 km. Similar abrupt changes were still observed in the Ze, MDV, SW, and LDR profiles at that level, indicating that a phase transformation of particles occurs (i.e., the melting layer generated by the ice-to-liquid phase change).
The Ze profiles of Ka-band in Figure 1a exhibit a distinct vertical variation with height. From 18:00 to 22:00 UTC on 3 January, the lower part of the cloud below 2 km showed relatively weak reflectivity (Ze < 10 dBZ), whereas a persistent strong echo band (peaking > 25 dBZ) appeared in the mid-level region between 2 and 4 km. Consistent with this interpretation, MDV (Figure 1b) at 2–4 km showed increasing fall speeds (maximum downward velocities ~ −3 m/s), SW (Figure 1c) broadened beyond 0.3 m/s, and LDR (Figure 1d) remained at a relatively low level overall. All of these features are characteristic of riming-dominated microphysical processes. In contrast, radar signatures consistent with aggregation-dominated conditions were intermittently observed in a low-level layer above the melting layer, at approximately 0.8–1.2 km between 18:30 and 20:10 UTC on 3 January, with the clearest signatures occurring during 18:30–19:00 UTC and 19:30–20:10 UTC. Compared with the overlying 2–4 km strong-echo layer, this low-level layer exhibited weaker Ze, relatively narrow SW, and localized increases in LDR, corresponding to less negative values. After about 03:00 UTC on 4 January, the overall Ze weakened substantially, with only very faint echoes remaining at low altitudes. At the same time, the MDV increased toward approximately −1 m/s, and the SW broadened further (exceeding 0.3 m/s). These combined signatures suggest that by this time, riming and pure aggregation were no longer the dominant processes in the cloud. Instead, the presence of large, low-density snowflakes (along with the sharp drop in reflectivity) indicates that many of the smaller ice particles were likely undergoing sublimation (partial or complete evaporation) as they fell through a drier layer of air.
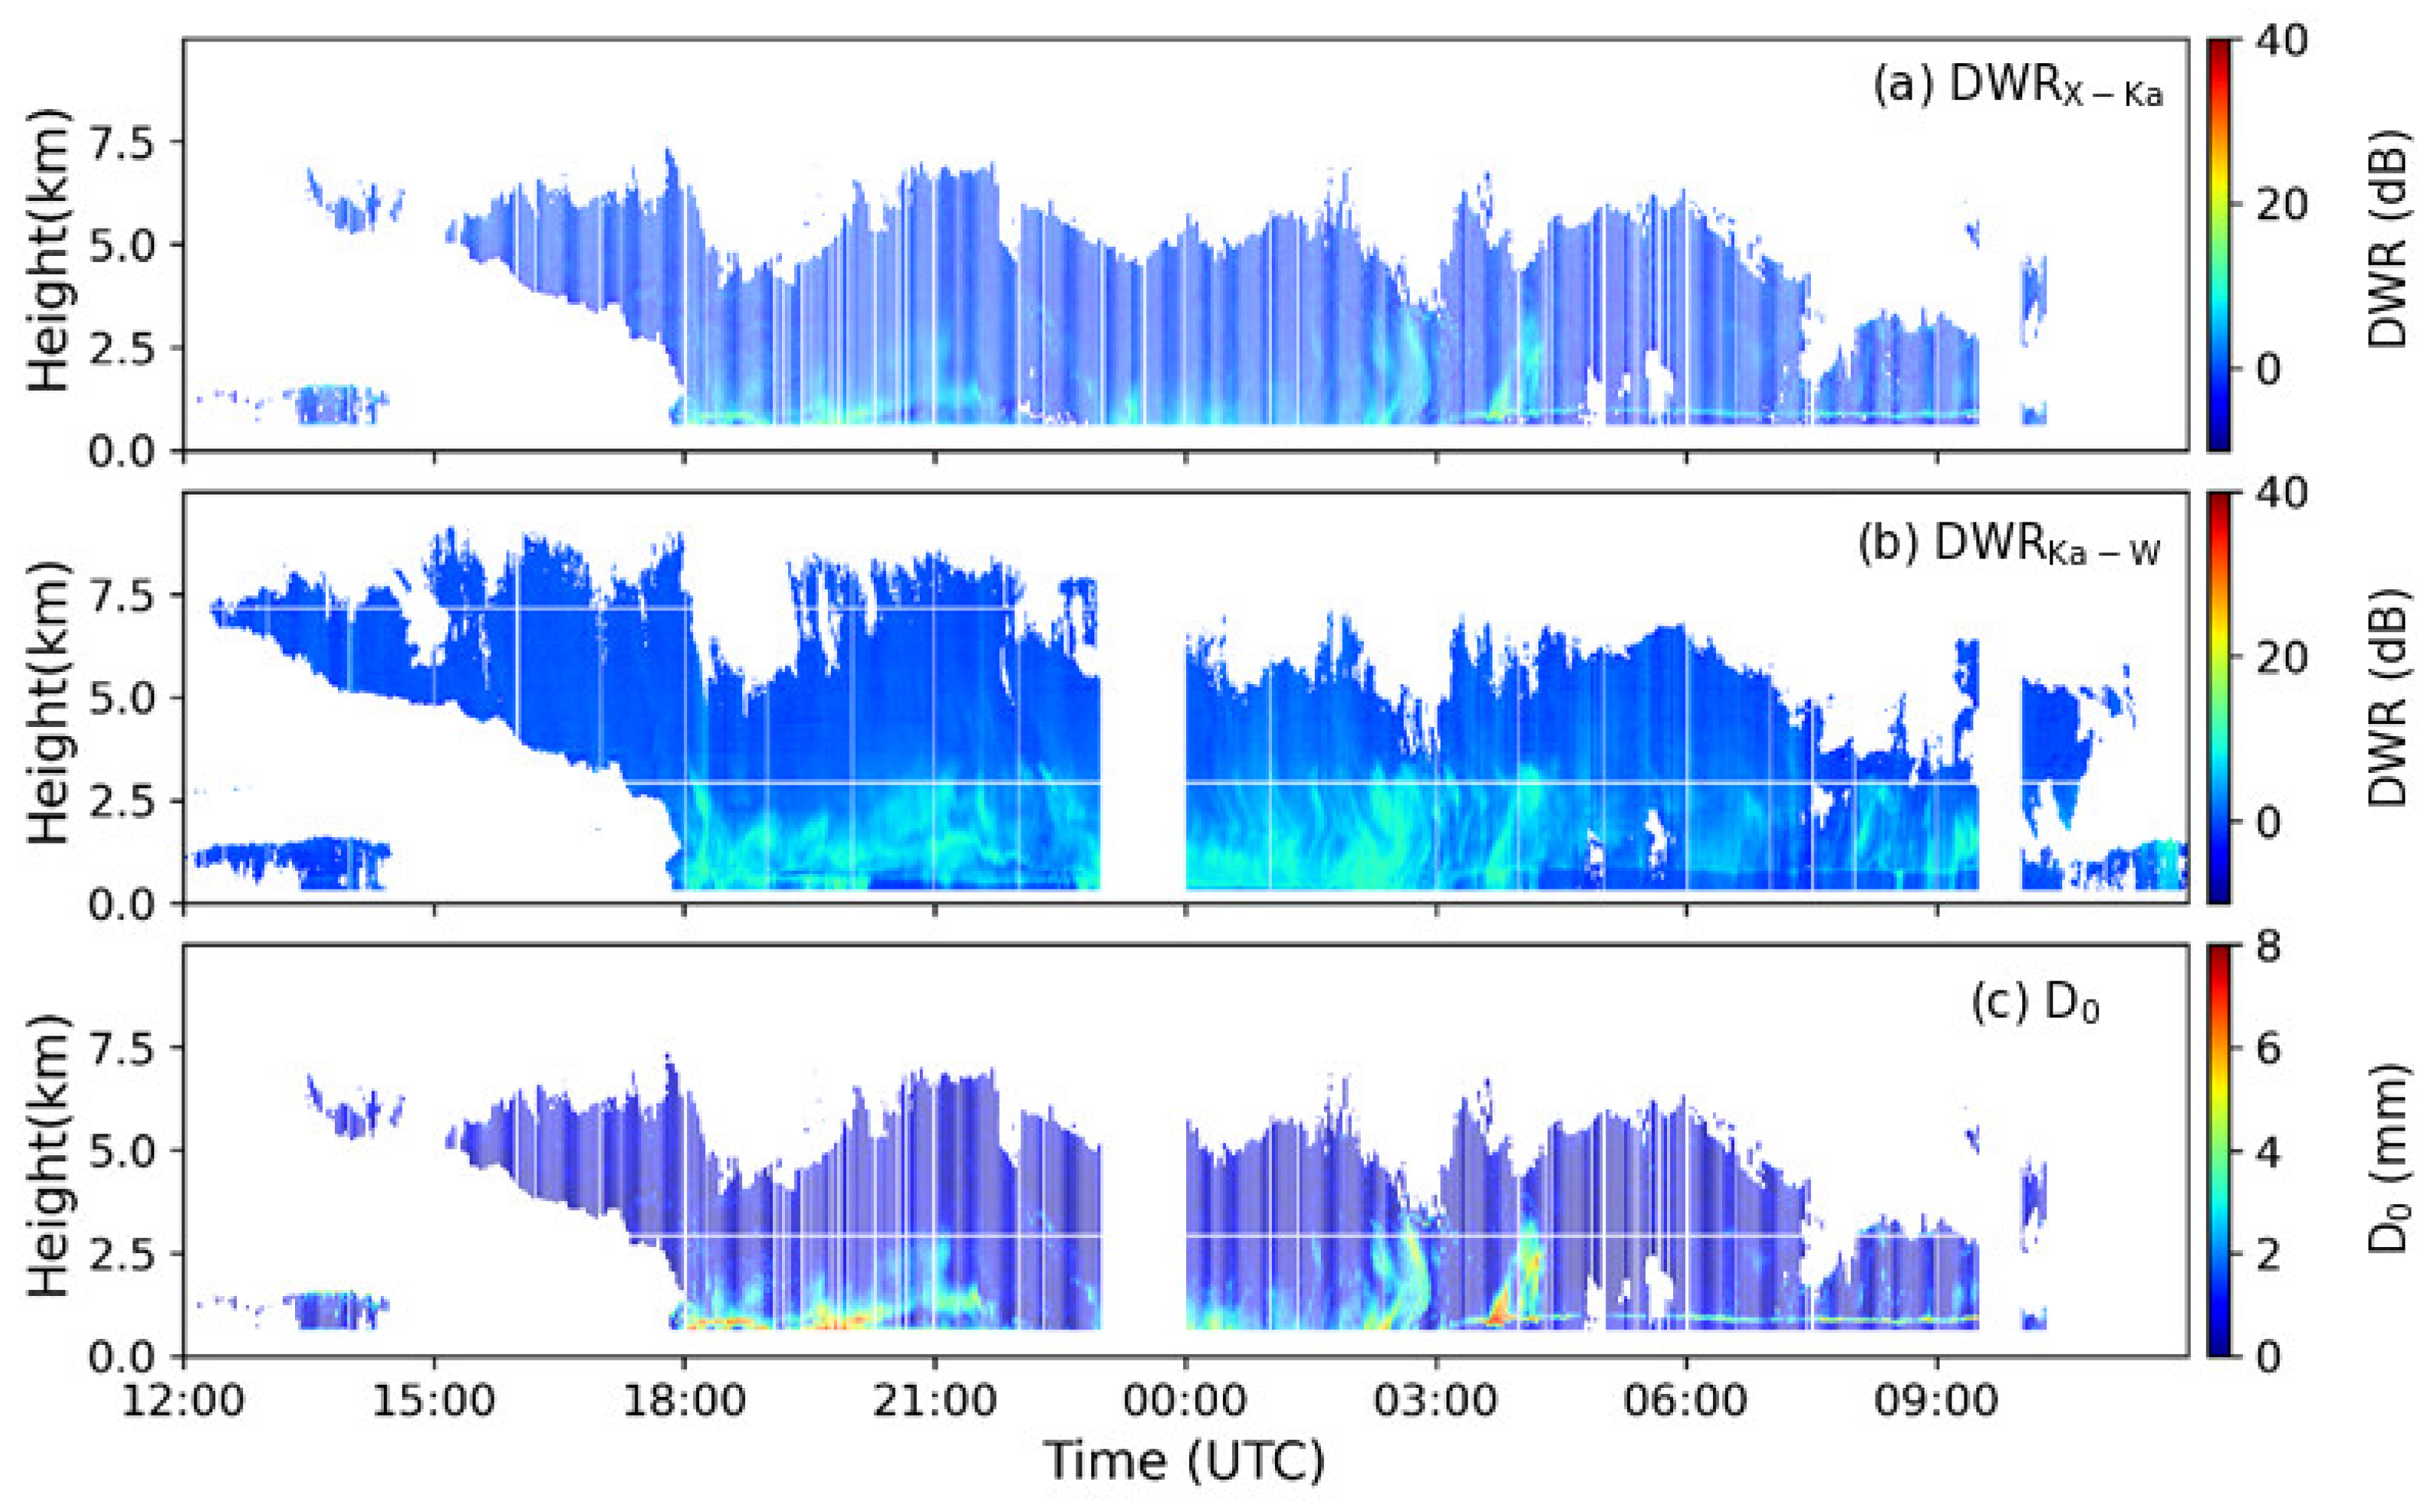
Figure 2a,b shows two sets of DWR vertical cross-sections. It is evident that between 18:00 and 22:00 UTC on 3 January, in the mid-level cloud region (~2–4 km altitude) the following situation occurred repeatedly: D W R K a W increased significantly while D W R X K a remained relatively small. For example, around 20:00 UTC at 2–3 km height, D W R K a W reached approximately 8–10 dB, whereas the corresponding D W R X K a was below 3 dB. This combination is consistent with particles having characteristic dimensions of a few millimeters. In this size regime, W-band scattering is strongly affected by non-Rayleigh effects, Ka-band scattering lies in the transition between the Rayleigh and Mie regimes, and X-band scattering remains closer to the Rayleigh regime. This differential scattering response produces enhanced D W R K a W together with relatively small D W R X K a , a triple-frequency signature commonly associated with compact rimed particles [17,22,23,24]. Moreover, in this snowfall event, many strong-echo regions in the mid-level precipitating cloud (2–5 km) displayed similar features, indicating the prevalence of riming processes at those altitudes.
By contrast, during the same period from 18:00–22:00 UTC on 3 January, in the area below 2 km the radar observed a completely different set of dual-wavelength signatures. In the lower layer, D W R X K a was positive and both D W R X K a and D W R K a W increased almost simultaneously with nearly equal magnitude. This behavior is consistent with the scattering features of large, low-density, fluffy snowflakes. Moreover, when D W R K a W reaches saturation (around 7–10 dB), D W R X K a continues to increase, resulting in a typical “hook-shaped” pattern for the relationship between D W R X K a and D W R K a W [17,22].
Between 20:30–22:00 UTC on 3 January, the radar observations near 1 km differed markedly from those at higher altitudes. In this near-surface layer, the Ze decreases noticeably with decreasing height, indicating substantial particle loss. Meanwhile, the MDV becomes less negative (rising to values above −1 m/s). However, the D W R K a W remains significantly positive. ERA5 profiles at 21:00 and 22:00 UTC revealed a pronounced vertical humidity contrast: the layer at approximately 1.1–1.4 km was subsaturated with respect to ice, with a five-grid-point median RHi of 91.6% and an interquartile range of 88.1–94.6%, whereas the overlying cloud layer at approximately 1.6–4.0 km was near to slightly above ice saturation, with a median RHi of 102.6%. This vertical structure indicates that snow particles descended from a near-saturated cloud layer into distinctly drier air. The concurrent downward decrease in Ze, reduction in downward fall-speed magnitude, and persistence of positive D W R K a W , together with the subsaturated environmental layer, support snow-particle sublimation as the most physically consistent interpretation of this low-level transition [41].
The time evolution of D0 in Figure 2c also reflects the different microphysical processes within the cloud. At high altitudes of 6–9 km, D0 was only a few hundred micrometers to ~1 mm, indicating that the initial ice crystals aloft were very small. As the particles fell into the mid-level (2–4 km), D0 gradually increased to around 2.5 mm, meaning that the particles underwent significant growth in that height range. When the hydrometeors fell to lower altitudes (below ~2 km), D0 reached its maximum value during this process, exceeding 4 mm in some periods. In addition, D0 values observed near 2 km were close to 2 mm, which is comparable to the size of typical graupel or dense snow grains. Aggregation generates large, loosely structured snowflakes (D0 often > 3 mm); however, due to their low density and weak reflectivity, such aggregates manifest as extremely large D W R X K a . Overall, the vertical distribution of D0 is consistent with the indications from the triple-frequency DWR and polarimetric parameters. During 18:00–22:00 UTC on 3 January, the high-altitude particles were small and light; the mid-level particles became denser through riming and grew moderately to 2–4 mm; and at the lower levels, the hydrometeors rapidly grew to their maximum size through aggregation.
By the early morning of 4 January, the retrieved D0 increased rapidly below approximately 4 km and locally exceeded 4 mm, while Ze decreased and DWR remained elevated. Although an increase in D0 alone can also accompany aggregation, the joint evolution of D0, Ze, DWR, and environmental humidity indicates a different mechanism in this case. ERA5 showed that the 2.5–4.5 km layer evolved from near ice saturation before the onset of this transition, with a median RHi of 100.5% during 00:00–02:00 UTC, to marked subsaturation as the event progressed: the median RHi decreased to 93.9% during 03:00–04:00 UTC and further to 82.5% during 05:00–07:00 UTC. The formation and subsequent intensification of this subsaturated layer, together with the concurrent decrease in Ze, make continued aggregation unlikely to have been the dominant cause of the increasing D0. Previous studies have shown that sublimation can preferentially deplete smaller ice particles and thereby shift the particle size distribution toward larger characteristic diameters. In particular, Vignon et al. [42] noted that low-level sublimation can produce an increase in mean mass diameter through the preferential sublimation of smaller particles, while Carlin et al. [41] documented pronounced decreases in radar reflectivity through sublimation layers. Under this mechanism, depletion of the small-particle end of the size distribution increases the relative volume contribution of the surviving larger particles, thereby increasing the retrieved D0 even as the total particle population and Ze decrease. Because triple-frequency DWR is strongly influenced by the characteristic particle size and the large-particle portion of the size distribution, the remaining larger particles can continue to produce elevated DWR values [22,26]. The coherent evolution of RHi, Ze, DWR, and D0 therefore supports selective sublimation, rather than continued aggregation or additional particle growth, as the primary explanation for the observed increase in D0.
In this snowfall event, the spatiotemporal evolution of Ze, MDV, SW, LDR, and DWR observed by the triple-frequency radar exhibited a high degree of consistency, and they jointly confirmed the dominant regions of different ice-particle growth mechanisms. A strong Ze, high fall velocity, broad SW, and extremely low LDR values together indicate that particles are compact in structure and nearly spherical in shape; combined with the DWR characteristics (a relatively small D W R X K a and a markedly increased D W R K a W ), these features identify a typical riming-dominated region. In contrast, regions with moderately weak Ze, very slow fall speeds, an extremely narrow SW, and substantially elevated LDR correspond to more irregular, low-density particles. In those regions, D W R X K a and D W R K a W increase in unison (with the latter tending to saturate at ~7 dB), consistent with the signature of an aggregation-dominated snow growth process. The consistency of these radar variables at different stages and altitudes greatly enhances the physical interpretation of the particle growth processes, providing reliable support for distinguishing the spatial distribution of aggregation and riming within the cloud.

3.2. Analysis Based on Gradients

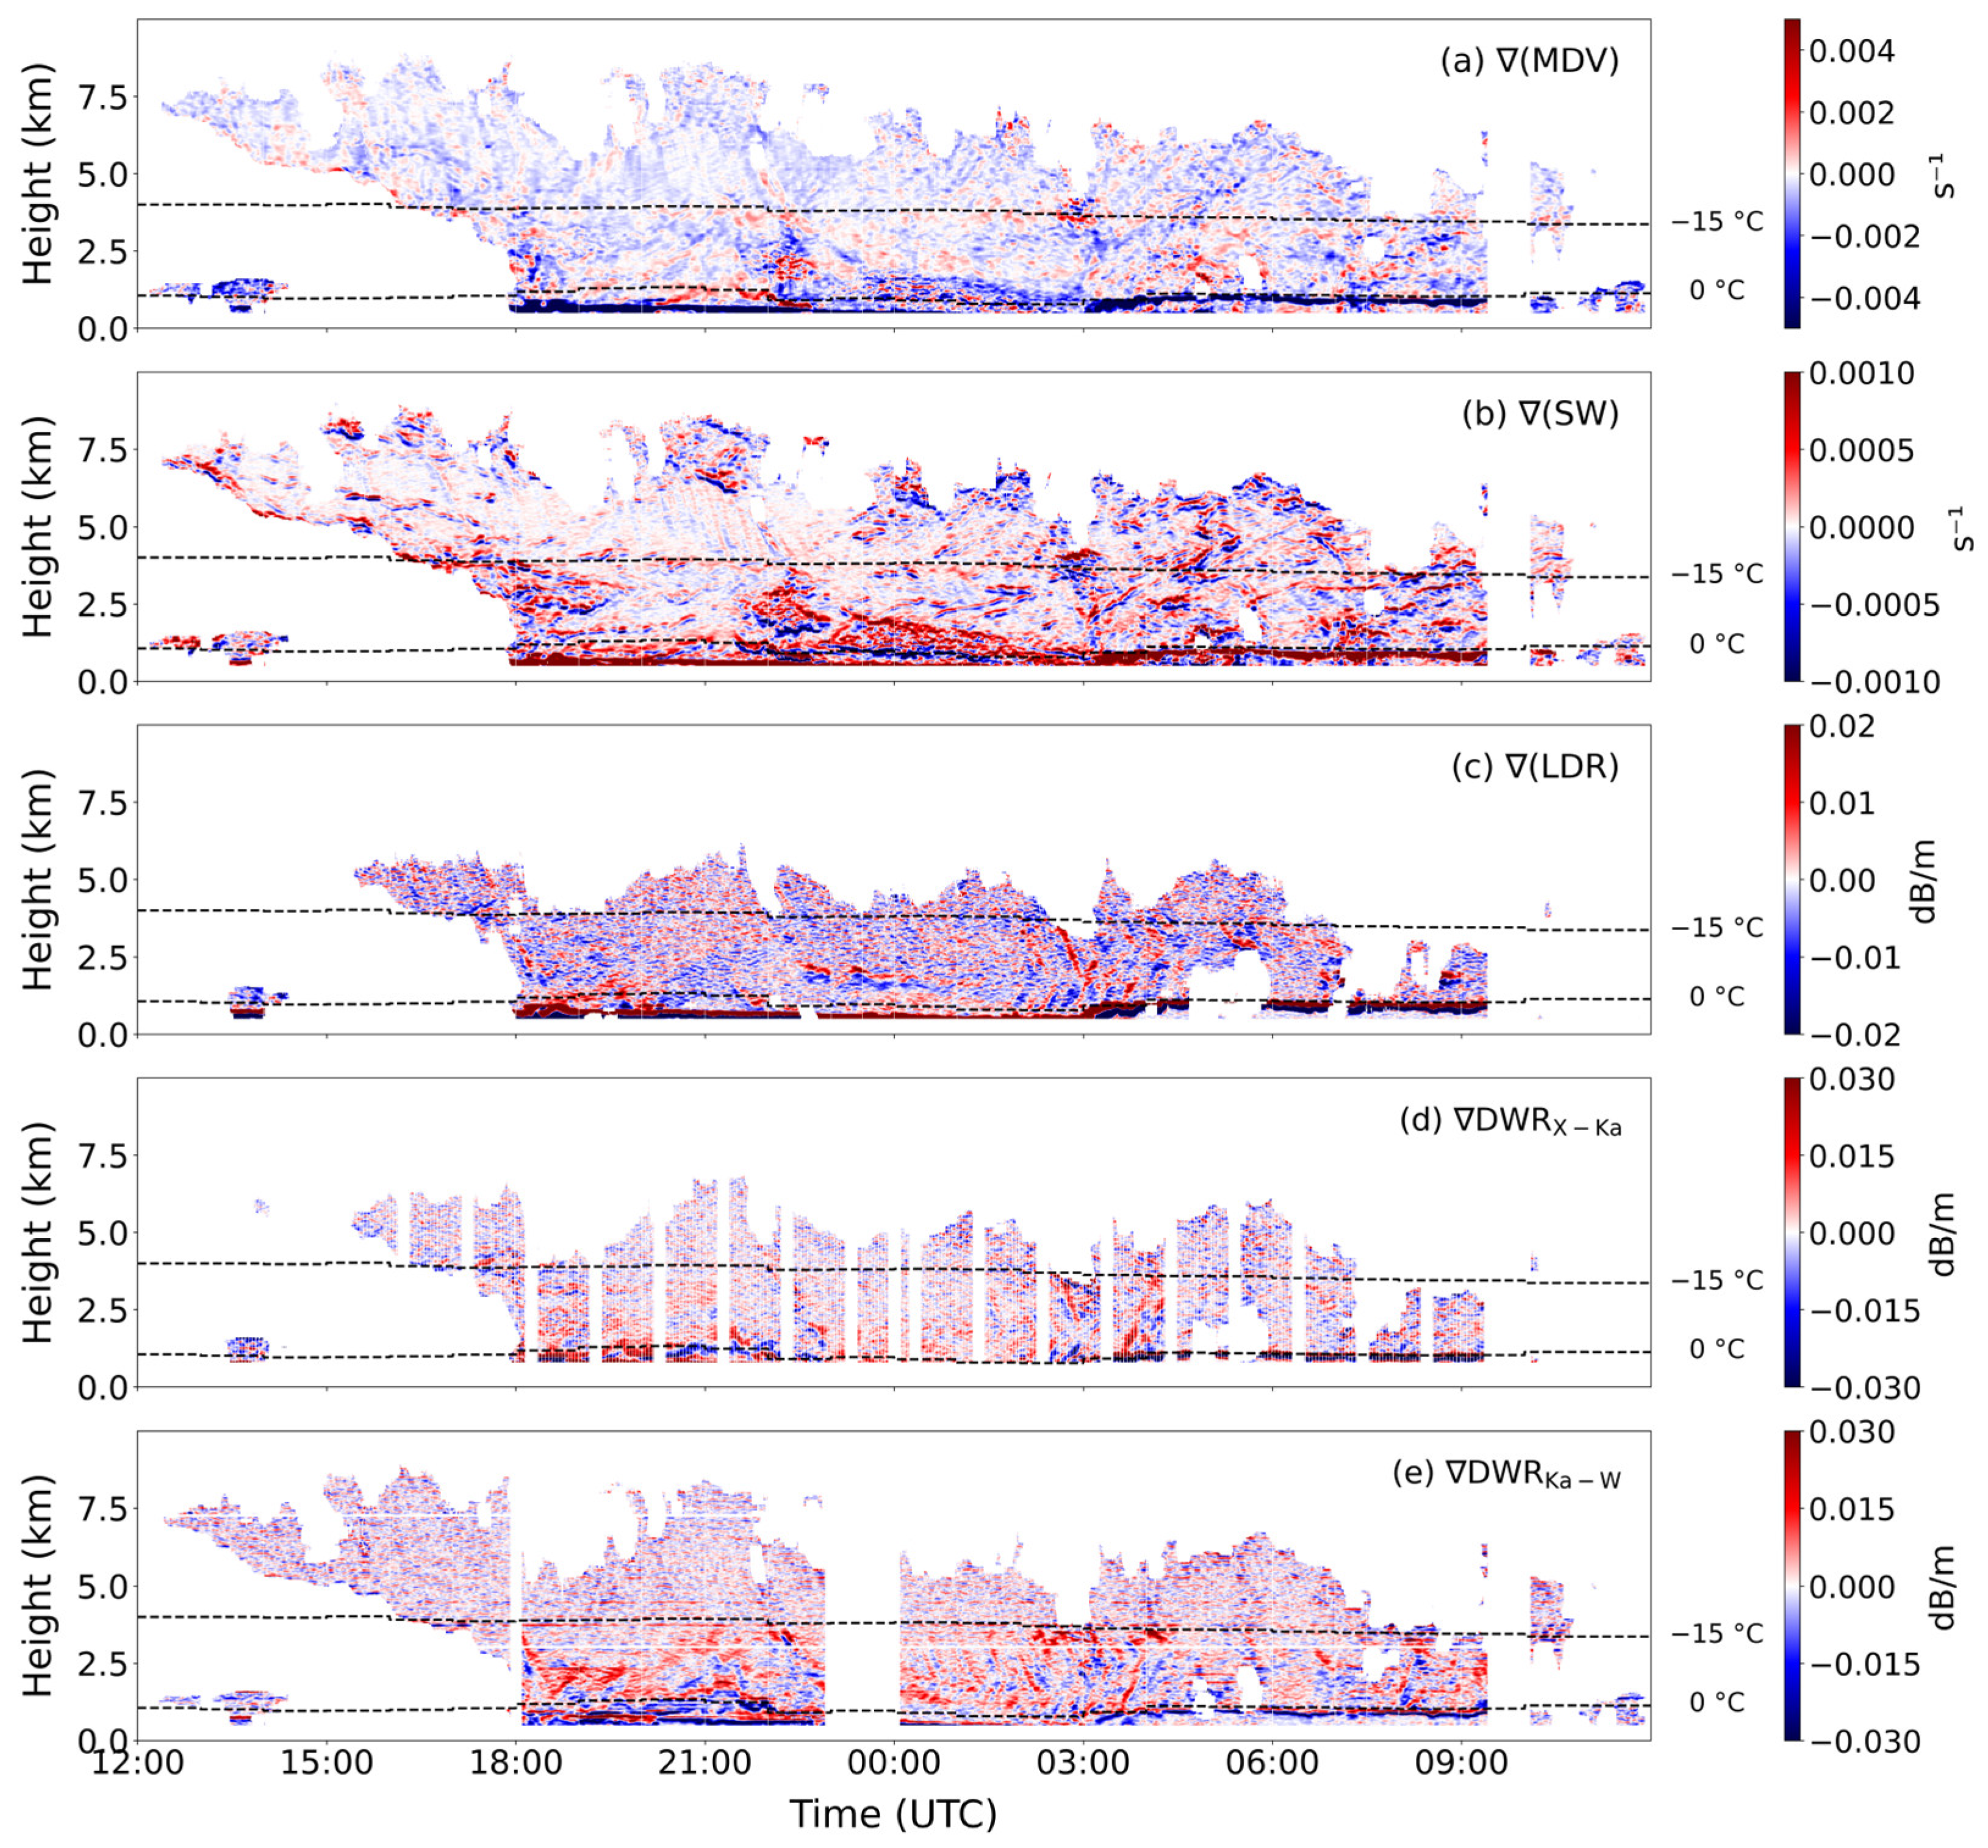
Figure 3 shows the vertical profiles of calculated vertical gradients of various observables from the triple-frequency radar. During 18:00–20:00 UTC on 3 January and 00:00–02:00 UTC on 4 January, the vertical gradients reveal a pronounced narrow band near the 0 °C level, with gradient signatures of M D V > 0, S W < 0, L D R > 0. This series of gradient characteristics indicates that at this height, the particle falling velocity slowed down, the SW narrowed, and particle shapes became more irregular. Meanwhile, in that region, the DWR gradients show D W R X K a > 0 and D W R K a W < 0, meaning the D W R X K a continued to increase but D W R K a W had begun to saturate and even slightly decrease. All of these gradient features indicate that this height band was strongly dominated by aggregation processes, consistent with the analysis above. In the cloud layers immediately above and below this aggregation-dominated band, the gradient sign of each parameter reverses ( M D V < 0, S W > 0, L D R < 0, D W R X K a < 0, D W R K a W > 0), suggesting that in those layers the particles’ fall speeds increased, SW broadened, and shapes tended toward spherical. These are typical characteristics of a riming process, albeit of relatively weaker intensity.
For 20:00–22:00 UTC on 3 January, the overall vertical gradient in the lower-middle cloud (1–2.5 km) was M D V < 0, S W > 0, L D R < 0. This indicates that during this period, within that height range, particle fall speeds increased, SW broadened, and shapes became more spherical, with riming being the dominant process. However, two thin layers around ~2.5 km and the 0 °C level exhibited the opposite gradient pattern, indicating that within these narrow layers the fall speeds slowed, SW decreased, and particle shapes grew more irregular—signaling the onset of snowflake aggregation. This shows that even during an overall riming-dominated stage, an initial aggregation of ice crystals can occur at certain local heights.
During 01:00–03:00 UTC on 4 January, the vertical gradients in the lower-middle cloud at approximately 1–4 km were M D V < 0, S W > 0, L D R < 0, D W R X K a > 0, and D W R K a W > 0. The negative MDV gradient indicates that the downward fall-speed magnitude increased toward lower altitude, while the positive SW gradient and negative LDR gradient are consistent with spectral broadening and particles becoming denser and more rounded during riming [1,3,23]. Although both DWR gradients were positive, D W R K a W exhibited larger positive magnitudes and a more spatially coherent enhancement than D W R X K a . This indicates that the Ka–W differential scattering contrast increased more rapidly during descent than the X–Ka contrast, which is consistent with the stronger W-band non-Rayleigh response of compact rimed particles [17,22,24,43]. The combined MDV, SW, LDR, and relative DWR-gradient structures therefore support a riming-dominated interpretation. Between 03:00–05:00 UTC, the gradient structure changed markedly, with a broad region showing M D V > 0, S W < 0, L D R > 0, D W R X K a > 0, and D W R K a W < 0. The positive MDV gradient indicates a reduction in downward fall-speed magnitude, while the negative SW gradient and positive LDR gradient are consistent with spectral narrowing and particles becoming less dense and more irregular [1,19]. In contrast to the preceding riming period, D W R X K a became the stronger and more spatially extensive positive DWR response, whereas D W R K a W weakened toward zero and became locally negative. This relative evolution indicates that the X–Ka differential scattering contrast continued to increase while the Ka–W response approached saturation and locally bent back, consistent with the development of large, low-density aggregates and the characteristic triple-frequency hook [22,26]. The combined gradient structure therefore indicates that aggregation became the dominant process over most of this region.
All of these features indicate that aggregation became the dominant process in those areas. Notably, during this period, a distinct vertical stratification emerged: at around 2 km altitude, a layer still maintained gradient signatures consistent with the earlier riming process, meaning that even in an aggregation-dominated stage, riming was still ongoing at ~2 km in the cloud. This vertical layered structure demonstrates that during the evolution of precipitation, microphysical processes at different altitudes can coexist—the growth of snow crystals by aggregation occurs at most heights, while a certain degree of riming continues locally.

3.3. Classification and Comparative Analysis of Two Methods

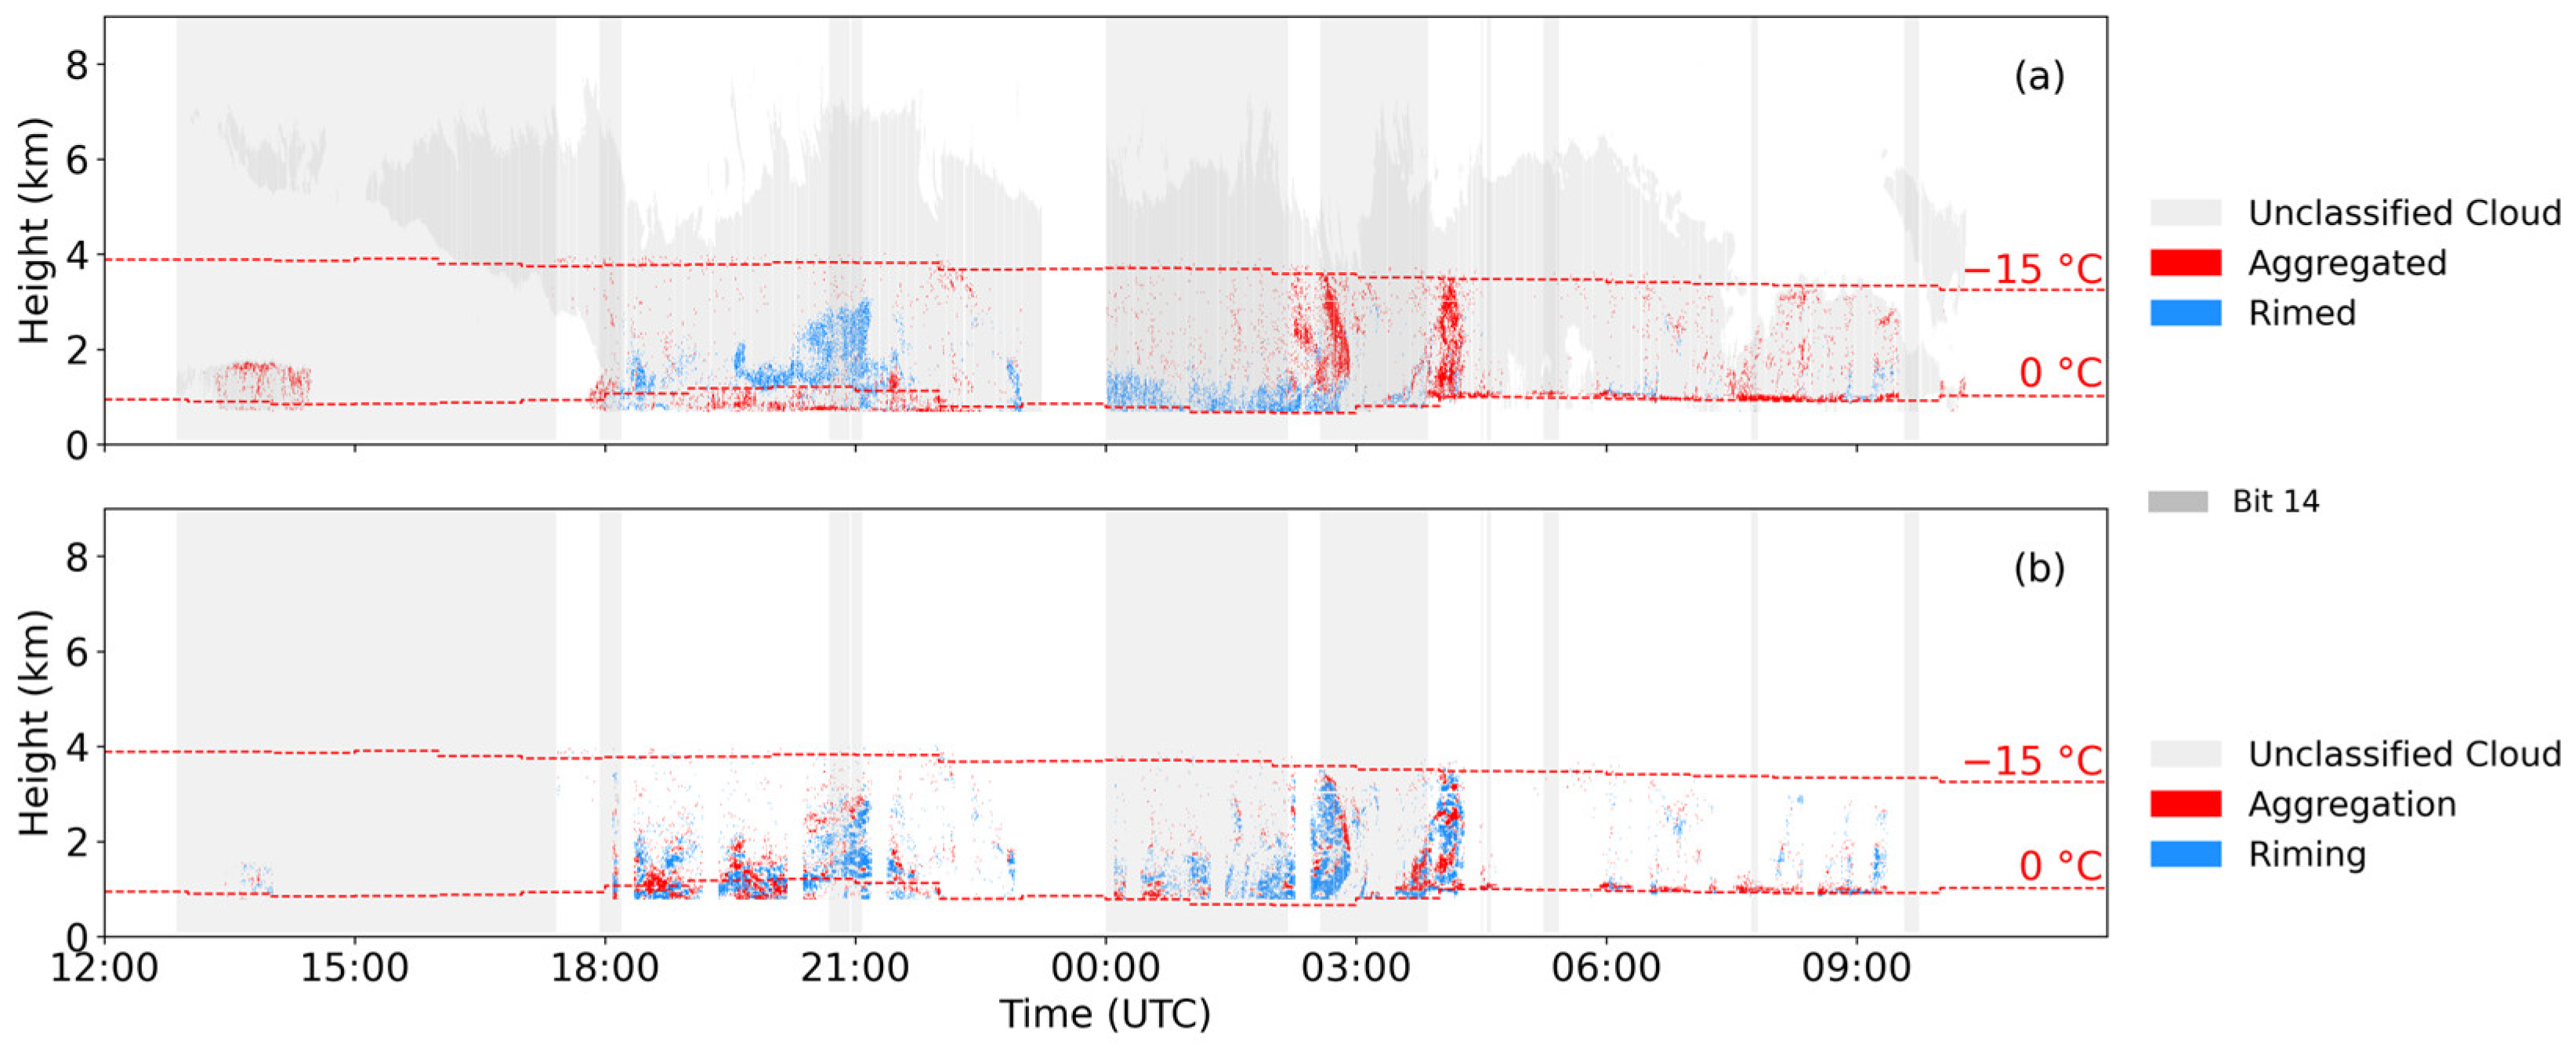
Using multiple radar observables and their vertical gradient data, we applied the two methods introduced earlier to identify the riming and aggregation processes during this snowfall event, as shown in Figure 4. The identification results from both methods are generally consistent in terms of spatial distribution and evolution trends. Specifically, during the early-to-middle stage of the snowfall (18:00 UTC 3 January to 01:00 UTC 4 January) in the low-level cloud region, and in the later stage (03:00–05:00 UTC 4 January) throughout the entire lower and middle cloud layers, both methods identified pronounced aggregation processes. In the mid-stage of the snowfall (21:00 UTC 3 January to 01:00 UTC 4 January) within the lower–mid cloud, both methods successfully captured a region dominated by riming.
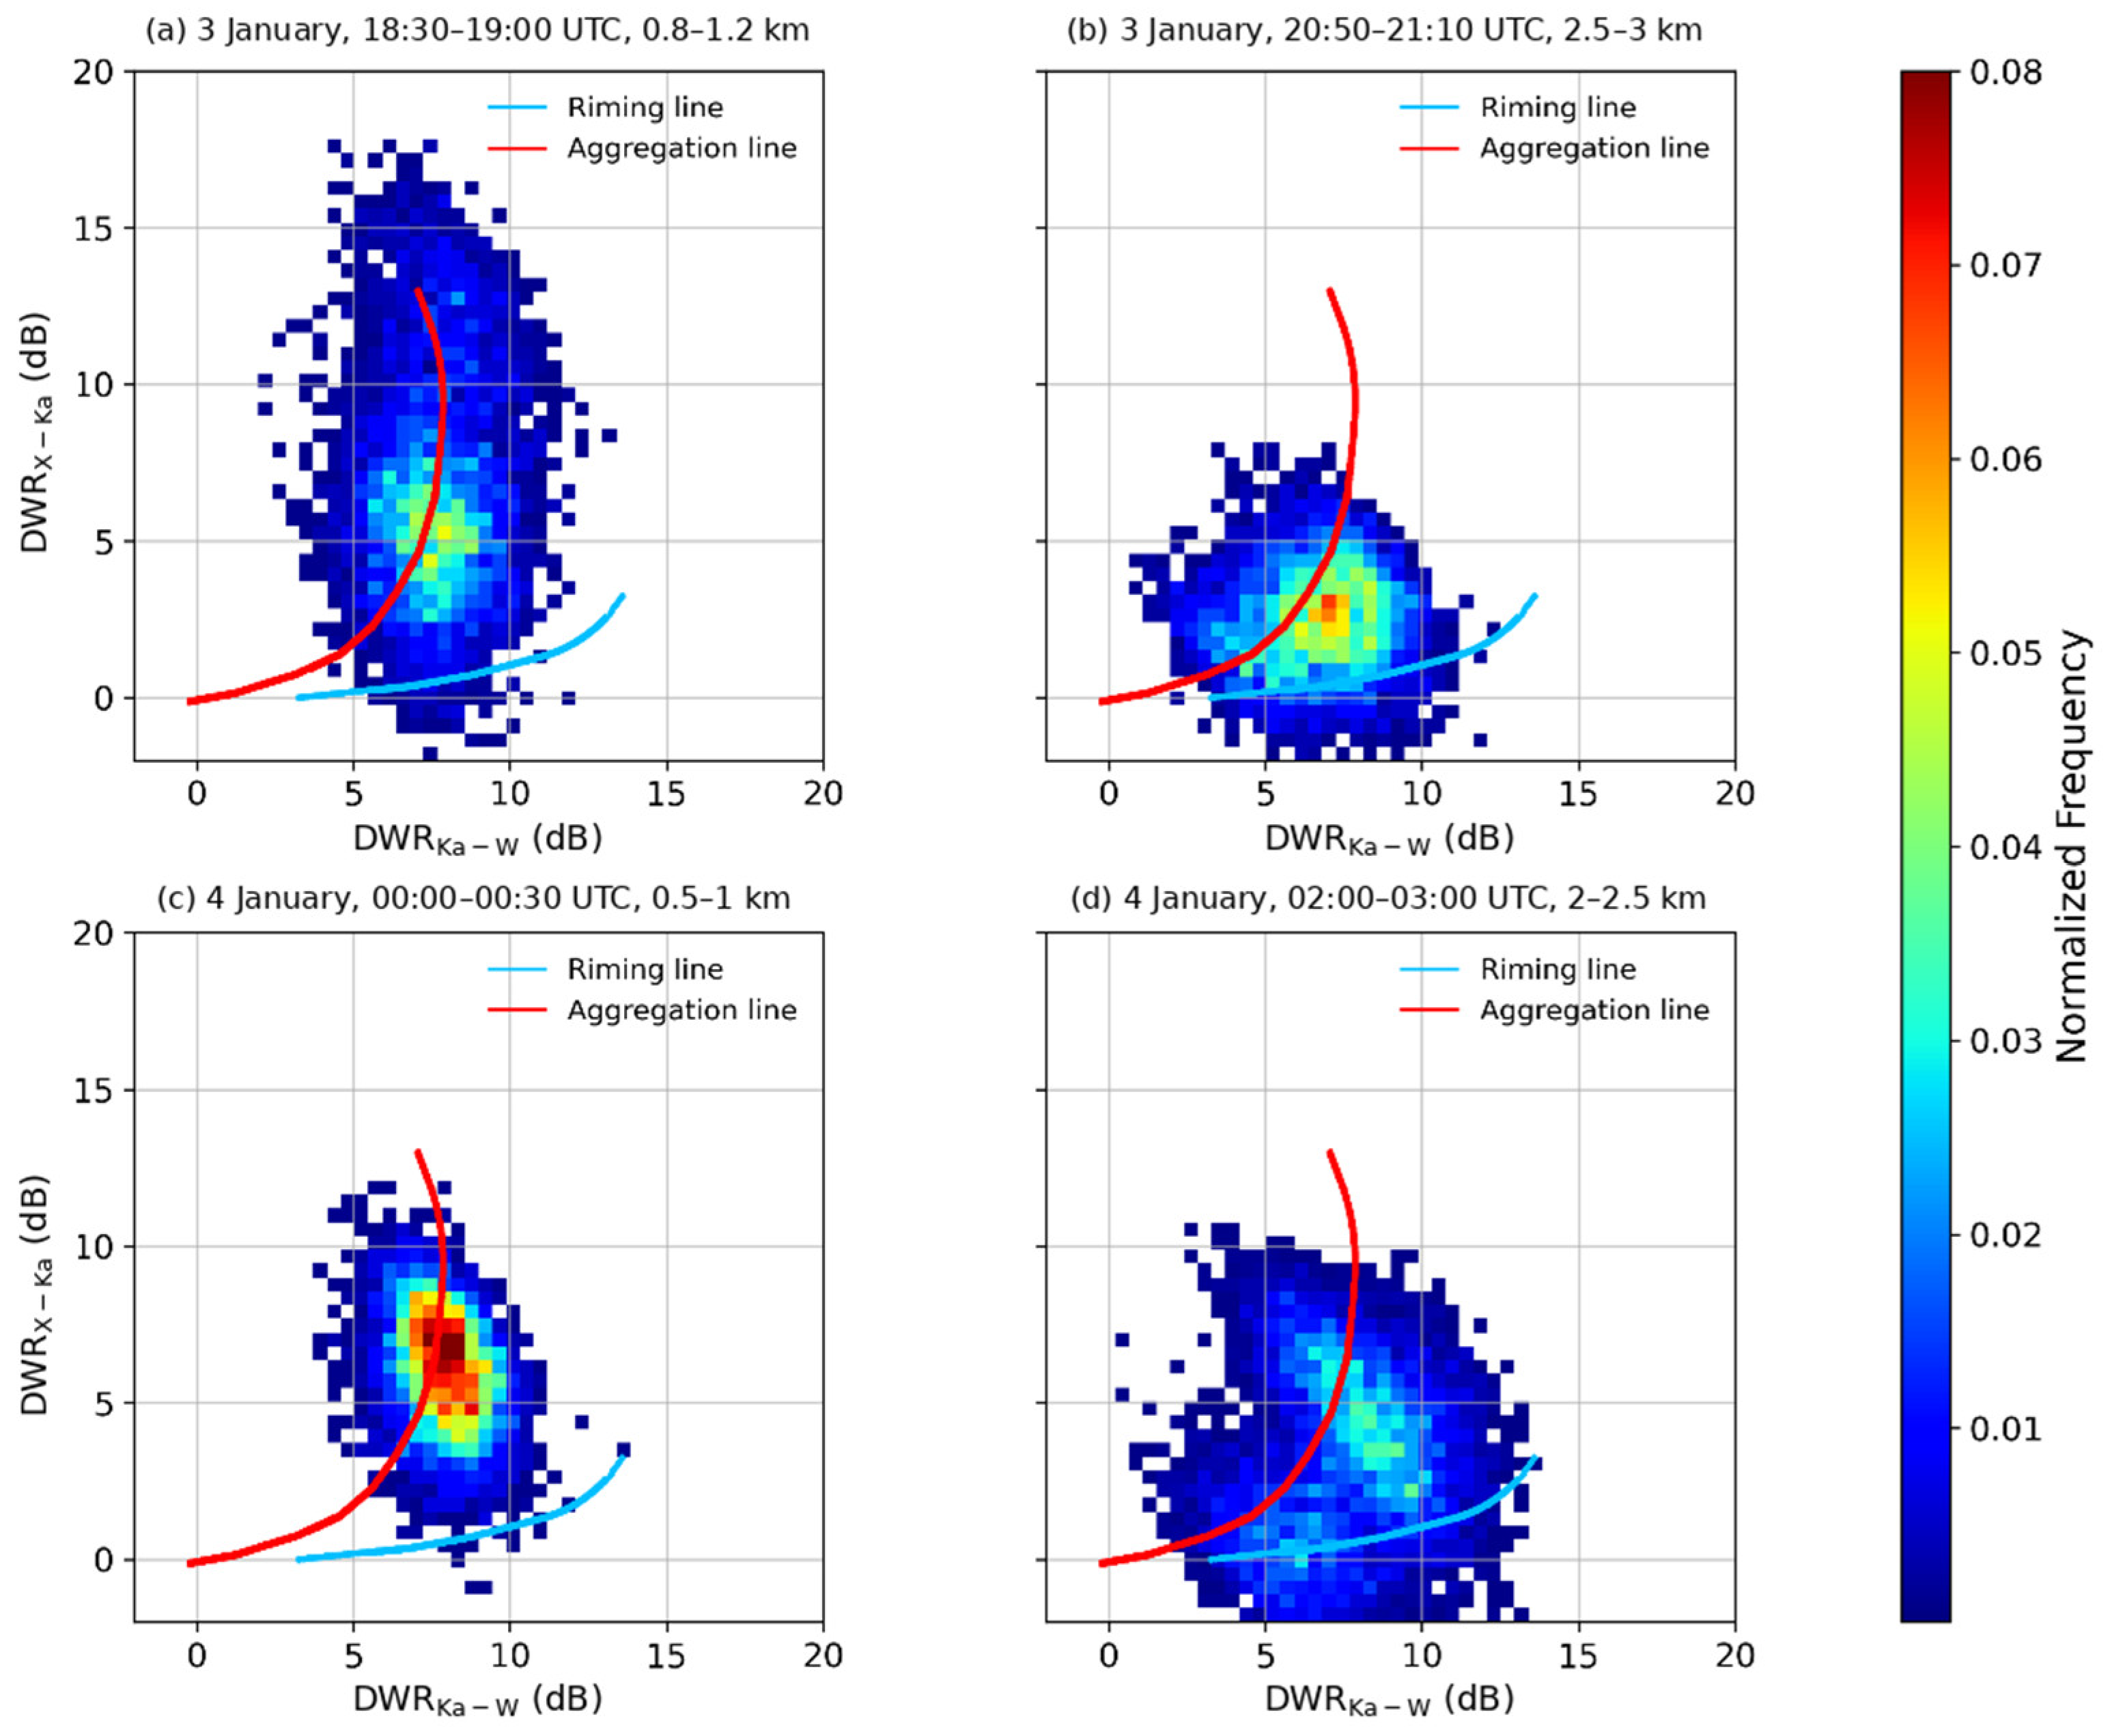
Although the two identification methods are generally consistent in discerning the macro-scale trends, they still exhibit significant differences in classification behavior and sensitivity at the boundaries of microphysical process regions and during transition stages. To further analyze the causes of these differences and to assess their physical consistency, we selected four representative time–height intervals of the snowfall in which the identification results diverged markedly, and plotted two-dimensional scatter distributions of D W R X K a   v s .   D W R K a W (Figure 5), with different colors indicating the frequency of occurrence of particles. We also superimposed the classical “triple-frequency radar hook” curves (blue solid line representing a typical riming process, red solid line a typical aggregation process; curves from Kneifel et al. [22]) to conduct a physical-consistency assessment of the identification results from both methods. The four representative disagreement intervals were evaluated using both their DWR-space composition and the continuous preference index M. The specific analyses are described below.
For the intervals 18:30–19:00 UTC on 3 January at 0.8–1.2 km (Figure 5a) and 00:00–00:30 UTC on 4 January at 0.5–1 km (Figure 5c), the Multi-Parameter Threshold Method identified both as riming-dominated, whereas the Gradient-Based Multi-Parameter Identification Method identified them as aggregation-dominated. The quantitative DWR-space analysis strongly supports the aggregation-dominated regional interpretation. In Figure 5a, 87.56% of the valid observations were closer to the aggregation reference curve, compared with 8.92% closer to the riming curve and 3.52% within the ambiguity band. The corresponding aggregation proportion in Figure 5c was even higher at 93.74%, while only 3.51% of the observations were riming-like and 2.74% were ambiguous. Although Figure 5c contained the larger proportion of aggregation-like samples, the distribution in Figure 5a extends further toward higher DWRX−Ka values than that in Figure 5c, indicating more intense aggregation and coinciding with larger retrieved D0 values (Figure 2c). This combination indicates a more developed large-aggregate population in Figure 5a, consistent with the formation of large, low-density snowflakes.
For the period 20:50–21:10 UTC on 3 January at 2.5–3 km altitude (Figure 5b), the Multi-Parameter Threshold Method identified this region as riming-dominated, whereas the Gradient-Based Multi-Parameter Identification Method identified it as aggregation-dominated with local riming characteristics. The quantitative analysis confirms this mixed but aggregation-dominated structure: 66.19% of the valid observations were closer to the aggregation curve, 26.96% were closer to the riming curve, and 6.86% fell within the ambiguity band. Thus, aggregation constituted the predominant component, while the substantial riming-like fraction demonstrates that the region did not represent a single homogeneous particle-growth regime. The continuous preference index had a median value of 0.392 during this interval. Its median increased from 0.276 during the first third of the interval to 0.473 during the final third, indicating that the aggregation preference persisted and strengthened with time while a substantial riming-related component remained. Among pixels for which the two complete methods produced opposite labels, 88.16% of the decisive DWR-space preferences supported the gradient-based label, whereas only 4.43% supported the threshold-based label. This result quantitatively supports the gradient-based interpretation of an aggregation-dominated mixed regime. The simultaneous presence of aggregation- and riming-like populations may reflect spatially uneven riming, variations in particle internal structure, or changes in the particle-size distribution.
For the period 02:00–03:00 UTC on 4 January at 2–2.5 km (Figure 5d), the Multi-Parameter Threshold Method identified this layer as aggregation-dominated, whereas the Gradient-Based Multi-Parameter Identification Method identified it as a region of coexisting aggregation and riming. The quantitative DWR-space composition contained substantial contributions from both reference regimes: 56.19% of the valid observations were closer to the aggregation curve, 37.52% were closer to the riming curve, and 6.29% fell within the ambiguity band. The median preference index was 0.241, indicating an overall aggregation tendency but also a substantial residual riming component. More importantly, the temporal evolution of M supports a genuine process transition. The median M changed from −0.179 during the first third of the interval to 0.577 during the final third, with a positive Theil–Sen slope of 0.670 h−1. The interval therefore evolved from a riming-influenced or near-neutral state toward aggregation-dominated conditions. The threshold method captured the largest aggregation component, whereas the gradient-based interpretation additionally represented the substantial riming-related population that persisted during the transition. Figure 5d is therefore best characterized as a temporally evolving mixed transition.
The whole-event analysis further revealed a clear difference in classification coverage. Across the valid cloud domain, the Multi-Parameter Threshold Method classified 8.86% of the radar pixels, whereas the Gradient-Based Multi-Parameter Identification Method classified 14.11%. The gradient-based method therefore increased the classification coverage by 5.25 percentage points, corresponding to a relative expansion of approximately 59.2%. The 95% time-block bootstrap interval for the absolute coverage increase was 2.76–7.66 percentage points, demonstrating that the broader coverage was stable across the event. Inter-method differences were concentrated near the identified process boundaries, accounting for 98.43% of all differing pixels. When the gradient-based method identified aggregation while the threshold method identified riming, 81.19% of the decisive DWR-space preferences supported the gradient-based aggregation label. The threshold method retained a smaller set of pixels characterized by pronounced, well-developed radar signatures, whereas the gradient-based method extended the identifiable process domain to a substantially broader range of signals. Combined with the quantitative DWR-space results for the four representative disagreement regions, this expanded coverage demonstrates the enhanced sensitivity of the gradient-based method to weak aggregation signals, process boundaries, mixed regimes, and transition stages.
To determine whether this additional sensitivity was inherited directly from the DWR inputs, the classifications were repeated after withholding all DWR- and D0-related information. Under the conservative unanimity rule, the reduced threshold classifier covered only 0.89% of its valid domain, whereas the reduced gradient classifier covered 23.43%. The threshold ablation selected a very small number of pronounced end-member pixels and consequently had the higher conditional strict DWR-space consistency, 63.62% compared with 31.95% for the gradient ablation. Because the numbers of riming- and aggregation-labeled pixels differed, we additionally calculated class-balanced consistency, defined as the unweighted mean of the riming-specific and aggregation-specific DWR-space consistencies. The resulting values were 39.82% for the threshold ablation and 47.70% for the gradient ablation. More importantly, the proportion of the complete evaluation domain that was both classified and supported by the corresponding DWR reference regime was 0.56% for the threshold ablation and 7.49% for the gradient ablation. Thus, the non-DWR gradient classifier produced a substantially larger quantity of physically coherent classifications, despite extending the analysis beyond only the most pronounced end-member signatures. Using only the vertical gradients of MDV, SW, and LDR, the DWR-withheld gradient ablation also reproduced the dominant discrete label of the complete gradient classifier in all four representative intervals. A relaxed majority-vote sensitivity test substantially increased the classified area, reaching 37.86% for the threshold ablation and 100% for the gradient ablation. These ablation results demonstrate that the vertical evolution of MDV, SW, and LDR contains physically coherent process information even when all DWR- and D0-related inputs are excluded.
The threshold method acts as a selective detector of pronounced and well-developed end-member signatures. The gradient-based method, by contrast, uses coordinated vertical changes to identify process development before all absolute radar characteristics have reached their mature values. The earlier identification of aggregation at higher altitudes is also physically consistent with the subsequent development of large-aggregate radar signatures at lower levels. Aggregates initiated aloft require time and fall distance to grow through repeated collisions. With typical unrimed aggregate fall speeds of approximately 0.5–1 m s−1, descent over several kilometers requires tens of minutes. During this period, continued aggregation increases particle size and porosity until the particles produce a strongly enhanced DWRX–Ka response and a DWRKa–W response approaching saturation. The apparent vertical displacement between the gradient-based aggregation signal and the fully developed triple-frequency hook therefore reflects successive stages of the same particle-growth process.

4. Discussion

In this study, ground-based triple-frequency radar observations were used to identify and compare riming and aggregation microphysical processes in a snowfall event, using both the Multi-Parameter Threshold Method and the Gradient-Based Multi-Parameter Identification Method. Both methods are fundamentally parameter-based approaches, and overall each was able to effectively reveal the primary microphysical characteristics of this snowfall event. In particular, they both captured the overall evolution of the snowfall: coexisting riming and aggregation in the early stage, a riming-dominated period in the middle stage, and an aggregation-dominated period in the later stage. This indicates that both approaches were generally consistent in depicting the event’s macroscopic evolution. Riming-dominated signatures were most evident in the mid-level cloud at approximately 2–4 km during 18:00–22:00 UTC on 3 January and in the lower-middle cloud at approximately 1–4 km during 01:00–03:00 UTC on 4 January. Aggregation-consistent signatures occurred in a low-level layer immediately above the melting layer at approximately 0.8–1.2 km during 18:30–20:10 UTC on 3 January, with the clearest local expressions during 18:30–19:00 UTC and 19:30–20:10 UTC. Aggregation subsequently became widespread at approximately 1–4 km during 03:00–05:00 UTC on 4 January, although localized riming signatures persisted near 2 km. These overlapping time–height regions demonstrate that the transition between riming and aggregation was vertically heterogeneous rather than spatially uniform.
Taken together, the quantitative DWR-space results distinguish three physically different situations: aggregation-dominated conditions in Figure 5a,c, aggregation-dominated coexistence in Figure 5b, and a temporally evolving riming-to-aggregation transition in Figure 5d, where the median preference index shifted from negative to positive values. At the whole-event scale, the gradient-based method classified 14.11% of the valid evaluation domain, compared with 8.86% for the threshold method, corresponding to a relative expansion of 59.2%; 98.43% of the inter-method differences occurred near process boundaries. These findings indicate that the gradient formulation primarily extended the detectable domain of weak, spatially heterogeneous, and temporally evolving riming-to-aggregation transitions while preserving the event-scale sequence resolved by both methods.
Because DWR and the DWR-derived D0 contribute to the complete classifiers, the full-classifier DWR-space comparison represents an internal physical-consistency assessment rather than an independent validation. To determine whether the additional sensitivity was driven solely by DWR-related inputs, we conducted a DWR-withheld ablation in which both DWR variables, their vertical gradients, and D0 were excluded during label generation. Under the conservative unanimity rule, the gradient ablation retained 23.43% coverage compared with 0.89% for the threshold ablation, and its physically consistent classification yield was 7.49% compared with 0.56%. Despite this much broader coverage, the class-balanced DWR-space consistency remained comparable, with a higher point estimate for the gradient ablation (47.70% versus 39.82%). Moreover, using only the vertical gradients of MDV, SW, and LDR, the gradient ablation retained the dominant full-method label in all four representative intervals. These results show that the vertical evolution of the non-DWR variables contains physically coherent process information and that the broader gradient-based classification is not solely inherited from DWR. Accordingly, the present evidence supports a process-specific advantage of the gradient approach for weak aggregation, mixed regimes, and evolving process boundaries.
Future validation should combine collocated triple-frequency radar observations with particle-imaging instruments, such as a Multi-Angle Snowflake Camera or Precipitation Imaging Package, and optical disdrometers, such as a two-dimensional video disdrometer. Particle images can provide maximum dimension, projected area, aspect ratio, structural complexity, fall speed, and image-based degree of riming, whereas disdrometers can provide particle size distributions and fall-velocity statistics. Because the radar samples particles aloft while the in situ instruments observe them near the surface, the comparison should account for particle fall time and horizontal advection before matching radar classifications to independent particle-scale reference labels. Classification performance can then be quantified using confusion matrices, class-specific precision and recall, macro-F1 score, and balanced accuracy. The classification criteria should be calibrated using one group of snowfall events and evaluated on separate events, preferably using event-wise validation, so that the independent observations used for evaluation are not also used to tune the method.

5. Conclusions

This study developed a gradient-based multi-parameter framework for identifying riming- and aggregation-dominated snow-growth processes from collocated X-, Ka-, and W-band radar observations. For the 3–4 January 2016 snowfall event, both the conventional multi-parameter threshold method and the gradient-based method captured the event-scale evolution from process coexistence to a riming-dominated stage and subsequently to an aggregation-dominated stage. The gradient-based method additionally expanded the identifiable process domain and provided greater diagnostic detail for weak aggregation, mixed regimes, process boundaries, and the temporal transition from riming-influenced to aggregation-dominated conditions. The quantitative DWR-space analysis supported the physical interpretations of the representative disagreement regions, while the DWR-withheld experiment showed that the vertical evolution of MDV, SW, and LDR retained physically coherent process information even when all DWR- and D0-related inputs were excluded during label generation. These results establish a process-specific and physically coherent proof of concept for the present event. Independent verification using collocated particle-imaging and disdrometer observations, together with evaluation across multiple snowfall events and radar configurations, is required before the method’s broader transferability can be established. If confirmed by such observations, the framework could provide useful process information for snowfall retrievals and ice-phase microphysics parameterizations.

Author Contributions

D.W. carried out the investigations and wrote the manuscript. W.H. and Y.B. contributed equally by providing scientific input and advice throughout the study and by critically revising the manuscript. X.X. and H.C. provided scientific input and advice and reviewed the manuscript. All authors have read and agreed to the published version of the manuscript.

Funding

This work was supported by the International Cooperation Program of the Bureau of International Cooperation, Chinese Academy of Sciences (BIC, CAS; Grant No. 119GJHZ2025054MI); the National Key Research and Development Program of China (Grant No. 2022YFF0801301); and the Innovation Foundation of CPML/CMA (Grant No. 2023CPML-A01).

Data Availability Statement

The Level-2 ground-based X-, Ka-, and W-band radar observations analyzed in this study are publicly available through the TRIPEx dataset on Zenodo at https://doi.org/10.5281/zenodo.1341389.

Acknowledgments

The authors gratefully acknowledge the TRIple-frequency and Polarimetric radar Experiment (TRIPEx) for providing the high-quality radar dataset used in this study. These observations were essential for the identification and analysis of microphysical processes associated with winter precipitation. We also extend our appreciation to the TRIPEx team for their dedicated efforts in field deployment, instrument operation, and data management.

Conflicts of Interest

The authors declare no conflicts of interest.

References

  1. Oue, M.; Kollias, P.; Matrosov, S.Y.; Battaglia, A.; Ryzhkov, A.V. Analysis of the microphysical properties of snowfall using scanning polarimetric and vertically pointing multi-frequency Doppler radars. Atmos. Meas. Tech. 2021, 14, 4893–4913. [Google Scholar] [CrossRef] [Scilit]
  2. Kneifel, S.; Kollias, P.; Battaglia, A.; Leinonen, J.; Maahn, M.; Kalesse, H.; Tridon, F. First observations of triple-frequency radar Doppler spectra in snowfall: Interpretation and applications. Geophys. Res. Lett. 2016, 43, 2225–2233. [Google Scholar] [CrossRef] [Scilit]
  3. Kalesse, H.; Szyrmer, W.; Kneifel, S.; Kollias, P.; Luke, E. Fingerprints of a riming event on cloud radar Doppler spectra: Observations and modeling. Atmos. Chem. Phys. 2016, 16, 2997–3012. [Google Scholar] [CrossRef] [Scilit]
  4. Braham, R.R., Jr. Snow particle size spectra in lake-effect snows. J. Appl. Meteorol. 1990, 29, 200–207. [Google Scholar] [CrossRef] [Scilit]
  5. Bringi, V.N.; Kennedy, P.C.; Huang, G.-J.; Kleinkort, C.; Thurai, M.; Notaroš, B.M. Dual-polarized radar and surface observations of a winter graupel shower with negative ZDR column. J. Appl. Meteorol. Climatol. 2017, 56, 455–470. [Google Scholar] [CrossRef] [Scilit][Green Version]
  6. Leinonen, J.; Lebsock, M.D.; Tanelli, S.; Sy, O.O.; Dolan, B.; Chase, R.J.; Finlon, J.A.; von Lerber, A.; Moisseev, D. Retrieval of snowflake microphysical properties from multifrequency radar observations. Atmos. Meas. Tech. 2018, 11, 5471–5488. [Google Scholar] [CrossRef] [Scilit]
  7. Teisseire, A.; Billault-Roux, A.-C.; Vogl, T.; Seifert, P. Attribution of riming and aggregation processes by application of the vertical distribution of particle shape (VDPS) and spectral retrieval techniques to cloud radar observations. Atmos. Meas. Tech. 2025, 18, 1499–1517. [Google Scholar] [CrossRef] [Scilit]
  8. von Terzi, L.; Dias Neto, J.; Ori, D.; Myagkov, A.; Kneifel, S. Ice microphysical processes in the dendritic growth layer: A statistical analysis combining multi-frequency and polarimetric Doppler cloud radar observations. Atmos. Chem. Phys. 2022, 22, 11795–11821. [Google Scholar] [CrossRef] [Scilit]
  9. Dolan, B.; Rutledge, S.A. A theory-based hydrometeor identification algorithm for X-band polarimetric radars. J. Atmos. Ocean. Technol. 2009, 26, 2071–2088. [Google Scholar] [CrossRef] [Scilit]
  10. Allabakash, S.; Lim, S.; Chandrasekar, V.; Min, K.-H.; Choi, J.; Jang, B. X-band dual-polarization radar observations of snow growth processes of a severe winter storm: Case of 12 December 2013 in South Korea. J. Atmos. Ocean. Technol. 2019, 36, 1217–1235. [Google Scholar] [CrossRef] [Scilit]
  11. Oue, M.; Galletti, M.; Verlinde, J.; Ryzhkov, A.; Lu, Y. Use of X-band differential reflectivity measurements to study shallow Arctic mixed-phase clouds. J. Appl. Meteorol. Climatol. 2016, 55, 403–424. [Google Scholar] [CrossRef] [Scilit]
  12. Thompson, E.J.; Rutledge, S.A.; Dolan, B.; Chandrasekar, V.; Cheong, B.L. A dual-polarization radar hydrometeor classification algorithm for winter precipitation. J. Atmos. Ocean. Technol. 2014, 31, 1457–1481. [Google Scholar] [CrossRef] [Scilit]
  13. Blanke, A.; Gergely, M.; Trömel, S. A new aggregation and riming discrimination algorithm based on polarimetric weather radars. Atmos. Chem. Phys. 2025, 25, 4167–4184. [Google Scholar] [CrossRef] [Scilit]
  14. Vogl, T.; Maahn, M.; Kneifel, S.; Schimmel, W.; Moisseev, D.; Kalesse-Los, H. Using artificial neural networks to predict riming from Doppler cloud radar observations. Atmos. Meas. Tech. 2022, 15, 365–381. [Google Scholar] [CrossRef] [Scilit]
  15. Mosimann, L. An improved method for determining the degree of snow crystal riming by vertical Doppler radar. Atmos. Res. 1995, 37, 305–323. [Google Scholar] [CrossRef] [Scilit]
  16. Zawadzki, I.; Fabry, F.; Szyrmer, W. Observations of supercooled water and secondary ice generation by a vertically pointing X-band Doppler radar. Atmos. Res. 2001, 59–60, 343–359. [Google Scholar] [CrossRef] [Scilit]
  17. Dias Neto, J.; Kneifel, S.; Ori, D.; Trömel, S.; Handwerker, J.; Bohn, B.; Hermes, N.; Mühlbauer, K.; Lenefer, M.; Simmer, C. The TRIple-frequency and polarimetric radar experiment for improving process observations of winter precipitation. Earth Syst. Sci. Data 2019, 11, 845–863. [Google Scholar] [CrossRef] [Scilit]
  18. Illingworth, A.J.; Lees, M.I. Comparison of lightning location data and polarisation radar observations of clouds. In Proceedings of the 1991 International Aerospace and Ground Conference on Lightning and Static Electricity, Cocoa Beach, FL, USA, 16–19 April 1991; pp. 85-1–85-10. [Google Scholar]
  19. Tyynelä, J.; von Lerber, A. Validation of microphysical snow models using in situ, multifrequency, and dual-polarization radar measurements in Finland. J. Geophys. Res. Atmos. 2019, 124, 13273–13290. [Google Scholar] [CrossRef] [Scilit]
  20. Bringi, V.N.; Chandrasekar, V. Polarimetric Doppler Weather Radar: Principles and Applications; Cambridge University Press: Cambridge, UK, 2001; 636p. [Google Scholar] [CrossRef] [Scilit]
  21. Tyynelä, J.; Chandrasekar, V. Characterizing falling snow using multifrequency dual-polarization measurements. J. Geophys. Res. Atmos. 2014, 119, 8268–8283. [Google Scholar] [CrossRef] [Scilit]
  22. Kneifel, S.; von Lerber, A.; Tiira, J.; Moisseev, D.; Kollias, P.; Leinonen, J. Observed relations between snowfall microphysics and triple-frequency radar measurements. J. Geophys. Res. Atmos. 2015, 120, 6034–6055. [Google Scholar] [CrossRef] [Scilit]
  23. Mason, S.L.; Chiu, C.J.; Hogan, R.J.; Moisseev, D.; Kneifel, S. Retrievals of riming and snow density from vertically pointing Doppler radars. J. Geophys. Res. Atmos. 2018, 123, 13807–13834. [Google Scholar] [CrossRef] [Scilit]
  24. Tridon, F.; Silber, I.; Battaglia, A.; Kneifel, S.; Fridlind, A.; Kalogeras, P.; Dhillon, R. Highly supercooled riming and unusual triple-frequency radar signatures over McMurdo Station, Antarctica. Atmos. Chem. Phys. 2022, 22, 12467–12491. [Google Scholar] [CrossRef] [Scilit]
  25. Leinonen, J.; Kneifel, S.; Moisseev, D.; Tyynelä, J.; Tanelli, S.; Nousiainen, T. Evidence of nonspheroidal behavior in millimeter-wavelength radar observations of snowfall. J. Geophys. Res. Atmos. 2012, 117, D18205. [Google Scholar] [CrossRef] [Scilit]
  26. Mason, S.L.; Hogan, R.J.; Westbrook, C.D.; Kneifel, S.; Moisseev, D.; von Terzi, L. The importance of particle size distribution and internal structure for triple-frequency radar retrievals of the morphology of snow. Atmos. Meas. Tech. 2019, 12, 4993–5018. [Google Scholar] [CrossRef] [Scilit]
  27. Planat, N.; Gehring, J.; Vignon, É.; Berne, A. Identification of snowfall microphysical processes from Eulerian vertical gradients of polarimetric radar variables. Atmos. Meas. Tech. 2021, 14, 4543–4564. [Google Scholar] [CrossRef] [Scilit]
  28. Kumjian, M.R.; Prat, O.P.; Reimel, K.J.; van Lier-Walqui, M.; Morrison, H.C. Dual-polarization radar fingerprints of precipitation physics: A review. Remote Sens. 2022, 14, 3706. [Google Scholar] [CrossRef] [Scilit]
  29. Karrer, M.; Dias Neto, J.; von Terzi, L.; Kneifel, S. Melting behavior of rimed and unrimed snowflakes investigated with statistics of triple-frequency Doppler radar observations. J. Geophys. Res. Atmos. 2022, 127, e2021JD035907. [Google Scholar] [CrossRef] [Scilit]
  30. Myagkov, A.; Kneifel, S.; Rose, T. Evaluation of the reflectivity calibration of W-band radars based on observations in rain. Atmos. Meas. Tech. 2020, 13, 5799–5825. [Google Scholar] [CrossRef] [Scilit]
  31. Hersbach, H.; Bell, B.; Berrisford, P.; Hirahara, S.; Horányi, A.; Muñoz-Sabater, J.; Nicolas, J.; Peubey, C.; Radu, R.; Schepers, D.; et al. The ERA5 global reanalysis. Q. J. R. Meteorol. Soc. 2020, 146, 1999–2049. [Google Scholar] [CrossRef] [Scilit]
  32. Murphy, D.M.; Koop, T. Review of the vapour pressures of ice and supercooled water for atmospheric applications. Q. J. R. Meteorol. Soc. 2005, 131, 1539–1565. [Google Scholar] [CrossRef] [Scilit]
  33. Chellini, G.; Gierens, R.; Kneifel, S. Ice aggregation in low-level mixed-phase clouds at a high Arctic site: Enhanced by dendritic growth and absent close to the melting level. J. Geophys. Res. Atmos. 2022, 127, e2022JD036860. [Google Scholar] [CrossRef] [Scilit]
  34. Gaussiat, N.; Sauvageot, H.; Illingworth, A.J. Cloud liquid water and ice content retrieval by multiwavelength radar. J. Atmos. Ocean. Technol. 2003, 20, 1264–1275. [Google Scholar] [CrossRef] [Scilit][Green Version]
  35. Savitzky, A.; Golay, M.J.E. Smoothing and differentiation of data by simplified least squares procedures. Anal. Chem. 1964, 36, 1627–1639. [Google Scholar] [CrossRef] [Scilit]
  36. Ekelund, R.; Eriksson, P. Impact of ice aggregate parameters on microwave and sub-millimetre scattering properties. J. Quant. Spectrosc. Radiat. Transf. 2019, 224, 233–246. [Google Scholar] [CrossRef] [Scilit]
  37. Locatelli, J.D.; Hobbs, P.V. Fall speeds and masses of solid precipitation particles. J. Geophys. Res. 1974, 79, 2185–2197. [Google Scholar] [CrossRef] [Scilit]
  38. Brast, M.; Markmann, P. Detecting the melting layer with a micro rain radar using a neural network approach. Atmos. Meas. Tech. 2020, 13, 6645–6656. [Google Scholar] [CrossRef] [Scilit]
  39. Li, H.; Tiira, J.; von Lerber, A.; Moisseev, D. Towards the connection between snow microphysics and melting layer: Insights from multifrequency and dual-polarization radar observations during BAECC. Atmos. Chem. Phys. 2020, 20, 9547–9562. [Google Scholar] [CrossRef] [Scilit]
  40. Romatschke, U. Melting layer detection and observation with the NCAR airborne W-band radar. Remote Sens. 2021, 13, 1660. [Google Scholar] [CrossRef] [Scilit]
  41. Carlin, J.T.; Reeves, H.D.; Ryzhkov, A.V. Polarimetric observations and simulations of sublimating snow: Implications for nowcasting. J. Appl. Meteorol. Climatol. 2021, 60, 1035–1054. [Google Scholar] [CrossRef] [Scilit]
  42. Vignon, É.; Besic, N.; Jullien, N.; Gehring, J.; Berne, A. Microphysics of snowfall over coastal East Antarctica simulated by Polar WRF and observed by radar. J. Geophys. Res. Atmos. 2019, 124, 11452–11476. [Google Scholar] [CrossRef] [Scilit]
  43. Nguyen, C.M.; Wolde, M.; Battaglia, A.; Nichman, L.; Bliankinshtein, N.; Haimov, S.; Bala, K.; Schuettemeyer, D. Coincident in situ and triple-frequency radar airborne observations in the Arctic. Atmos. Meas. Tech. 2022, 15, 775–795. [Google Scholar] [CrossRef] [Scilit]
Figure 1. Profiles of Ka-band radar Ze (a), MDV (b), SW (c), and LDR (d) during the snowfall event from 12:00 on 3 January 2016 to 12:00 on 4 January 2016.
Remotesensing 18 03034 g001
Figure 2. Distributions of (a) DWRX−Ka, (b) DWRKa−W, and (c) D0 during the snowfall event.
Remotesensing 18 03034 g002
Figure 3. Vertical gradient profiles of triple-frequency radar observations during the snowfall event, including MDV (a), SW (b), LDR (c), DWRX−Ka (d), and DWRKa−W (e). The dashed lines indicate the 0 °C and −15 °C levels.
Remotesensing 18 03034 g003
Figure 4. Rimed and aggregated particles and their regions of occurrence identified by the two methods ((a): Multi-Parameter Threshold Method; (b): Gradient-Based Multi-Parameter Identification Method).
Remotesensing 18 03034 g004
Figure 5. Scatter plots of DWRX−Ka vs. DWRKa−W for four representative time–height intervals. The blue solid line represents a typical riming process, and the red solid line represents a typical aggregation process. The riming and aggregation reference curves were digitized and recolored from Figure 15 of Kneifel et al. [22]. (Adapted with permission from Ref. [22]. Copyright © 2015 American Geophysical Union.).
Remotesensing 18 03034 g005
Table 1. Criteria for identifying rimed and aggregated particles in the Multi-Parameter Threshold Method.
Rimed ParticlesAggregated ParticlesReferences
Ze (dBZ)>20<20[9,10,11,12]
MDV (m/s)<−1.5>−1[13,14,15,16]
SW (m/s)>0.5<0.3
LDR (dB)<−26>−18[17,18,19,20,21]
D0 (mm)<3>3[4,5,7,8,34]
DWR (dB) D W R K a W > 5
D W R X K a < 3
D W R X K a > 3
D W R K a W < 8
[17,22,23,24]
Table 2. Criteria for identifying riming and aggregation in the Gradient-Based Multi-Parameter Identification Method.
DWR (dB/m)MDV (s−1)SW (s−1)LDR (dB/m)
Aggregation D W R X K a > 0 >0<0>0
Riming D W R K a W > 0 <0>0<0
References[17,22,24][1,3,37][1,18]
Disclaimer/Publisher’s Note: The statements, opinions and data contained in all publications are solely those of the individual author(s) and contributor(s) and not of MDPI and/or the editor(s). MDPI and/or the editor(s) disclaim responsibility for any injury to people or property resulting from any ideas, methods, instructions or products referred to in the content.