Review

SWOT Wide-Swath Altimetry for Inland-Water Remote Sensing: Applications, Challenges, and Prospects—A Systematic Bibliometric and Thematic Review


1
Beijing Laboratory of Water Resources Security, Capital Normal University, Beijing 100048, China
2
College of Resources Environment and Tourism, Capital Normal University, Beijing 100048, China
3
State Key Laboratory of Urban Environmental Processes and Digital Simulation, Capital Normal University, Beijing 100048, China
4
Key Laboratory of 3D Information Acquisition and Application, Ministry of Education, Beijing 100048, China
*
Author to whom correspondence should be addressed.
Remote Sens. 2026, 18(19), 3274; https://doi.org/10.3390/rs18193274
Submission received: 13 August 2026 / Revised: 17 September 2026 / Accepted: 19 September 2026 / Published: 22 September 2026
(This article belongs to the Topic Advances in Hydrological Remote Sensing, 2nd Edition)

Highlights

What are the main findings?
  • SWOT hydrology has rapidly shifted from pre-launch simulation and algorithm development to post-launch validation, discharge estimation, and model-integrated applications, while research participation remains geographically uneven.
  • Post-launch evidence shows that SWOT water-surface-elevation performance is strongly context dependent: more robust results are generally obtained over large and open waters, whereas narrow, vegetated, fragmented, and tidal environments—and especially discharge inversion—remain more sensitive to sampling, processing, and hydraulic assumptions.
What are the implications of the main findings?
  • SWOT performance should be evaluated using environment-specific validation and the transparent reporting of processing choices, spatial support, and uncertainty rather than a single mission-wide accuracy value.
  • The strongest pathway toward operational hydrology is to integrate SWOT with in situ gauges, ICESat-2, optical/SAR observations, and hydrological–hydraulic models, particularly in poorly gauged river networks and estuarine environments.

Abstract

The Surface Water and Ocean Topography (SWOT) mission represents a major advance in satellite hydrology by extending conventional nadir altimetry to two-dimensional wide-swath observations of the inland-water surface elevation, extent, width, and slope. This review combines a bibliometric analysis of 556 publications indexed in the Web of Science Core Collection from January 2019 to April 2026 with a thematic synthesis of representative post-launch studies. In contrast to earlier reviews centered largely on mission preparation or individual application domains, we examine the evolution of SWOT research together with study-level evidence on data products, water-surface-elevation retrieval, river-discharge estimation, hydrological applications, uncertainty, and multi-mission integration. The literature shows a clear transition from pre-launch algorithm development and simulation toward post-launch validation and application. Reported water-surface-elevation performance is strongly context dependent: representative studies include a mean RMSE of 0.29 m across Yangtze River stations, MAE below 0.10 m for Tibetan Plateau lakes against ICESat-2, and MAE of 6.7 cm for 1 km2-averaged elevations in herbaceous wetlands. These values should be interpreted as study-specific evidence rather than as single mission-wide accuracy because the validation design, spatial support, environmental conditions, and processing strategies differ substantially among studies. River-discharge estimation remains more uncertain because the bathymetry, roughness, channel geometry, slope estimation, and temporal sampling introduce additional uncertainty. Major remaining challenges concern observation constraints, processing and product uncertainty, transferability, operational implementation, and uneven validation evidence. Future progress will depend on standardized and reproducible processing, uncertainty-aware validation, cross-regional benchmarking, and the integration of SWOT with complementary satellite observations and hydrological or hydraulic models.

1. Introduction

The sustainable management of global water resources remains a major challenge in the twenty-first century. Increasing hydrological extremes, flood exposure, and uneven monitoring capacity have intensified the need for consistent observations of surface-water dynamics [1]. However, river and lake gauges remain sparse or discontinuous in many remote and transboundary basins, making satellite observations important for closing global hydrological information gaps [2,3].
Conventional optical remote sensing and nadir altimetry have substantially advanced surface-water monitoring, but their observation geometries remain complementary rather than equivalent to SWOT. Optical imagery is well suited to mapping the water extent, whereas conventional radar altimeters primarily provide water-level measurements along ground tracks; together, these approaches leave important gaps in the spatially continuous characterization of water-surface elevation and hydraulic gradients. Recent multi-sensor studies therefore increasingly combine wide-swath SWOT observations with optical, SAR, or laser-altimetry data rather than treating any single sensor as sufficient [4,5]. ICESat-2 provides precise along-track elevation measurements and is especially useful as an independent elevation constraint for cross-validation and hydraulic-model diagnosis [5,6].
The Surface Water and Ocean Topography (SWOT) mission, jointly developed by NASA and CNES, was designed to address this long-standing observational gap. Equipped with the Ka-band Radar Interferometer (KaRIn), SWOT provides wide-swath measurements of the water surface elevation, extent, width, and slope over rivers, lakes, reservoirs, wetlands, floodplains, and estuarine waters [7,8]. By observing elevation and extent simultaneously, SWOT bridges the gap between image-based water mapping and point-based satellite altimetry, enabling a more spatially coherent analysis of hydraulic processes, storage dynamics, and discharge-related variables.
Since its launch, SWOT hydrology has shifted from mission preparation and technical demonstration toward post-launch validation and application-oriented research. Recent studies now span river WSE validation [9,10,11], lake monitoring and cross-validation [6], wetlands and estuaries [12,13,14], river-discharge estimation [15], flood-extent extraction [16], multi-satellite storage-change analysis [4], and application-oriented/operational demonstrations [17]. Several SWOT-related reviews were published before launch or focus on individual application domains. This review differs by combining a bibliometric corpus of 556 publications with a post-launch thematic synthesis organized around data products, hydrological environments, validation evidence, discharge-inversion methods, uncertainty, and multi-mission integration. This framework links field-level research trends with study-level evidence, compares context-dependent performance rather than relying on a single accuracy value, and evaluates how SWOT can complement optical, SAR, laser-altimetry, gravity, and hydrological-model information. The objective is to characterize the evolution and knowledge structure of SWOT inland-water research and to synthesize evidence on observation principles, data products, water-surface-elevation retrieval, river-discharge estimation, hydrological applications, uncertainties, remaining challenges, and future research needs.

2. Bibliometric Analysis

2.1. Literature Retrieval, Eligibility, Screening, and Synthesis Methods

Publications were retrieved from the Web of Science Core Collection (WoSCC). The bibliographic corpus covered records published or indexed from January 2019 through April 2026. The search strategy combined SWOT-related terms, including “Surface Water and Ocean Topography”, “SWOT mission”, “SWOT satellite”, “SWOT altimetry”, and “KaRIn”, with hydrological terms such as “river”, “lake”, “reservoir”, “flood”, “discharge”, “water level”, and “surface water”. The complete WoSCC search strategy is provided in Supplementary Material S1. Records in which SWOT referred only to “strengths, weaknesses, opportunities, and threats” were excluded. Geographic distribution was defined from the authors’ institutional affiliations rather than study-area locations; accordingly, the geographic analysis represents institutional participation in SWOT hydrological research and should not be interpreted as the spatial distribution of investigated water bodies. CiteSpace (version 6.4.2) was used to construct keyword co-occurrence networks, identify thematic clusters, and examine temporal changes in research topics. Bibliometric findings were summarized using publication trends, affiliation-based geographic patterns, keyword-network visualizations, and a narrative interpretation.
Eligibility was determined based on the substantive relevance of records to SWOT/KaRIn applications in inland-water remote sensing and hydrology. Records were included when they addressed SWOT observation principles or data products, water-surface elevation, river discharge, or hydrological applications involving rivers, lakes and reservoirs, wetlands and floodplains, or estuarine waters. Records were excluded when their title, abstract, or full-text content did not address the scope of this review. For bibliometric analysis, all eligible records were treated as one bibliographic corpus. For thematic synthesis, representative eligible studies were organized according to observation principles, SWOT data products, hydrological setting, water-level retrieval, discharge estimation, applications, uncertainty, and limitations.
Screening was conducted sequentially at the title/abstract and full-text levels by the first author. The corresponding author reviewed the screening decisions and eligibility judgments. Any disagreements regarding study inclusion were resolved through discussion and consensus among the authors. No automation tools were used for study screening.
Bibliographic metadata extracted for the bibliometric analysis included the publication year, author institutional affiliations, and keywords. Thematic information was extracted and coded according to the observation principles, SWOT data products, hydrological setting, reported retrieval performance, application type, uncertainty, and stated limitations. Data extraction and thematic coding were performed by the first author and reviewed by the corresponding author. Any disagreements were resolved through discussion and consensus. Study authors were not contacted because all information was obtained from publicly available publications and Supplementary Materials. No automation tools were used for data extraction.
Because the included studies focused on remote-sensing methods, validation, and hydrological applications rather than comparative interventions, no intervention-based outcomes or common effect measures were defined. The principal thematic domains were water-surface-elevation retrieval performance, river-discharge estimation performance and methodological dependence, application type, uncertainty, and stated limitations. Additional variables included the publication year, institutional affiliation, keywords, SWOT product type, and hydrological setting. No statistical imputation was performed; unclear information was interpreted based on the information available in the published articles and Supplementary Materials.
Individual studies were summarized narratively and through representative tables, while bibliometric patterns were visualized using figures. Given the methodological heterogeneity of the included literature in terms of objectives, methods, and evaluation metrics, no quantitative meta-analysis, pooled effect estimate, subgroup analysis, meta-regression, or sensitivity analysis was performed. No formal study-level risk-of-bias instrument, reporting-bias assessment, or certainty-of-evidence grading was applied. Methodological limitations and uncertainty were synthesized narratively across different hydrological settings and application scenarios.
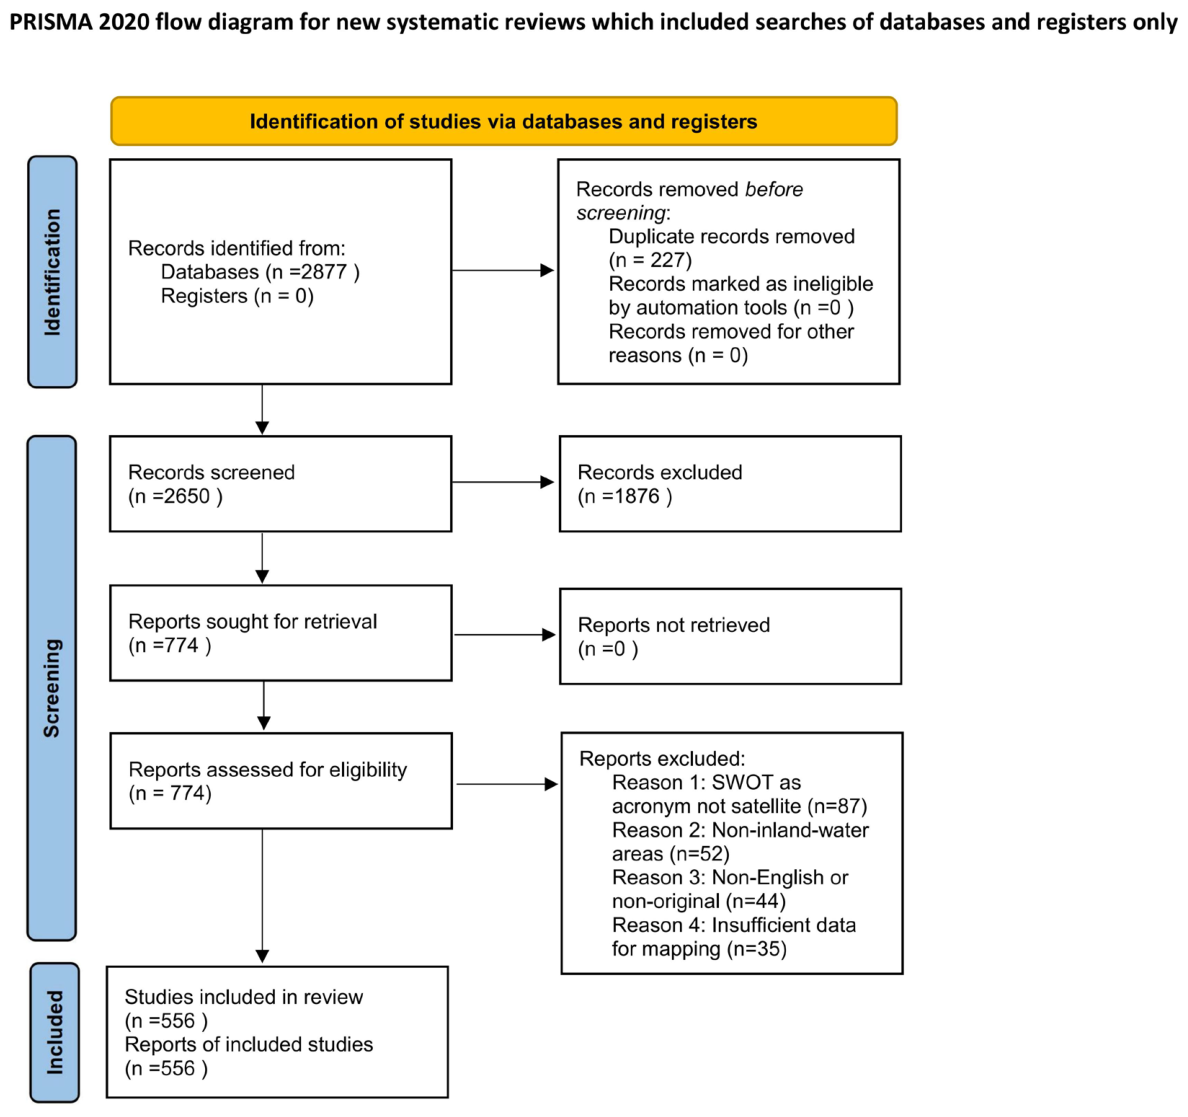
The detailed study-selection process, including the numbers of identified records, removed duplicates, screened records, excluded full texts, and included publications, is presented in Figure 1. After duplicate removal and relevance screening, 556 publications were retained in the bibliometric review dataset, and representative studies were further discussed in the thematic synthesis. This review was reported with reference to the Preferred Reporting Items for Systematic Reviews and Meta-Analyses (PRISMA) 2020 statement, and the completed official PRISMA 2020 checklist is supplied as Supplementary Material S1.

2.2. Evolutionary Trajectory

The publication trajectory closely follows the implementation timeline of the SWOT mission. As shown in Figure 2b, annual publication counts (N = 556) increased gradually during the pre-launch period and accelerated markedly after SWOT was launched in December 2022. Pre-launch research focused mainly on mission design, AirSWOT campaigns, synthetic observations, and algorithm development [7,8,18]. An important part of this pre-launch phase was the development and use of SWOT simulators, which enabled researchers to generate SWOT-like observations before real satellite data became available. The CNES SWOT Hydrology Toolbox, including the large-scale pixel-cloud simulator (SISIMP) and hydrological processing modules such as LOCNES, supported algorithm testing, product prototyping, data-assimilation experiments, and the evaluation of retrieval methods under controlled conditions. Such simulation frameworks played an important bridging role between mission design and post-launch operational processing [19].
These methodological developments also involved important contributions from CNES engineers and algorithm developers who may be under-represented in conventional bibliometric author rankings. For example, Claire Pottier contributed substantially to the design and development of SWOT lake-processing algorithms and products, while Damien Desroches was involved in hydrology simulation and algorithm-development activities. Their contributions illustrate that the development of SWOT hydrology products relied not only on peer-reviewed scientific publications, but also on mission documentation, software development, algorithm prototypes, and technical collaboration between CNES and JPL. Consequently, bibliometric author networks based only on indexed journal literature may not fully represent the technical community that contributed to the early development of SWOT algorithms and products.
After launch, the focus shifted toward calibration, validation, and product-performance assessment using real SWOT observations in rivers, lakes, wetlands, and estuarine environments [6,9,10,11,12,13]. Since 2024, the field has also expanded into discharge estimation, flood mapping, storage-change analysis, hydraulic-model calibration, and data assimilation [4,15,16,20,21]. Thus, recent publication growth reflects a transition from mission-oriented preparation and simulation-based development to post-launch validation and integrated hydrological applications.
An additional dimension of this transition is the emergence of distributed validation networks and citizen-science initiatives associated with SWOT. Representative examples include the French Observations des Eaux continentales par des Citoyens et des Satellites (OECS) initiative and the Lake Observations by Citizen Scientists and Satellites (LOCSS) project. These programs complement conventional field campaigns by engaging local participants in collecting water-level observations that can be compared with SWOT-derived elevations, thereby extending the spatial and temporal availability of independent validation data.
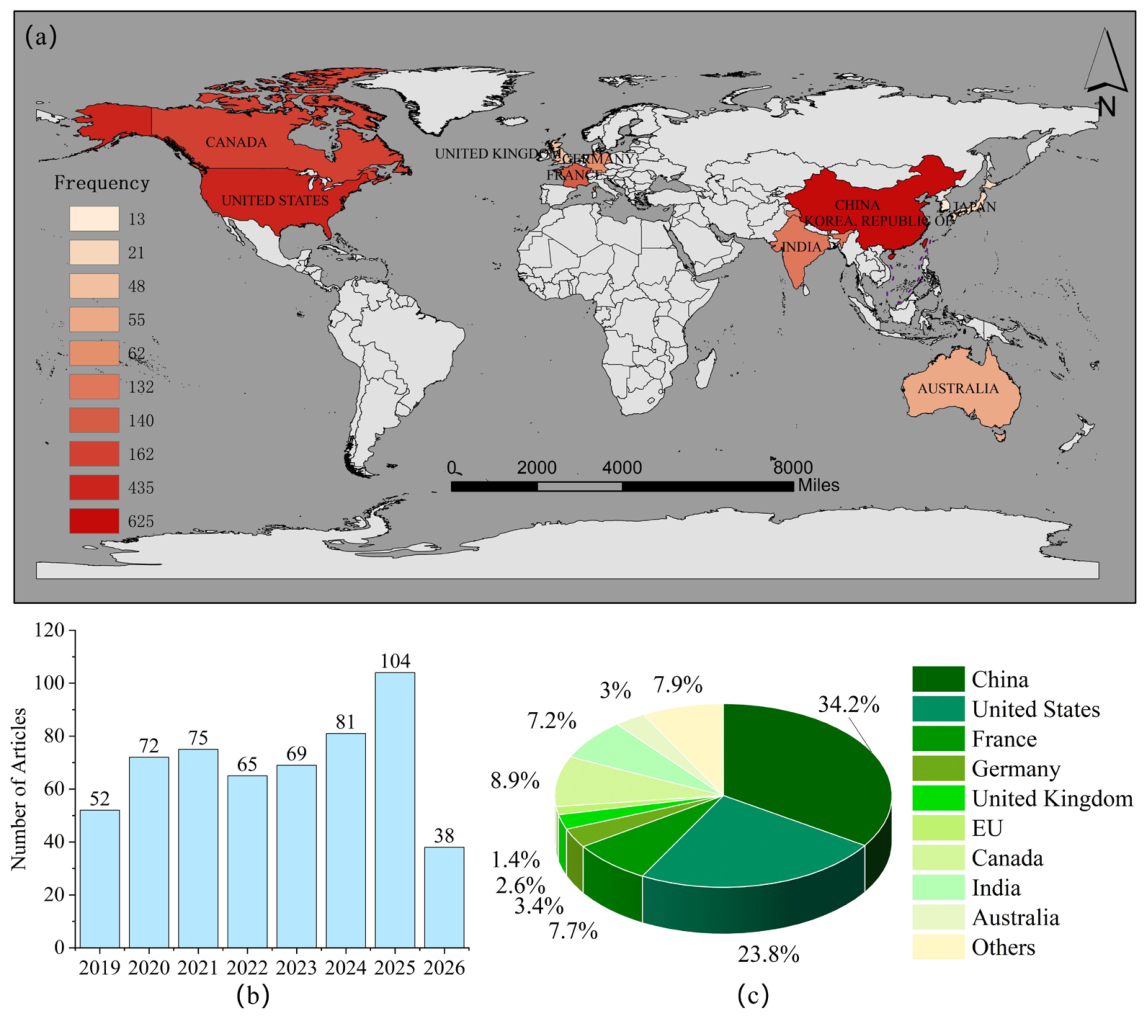
The geographic pattern of institutional participation is shown in Figure 2a,c. Figure 2a maps the authors’ affiliated institutions, whereas Figure 2c summarizes country/region participation using author-affiliation occurrences. These statistics do not represent study-area frequency or fractional national shares: an internationally co-authored article can contribute to more than one country. Within this affiliation-based dataset, research participation is concentrated mainly in East Asia, North America, Europe, and Oceania, with China and the United States as major contributors. France also contributes prominently, consistent with the central role of CNES as a co-developer of SWOT with NASA and its extensive involvement in instrument development, ground processing, algorithm design, calibration/validation, and hydrological product generation. The observed country pattern therefore reflects both scientific activity and institutional roles within the mission.
The thematic emphasis also differs among major contributing countries, although these differences should be interpreted qualitatively rather than as formal country-level classifications. Inspection of the literature represented in the dataset shows that many French and U.S. contributions are associated with mission design, algorithm development, calibration/validation, and product generation, whereas a substantial and rapidly expanding body of Chinese work emphasizes downstream hydrological applications, including rivers, lakes, reservoirs, floods, and water-resource studies. This pattern is consistent with a broader transition from a relatively concentrated mission-development community before launch to a more geographically diverse, application-oriented community after launch.
In contrast, Africa, South America, and parts of Central Asia remain under-represented in the affiliation-based literature despite substantial water-security and flood-risk challenges. This imbalance strengthens the case for open workflows, distributed validation, and applications designed for poorly gauged regions. The Casamance study in Senegal [14] is particularly important because it demonstrates the value of SWOT for hydrodynamic modeling in a data-scarce tropical estuary; however, performance decreases in tributaries where bathymetric information is interpolated and local dynamics are more complex. More generally, estuarine validation also requires careful temporal matching to tidal variability, as demonstrated in the hyper-tidal Bristol Channel-Severn Estuary study of Lichtman et al. (2025) [13].

2.3. Knowledge Structure

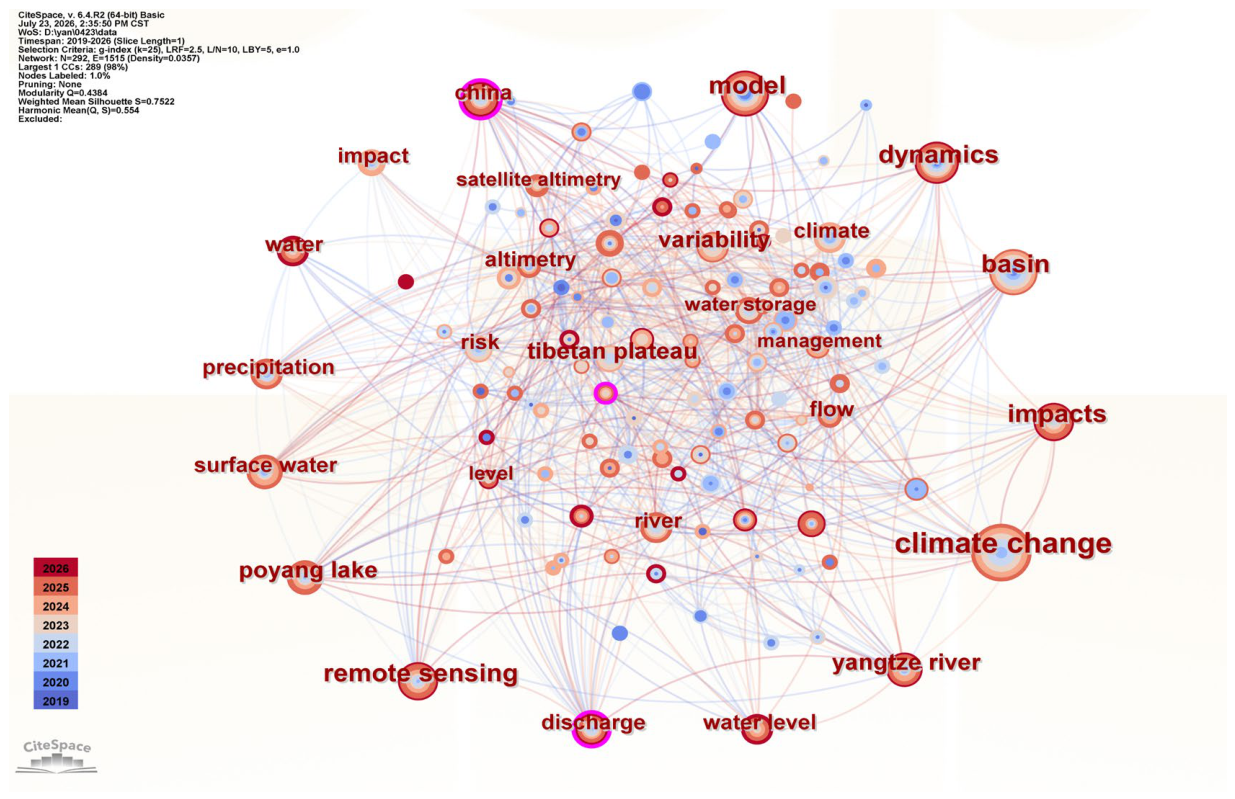
The keyword network in Figure 3 links remote-sensing observations, hydrological processes, modeling, and regional applications. Prominent terms include climate change, model, dynamics, basin, variability, water storage, flow, river, water level, discharge, remote sensing, and satellite altimetry. Their dense interconnections show that the field increasingly combines satellite measurements with hydrological interpretation and basin-scale analysis rather than focusing on a single sensor or retrieval target.
Three thematic domains are apparent. An observation and retrieval domain connects remote sensing, satellite altimetry, surface water, water level, and discharge. A hydrological process and modeling domain links models, dynamics, variability, flow, water storage, basins, and climate change. A regional application domain includes China, the Tibetan Plateau, Poyang Lake, and the Yangtze River, highlighting the role of large basins, lakes, and climate-sensitive regions as test beds for satellite hydrology.
The temporal pattern indicates a shift from general altimetry, modeling, and basin variability toward water-level retrieval, discharge, regional water bodies, climate impacts, and integrated applications. This evolution is consistent with the movement from pre-launch preparation to post-launch validation and use of actual SWOT observations. Keyword prominence, however, reflects attention rather than technical maturity; broader use still depends on independent validation, adequate sampling, ancillary data, processing consistency, and uncertainty propagation.

3. Background

3.1. KaRIn Observation Principles

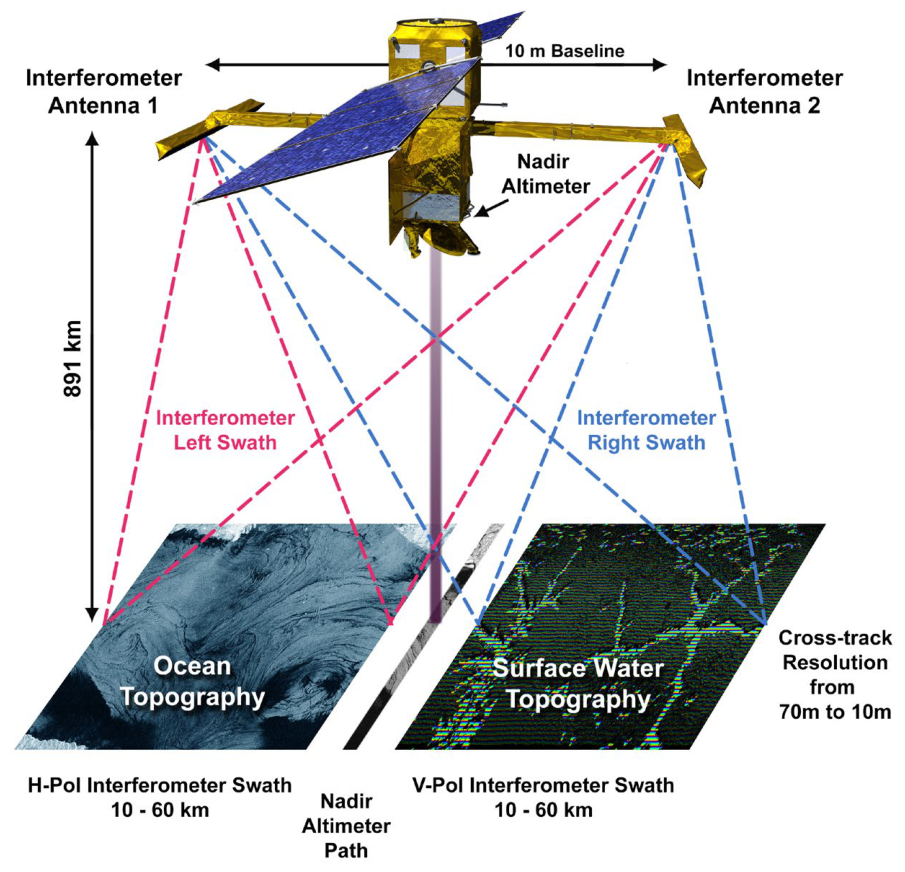
The Ka-band Radar Interferometer (KaRIn) is the core payload that enables SWOT to map water-surface topography across a wide swath rather than only along a nadir ground track. Operating near 35.75 GHz, KaRIn uses two antennas separated by an approximately 10 m baseline; the interferometric phase difference between echoes received by the antennas is converted into cross-track elevation. The resulting two-sided observation geometry provides an overall swath of about 120 km and supports the simultaneous retrieval of the water-surface elevation, extent, width, and slope [7]. SWOT also carries a nadir-looking radar altimeter, which provides along-track measurements and supports cross-calibration and continuity with conventional satellite altimetry.
The hydrological value of this geometry is the co-observation of the elevation and water extent. For rivers, it enables reach-scale water-surface profiles and slopes; for lakes and reservoirs, elevation can be linked to the surface area and storage relationships; and for wetlands and floodplains, elevation and inundation patterns can be examined together. Figure 4 summarizes the KaRIn geometry and the complementary nadir measurement concept.
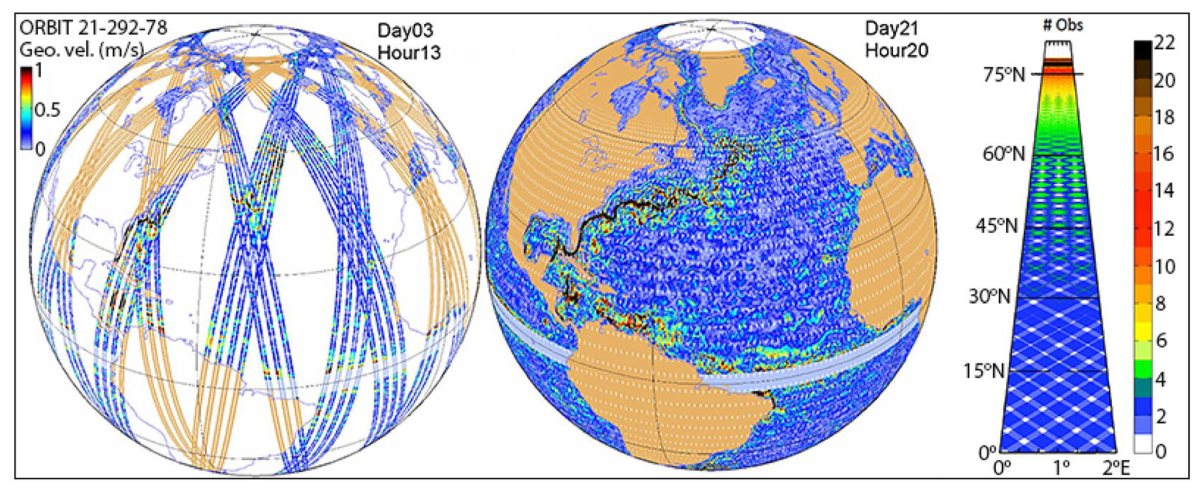
The nominal SWOT science orbit has an inclination of approximately 77.6° and a 21-day repeat cycle, with measurements extending between approximately 78°S and 78°N. Spatial sampling is non-uniform because the swath geometry produces different revisit frequencies with latitude, including increased overlap toward higher latitudes. This sampling pattern is illustrated in Figure 5 and should be considered when matching SWOT observations to hydrological-process timescales and when designing validation or data-assimilation experiments.
Measurement quality is also environment-dependent. Orbit and baseline knowledge, atmospheric corrections, radar coherence, incidence angle, shoreline geometry, vegetation, layover, land-water classification, and spatial aggregation can all influence the density and accuracy of valid water pixels. Consequently, performance is better interpreted by the hydrological setting and processing strategy than by a single mission-wide accuracy number; Section 4.1.1 further evaluates these differences through a study-level comparison of representative quantitative validation metrics.

3.2. SWOT Data Products and Processing

SWOT hydrology products convert KaRIn wide-swath interferometric observations into hydrological variables suitable for scientific analysis and operational applications. These products are organized into multiple processing levels, ranging from raw radar echoes to pixel-level observations, river and lake object products, gridded datasets, and discharge estimates. As summarized in Table 1, each product level differs in the spatial detail, data volume, processing complexity, target users, and application readiness; therefore, product selection should be matched to the specific hydrological objective.
Among the standard terrestrial hydrology products, Level-2 products are the primary source for most SWOT inland-water analyses. L2_HR_PIXC preserves the pixel-level elevation, backscatter, classification, and quality information and supports applications such as flood-extent extraction and local hydraulic analysis, but it requires careful quality screening and classification [16]. L2_HR_Raster provides gridded water-surface variables at fixed spatial resolutions, whereas RiverSP and LakeSP aggregate observations into predefined river reaches/nodes and lake objects. RiverSP reports reach- and node-scale WSE, slope, width, area, and derived discharge estimates, while LakeSP reports lake/reservoir WSE and area information [6]. Higher-level river-discharge datasets, such as the Level-4 Sword of Science products generated with the SWOT Confluence framework, synthesize multiple discharge algorithms and should be interpreted as model-derived estimates rather than direct satellite measurements.
The reliable application of SWOT products requires denoising, water-land classification, vertical-datum treatment, spatial aggregation, uncertainty screening, and independent validation [9,16]. Because product versions, quality flags, shoreline buffers, water masks, and averaging windows can affect results, reproducibility depends on the transparent reporting of processing workflows and uncertainty treatment. Representative SWOT data portals and software tools are summarized in Supplementary Table S1.

4. Hydrological Applications

4.1. Water-Level Retrieval and Applications

Water-surface elevation is the primary observational variable underpinning many SWOT hydrological applications, including river-slope estimation, lake and reservoir storage analysis, floodplain connectivity, flood-depth mapping, and discharge inversion. This section synthesizes water-level applications through three connected dimensions: retrieval performance, behavior across hydrological environments, and integration with hydrological and water-resource models.

4.1.1. Measurement Accuracy

Post-launch validation indicates that both the accuracy and the availability of SWOT-derived water-surface elevation (WSE) are strongly context dependent. Reported performance varies with the hydrogeomorphic setting, water-body size and morphology, reference-data quality, spatial aggregation, swath position, and processing strategy. Because existing studies use different metrics, reference datasets, and spatial supports, a pooled mission-wide accuracy estimate would be methodologically misleading. Table 2 therefore compares representative post-launch studies using a common set of descriptors—region, water-body type, SWOT product, validation data, accuracy metric, and key limitation—so that differences in reported performance can be interpreted in context rather than treated as directly interchangeable.
The study-level evidence in Table 2 shows that relatively low WSE errors can be obtained under favorable observation conditions, but these values should not be interpreted as uniform mission-wide accuracy. Wu et al. (2025) [6] reported an average bias of −0.01 ± 0.13 m and MAE below 0.10 m when SWOT lake levels on the Tibetan Plateau were compared with ICESat-2. Patidar et al. (2025) [11] reported a 68th-percentile absolute relative WSE error of 18.02 cm for rivers wider than 100 m, increasing to 25.72 cm for narrower rivers. Kica et al. (2025) [12] reported r > 0.99 and MAE of 6.7 cm for WSE averaged over 1 km2 regions in large herbaceous wetlands; this accuracy is therefore explicitly tied to the reported spatial support and should not be interpreted as pixel-scale performance. In the Casamance estuary, Diouf et al. (2025) [14] reported R = 0.90 and RMSE < 0.25 m for SWOT water-level variations in the main channel, while performance was poorer in tributaries with more uncertain bathymetry and complex local dynamics.
These contrasts demonstrate that the hydrological setting alone is not sufficient to explain performance. Patidar et al. (2025) [11] showed a clear dependence of river WSE error and valid-data retention on channel width, while Zhao et al. (2025) [9] found substantial regional differences among SWOT RiverSP, LakeSP, and denoised PIXC retrievals in the middle and lower Yangtze River. Jiang et al. (2025) [22], using dense fast-sampling observations, further demonstrated strong reach- and sub-reach variability in river-surface slope and backwater behavior. Taken together, these studies indicate that the morphology, observation geometry, product choice, quality filtering, and spatial support can all affect the information recovered from SWOT; validation should therefore be interpreted in relation to both the environmental conditions and processing design rather than sensor capability alone.
To move from individual validation studies to a broader hydrological interpretation, Table 3 synthesizes the dominant performance patterns and constraints across major inland-water environments.
The cross-environment comparison in Table 3 shows that relatively large and open water surfaces generally provide more favorable conditions for WSE retrieval. Open river reaches and large lakes typically contain a greater number of valid water pixels and are less affected by mixed land–water returns, which helps explain the more stable performance reported after quality screening, spatial aggregation, or cross-validation.
Performance becomes less consistent in environments characterized by narrow channels, complex morphology, vegetation, fragmented water surfaces, or rapid tidal variability. Such conditions do not necessarily make SWOT observations unusable, but they increase the dependence of the retrieval on spatial aggregation, ancillary information, and processing choices. The results reported for the Everglades are a useful example: low errors were obtained over large herbaceous wetlands after spatial averaging, whereas this performance should not be assumed to extend to woody or highly fragmented wetlands. Similarly, estuarine applications benefit from SWOT’s two-dimensional representation of water-level gradients, although the interpretation of individual observations remains sensitive to tidal phase and temporal matching with reference data.
The comparison also indicates that WSE performance cannot be described adequately by a single error statistic. The precision, systematic bias, spatial coverage, and aggregation scale represent different aspects of product quality. Spatial averaging may reduce random variability in an estimated mean WSE, but it does not by itself eliminate systematic datum or geolocation offsets. Likewise, a low point-wise error may coexist with limited usable coverage in narrow or fragmented water bodies. Conversely, even spatially incomplete observations can provide useful constraints where gauges are sparse, particularly when they are assimilated with in situ information or hydraulic models [21,23]. The practical value of SWOT therefore depends not only on reported error magnitude but also on whether the observations add information at the spatial and temporal scales required by the application.
Taken together, the post-launch evidence does not support a single universal WSE accuracy value for SWOT. Reported performance should instead be interpreted in relation to water-body characteristics, reference data, spatial support, aggregation strategy, and processing conditions. Such a context-dependent assessment provides a more useful basis for evaluating the suitability of SWOT observations for hydrological validation, modeling, and water-resource applications.

4.1.2. Applications Across Diverse Hydrological Environments

SWOT water-level products have now been evaluated across large rivers, lakes and reservoirs, herbaceous wetlands, floodplains, estuaries, and high-altitude water bodies. The principal advance is not WSE alone but the availability of spatially distributed water-surface information that can be combined with the width, slope, inundation extent, and complementary observations depending on the application. Representative examples include longitudinal river WSE and slope dynamics [22,24], lake-level mapping and cross-validation with ICESat-2 [6], wetland WSE validation [12], estuarine two-dimensional water-level fields [13], and flood-extent extraction from PIXC data [16].
Large river basins are among the most developed SWOT application domains because broad channels provide relatively favorable spatial support for reach-scale WSE, width, and slope retrieval. Dhote et al. (2025) [24] demonstrated longitudinal WSE profiles and two-dimensional water-surface information over the Ganga River, while Jiang et al. (2025) [22] used fast-sampling SWOT observations to resolve reach- and sub-reach slope dynamics, slow flood-wave propagation, and backwater effects in the Missouri River Basin. At the network scale, Larnier et al. (2025) [21] showed that SWOT WSE can be combined with ICESat-2, Sentinel-1, and hydrological-hydraulic modeling to infer inflows, bathymetry, and friction. Hydrography frameworks such as SWORD and MERIT Hydro provide essential network geometry and topology for organizing and interpreting these observations [25,26].
Lakes and reservoirs represent another mature application area because broad, relatively coherent water surfaces facilitate aggregation and cross-validation. SWOT lake levels can be combined with surface area and elevation-area-volume relationships to estimate storage changes and can be integrated with other satellite observations to improve temporal sampling and the water-budget interpretation [4,6].
SWOT also expands the observation capacity in wetlands and estuaries, where fragmented inundation, vegetation, and tides challenge conventional altimetry. In the Everglades, Kica et al. (2025) [12] found strong agreement with field water levels after spatial averaging. In hyper-tidal and data-scarce estuarine settings, SWOT provides two-dimensional water-level gradients that can complement gauges and hydrodynamic models, although the rapid tidal variability and sampling phase remain important constraints [13,14].
Overall, these applications show that SWOT water-level observations have evolved from elevation measurements into spatially distributed hydraulic information for rivers, lakes, reservoirs, floodplains, wetlands, estuaries, and cold-region water bodies.

4.1.3. Integrated Hydrological Applications

Beyond direct water-level monitoring, SWOT WSE is increasingly used as a constraint within integrated observing-and-modeling systems. Soman and Indu (2024) [23] used three years of synthetic SWOT-like WSE generated with the CNES simulator and assimilated those observations into a one-dimensional stochastic model to extend daily WSE estimates between sparse historical gauges along an Indian river reach. Charoensuk et al. (2025) [5], using actual SWOT and ICESat-2 observations, showed that the complementary spatial sampling of radar and laser altimetry can diagnose spatial hydraulic-model errors along the Chao Phraya River. These studies illustrate an important distinction: the value of SWOT is not limited to direct retrieval, but can also arise from the way its observations constrain models and complement other observing systems.
Hydraulic modeling, data assimilation, and flood mapping should be distinguished as related but different applications. Larnier et al. (2025) [21] assimilated SWOT WSE into a coupled hydrological–hydraulic river-network framework to infer inflows, bathymetry, friction, and discharge, while Soman et al. (2026) [20] assimilated real and synthetic SWOT reach WSE into the CaMa-Flood model and improved basin-scale discharge simulations. Separately, Bonassies et al. (2026) [16] evaluated SWOT PIXC data for flood-extent extraction during four flood events using near-coincident Sentinel-1 or Sentinel-2 imagery. Thus, model-state/parameter estimation and flood-water classification should not be treated as the same validation problem.
SWOT observations also support reservoir and water-resource assessments. When combined with the water extent and complementary satellite observations, repeated water-level measurements can improve estimates of storage change and provide a bridge between local surface-water dynamics and broader water-budget information [4,27].

4.2. River Discharge Estimation and Applications

River discharge is central to water-resource management and the terrestrial water cycle, but it cannot be directly measured by satellite observations. SWOT estimates discharge indirectly by combining the water surface elevation, channel width, water surface slope, and ancillary information about bathymetry, channel geometry, and roughness [15,28,29]. This makes discharge estimation a more inferential and uncertainty-sensitive task than water-level retrieval.
Pre-launch studies focused mainly on algorithm development, synthetic SWOT observations, AirSWOT experiments, and theoretical performance assessments [28,29,30]. Post-launch studies now evaluate discharge estimates against gauges and assimilate actual SWOT WSE into hydrological–hydraulic models [15,20,21]. The available evidence indicates that SWOT-derived discharge can capture temporal discharge variations at many reaches, but the absolute magnitude may remain biased and performance depends on the quality of WSE, width, and slope retrievals together with uncertain bathymetry, roughness, priors, the model structure, and the algorithm choice [15,18].

4.2.1. Estimation Methods and Uncertainty

SWOT discharge estimation is a hydraulic inverse problem: water-surface elevation, width, and slope provide observational constraints, whereas bathymetry and roughness are usually unknown or only approximately represented. The main method families therefore differ less in the variables that they observe than in where they place prior assumptions, how strongly they enforce hydraulic consistency, and how they represent uncertainty (Table 4). Simplified hydraulic formulations are computationally efficient and interpretable but can be highly sensitive to assumed geometry and roughness. Variational and ensemble data-assimilation approaches can update states or parameters while preserving model dynamics, but their performance depends on prior-model quality and computational resources. Probabilistic or multi-algorithm approaches represent parameter and structural uncertainty more explicitly, but scaling them to large river networks remains challenging. Emerging data-driven components are best viewed as supporting tools for correction, emulation, or prior estimation rather than as replacements for hydraulic constraints. No method is uniformly preferable across river types, data conditions, and application objectives.
The practical trade-off is therefore application-dependent. Empirical hydraulic methods are attractive for large-scale or data-scarce deployment, but bathymetric and roughness uncertainty can dominate the result. Data assimilation is most useful where a credible hydrological or hydraulic model exists and the objective is to update states or parameters; Soman et al. (2026) [20], for example, reported improved basin-scale discharge modeling after assimilating SWOT reach WSE. Probabilistic formulations are valuable when uncertainty characterization is central. Data-driven components may assist parameter estimation, correction, or surrogate modeling, but their added value should be demonstrated through independent cross-basin validation. Hybrid frameworks are promising precisely because they can combine physical constraints with flexible statistical components, not because data-driven complexity alone guarantees better discharge estimates.

4.2.2. Applications Across Diverse River Systems

Large river systems are among the most suitable targets for SWOT discharge applications because their width and network connectivity provide sufficient spatial support for reach-scale hydraulic variables [15,28]. In these systems, SWOT observations can support analyses of runoff dynamics, longitudinal flow variability, river-network connectivity, and flood-wave propagation.
Applications are also expanding toward medium and relatively narrow rivers. Patidar et al. (2025) [11] found that narrower Indian rivers retained a smaller fraction of valid observations and had larger WSE errors than rivers wider than 100 m, while Soman and Indu (2024) [23] showed that SWOT-like WSE can add information between sparse gauges when assimilated into a river model. He et al. (2025) [10] also demonstrated basin-scale WSE retrieval across the Yangtze and its major tributaries, although that study reported only weak effects of the river width, slope, and land-cover type on WSE performance. These results show that narrower or less-gauged rivers are not uniformly unusable, but their value depends on valid-data availability, processing, and the way observations are combined with other information.
At network and basin scales, SWOT observations can be assimilated into hydrological and hydraulic models to improve streamflow simulation and parameter estimation. Larnier et al. (2025) [21] demonstrated the joint inference of inflows, bathymetry, and friction at a river-network scale using SWOT and complementary satellite data, while Soman et al. (2026) [20] showed that the assimilation of SWOT reach WSE can improve basin-scale discharge modeling. These approaches are particularly relevant in poorly gauged and transboundary basins.

4.2.3. Integrated Discharge Applications

SWOT-derived discharge information has potential value for water-resource assessment, runoff monitoring, and model-based forecasting, particularly where gauge networks are incomplete. The first global post-launch assessment showed that high-quality SWOT discharge estimates can track temporal discharge dynamics at many gauged reaches and identified thousands of ungauged locations with high-quality observations [15]. Application programs also illustrate broader interest in using SWOT data for water-resource management, flood-related applications, and climate resilience [17]. Operational use, however, requires the explicit treatment of uncertainty and should not be inferred solely from the retrospective validation accuracy.
For reservoirs, a better-supported near-term use is a storage-change and water-budget assessment rather than direct claims of improved operational scheduling. Das and Hossain (2025) [4] combined SWOT with Landsat, Sentinel-1, Sentinel-2, and other altimetry information to evaluate and densify reservoir-storage time series, illustrating how multi-sensor observations can improve temporal sampling. For rivers, Larnier et al. (2025) [21] and Soman et al. (2026) [20] assimilated SWOT WSE—not satellite discharge observations—into hydrological–hydraulic models and reported improvements in inferred or modeled discharge. These results support the use of SWOT as a state/parameter constraint, but they should not be described as the assimilation of directly observed discharge.
At broader scales, complementary observations can connect SWOT surface-water measurements to different components of the hydrological system. Das and Hossain (2025) [4] combined SWOT with Landsat, Sentinel-1, Sentinel-2, and ICESat-2 for reservoir storage analysis; Charoensuk et al. (2025) [5] combined SWOT and ICESat-2 for hydraulic-model diagnosis; and Vinogradova et al. (2025) [27] framed SWOT within a broader integrated Earth-system observing perspective. These studies support multi-sensor integration, although the specific contribution and uncertainty of each sensor should be stated explicitly rather than grouped under a single generic ‘fusion’ label.

5. Challenges

The main challenges in SWOT hydrology arise from interactions among orbital sampling, water-body characteristics, retrieval conditions, processing choices, and downstream application requirements. These factors affect different stages of the observation-to-application chain and should not be assessed independently. Low water-surface-elevation (WSE) error does not necessarily imply adequate temporal sampling, spatial coverage, or the reliability of derived quantities such as slope and discharge. Conversely, observations with moderate local uncertainty may still provide valuable spatial constraints where conventional measurements are sparse. SWOT performance should therefore be evaluated in terms of both measurement quality and fitness for a specific hydrological application.

5.1. Observation Constraints

The 21-day science-orbit repeat cycle and spatially non-uniform revisit pattern impose an important constraint on rapidly evolving hydrological processes. Frasson et al. (2019) [31] showed, before launch, that SWOT sampling would limit direct observation of many flood events, while the post-launch mission overview of Fu et al. (2024) [8] emphasizes the complementary role of SWOT’s spatially rich observations within broader observing systems. SWOT can therefore provide valuable snapshots of the flood extent and water-surface gradients, but rapidly changing events may evolve substantially between science-orbit overpasses. For event monitoring, SWOT is better treated as a spatial hydraulic constraint used together with gauges, precipitation products, SAR/optical imagery, and hydrodynamic models than as a stand-alone real-time monitoring system.
Spatial observability is equally important. Patidar et al. (2025) [11] reported a 68th-percentile absolute relative WSE error of 18.02 cm for rivers wider than 100 m and 25.72 cm for narrower rivers and retained a larger fraction of valid observations for the wider-river group. Zhao et al. (2025) [9] likewise showed substantial regional differences among RiverSP, LakeSP, and denoised PIXC products in the middle and lower Yangtze River. By contrast, He et al. (2025) [10] reported relatively stable WSE performance across the Yangtze basin and found river width, slope, and land-cover type to have only weak effects in their analysis. These differences underscore that apparent controls on performance can themselves be study- and processing-dependent.
These results highlight the distinction between accuracy and availability. Strict filtering may reduce reported errors while leaving too few valid observations for robust slope estimation or discharge inversion. Spatial aggregation can also improve precision but reduce effective spatial detail. The MAE of 6.7 cm reported by Kica et al. (2025) [12] for 1 km2-averaged WSE in herbaceous wetlands illustrates this trade-off: aggregation suppresses random noise, but the resulting accuracy should not be interpreted as equivalent to pixel-scale performance. Sampling adequacy therefore depends jointly on the process timescale, water-body geometry, valid-pixel density, and the spatial scale required by the application. The main observation constraints and their hydrological implications are summarized in Supplementary Table S2.

5.2. Processing and Product Uncertainty

Uncertainty in SWOT hydrological products is not limited to instrumental measurement error. It can arise from water-land classification, geolocation, vertical referencing, quality screening, denoising, spatial aggregation, and the use of ancillary information. Zhao et al. (2025) [9] demonstrated that product choice and denoising substantially affected WSE accuracy across eight Yangtze study regions, while Bonassies et al. (2026) [16] showed that flood-water classification from PIXC is sensitive to radar variables and environmental conditions including vegetation, snow cover, soil moisture, and the incidence angle. Different processing workflows can therefore produce materially different hydrological outputs from the same underlying mission observations.
The dominant source of uncertainty also depends on the target variable. WSE retrieval is affected by random elevation error, shoreline contamination, and datum consistency, whereas slope estimates can amplify relatively small elevation differences over short reaches. Storage-change estimates combine uncertainty in both elevation and the water extent. River discharge is even more sensitive because it is inferred from the WSE, width, slope, and uncertain information on the bathymetry, channel geometry, and roughness [15,29]. Consequently, good WSE performance does not automatically imply comparable accuracy in derived hydrological quantities.
Precision and bias should also be distinguished. Spatial averaging can reduce random error but does not necessarily remove the systematic offsets associated with datum conversion or geolocation. Likewise, high correlation indicates consistency in variability but does not guarantee low absolute error. Validation should therefore consider bias, RMSE or MAE, correlation, spatial support, and valid-data coverage together rather than relying on a single statistic.
Processing choices also influence reproducibility. The product version, quality flags, shoreline buffers, water masks, vertical reference, aggregation windows, and filtering thresholds should be reported explicitly. Aggressive filtering may improve apparent accuracy while reducing coverage, whereas larger aggregation windows may improve precision while smoothing local hydraulic variability. These trade-offs need to be made transparent in cross-study comparisons. The principal processing and product uncertainty sources and their potential consequences are summarized in Supplementary Table S3.

5.3. Transferability

Post-launch evidence shows that SWOT performance is strongly dependent on the hydrological setting. Large lakes and reservoirs generally provide favorable observation conditions because of their broad open-water surfaces, although shoreline effects, wind, ice, and datum treatment can still affect retrievals. Rivers are more sensitive to the width, sinuosity, slope, morphology, and swath position, particularly where valid-pixel support becomes limited.
Wetlands provide a clear example of why broad water-body categories should be interpreted cautiously. The high accuracy reported by Kica et al. (2025) [12] in large herbaceous wetlands does not imply equivalent performance in woody, forested, or highly fragmented wetlands. The vegetation structure, water fragmentation, and aggregation scale may be as important as the general classification of the water body itself. Estuarine and tidal systems present another distinct case: SWOT can resolve valuable two-dimensional water-level gradients, but validation is sensitive to the tidal phase and temporal matching with reference observations [13,14].
Transferability is also an issue for discharge estimation. Empirical hydraulic approaches are scalable but sensitive to bathymetry and roughness assumptions, data-assimilation methods provide stronger physical consistency but depend on prior-model quality, probabilistic methods represent uncertainty explicitly but can be computationally demanding, and data-driven approaches remain sensitive to training-data coverage and cross-basin generalization. Their usefulness should therefore be evaluated under different river and data conditions rather than assuming that one approach is universally preferable.
Cross-regional benchmarking is needed to determine whether algorithms and processing strategies developed in well-observed basins remain reliable under different hydroclimatic and geomorphic conditions. Such comparisons should include both accuracy metrics and information on the observation geometry, water-body characteristics, valid-data fraction, processing configuration, and reference-data uncertainty.

5.4. Operational Limitations

Scientific validation and operational suitability are not equivalent. A product may achieve satisfactory RMSE or MAE in retrospective analysis yet remain unsuitable for flood warning, reservoir operation, or drought monitoring because of temporal sampling, latency, incomplete coverage, or insufficient uncertainty information.
This distinction is particularly important for rapidly evolving events. SWOT can provide spatial information on flood extent, water-surface gradients, and floodplain connectivity, but its repeat cycle limits its role in real-time flood monitoring. Reservoir and seasonal water-budget applications, in contrast, may tolerate lower temporal frequency but require stable datum treatment and consistent long-term calibration.
Poorly gauged regions present both an opportunity and a validation challenge. These regions may benefit most from satellite observations, yet independent reference data are often limited. Agreement with a hydrological or hydraulic model should therefore not be treated as equivalent to validation against direct measurements. Multi-source evaluation using gauges, ICESat-2, optical or SAR imagery, and physically based models can strengthen the interpretation, although differences in spatial support, acquisition time, and vertical reference must be considered.
Operational use consequently requires more than improved retrieval algorithms. Stable products, transparent quality indicators, reproducible processing chains, interoperable formats, sustained validation networks, and clearly communicated uncertainty are also necessary. Application-specific performance requirements should therefore complement generic mission-level accuracy targets.

5.5. Evidence Gaps

The available post-launch evidence remains heterogeneous in the study design, water-body type, reference data, spatial scale, processing workflow, and reported performance metric. RMSE, MAE, bias, correlation, and percentile-based errors describe different aspects of performance and cannot be directly pooled without accounting for these differences. For this reason, the quantitative evidence summarized in Section 4.1.1 is more appropriately interpreted through a structured study-level comparison than through a single pooled accuracy estimate.
The geographical distribution of validation studies is also uneven. Regions with dense gauge networks and established research infrastructure are better represented, whereas many poorly gauged areas remain less independently evaluated despite their potentially high need for satellite hydrology. Reference datasets themselves may introduce additional uncertainty through vertical-datum inconsistencies, temporal mismatch, or model dependence.
The present review also has methodological limitations. The bibliometric corpus was derived from the Web of Science Core Collection, and studies indexed only in other databases may have been omitted. The search ended in April 2026, so later post-launch research is not included. The thematic synthesis focuses on representative studies rather than extracting identical quantitative variables from all 556 records, and no formal risk-of-bias or certainty-of-evidence assessment was applied. Given the heterogeneity in validation designs and reported metrics, a pooled meta-analysis was not attempted.
Future validation would benefit from the more standardized reporting of product version, quality-control procedures, aggregation scale, vertical datum, valid-data fraction, reference-data uncertainty, and both random and systematic error components. Such standardization would make it easier to distinguish genuine environmental effects from differences introduced by processing or study design.
Overall, the central challenge is not simply whether SWOT achieves a particular accuracy threshold, but under which spatial, temporal, environmental, and processing conditions its observations are sufficiently informative for a given hydrological application. Progress will therefore depend on context-specific validation, reproducible processing, cross-regional benchmark datasets, explicit uncertainty propagation, and integration with complementary satellite observations and hydrological or hydraulic models. The main gaps and barriers limiting broader SWOT hydrological applications are summarized in Supplementary Table S4.

6. Future Perspectives

6.1. Multi-Mission Observation Networks

No single mission provides the spatial coverage, temporal sampling, measurement type, and record length needed for all inland-water applications. SWOT contributes the spatially distributed WSE, extent, width, and slope; Landsat and Sentinel-2 provide frequent optical water-boundary observations when cloud conditions permit; Sentinel-1 adds cloud-penetrating SAR water-extent information; and ICESat-2 provides precise along-track elevation samples. Recent studies show these complementarities in practice: Das and Hossain (2025) combined SWOT with Landsat, Sentinel-1, Sentinel-2, and ICESat-2 for reservoir-storage analysis, while Charoensuk et al. (2025) [5] combined SWOT and ICESat-2 for hydraulic-model error diagnosis. GRACE/GRACE-FO operates at much coarser spatial scales and is therefore better interpreted as a basin-scale terrestrial-water-storage context rather than a direct spatial counterpart to SWOT. The scientific value of multi-mission integration lies in combining complementary variables and sampling characteristics rather than treating the sensors as interchangeable.
In practice, multi-mission workflows can combine co-registered water masks with SWOT elevations, use higher-frequency imagery to constrain hydrodynamic evolution between SWOT passes, assimilate multiple observation types into hydraulic models, and compare SWOT states with independent laser-altimetry or gravimetric constraints. Recent studies directly address the editor-highlighted themes: Soman and Indu (2024) [23] used SWOT-like observations to extend effective river monitoring between sparse gauges; Charoensuk et al. (2025) [5] combined SWOT and ICESat-2 observations to diagnose hydraulic-model errors; Larnier et al. (2025) [21] used SWOT together with multi-satellite information for network-scale hydraulic inference; and Diouf et al. (2025) [14] applied SWOT in a data-scarce tropical estuary. These studies demonstrate the incremental value of fusion for monitoring-network extension, model evaluation, and poorly gauged environments.
Fusion also introduces new sources of uncertainty. Observations may differ in acquisition time, spatial support, vertical datum, water-detection sensitivity, and error structure; optical data remain vulnerable to cloud cover, SAR water classification can be affected by vegetation and surface roughness, and GRACE/GRACE-FO operates at a much coarser spatial scale than SWOT. Robust fusion therefore requires explicit co-registration and datum harmonization, temporal matching or model-based interpolation, and propagation of sensor-specific uncertainty. These steps are essential if multi-mission integration is to improve hydrological inference rather than simply increase data volume. Representative multi-mission observation synergies and their expected hydrological benefits are summarized in Supplementary Table S5.

6.2. Intelligent Hydrology and Digital Twins

Artificial intelligence can support water-boundary extraction, denoising, anomaly detection, classification, and data-driven correction, but it should complement rather than replace hydrological physics. Purely data-driven models may perform well where training data are abundant yet transfer poorly across climates, morphologies, and observing conditions. Physics-informed learning, topology-aware representations, and uncertainty-aware classification are therefore more promising directions for transferable SWOT applications.
Digital-twin-type hydrological frameworks are a prospective rather than yet routine SWOT application. Existing post-launch studies already demonstrate several building blocks: Larnier et al. (2025) [21] used SWOT WSE within a river-network data-assimilation framework to update inflows, bathymetry, friction, and discharge, and Soman et al. (2026) [20] assimilated SWOT reach WSE to improve basin-scale discharge modeling. These studies support the feasibility of continuously updating model states or parameters from satellite observations, but they should not themselves be labeled full operational digital twins. Coupling such frameworks with broader Earth-system observations is consistent with the integrated observing perspective discussed by Vinogradova et al. (2025) [27].

6.3. From Scientific Observation to Operational Services

The long-term value of SWOT depends on whether validated observations can be translated into useful applications. Srinivasan et al. (2025) [17] documented the breadth of Early Adopter and application activities across academic, governmental, and private-sector users, including water-resource, flood, and climate-resilience applications. This evidence demonstrates substantial application interest, but it does not by itself establish routine operational readiness. Moving from demonstrations to sustained services additionally requires stable product versions, interoperable formats, sustained validation, clearly communicated uncertainty, and user-specific performance criteria.
Future progress will depend on the coordinated development of multi-mission observations, physically consistent algorithms, uncertainty-aware products, hydrological models, and operational partnerships. SWOT should therefore be viewed as part of an integrated global hydrological observing system rather than as a stand-alone solution.

7. Conclusions

SWOT has expanded satellite hydrology by providing global wide-swath observations of inland-water surface elevation together with spatial information on the extent, width, and slope. Relative to conventional nadir altimetry, this geometry supports a more spatially coherent analysis of rivers, lakes, reservoirs, wetlands, floodplains, and estuarine waters and creates new opportunities for hydraulic interpretation and water-resource assessment.
The evidence synthesized in this review shows that performance is strongly context-dependent. Representative post-launch studies report an average RMSE of 0.29 m across 23 Yangtze River gauging stations, with 18 stations below 0.35 m [10]; a 68th-percentile absolute relative WSE error of 18.02 cm for Indian rivers wider than 100 m, increasing to 25.72 cm for narrower rivers [11]; an average lake-level bias of −0.01 ± 0.13 m with MAE below 0.10 m against ICESat-2 on the Tibetan Plateau [6]; and MAE of 6.7 cm for 1 km2-averaged WSE in large herbaceous Everglades wetlands [12]. In the data-scarce Casamance estuary, SWOT WSE in the main channel showed R = 0.90 and RMSE < 0.25 m, whereas performance decreased in tributaries [14]. These values are not pooled mission-wide accuracies and are not directly interchangeable because they use different reference data, metrics, spatial supports, and processing choices. River discharge remains more uncertain than WSE because discharge is inferred from the WSE, width, and slope together with uncertain hydraulic parameters; the first post-launch global assessment found a median discharge correlation of 0.73 but a median bias of 50% across the evaluated high-quality reaches [15].
The main remaining limitations are the temporal sampling of rapidly evolving events, reduced valid-pixel coverage in narrow or fragmented waters, environmental effects from vegetation, terrain, tides, snow and ice, and uncertainty propagation from pixel observations to hydraulic products. The synthesis also identifies a second, equally important limitation: reported accuracy is not directly comparable across studies unless spatial support, quality filtering, vertical datum, reference uncertainty, and valid-data fraction are reported consistently. Progress toward operational use will therefore depend on standardized and transparent processing, cross-regional benchmark datasets, multi-mission fusion, physically constrained and uncertainty-aware algorithms, and closer coupling between satellite observations and hydrological or hydraulic models. SWOT is most useful as a central component of an integrated observing-and-modeling system rather than as a stand-alone solution.

Supplementary Materials

The following supporting information can be downloaded at: https://www.mdpi.com/article/10.3390/rs18193274/s1. Supplementary Material S1. PRISMA 2020 checklist. Supplementary Table S1. Representative software packages and platforms for SWOT hydrological data processing. Supplementary Table S2. Major observation constraints of SWOT and hydrological implications. Supplementary Table S3. Major uncertainty sources in SWOT data processing and product generation. Supplementary Table S4. Current gaps and barriers in SWOT hydrological applications. Supplementary Table S5. Multi-mission observation synergy and expected hydrological benefits.

Author Contributions

Z.Z.: Conceptualization, Methodology, Investigation, Data curation, Formal analysis, Visualization, Writing—original draft, Writing—review and editing. Y.S.: Conceptualization, Methodology, Supervision, Project administration, Funding acquisition, Writing—review and editing. Z.J.: Methodology, Supervision, Writing—review and editing. S.G.: Investigation, Data curation, Formal analysis, Visualization, Writing—review and editing. D.X.: Investigation, Data curation, Writing—review &and editing. X.Y.: Formal analysis, Visualization, Writing—review and editing. R.W.: Investigation, Data curation, Writing—review and editing. J.Z.: Investigation, Data curation, Writing—review and editing. All authors have read and agreed to the published version of the manuscript.

Funding

This work was supported by the Beijing Institute of Ecological Geology through the project “Research on Novel Hyperspectral Remote Sensing Monitoring Methods for Soil Nutrients and Microorganisms and Hyperspectral Remote Sensing Inversion of Cultivated Land Soil Nutrients and Microorganisms” and by the Geological Joint Fund of the National Natural Science Foundation of China through the project “Differential Response Characteristics and Mechanisms of Land Subsidence in the Beijing–Tianjin–Hebei Plain under Changing Hydrological Conditions” [grant number U2344225]. The funders had no role in the design of this review, literature retrieval and screening, data analysis and interpretation, manuscript preparation, or the decision to submit the manuscript for publication.

Data Availability Statement

The data used in this study were derived from bibliographic records retrieved from the Web of Science Core Collection. The PRISMA 2020 checklist used for bibliometric analysis is provided as Supplementary Materials S1. No new observational or experimental datasets were generated. The thematic coding records, CiteSpace project files, and analytical code are not publicly archived but are available from the corresponding author upon reasonable request.

Acknowledgments

The authors gratefully acknowledge the NASA/CNES SWOT mission team and related data service platforms, including PO.DAAC and AVISO+, for providing access to SWOT data products, technical documentation, and mission information. The authors also thank the developers of CiteSpace for providing useful tools for bibliometric analysis. We are grateful to the researchers whose published studies formed the basis of this review and to colleagues who provided constructive discussions during the preparation of this manuscript.

Conflicts of Interest

The authors declare that they have no known competing financial interests or personal relationships that could have appeared to influence the work reported in this paper.

References

  1. Tellman, B.; Sullivan, J.A.; Kuhn, C.; Kettner, A.J.; Doyle, C.S.; Brakenridge, G.R.; Erickson, T.A.; Slayback, D.A. Satellite imaging reveals increased proportion of population exposed to floods. Nature 2021, 596, 80–86. [Google Scholar] [CrossRef] [Scilit]
  2. Alsdorf, D.E.; Rodríguez, E.; Lettenmaier, D.P. Measuring surface water from space. Rev. Geophys. 2007, 45, RG2002. [Google Scholar] [CrossRef] [Scilit]
  3. Calmant, S.; Seyler, F.; Cretaux, J.-F. Monitoring continental surface waters by satellite altimetry. Surv. Geophys. 2008, 29, 247–269. [Google Scholar] [CrossRef] [Scilit]
  4. Das, P.; Hossain, F. Multi-satellite tracking of surface water storage change in the era of Surface Water and Ocean Topography (SWOT) satellite mission. Earth Space Sci. 2025, 12, e2024EA004178. [Google Scholar] [CrossRef] [Scilit]
  5. Charoensuk, T.; Luchner, J.; Bauer-Gottwein, P. Leveraging Ice, Cloud, and Land Elevation Satellite-2 laser altimetry and Surface Water Ocean Topography radar altimetry for error diagnosis in hydraulic models: A case study of the Chao Phraya River. Remote Sens. 2025, 17, 621. [Google Scholar] [CrossRef] [Scilit]
  6. Wu, S.; Cai, Y.; Ke, C.-Q.; Xiao, Y.; Li, H.; He, Z.; Duan, Z. SWOT mission enables high-precision and wide-coverage lake water levels monitoring on the Tibetan Plateau. J. Hydrol. Reg. Stud. 2025, 59, 102357. [Google Scholar] [CrossRef] [Scilit]
  7. Biancamaria, S.; Lettenmaier, D.P.; Pavelsky, T.M. The SWOT mission and its capabilities for land hydrology. Surv. Geophys. 2016, 37, 307–337. [Google Scholar] [CrossRef] [Scilit]
  8. Fu, L.-L.; Pavelsky, T.; Cretaux, J.-F.; Morrow, R.; Farrar, J.T.; Vaze, P.; Sengenes, P.; Vinogradova-Shiffer, N.; Sylvestre-Baron, A.; Picot, N.; et al. The Surface Water and Ocean Topography mission: A breakthrough in radar remote sensing of the ocean and land surface water. Geophys. Res. Lett. 2024, 51, e2023GL107652. [Google Scholar] [CrossRef] [Scilit]
  9. Zhao, Y.; Fu, J.; Pang, Z.; Jiang, W.; Zhang, P.; Qi, Z. Validation of inland water surface elevation from SWOT satellite products: A case study in the middle and lower reaches of the Yangtze River. Remote Sens. 2025, 17, 1330. [Google Scholar] [CrossRef] [Scilit]
  10. He, Z.; Cai, Y.; Wu, S.; Xiao, Y.; Li, H.; Duan, Z. Evaluation of SWOT’s performance for river water level retrieval in the Yangtze River Basin. Int. J. Remote Sens. 2025, 46, 4736–4763. [Google Scholar] [CrossRef] [Scilit]
  11. Patidar, G.; Indu, J.; Karmakar, S. Performance assessment of Surface Water and Ocean Topography (SWOT) mission for WSE measurement across India. Geophys. Res. Lett. 2025, 52, e2025GL115804. [Google Scholar] [CrossRef] [Scilit]
  12. Kica, S.; Pavelsky, T.M.; Fayne, J.V.; Williams, B.A. SWOT water surface elevation in herbaceous wetlands of Florida’s Everglades. Geophys. Res. Lett. 2025, 52, e2025GL114956. [Google Scholar] [CrossRef] [Scilit]
  13. Lichtman, I.D.; Bell, P.S.; Gommenginger, C.; Banks, C.; Calafat, F.M.; Brown, J.; Williams, S.D.P. Evaluating water levels from the Surface Water and Ocean Topography (SWOT) mission in a hyper-tidal coastal and estuarine environment. Earth Space Sci. 2025, 12, e2024EA004104. [Google Scholar] [CrossRef] [Scilit]
  14. Diouf, A.; Salameh, E.; Sakho, I.; Sow, B.A.; Deloffre, J.; López Solano, C.; Turki, E.I.; Lafite, R. Use of SWOT data for hydrodynamic modelling in a tropical microtidal estuarine system: The case of Casamance (Senegal). Remote Sens. 2025, 17, 3252. [Google Scholar] [CrossRef] [Scilit]
  15. Andreadis, K.M.; Coss, S.P.; Durand, M.; Gleason, C.J.; Simmons, T.T.; Tebaldi, N.; Bjerklie, D.M.; Brinkerhoff, C.; Dudley, R.W.; Gejadze, I.; et al. A first look at river discharge estimation from SWOT satellite observations. Geophys. Res. Lett. 2025, 52, e2024GL114185. [Google Scholar] [CrossRef] [Scilit]
  16. Bonassies, Q.; Fatras, C.; Peña-Luque, S.; Dubois, P.; Piacentini, A.; Cassan, L.; Ricci, S.; Nguyen, T.H. A comprehensive study of Surface Water and Ocean Topography (SWOT) Pixel Cloud data for flood extent extraction. Remote Sens. Environ. 2026, 333, 115101. [Google Scholar] [CrossRef] [Scilit]
  17. Srinivasan, M.; Tsontos, V.; Bonnema, M.; Peña-Luque, S.; de Amorim-Teixeira, A.; Araujo, A.A.; Beighley, E.; Birkett, C.; Chen, C.; Croneborg-Jones, L.; et al. Launching into societal benefits from the Surface Water and Ocean Topography (SWOT) mission. Water Resour. Res. 2025, 61, e2024WR038436. [Google Scholar] [CrossRef] [Scilit]
  18. Durand, M.; Gleason, C.J.; Pavelsky, T.M.; Frasson, R.P.M.; Turmon, M.; David, C.H.; Altenau, E.H.; Tebaldi, N.; Larnier, K.; Monnier, J.; et al. A framework for estimating global river discharge from the Surface Water and Ocean Topography satellite mission. Water Resour. Res. 2023, 59, e2021WR031614. [Google Scholar] [CrossRef] [Scilit]
  19. Elmer, N.J.; Hain, C.; Hossain, F.; Desroches, D.; Pottier, C. Generating proxy SWOT water surface elevations using WRF-Hydro and the CNES SWOT Hydrology Simulator. Water Resour. Res. 2020, 56, e2020WR027464. [Google Scholar] [CrossRef] [Scilit]
  20. Soman, M.K.; Indu, J.; Karmakar, S. Assimilation of SWOT Reach Water Surface Elevation Product toward enhanced basin-scale discharge modeling. Earth Space Sci. 2026, 13, e2025EA004527. [Google Scholar] [CrossRef] [Scilit]
  21. Larnier, K.; Garambois, P.A.; Emery, C.; Pujol, L.; Monnier, J.; Gal, L.; Paris, A.; Yesou, H.; Ledauphin, T.; Calmant, S. Estimating channel parameters and discharge at river network scale using hydrological-hydraulic models, SWOT and multi-satellite data. Water Resour. Res. 2025, 61, e2024WR038455. [Google Scholar] [CrossRef] [Scilit]
  22. Jiang, L.; Nielsen, K.; Andersen, O.B.; Liu, J. SWOT reveals detailed dynamics of longitudinal river slope in the Missouri River Basin. Geophys. Res. Lett. 2025, 52, e2025GL115953. [Google Scholar] [CrossRef] [Scilit]
  23. Soman, M.K.; Indu, J. Extending the historical in situ gauge network over Indian river reaches utilizing the Surface Water and Ocean Topography (SWOT) mission. Hydrol. Sci. J. 2024, 69, 1261–1273. [Google Scholar] [CrossRef] [Scilit]
  24. Dhote, P.R.; Agarwal, A.; Paris, A.; Singhal, G.; Thakur, P.K.; Oubanas, H.; Moreira, D.M.; Gal, L.; Garg, V.; Kumar, P.; et al. Unveiling the first impressions of the wide-swath altimetry SWOT mission over the Ganga River, India. Geophys. Res. Lett. 2025, 52, e2025GL115402. [Google Scholar] [CrossRef] [Scilit]
  25. Altenau, E.H.; Pavelsky, T.M.; Durand, M.T.; Yang, X.; Frasson, R.P.D.M.; Bendezu, L. The Surface Water and Ocean Topography (SWOT) Mission River Database (SWORD): A global river network for satellite data products. Water Resour. Res. 2021, 57, e2021WR030054. [Google Scholar] [CrossRef] [Scilit]
  26. Yamazaki, D.; Ikeshima, D.; Sosa, J.; Bates, P.D.; Allen, G.H.; Pavelsky, T.M. MERIT Hydro: A high-resolution global hydrography map based on latest topography dataset. Water Resour. Res. 2019, 55, 5053–5073. [Google Scholar] [CrossRef] [Scilit]
  27. Vinogradova, N.T.; Pavelsky, T.M.; Farrar, J.T.; Hossain, F.; Fu, L.-L. A new look at Earth’s water and energy with SWOT. Nat. Water 2025, 3, 27–37. [Google Scholar] [CrossRef] [Scilit]
  28. Pavelsky, T.M.; Durand, M.T.; Andreadis, K.M.; Beighley, R.E.; Paiva, R.C.D.; Allen, G.H.; Miller, Z.F. Assessing the potential global extent of SWOT river discharge observations. J. Hydrol. 2014, 519, 1516–1525. [Google Scholar] [CrossRef] [Scilit]
  29. Durand, M.; Gleason, C.J.; Garambois, P.A.; Bjerklie, D.; Smith, L.C.; Roux, H.; Rodriguez, E.; Bates, P.D.; Pavelsky, T.M.; Monnier, J.; et al. An intercomparison of remote sensing river discharge estimation algorithms from measurements of river height, width, and slope. Water Resour. Res. 2016, 52, 4527–4549. [Google Scholar] [CrossRef] [Scilit]
  30. Tuozzolo, S.; Lind, G.D.; Overstreet, B.; Mangano, J.F.; Fonstad, M.A.; Hagemann, M.; Frasson, R.P.D.M.; Larnier, K.; Garambois, P.-A.; Monnier, J.; et al. Estimating river discharge with swath altimetry: A proof of concept using AirSWOT observations. Geophys. Res. Lett. 2019, 46, 1459–1466. [Google Scholar] [CrossRef] [Scilit]
  31. Frasson, R.P.D.M.; Schumann, G.J.-P.; Kettner, A.J.; Brakenridge, G.R.; Krajewski, W.F. Will the Surface Water and Ocean Topography (SWOT) satellite mission observe floods? Geophys. Res. Lett. 2019, 46, 10435–10445. [Google Scholar] [CrossRef] [Scilit]
Figure 1. PRISMA 2020 flow diagram of the study selection process for the systematic review of SWOT satellite hydrology applications.
Remotesensing 18 03274 g001
Figure 2. Bibliometric overview of SWOT hydrological research: (a) geographic distribution of authors’ affiliated institutions based on cumulative affiliation occurrences, indicating the spatial pattern of research participation; (b) annual net publication output from 2019 to April 2026 (N = 556), showing the temporal growth of SWOT hydrology studies; and (c) publication contribution by country or region calculated from total country-affiliation occurrences, summarizing the leading contributors to the field. Note: in panels (a,c), the total count of country affiliations exceeds 556 due to multi-country co-authorship in international collaborative publications.
Remotesensing 18 03274 g002
Figure 3. Keyword co-occurrence network and thematic evolution of SWOT hydrological research from 2019 to 2026. The node size represents the keyword frequency, links indicate co-occurrence relationships, and colors denote the temporal evolution of keywords and their connections.
Remotesensing 18 03274 g003
Figure 4. Schematic representation of the SWOT Ka-band Radar Interferometer (KaRIn) observation geometry, illustrating the dual-antenna interferometric configuration, 10 m baseline, wide-swath surface water topography measurements, and nadir altimetry observations. Reproduced with permission from the NASA/JPL Surface Water and Ocean Topography (SWOT) mission website. Image credit: NASA/JPL-Caltech/CNES/Thales Alenia Space.
Remotesensing 18 03274 g004
Figure 5. Spatial coverage of the SWOT science orbit over a 21-day repeat cycle. The left and center panels show the nominal SWOT coverage after 3 days and 21 days, respectively, while the right panel shows the number of observations as a function of latitude during the 21-day repeat period. Reproduced from the NASA/JPL Surface Water and Ocean Topography (SWOT) mission website, “SWOT Science Orbit,” published 2 January 2019. Credits: C. Ubelmann, CLS (left and center panels); JPL/NASA (right panel).
Remotesensing 18 03274 g005
Table 1. SWOT data product levels, target users, typical applications, and key limitations.
Product Level/ProductCore CharacteristicsTarget Users and Typical ApplicationsKey Limitations
L0Raw radar echoesRadar engineers; instrument calibration and anomaly diagnosisNot directly usable for hydrological analysis
L1BProcessed/compacted radar measurements before higher-level hydrology geolocation and object generationSignal-processing specialists; algorithm developmentRequires specialist radar processing
L2_HR_PIXCPixel cloud with geolocated height, backscatter, classification, geophysical fields, and quality flagsFlood mapping, wetlands, local hydraulic analysis, custom aggregationLarge data volume; classification and quality screening are essential
L2_HR_RasterGridded high-rate hydrology variables (e.g., 100 m and 250 m products)Spatially continuous water-surface analysis and mappingGridding/aggregation can smooth fine-scale variability
L2_HR_RiverSPReach- and node-scale river variables defined on the prior river networkRiver WSE, width, slope, area, and derived discharge analysisDepends on river-network assignment, aggregation, and quality flags
L2_HR_LakeSPLake/reservoir object products with WSE and area informationLake/reservoir monitoring and storage-change analysisPerformance is less reliable for small or complex water bodies
L4 Sword of Science river discharge (Confluence-derived)Multi-algorithm discharge estimates derived from RiverSP and prior informationDischarge assessment and algorithm intercomparisonModel-derived; sensitive to priors and hydraulic assumptions; requires contextual validation
Table 2. Representative post-launch validation evidence for SWOT-derived water-surface elevation.
StudyRegionWater-Body TypeSWOT ProductValidation DataAccuracy MetricKey Limitation
[10]Yangtze River Basin, ChinaRiverRiverSP/PIXCGauge stationsAverage RMSE 0.29 m; 18/23 stations <0.35 m, 14/23 <0.20 m, and 2/23 <0.10 mAverage coverage 85.7%; 5 of 23 gauges had RMSE ≥0.35 m; width, slope, and land-cover effects were reported as weak in this study
[11]IndiaRivers and reservoirsRiver/Lake products419 monitoring stationsRivers >100 m: 68th-percentile absolute RE 18.02 cm; rivers <100 m: 25.72 cm; reservoirs: 10.80 cm (node) and 13.64 cm (lake product)Lower valid-data retention and larger errors for narrower rivers; quality-flag choice affects usable observations
[6]Tibetan PlateauHigh-altitude lakesLakeSPICESat-2 cross-validationMean bias −0.01 ± 0.13 m; MAE <0.10 mCross-sensor comparison rather than in situ validation; ice/terrain and sampling differences remain relevant
[12]Everglades, USAHerbaceous wetlandPIXCField water-level gaugesr > 0.99; MAE 6.7 cm for 1 km2 averagesResult applies to large herbaceous/graminoid wetlands and 1 km2 averaging; shrubby and forested wetlands require further evaluation
[14]Casamance, SenegalData-scarce estuarySWOT WSE with hydrodynamic modelIn situ/altimetry observations plus hydrodynamic-model comparisonMain channel SWOT WSE: R = 0.90; RMSE <0.25 m; tributaries: R = 0.42, RMSE up to 0.34 mSparse instrumentation; interpolated bathymetry and complex tributary dynamics
Table 3. Cross-environment synthesis of SWOT-derived water-surface-elevation performance and constraints.
Hydrological SettingSpatial ScaleTypical Reported PerformanceKey ConstraintsRepresentative References
Open river reachesRegionalDecimeter-scale performance is common after quality screening, although results vary substantially among stations and reachesWidth, morphology, slope, swath position, filtering[10,11]
Large lakes and reservoirsRegionalSub-decimeter performance has been reported for Tibetan Plateau lakes against ICESat-2, but reservoir performance is more variable across studies and methodsReference type, shoreline effects, water-surface dynamics, product choice, and cross-sensor sampling[4,6]
Complex or narrower riversLocal to basinErrors and valid-data retention can degrade for narrower rivers; strong regional/product differences are also reportedWidth, land-water mixing, morphology, quality filtering, product choice[9,11]
Estuaries and tidal riversEstuaryTwo-dimensional water-level gradients can be resolved, but interpretation depends strongly on observation timing relative to tidal variabilityTidal phase, rapid water-level change, datum consistency[13,14]
Wetlands and floodplainsWetland/floodplainHerbaceous wetlands: MAE 6.7 cm for 1 km2 averages; flood-extent performance from PIXC should be evaluated separately from WSE accuracyVegetation type, fragmentation, aggregation scale, and classification uncertainty[12,16]
Poorly gauged river networksBasin/networkHydrological value increases when SWOT is combined with gauges, models, or complementary satellite observationsSparse validation, model structure, parameter identifiability[21,23]
Table 4. Main families of SWOT-based river-discharge estimation methods and emerging hybrid support.
Method FamilyCore PrincipleStrengthsMain LimitationsRepresentative References
Hydraulic empirical methodsUse WSE, width, slope, and roughness in simplified hydraulic equationsFast, interpretable, scalable Sensitive to bathymetry and roughness assumptions[18]
Variational/ensemble/sequential data assimilationCombine SWOT observations with hydrological–hydraulic modelsPhysically consistent state and parameter updatingComputationally demanding; depends on model structure[20,21]
Probabilistic/multi-algorithm inferenceInfer discharge and uncertain parameters or combine algorithm ensemblesMakes uncertainty and structural spread explicitSampling cost and scalability challenges[15,18]
Data-driven/hybrid methodsUse data-driven relationships together with physical or model constraintsFlexible; useful for correction and emulationTraining-data dependence and transferability[21,23]
Disclaimer/Publisher’s Note: The statements, opinions and data contained in all publications are solely those of the individual author(s) and contributor(s) and not of MDPI and/or the editor(s). MDPI and/or the editor(s) disclaim responsibility for any injury to people or property resulting from any ideas, methods, instructions or products referred to in the content.