1. Introduction
Nearly half a billion people live on or near deltas [
1] many of which are subsiding as well as being affected by global sea-level rise [
2]. Delta subsidence can be due to a range of factors and specific causes lead to spatial and temporal variability in subsidence rates [
3]. For example, wetland loss in the Mississippi delta in the 1980s has been linked to hydrocarbon production in Louisiana [
4] and Holocene sediment consolidation in the delta [
5], amongst others [
6]. In the Yellow River delta, formed as the Yellow River enters the Bohai Sea [
7], subsidence is likely due to trapping of sediment in 3147 reservoirs [
8] in the catchment, aquaculture [
9] and hydrocarbon extraction, each of which increases the relative rate of relative sea-level rise.
Repeat pass Interferometric synthetic Aperture Radar (InSAR) is a powerful tool for subsidence mapping [
10,
11,
12,
13]. For river delta studies, InSAR has previously been used to measure subsidence due to sediment consolidation and artificial loading in several deltas, including the Pearl River [
14], Nile [
15] and Fraser River [
16] deltas. In the Yellow River delta, Higgins
et al. [
9] showed subsidence rates as high as 250 mm/yr from InSAR. However, their work only focused on subsidence at aquaculture facilities in the delta.
In this work, land subsidence in oilfields over the Yellow River delta is investigated. This paper attempts to map land subsidence using InSAR time series and confirm the deformation source. We use the Small Baseline Subset (SBAS) [
17] method in the Stanford method for persistent scatterers (StaMPS) [
18] to investigate surface displacements from 2007 to 2010. The Yellow River delta (YRD) subsidence turns out to be a complex process involving both shallow sediment consolidation and deep oil reservoir compaction, modelled herein using a poroelastic disk reservoir applied to Gudao oilfield.
4. Field Investigation and Sediment Analysis
To identify possible reasons for the observed subsidence, field investigation was conducted in the Yellow River delta. The Gudao Town, Xianhe Town and Gudong oilfield to the north of the current Yellow River channel, the aquaculture facilities to the south of current channel and the Yellow River Delta National Nature Reserve (YRDNNR) in the cuspate delta, were inspected. The areas showing coherent subsidence bowls from the InSAR observations are associated with the Gudao and Gudong oilfields, in which oil extraction dates back to the late 1960s and late 1980s, respectively. Oil extraction is considered to be the major cause of the areas of coherent subsidence observed in the Yellow River delta.
Near the oil field are areas of both arable farmland and residential land. Farming, due to seasonal water use, may induce subsidence. However, the data shows linear subsidence with no seasonal pattern in Gudao oilfield. Hence, the deformation in the oilfield is related to continuous hydrocarbon extraction rather than to water use for farming.
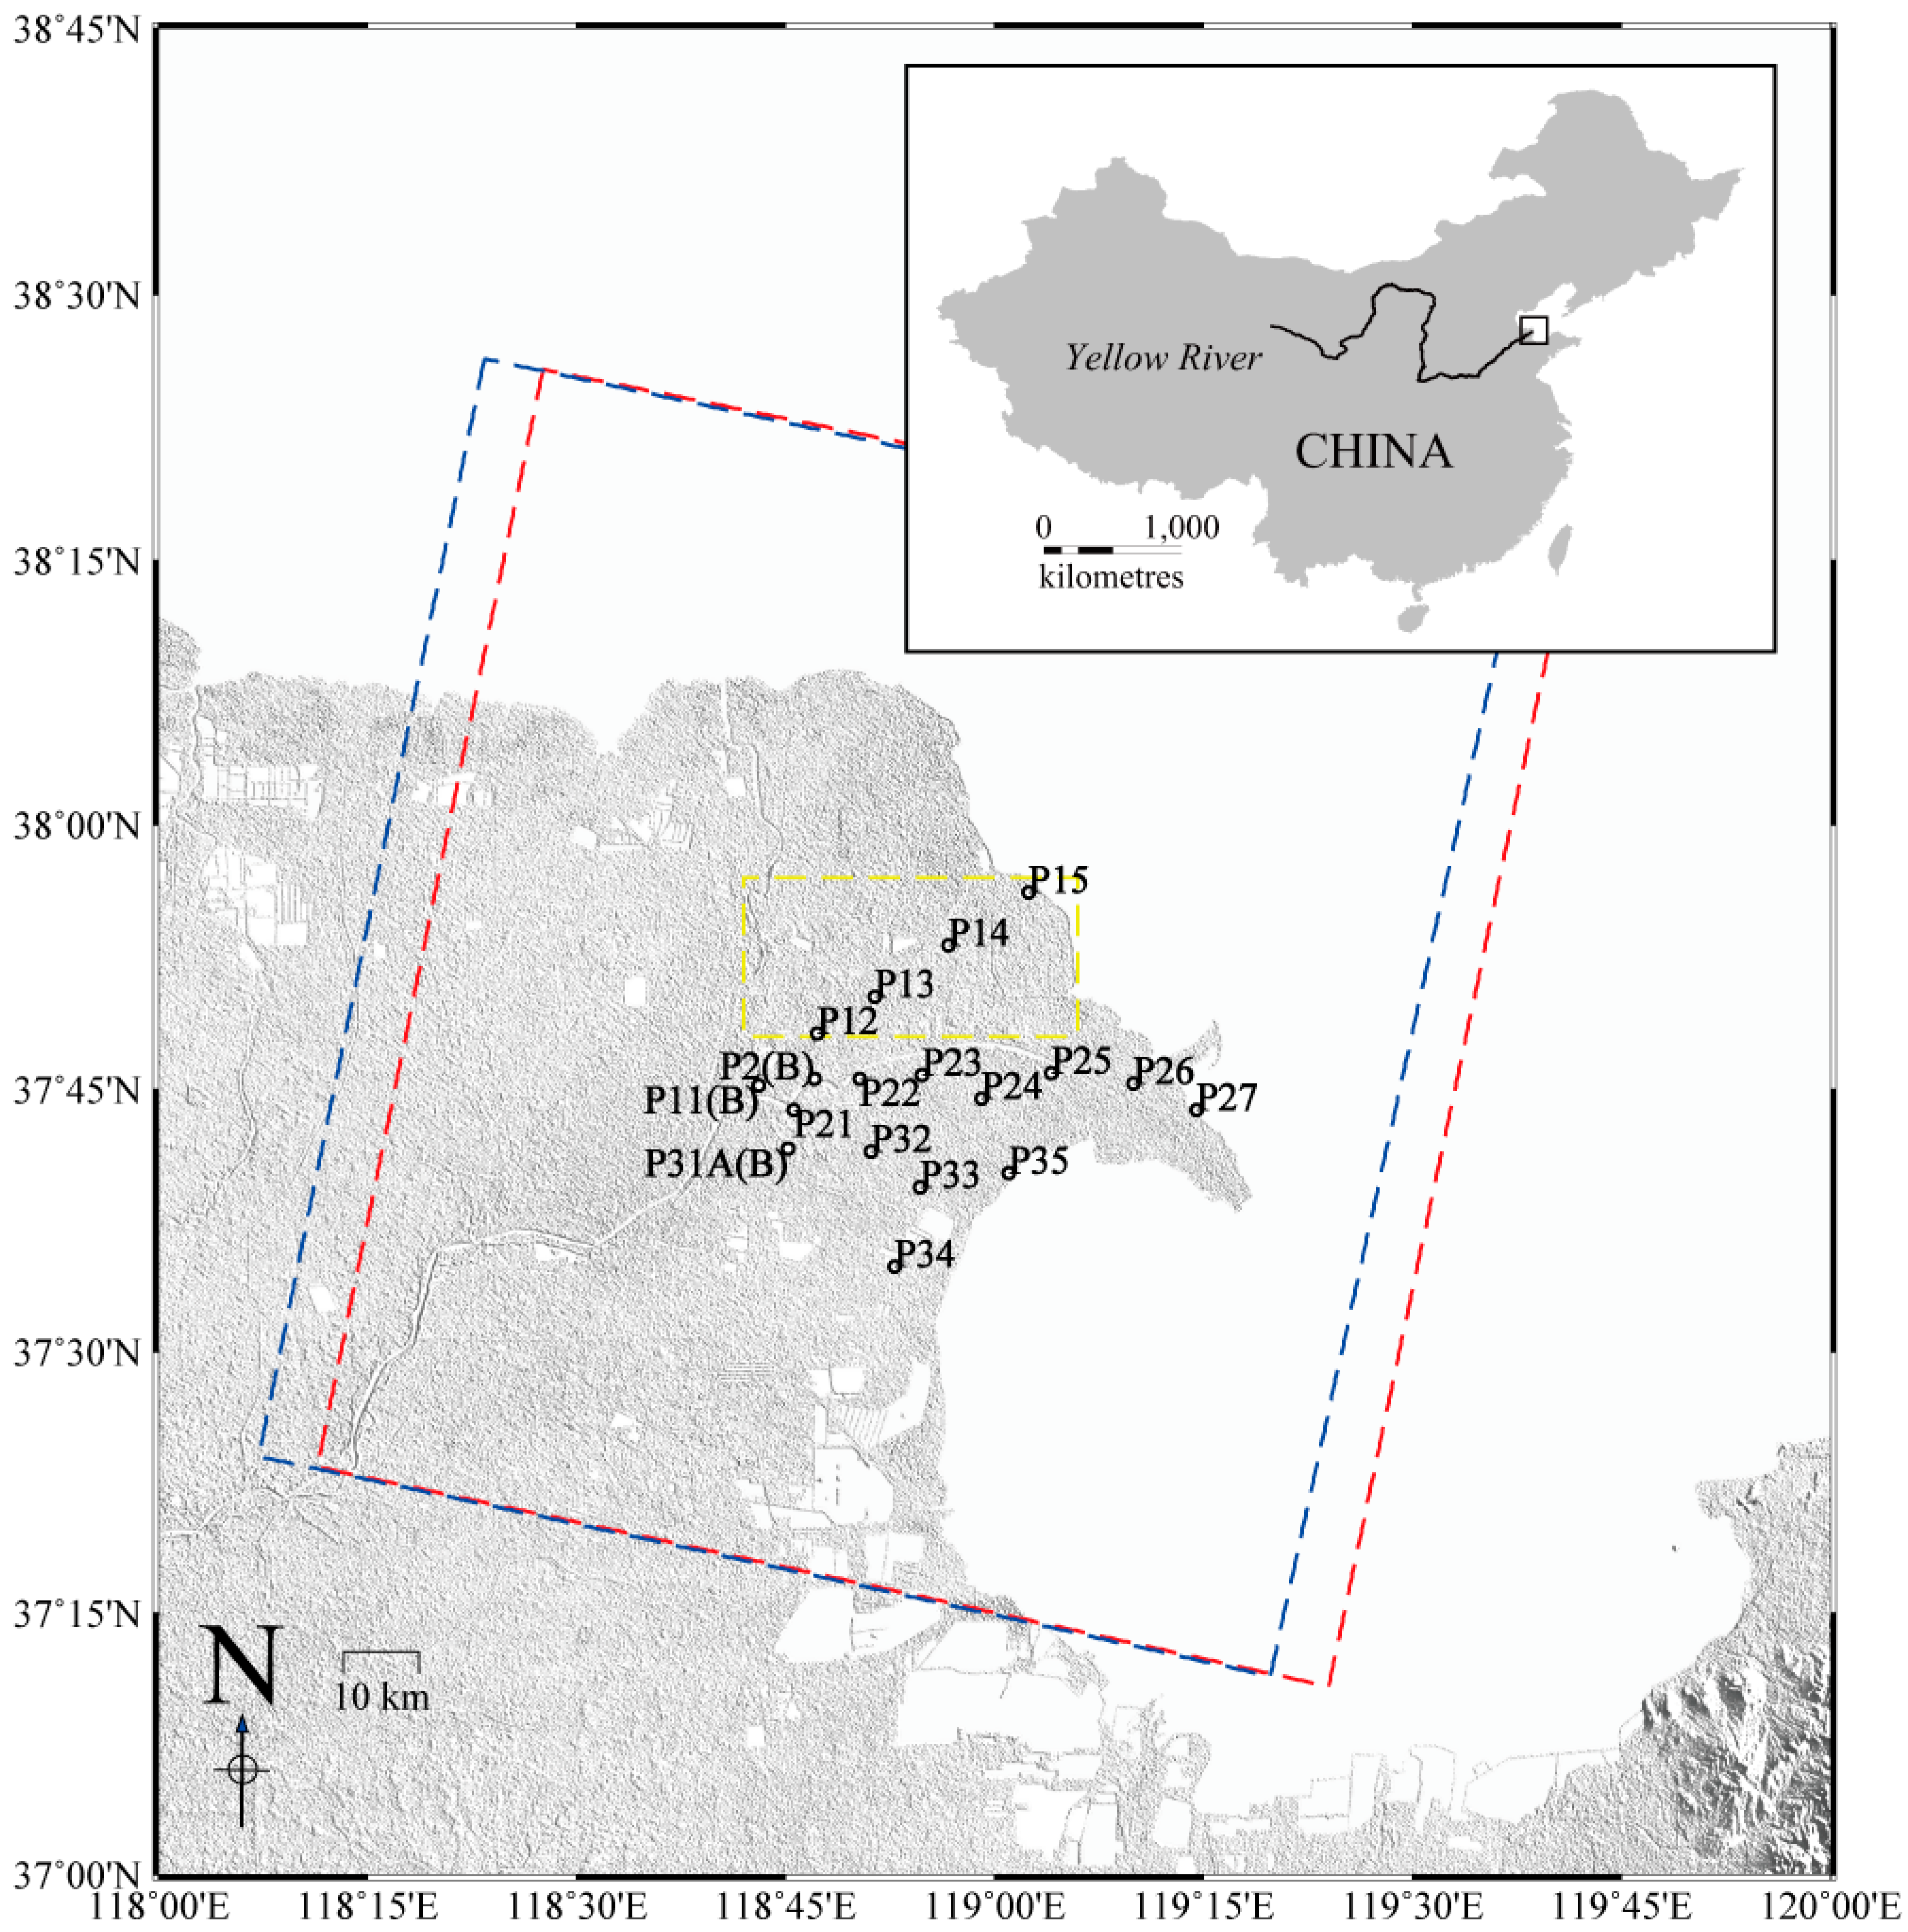
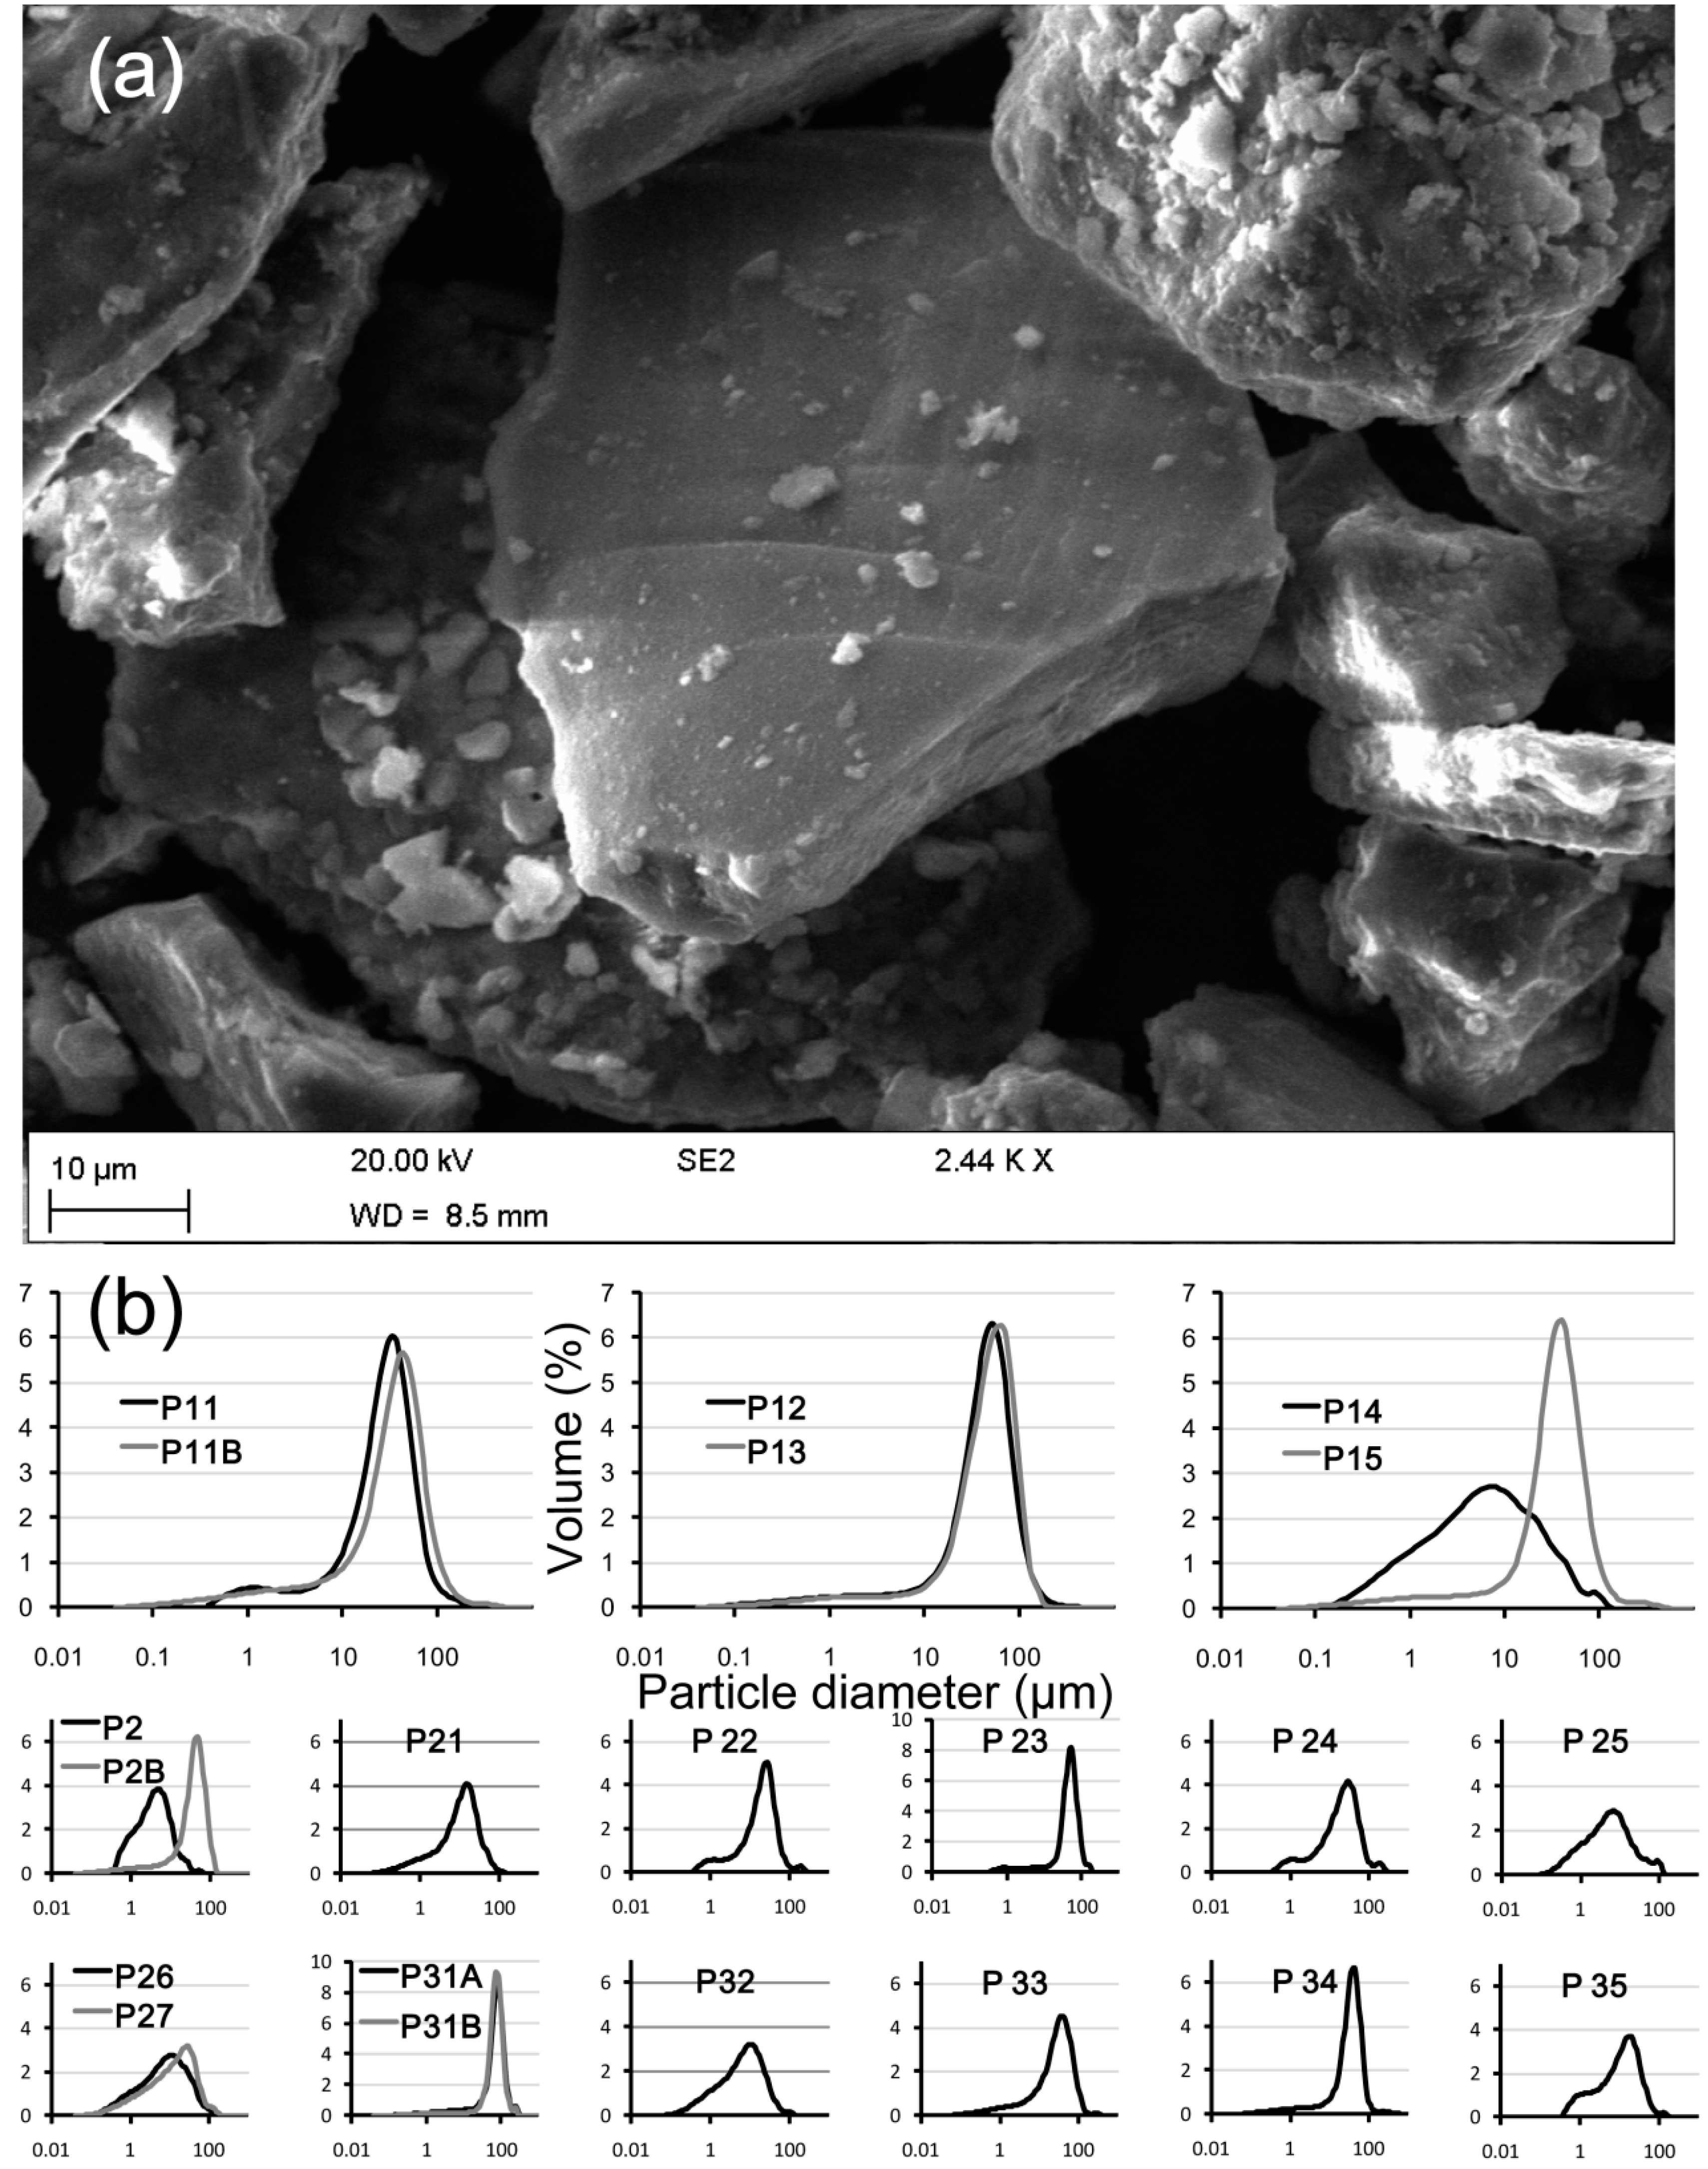
Areas of subsidence may also be related to sediment properties so shallow sediment samples were taken from the delta (See
Figure 1 for sample locations) and analysed for sediment properties (
Figure C1), including particle size distribution, mineralogy, roundness and shape. The overall consistency in sediment properties (
Appendix C) suggests that differences in material composition are not the cause of the non-uniform displacement signals observed from InSAR.
5. Modeling Subsidence in Gudao Oilfield
The Gudao oilfield, located in the Jiyang depression in the Bohaiwan Basin has reserves are 4 × 10
8 tons of oil and 47 × 10
8 m
3 of natural gas. The tertiary sandstone reservoir is a draped anticline [
39,
40]. The Gudao oilfield is controlled by the Gunan fault to the south and the Gubei fault zone to the north, and is gently dipping on its east and west sides. This structure facilitates the migration of petroleum from Bonan, Gunan and Gubei hydrocarbon sources to the Gudao oilfield [
39].
The cause of subsidence in Gudao oilfield is analysed here through poroelastic modeling. Both elastic and poroelastic models can be used to determine subsidence sources. Elastic models assume a continuous elastic medium in which the fluid exists within a cavity (e.g., a magma chamber) in homogenous isotropic elastic half space [
41]. However, hydrocarbons in reservoir rocks exist in a more distributed way. Poroelastic models are used in these cases. The poroelastic theory independently proposed by Biot [
42] and Terzaghi [
43] was further developed by Nur and Byerlee [
44] into an exact effective stress law for deformation of rocks with fluid. Segall [
45] obtained a poroelastic analytical solution in an axisymmetric space to model the subsidence in a hydrocarbon reservoir in the Lacq gas field [
46]. Similar expressions to model subsidence caused by oil extraction were also given by Geertsma [
47] for other material properties.
The area of the Gudao oilfield with near axisymmetric displacement outlined in
Figure 5a is modeled using a poroelastic disk reservoir model [
45,
46]. The vertical (u
z) and radial (u
r) surface displacements (z = 0) are obtained in terms of the product of zero order and first order Bessel functions J
0 and J
1.
The disk radius
R, thickness
T, and center depth
d are the geometrical parameters of the poroelastic reservoir. The reservoir’s Biot coefficient α, which is a measurement of the compressibility of the soil for a change in water pressure [
42,
44], Poisson’s ratio
ν, shear modulus
μ and the pressure change Δ
P are the material parameters. The Biot coefficient is an increasing function of porosity with values approaching zero at low porosity while they approach one at high porosity. When integration is performed,
k represents nuclei of strain.
Gudao oilfield is an unconsolidated sandstone reservoir with 30–33% porosity, with the depths of oil bearing Neogene Guantao formation ranging from 1120 to 1350 m, and a pressure of 12 MPa [
39,
48].
The Biot coefficient, Poisson’s ratio, shear modulus and the reservoir thickness of poroelastic disk reservoir model are taken from Sun
et al. [
49] and fixed in the model (
Table 1). The center (
x,
y,
d) of the reservoir, reservoir radius
R, and the pressure change ΔP within the reservoir are modeled from InSAR observations. The modeled reservoir depth d is then compared to the published depth of 1235 m.
Table 1.
Parameters used in model calculation. The shear modulus for a Poisson’s ratio of 0.26 is 298 MPa. The reservoir thickness is 230 m for 11,200–1350 depth range.
Table 1.
Parameters used in model calculation. The shear modulus for a Poisson’s ratio of 0.26 is 298 MPa. The reservoir thickness is 230 m for 11,200–1350 depth range.
| Symbol | Quantity | Value |
|---|
| α | Biot coefficient | 0.85 |
| ν | Poisson’s ratio | 0.26 |
| μ | Shear modulus | 298 MPa |
| T | Reservoir thickness | 230 m |
The inversion is implemented using a simulated annealing algorithm to find the optimal parameters within a space limited by lower and upper boundaries by minimizing the misfit between model predictions and data [
50]. Simulated noise was added to the observed displacement field and the inversion was repeated. The 5 mm RMS estimated from InSAR time series displacement is used to construct a full variance-covariance matrix (VCM). The VCM matrix is decomposed to simulate spatially correlated noise [
38]. A total of 100 trials were used to generate 100 groups of best fit model parameters, from which the joint sensitivity of the estimated parameters was assessed.
When the InSAR displacement is inverted directly, the estimated depth is 1722 m, which is 487 m deeper than the published depth of 1235 m. This overestimation could be caused by an unknown global bias due to an inaccurate reference level in the InSAR data [
51]. In this case, the global bias could be incorporated into the model by co-estimating an offset between the model and the InSAR displacement [
52] (case A). Alternatively, the mean phase of each image is again used as the reference phase for InSAR (case B). The two methods actually produce similar results (
Table 2).
Table 2.
Best Fit Poroelastic disk reservoir model parameters and uncertainty. A: offset between InSAR and model estimated. B: mean value as InSAR reference.
Table 2.
Best Fit Poroelastic disk reservoir model parameters and uncertainty. A: offset between InSAR and model estimated. B: mean value as InSAR reference.
| Quantity (unit) | Disk Centre East (km) | Disk Centre North (km) | Disk Centre Depth (km) | Disk Reservoir Radius (km) | Pressure Change (MPa) | Offset (mm) | Misfit (mm) |
|---|
| Symbol | x | y | d | R | ΔP | C | RMSE |
| Offset estimated | 1.56±0.05 | 2.48±0.05 | 1.08±0.09 | 0.83±0.11 | 0.80±0.21 | 20.0±0.4 | 8.1±0.2 |
| Mean value reference | 1.57±0.05 | 2.41±0.04 | 1.14±0.09 | 0.91±0.09 | 0.73±0.13 | N/A | 8.3±0.2 |
After consideration of the global bias, the estimated depths are of 1080 and 1140 m in categories A and B, 100–160 m shallower than the published depth of 1235 m. These differences are close to the uncertainty level of 90 m (
Table 2). The modeled pressure changes are 0.8 and 0.73 MPa in Categories A and B, respectively, but pressure change data are unavailable for comparison.
Figure 8.
Matrix plot for 100 groups of best fit poroelastic disk reservoir parameters for InSAR derived displacement with mean phase value as reference and with added noise in Gudao Town (oilfield). A well confined parameter shows symmetric distribution in histogram or dots plot. A wide scatter means the parameter is unstable.
The parameters in Category B (mean value as InSAR reference) are plotted against each other to examine potential trade-offs (
Figure 8). The model parameters are well-constrained with symmetrical distributions meaning that there are no major trade-offs, except as follows. Note that there is a linear trade-off between the pressure decline and the depth of the reservoir when the reservoir gets deeper. Generally, a deeper reservoir needs greater pressure change to produce the same amount of surface displacement as a shallow one. Another trade-off is observed between the pressure decline and the radius of the reservoir when the lateral dimension of the reservoir gets greater. Accordingly, a greater reservoir requires less pressure change for the same amount of surface displacement than a small reservoir. Actually, the volume (equivalent to the radius here) and pressure change are treated together in an elastic Mogi type model and their product is defined as the source strength [
51].
The model underestimates the displacement in the SW corner of the mapped area (
Figure 9). This area of displacement is separated from the central area of subsidence and may be related to a separate source. The central area of near symmetrical displacement of 3 × 3 km with deformation up to 67 mm is relatively well modeled. Along the profile PP", we can group observations into three clusters from SW to NE (
Figure 9d). The left cluster (0–1 km along the profile) shows 10 mm subsidence. The model systematically overestimates subsidence in this region (positive residuals). The central cluster (1–2.5 km) shows clear subsidence and exhibits a displacement gradient. The model generally underestimates subsidence leading residuals up to 10 mm. The right cluster (2.5–4 km) has only a few coherent pixels and these show less subsidence than the central cluster. Overall, the three clusters suggest a bowl shape subsidence field, consistent with the model, although with steeper sides than the model predicts. Profile SS" shows a higher displacement gradient and the model systematically overestimates displacement away from the center of deformation. This misfit is related to the non-axisymmetric pattern of deformation and could be due to heterogeneity of the pressure distribution in the reservoir that could be solved by considering non-uniform pressure gradients. This requires that the actual pressure change distributions within the reservoir to be known, which is not the case here.
Figure 9.
(a) InSAR derived line of sight cumulative displacement field in Gudao Town between Feb 7, 2007 and Jan 21, 2010 using the mean value as InSAR reference. (b) Best approximated displacement field using a disk reservoir model. (c) Residuals between InSAR and modeled displacements. (d) Profile P-P” through the data (triangle), the model (line), and the residuals (crosses). (e) Same for the profile S-S”. (f) Modeled vertical and horizontal displacement seen from radar LOS direction. (g) Modeled vertical displacement seen from radar LOS direction. (h) Modeled horizontal displacement seen from radar LOS direction. (i) Profile P-P” through both vertical and horizontal (black), only vertical (red), and only horizontal (blue) displacements. (j) Same for the profile S-S”.
7. Conclusions
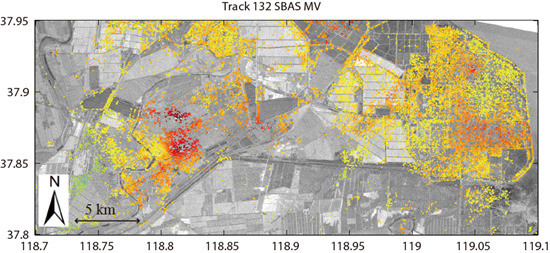
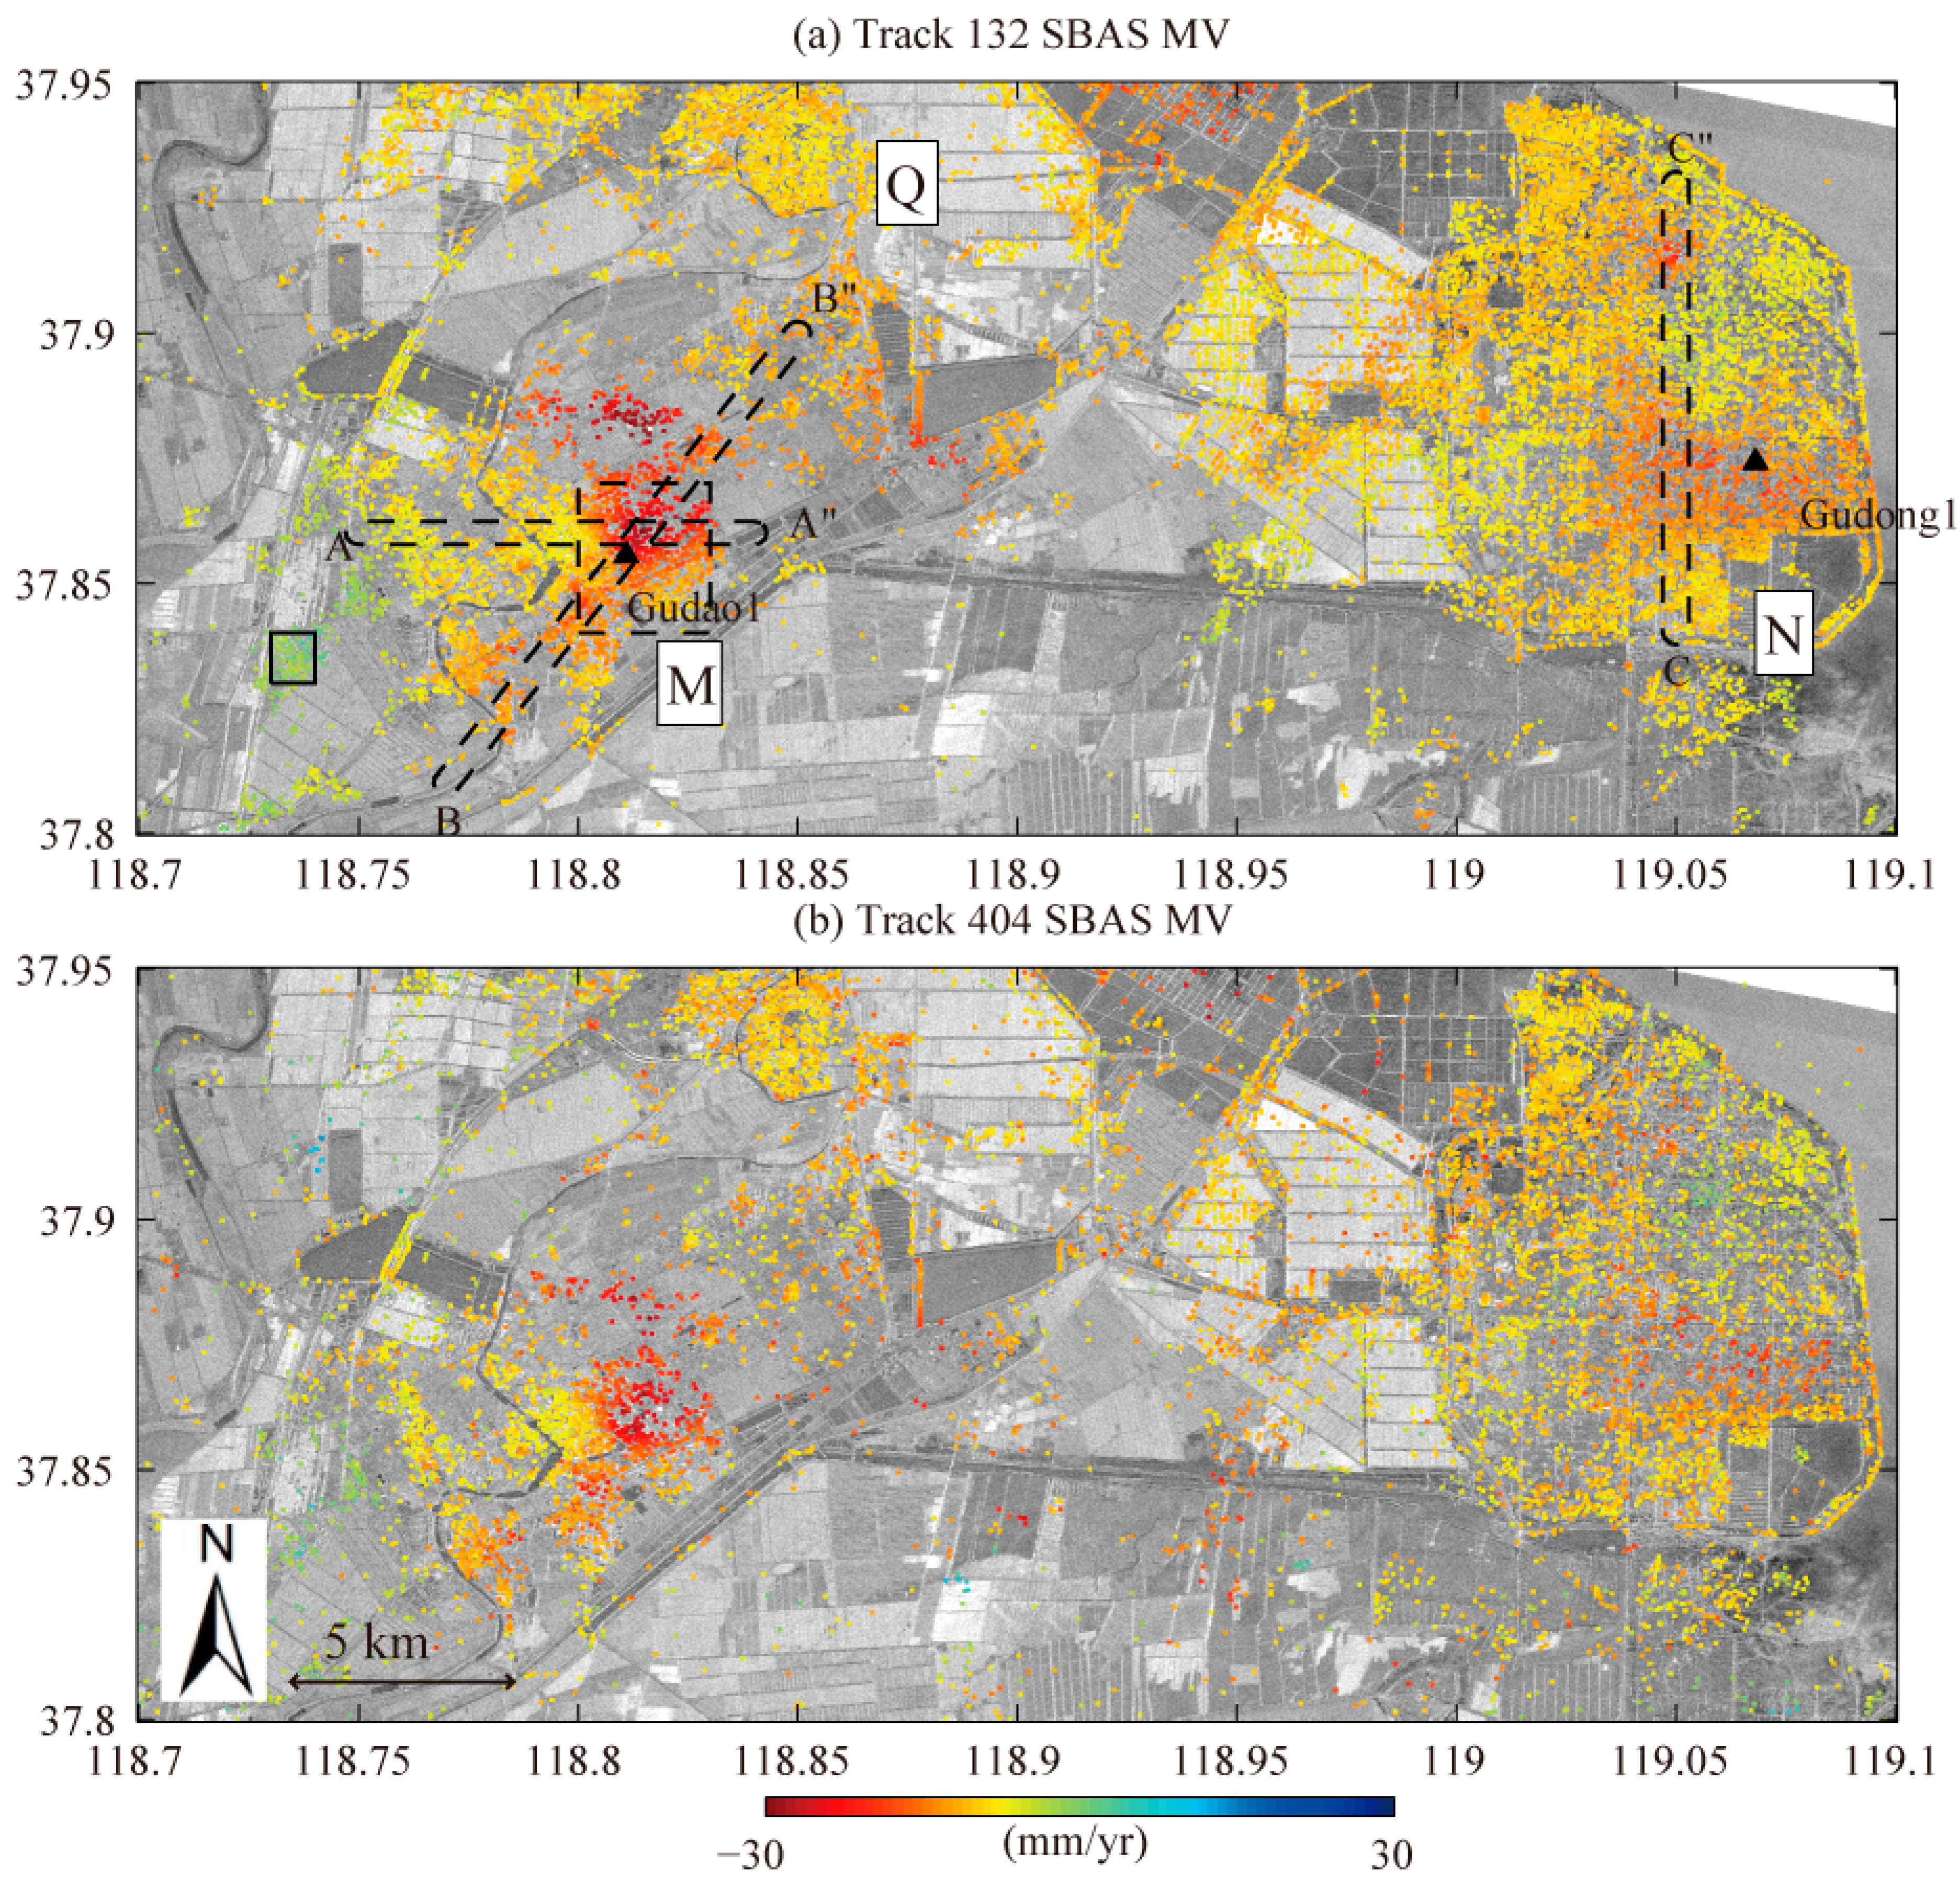
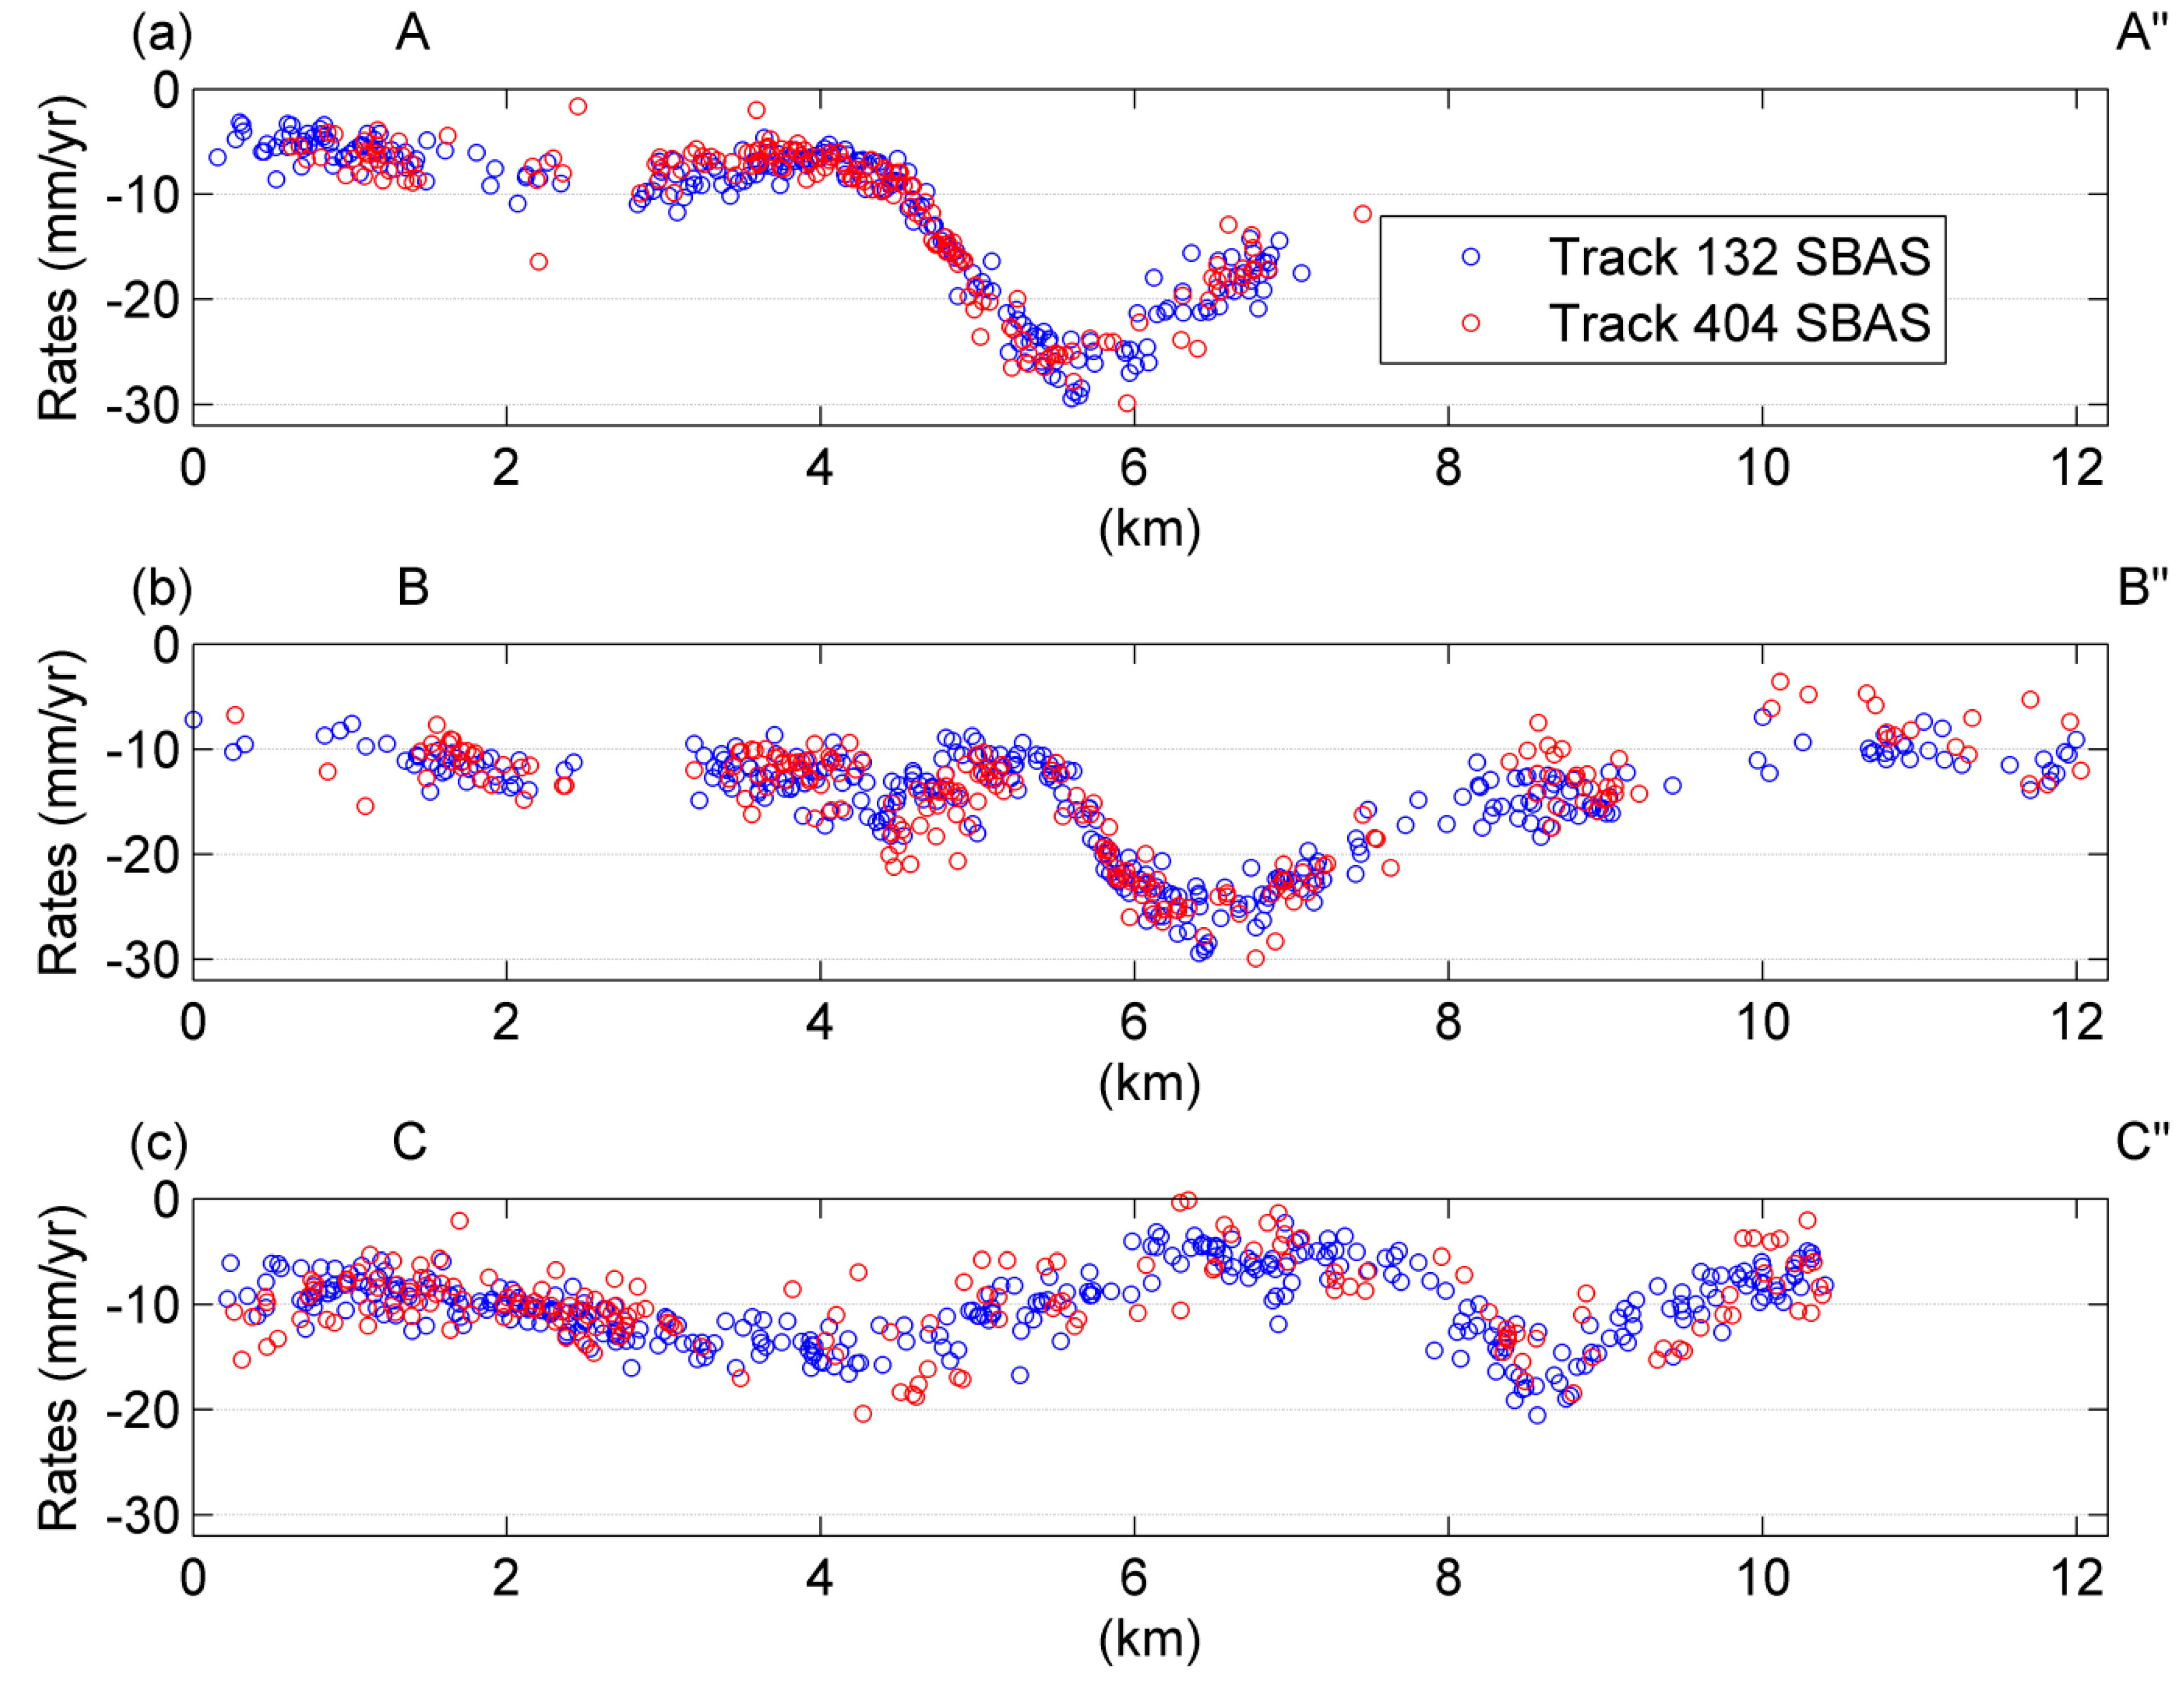
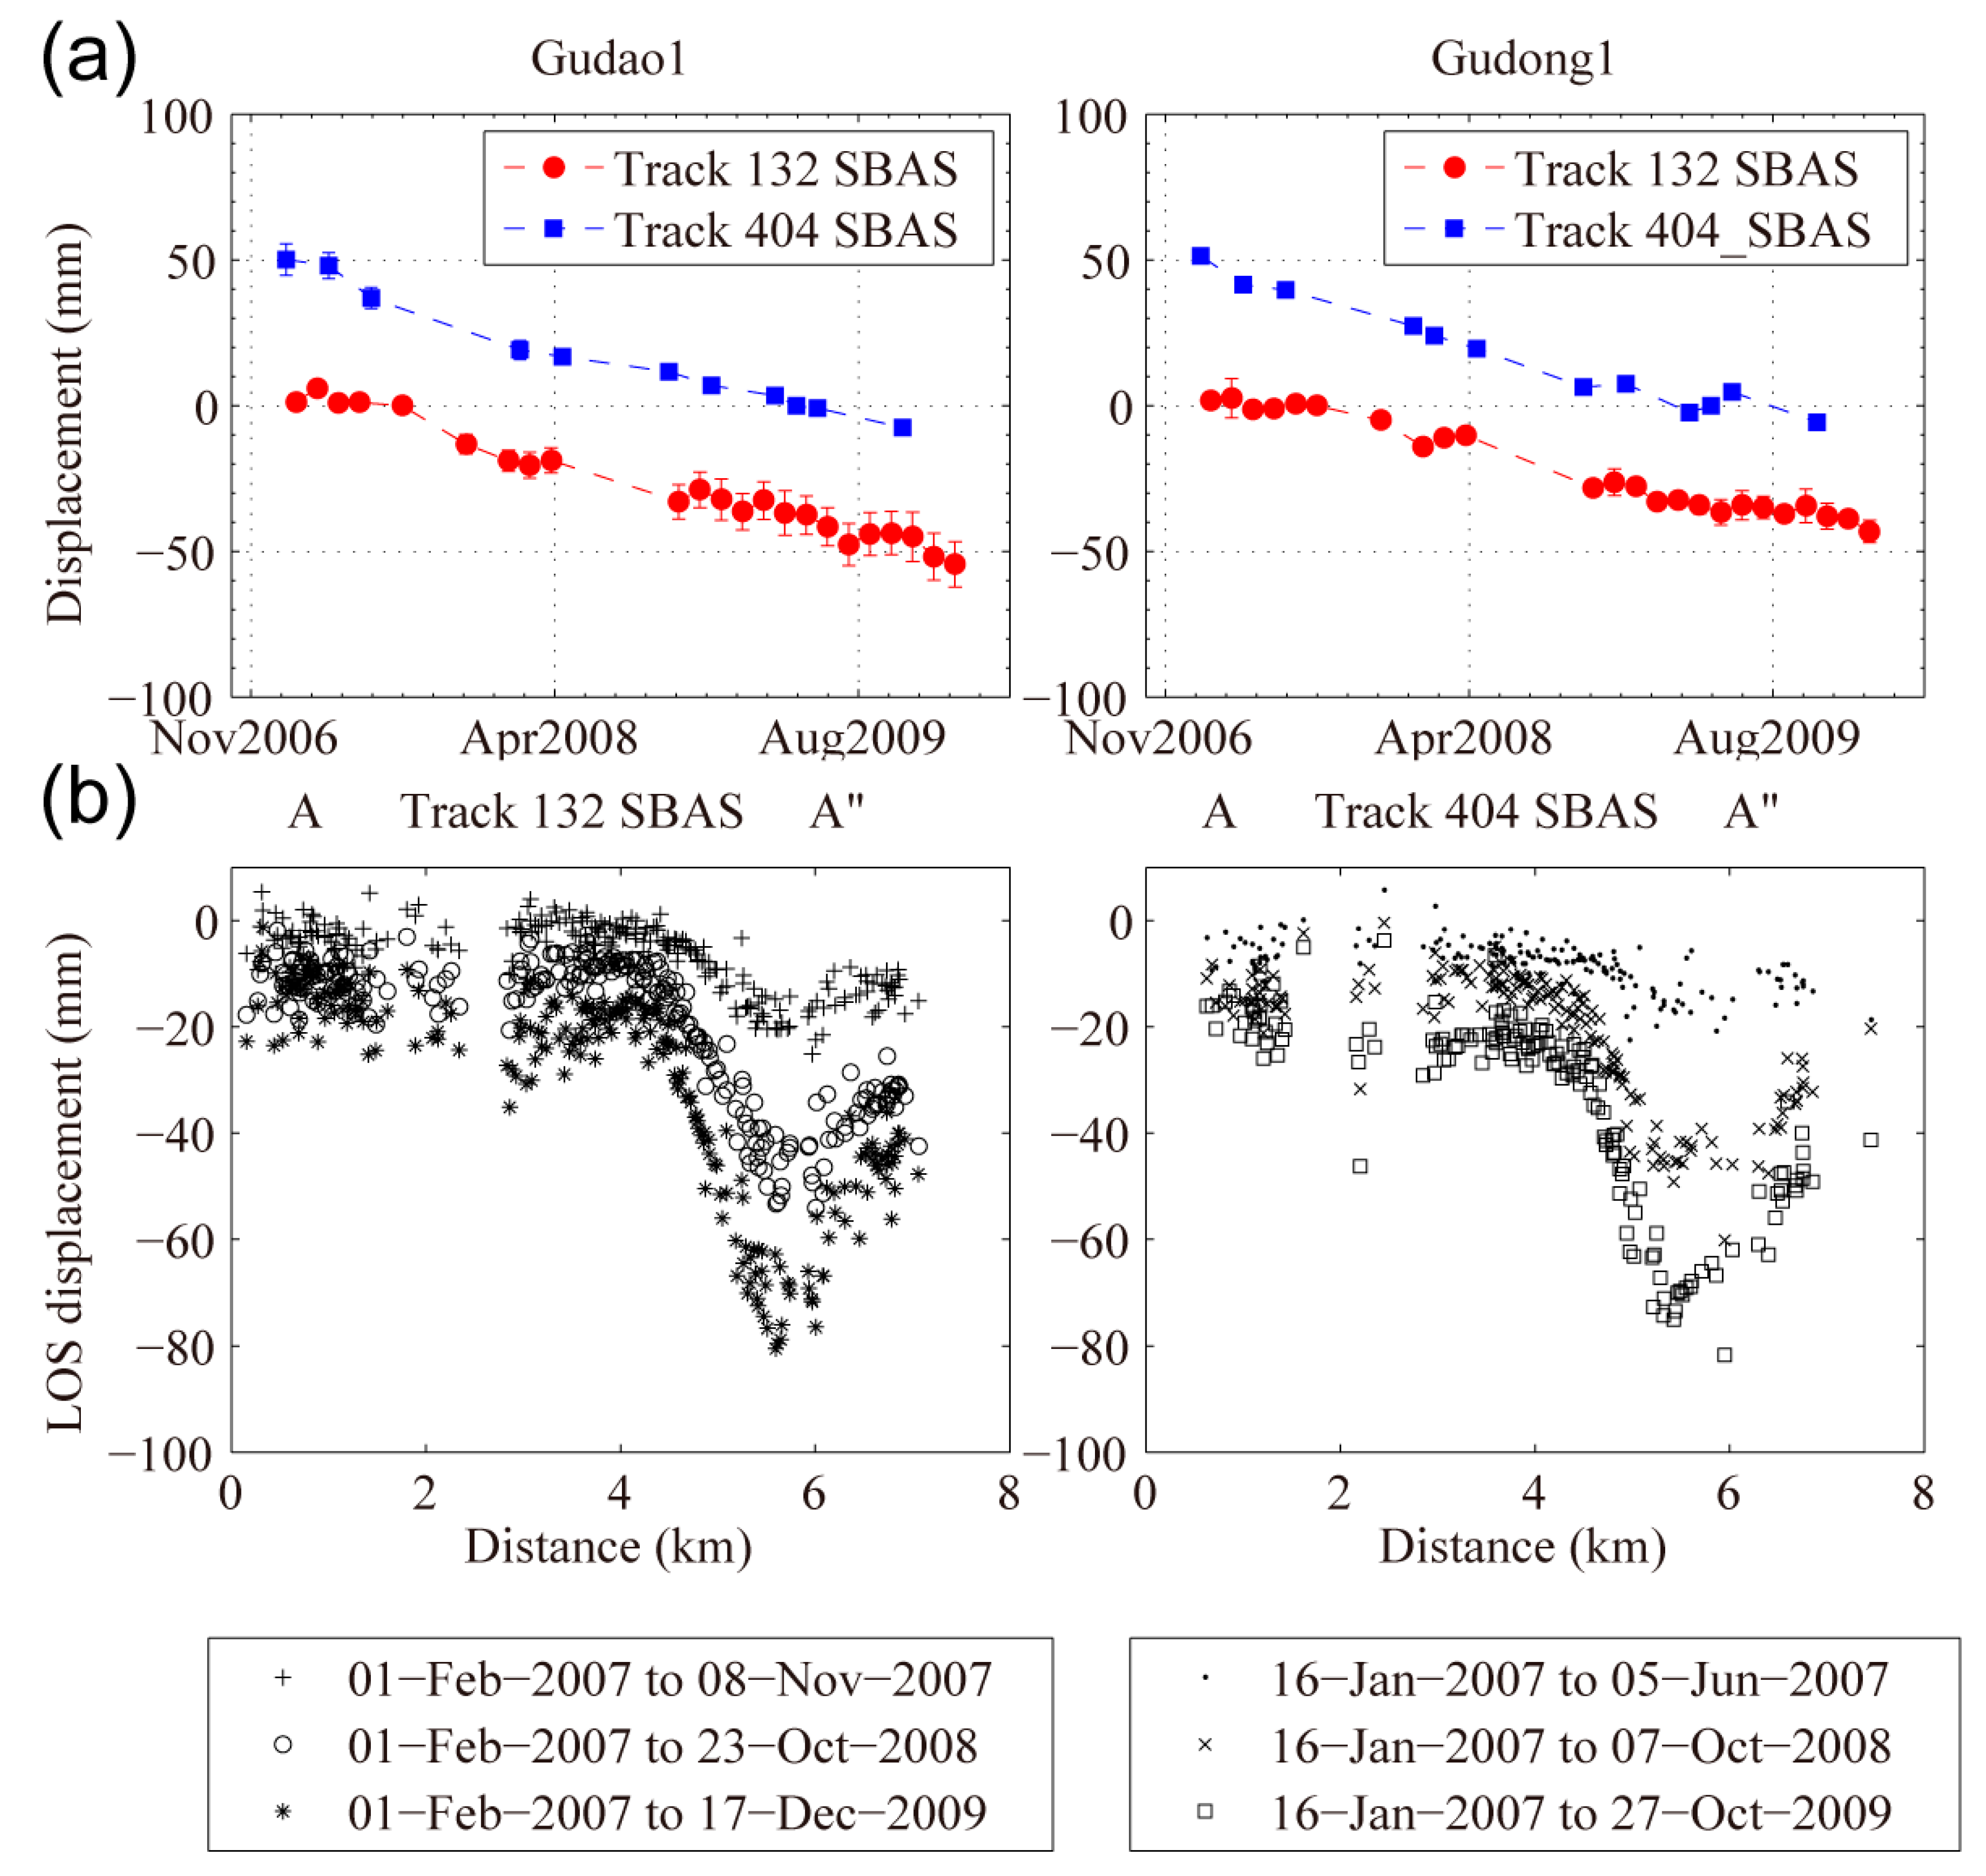
Two tracks of Envisat ASAR images are employed to investigate the subsidence in the Yellow River delta. Using InSAR time series techniques, three subsidence locations (Gudao, Gudong and Xianhe) in the Yellow River delta are detected. Cross validation between the two independent tracks show that the displacement rates and time series are reliable. Maximum subsidence rates of 30 mm/yr, 20 mm/yr and 12 mm/yr are observed for Gudao, Gudong and Xianhe, respectively.
Shallow sedimentary samples from the Yellow River delta are analysed for sediment properties, including particle size distribution, mineral composition, roundness and shape. Consistent sediment properties reveal that shallow delta materials are not the cause of InSAR observed displacement differences.
The primary cause of land subsidence in two locations (Gudao and Gudong) is suggested to be the oil extraction. Oil extraction reduces the oil reserve in the reservoir, decreasing the pressure within the reservoir. Reduced pore pressure increases the effective stress and cause the reservoir to shrink. Reservoir compaction will in turn cause subsidence at the Earth surface. Poroelastic models well represent this kind of deformation mechanism. The disk reservoir is in good agreement with the geometry of Gudao oilfield and its analytical solutions to the Earth surface displacement are available. Hence, a poroelastic disk reservoir is used to model subsidence due to oil extraction in Gudao oilfield.
The best fit poroelastic disk reservoir parameters for Gudao oilfield are estimated from InSAR observed displacement through model inversion. The accuracy of model parameters is examined when the inversion was repeated. Similitude between InSAR observed subsidence and the best fit poroelastic model confirms the dominance of oil exploitation in total subsidence of Gudao oilfield.
Oil extraction induced pressure decline of 0.73–0.8 MPa is estimated in the sandstone reservoir of Gudao oilfield. Unfortunately, actual pressure decline is unavailable for comparison. Oil extraction induced maximum subsidence of 62 mm is estimated in Gudao from the best fit model parameters. More uniform signals like the 20 mm deformation offset estimated in Gudao from the model, and subsidence in Xianhe (8~12 mm/yr) are related to shallow sediment compaction or loading.
Subsidence mapping in Yellow River delta are limited by the number of SDFPs due to spatial and temporal decorrelations. Radar data with longer wavelength and shorter revisit time will exhibit better coherence and raise density of SDPFs across the delta. Hence, longer wavelength L band ALOS 1/2 images and shorter revisit time C band Sentinel-1 images are of interest to map subsidence in a wider area of the Yellow River delta. Advanced subsidence models for the Yellow River delta can be implemented using numerical methods if currently confidential data become available.


