1. Introduction
Almost all life on Earth depends inevitably on primary production. Grasslands are efficient producers of organic matter, having a high net primary production (NPP) to gross primary production (GPP) ratio, NPP/GPP. Zhao et al. [
1] reported that for grasslands, the three-year mean NPP/GPP ratio estimated with the improved MODIS 1 km × 1 km grid MOD17 product is 0.65, while for deciduous broadleaf forests, this parameter is 0.35. Additionally, grasslands are important from several other points of view, such as biodiversity, agricultural production, and tourism, among others [
2,
3,
4].
A significant portion of Europe’s agricultural area is grasslands [
5]. The European Union has established the Common Agricultural Policy (CAP) that enables the payment of subsidies to farmers [
6]. “Greening” is a measure in the CAP that makes the system of direct payments more environmentally-friendly, requiring the grasslands to be maintained in good agricultural and environmental conditions. One of the obligations of farmers is to maintain their grasslands by mowing or grazing on a yearly basis. National Paying Agencies (NPAs) are required to validate the mowing requirement to verify subsidy claims. The validation is usually performed by selecting a limited test area, where the checks are then carried out using visual interpretation of very high resolution satellite images and on-site field inspections. The validation process, however, could be made more effective via a more comprehensive use of remote sensing data, especially after the successful launch of the Copernicus program [
7]. Use of Earth Observation (EO) data would allow the NPAs to perform the checks over a much larger area, leading to a more effective use of resources and helping to reduce the number of false payments.
Monitoring of agricultural areas has been an important part of remote sensing since the very first EO instruments. Optical remote sensing offers mature methods for the monitoring of agricultural yield [
8,
9,
10] and management practices [
11,
12]. However, Whitcraft et al. [
13] showed that many important agricultural areas are so persistently and pervasively covered by clouds that less than half of their 8 day composites would be even 70% clear of cloud cover. Authors also concluded that in these areas and time periods, optical polar-orbiting imaging is not likely to be a viable option for operational monitoring. Similarly, laser scanning, while known to be capable of producing reliable vegetation height estimates [
14,
15], is predominantly applied in the case of forests or bushes, and is too expensive for continuous wide area monitoring. Use of spaceborne synthetic aperture radar (SAR) data would therefore be beneficial, as the SAR signal can penetrate clouds in all but extreme weather conditions, providing continuous data covering a large area.
As in the case of optical remote sensing, investigations of SAR signal attributes in relation to vegetation parameters have been widespread since the first data became available, and research covers different agricultural applications and technical approaches. The launch of Sentinel-1A and -1B SAR satellites now offers an opportunity to investigate agricultural monitoring methods based on regular dense time series of free and open data. Regarding the monitoring of management practices, studies have shown the potential of approaches based on the analysis of backscatter intensities, polarimetric SAR (PolSAR), and interferometric SAR (InSAR). The possibility of detecting harvesting events of sugarcane using backscatter intensities of TerraSAR-X, ASAR/ENVISAT, and PALSAR/ALOS sensors was analysed by Baghdadi et al. [
16], who concluded that the events can be detected if the acquisition date is close to the harvesting date and the sugarcane is not dried out before harvesting. In [
17], the Radarsat-2 C-band HH/VV (horizontal transmit, horizontal receive/vertical transmit, vertical receive) intensity ratio was shown to be related to the ploughing of winter wheat, but management practices like grazing, mowing, and mixed management on grasslands could not be discriminated. Wang, Ge, and Li [
18] analysed the relationship of COSMO-SkyMed X-band, ENVISAT ASAR, and ALOS PALSAR backscatter values to the Normalized Differential Vegetation Index (NDVI), Normalized Difference Water Index (NDWI), and soil moisture index (MI) values without ground truth measurements, and concluded that at paddock scale, X-band HH backscatter could be useful for the detection of grazing or mowing activities on pastures during peak season on non-rainy dates. Mowing events on grasslands were specifically studied using PolSAR by Voormansik et al. in 2013 [
19] and 2016 [
20], demonstrating that several C-band and X-band polarimetric parameters are sensitive to mowing events in cases where the grass was left on the ground after the event. However, the combination of VV and VH (vertical transmit, horizontal receive) polarized channels offered by the Sentinel-1 means that the PolSAR approach is problematic, as most of the PolSAR methods require fully polarimetric or dual polarimetric co-pol data. Additionally, use of backscatter from one channel (e.g., VV) is problematic, due to variations caused by changing meteorological conditions and vegetation orientation effects [
21].
On the other hand, InSAR-based approaches have shown potential for change detection in vegetation, and the regularity of Sentinel-1 data is well-suited for InSAR applications. Early advances in the detection of abrupt changes in vegetation with InSAR were made in the forest domain. In [
22], it was shown that clear-cuts have higher interferometric coherence values than forests, in line with observations comparing forested and bare areas in [
23]. The approach has been shown to apply for agricultural monitoring as well. High coherence values due to backscattering from the ground were linked to ploughed bare fields and low vegetation height in [
24,
25]. A similar approach, but for the detection of mowing events on grasslands, has been studied by Zalite et al. [
26,
27], where it was demonstrated how 1-day X-band interferometric coherence is much higher for mowed grasslands when compared to grasslands covered by vegetation. However, meteorological effects play an important role in the interpretation of interferometric coherence [
28,
29,
30], including over bare ground [
31]. As one of the sources of change, precipitation may cause temporal decorrelation, complicating interpretation.
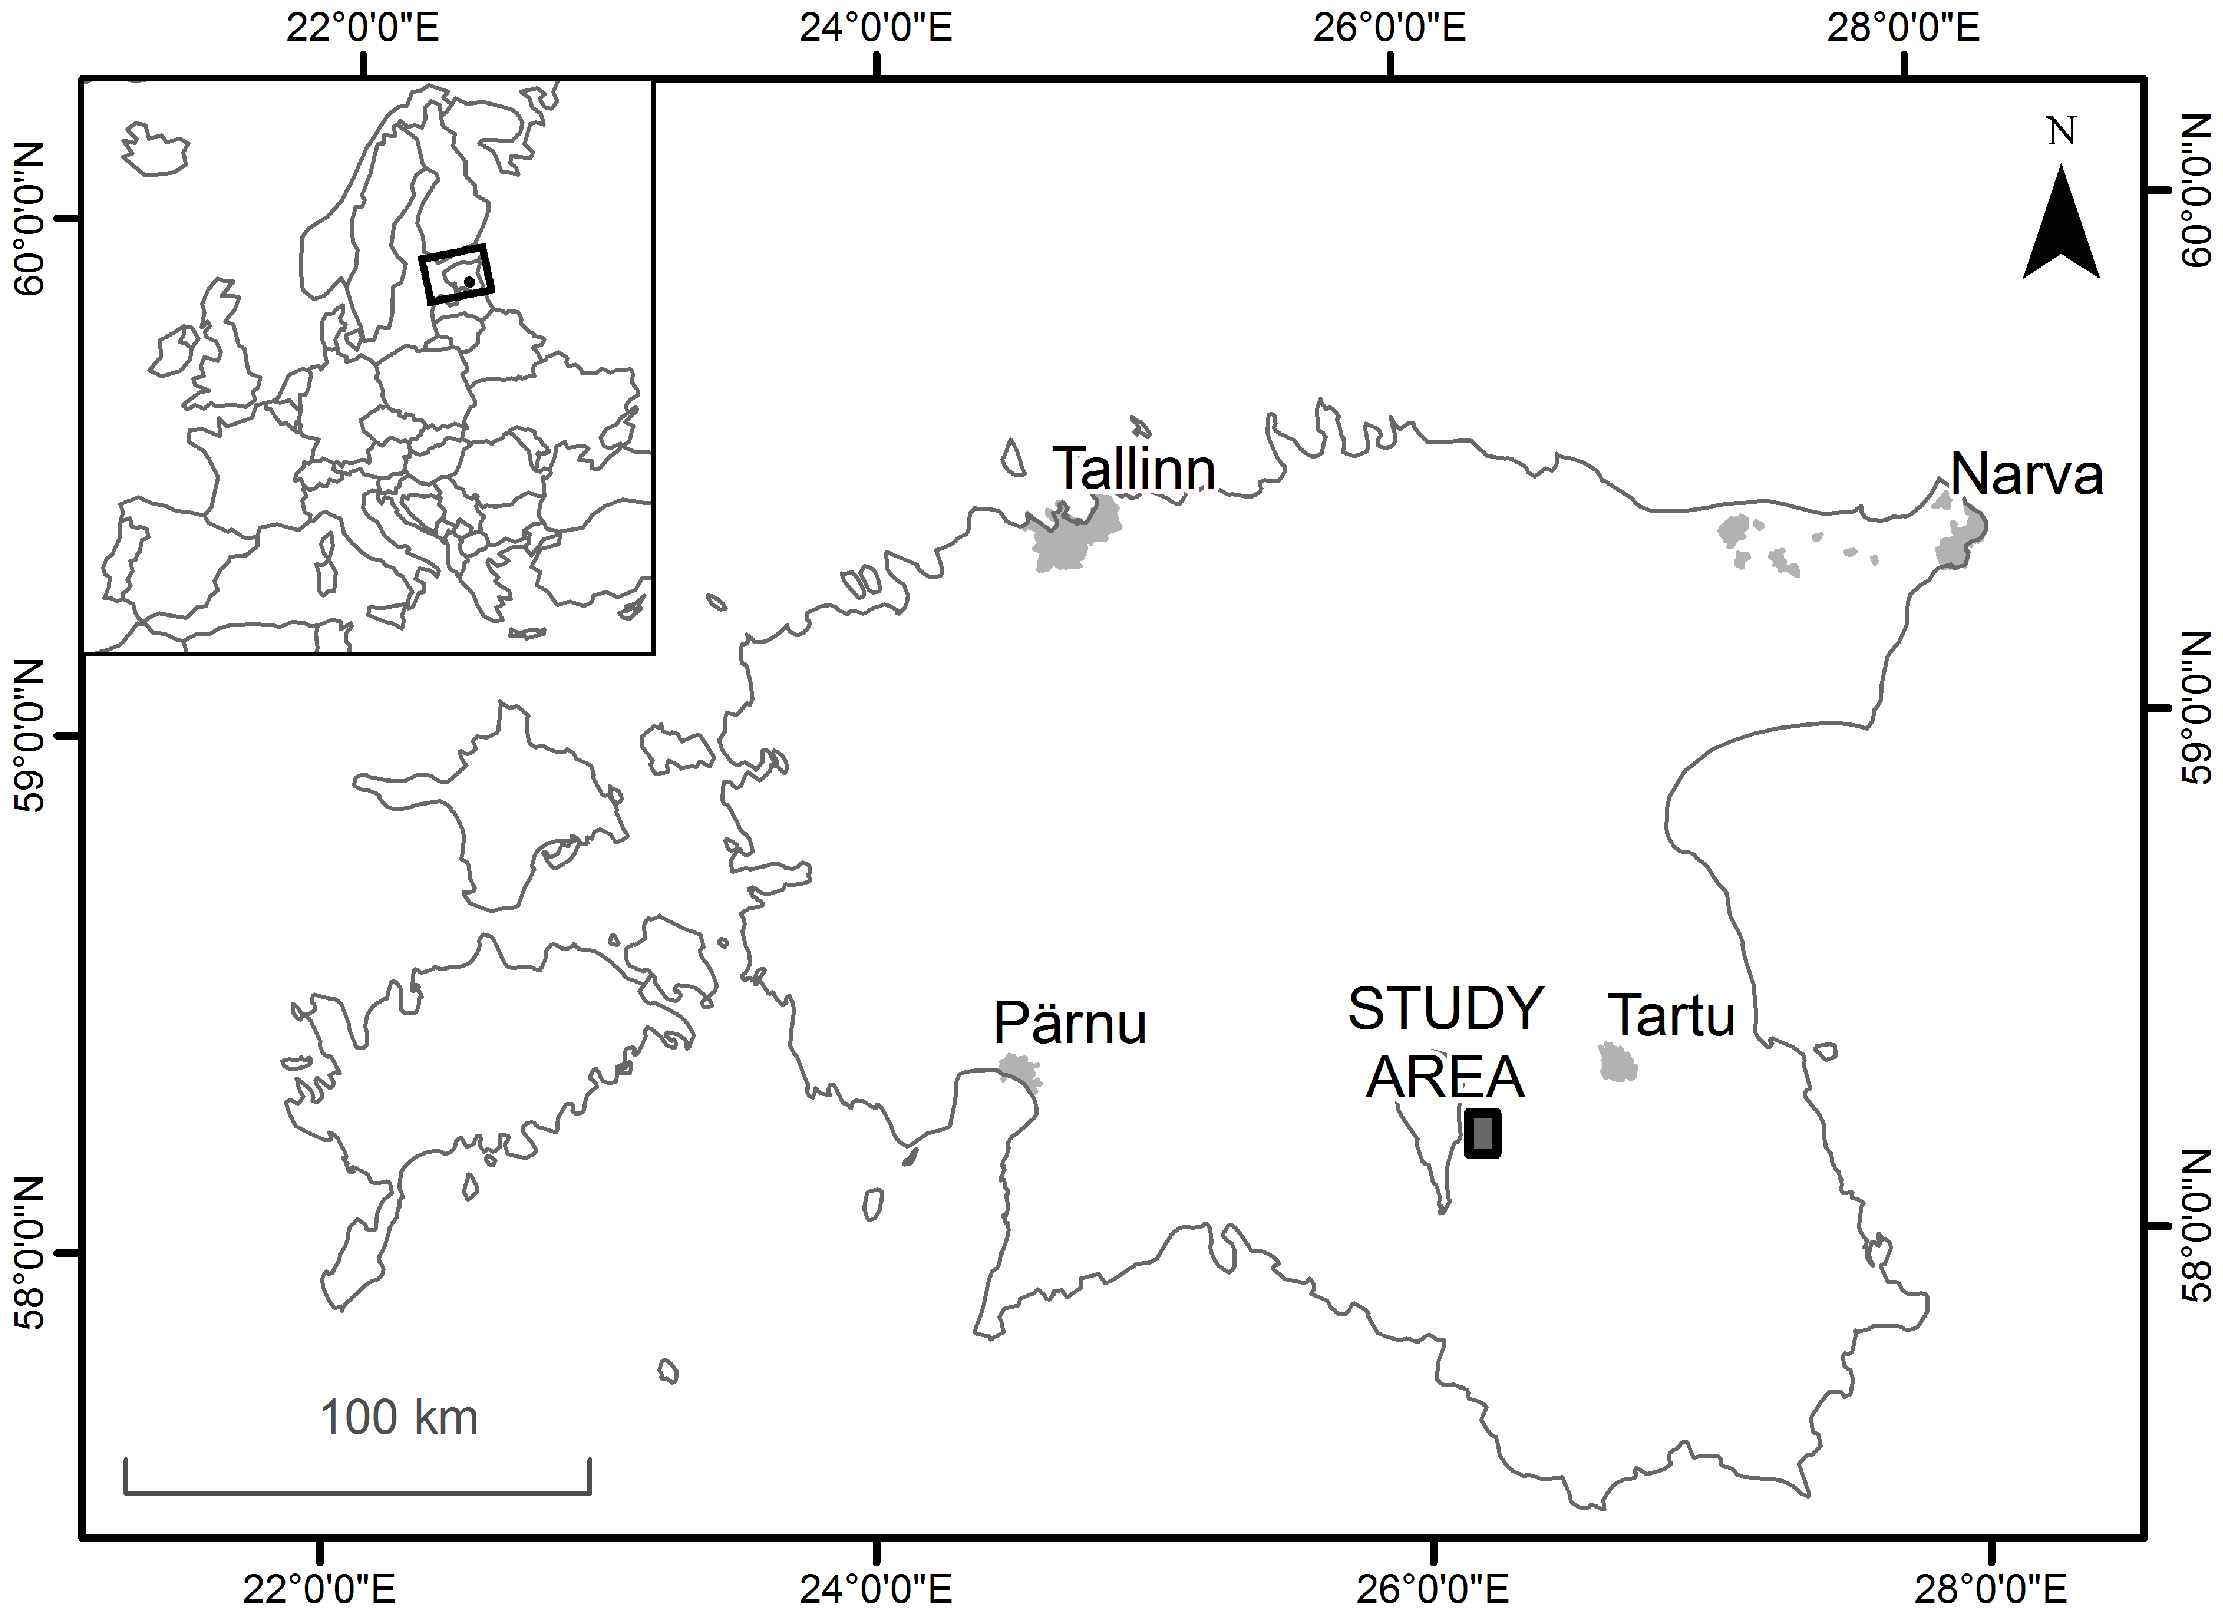
The aim of this paper is to describe the relationship between the C-band SAR 12-day repeat pass temporal interferometric coherence and mowing events of grasslands. The study was performed in Central Estonia. We mainly focus on the impact that temporal separation between a mowing event and interferometric acquisitions has on the coherence values. Additionally, we analyse the effect of precipitation on the coherence, as the importance of accounting for meteorological effects in the correct interpretation of this parameter has been previously demonstrated. A more comprehensive understanding of the relationship between coherence and mowing events would allow for the evaluation of the feasibility of using this parameter for future mowing detection applications.
The paper is organised as follows. In
Section 2, we present the data used in the study that includes SAR acquisitions, field survey information, and the description of the data processing chain.
Section 3 is devoted to presenting the results and discussion about the relationship between the interferometric coherence and mowing events. Additionally, the influence of precipitation on the relationship is analysed. Finally, conclusions are listed in
Section 4.
3. Results and Discussion
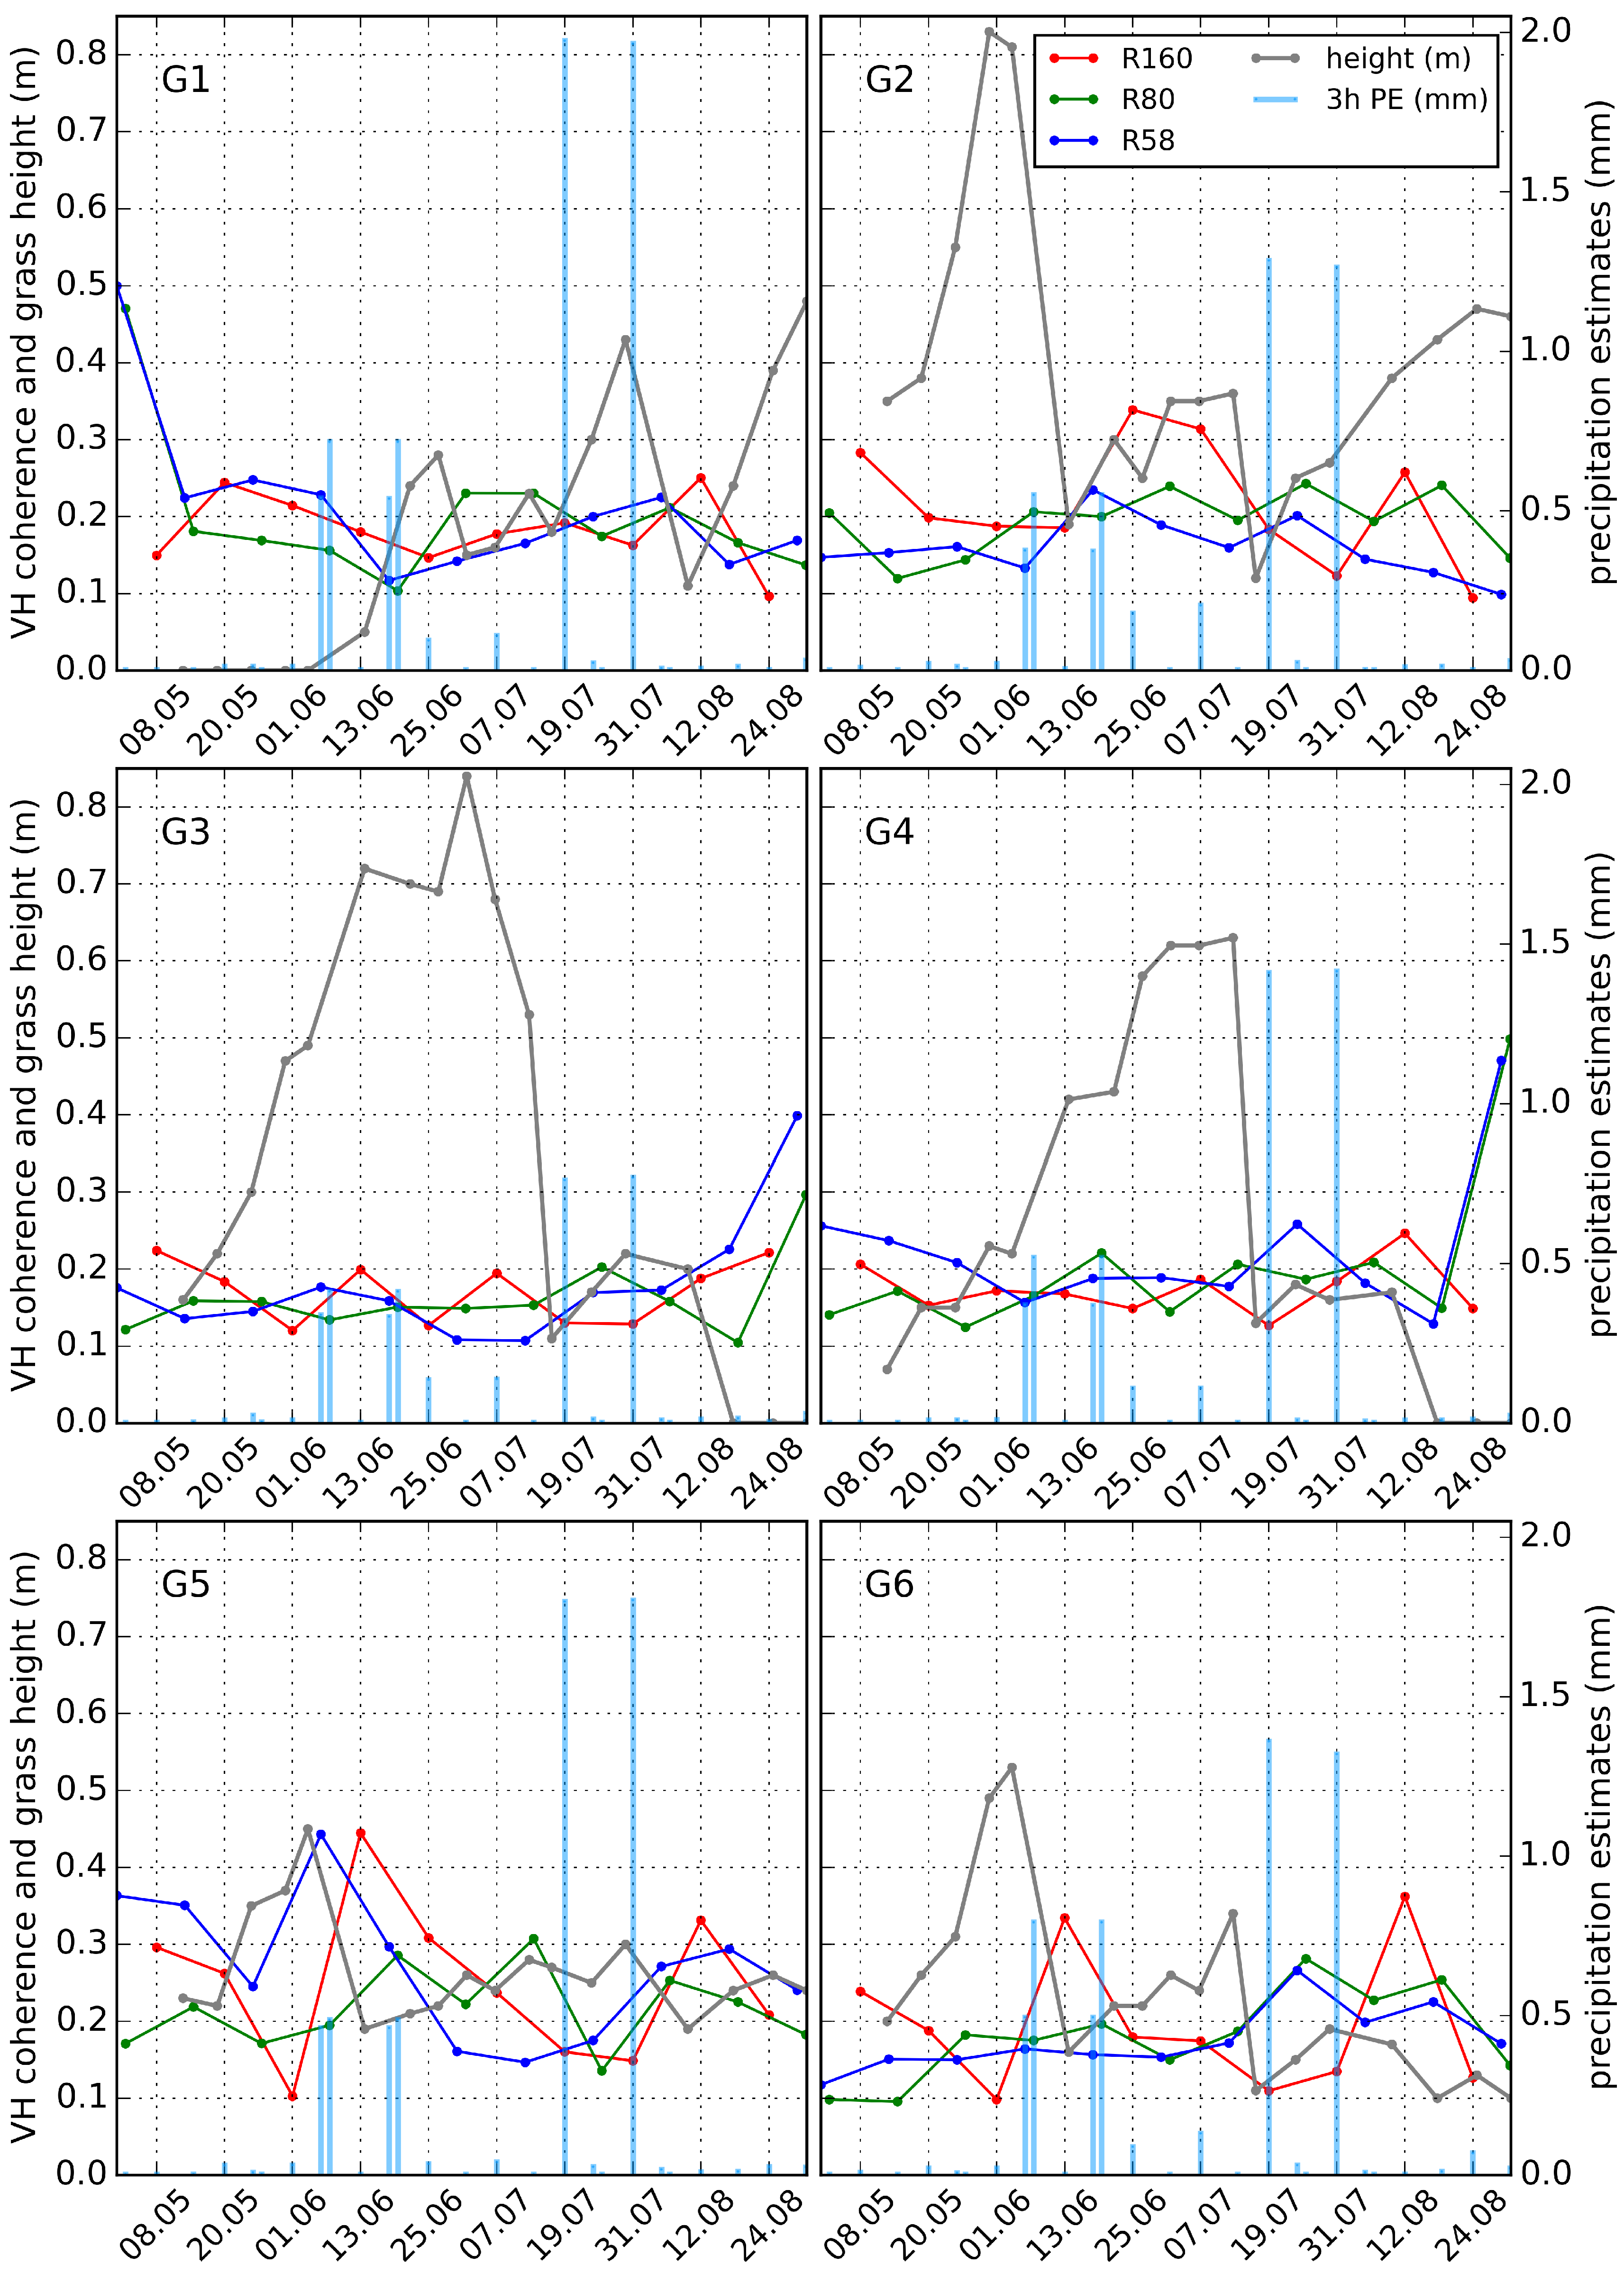
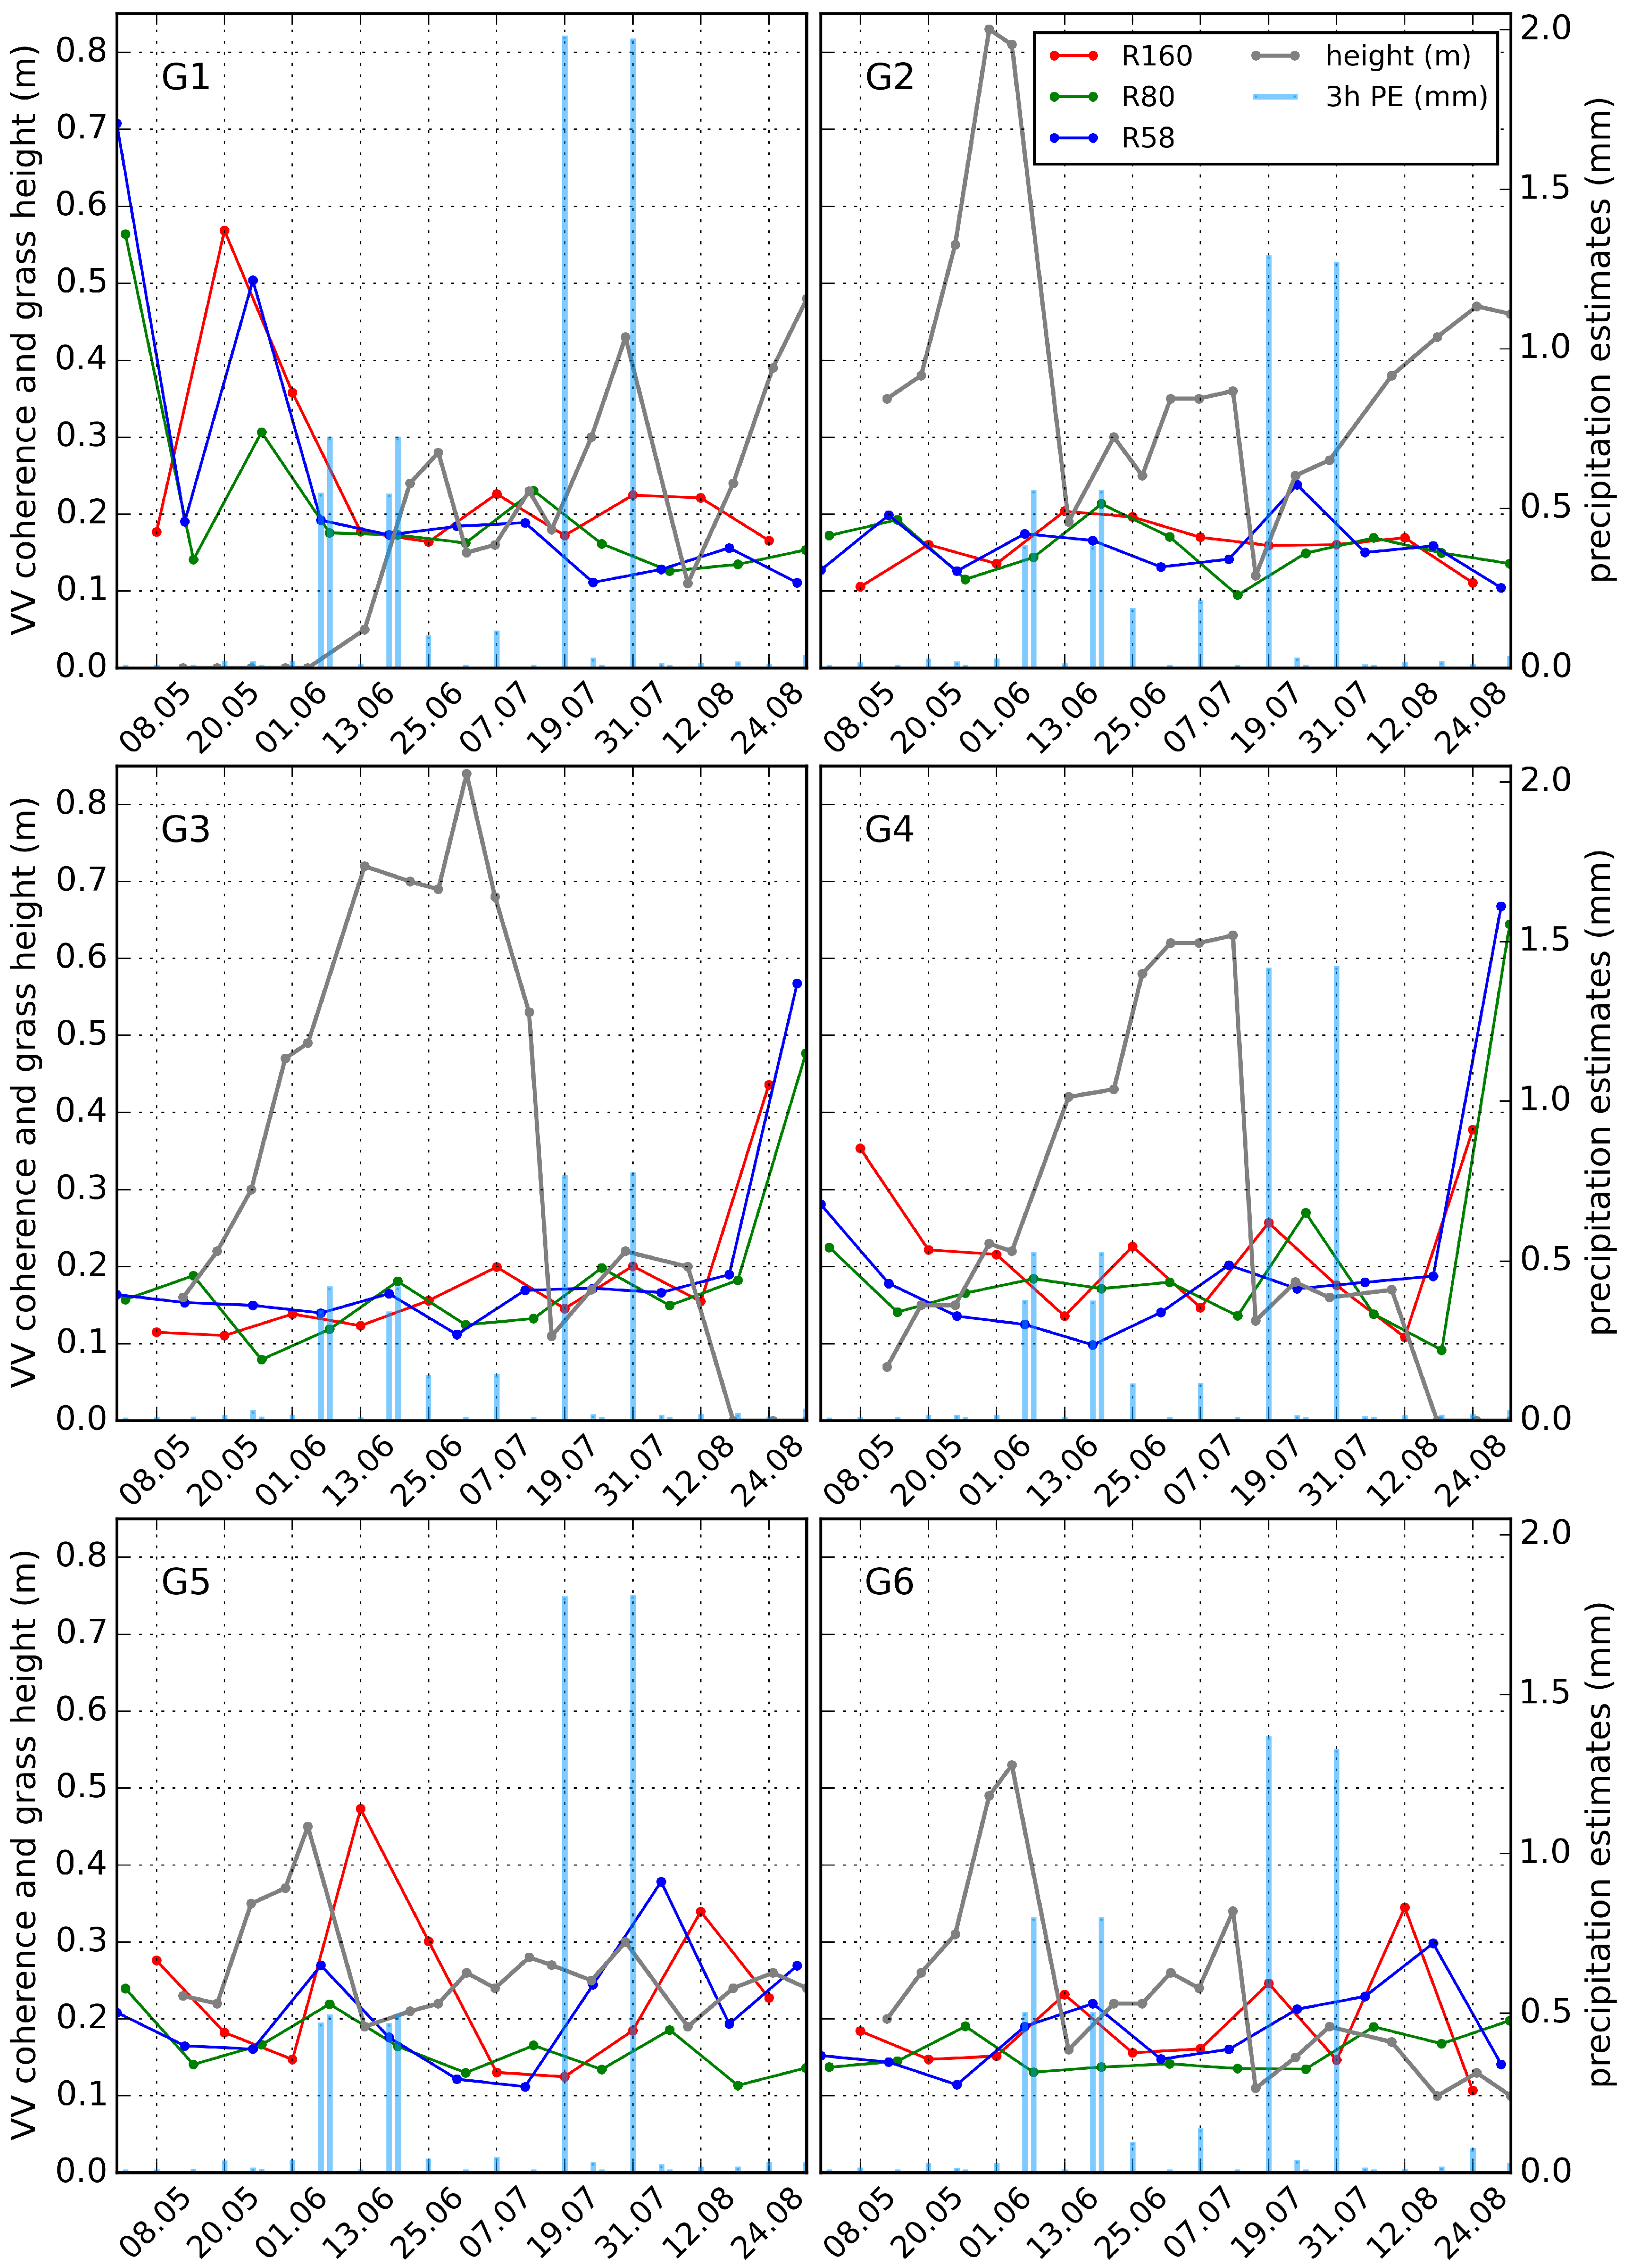
Coherence values for each of the six measurement areas where vegetation parameters were recorded throughout the summer are given in
Figure 2 and
Figure 3 for VH and VV polarisations, respectively. These time series illustrate the complexity of the relationship between mowing events and coherence. First of all, a mowing event was rarely characterised by the complete removal of vegetation, and grass with height of 0.1 to 0.2 m was often left on the field. Thus, very high coherence caused by coherent scattering from soil was rarely observed. Even when bare soil was present (G1 in May, and G3/G4 at the end of August), coherence values fluctuated. In the case of G1, low VV coherence (
) in the presence of bare soil was recorded in the middle of May. It was likely caused by farming activity visible on the field survey photos. For G3/G4, after the complete removal of vegetation in August, the grasslands were subjected to further farming activities, causing coherence to remain rather low.
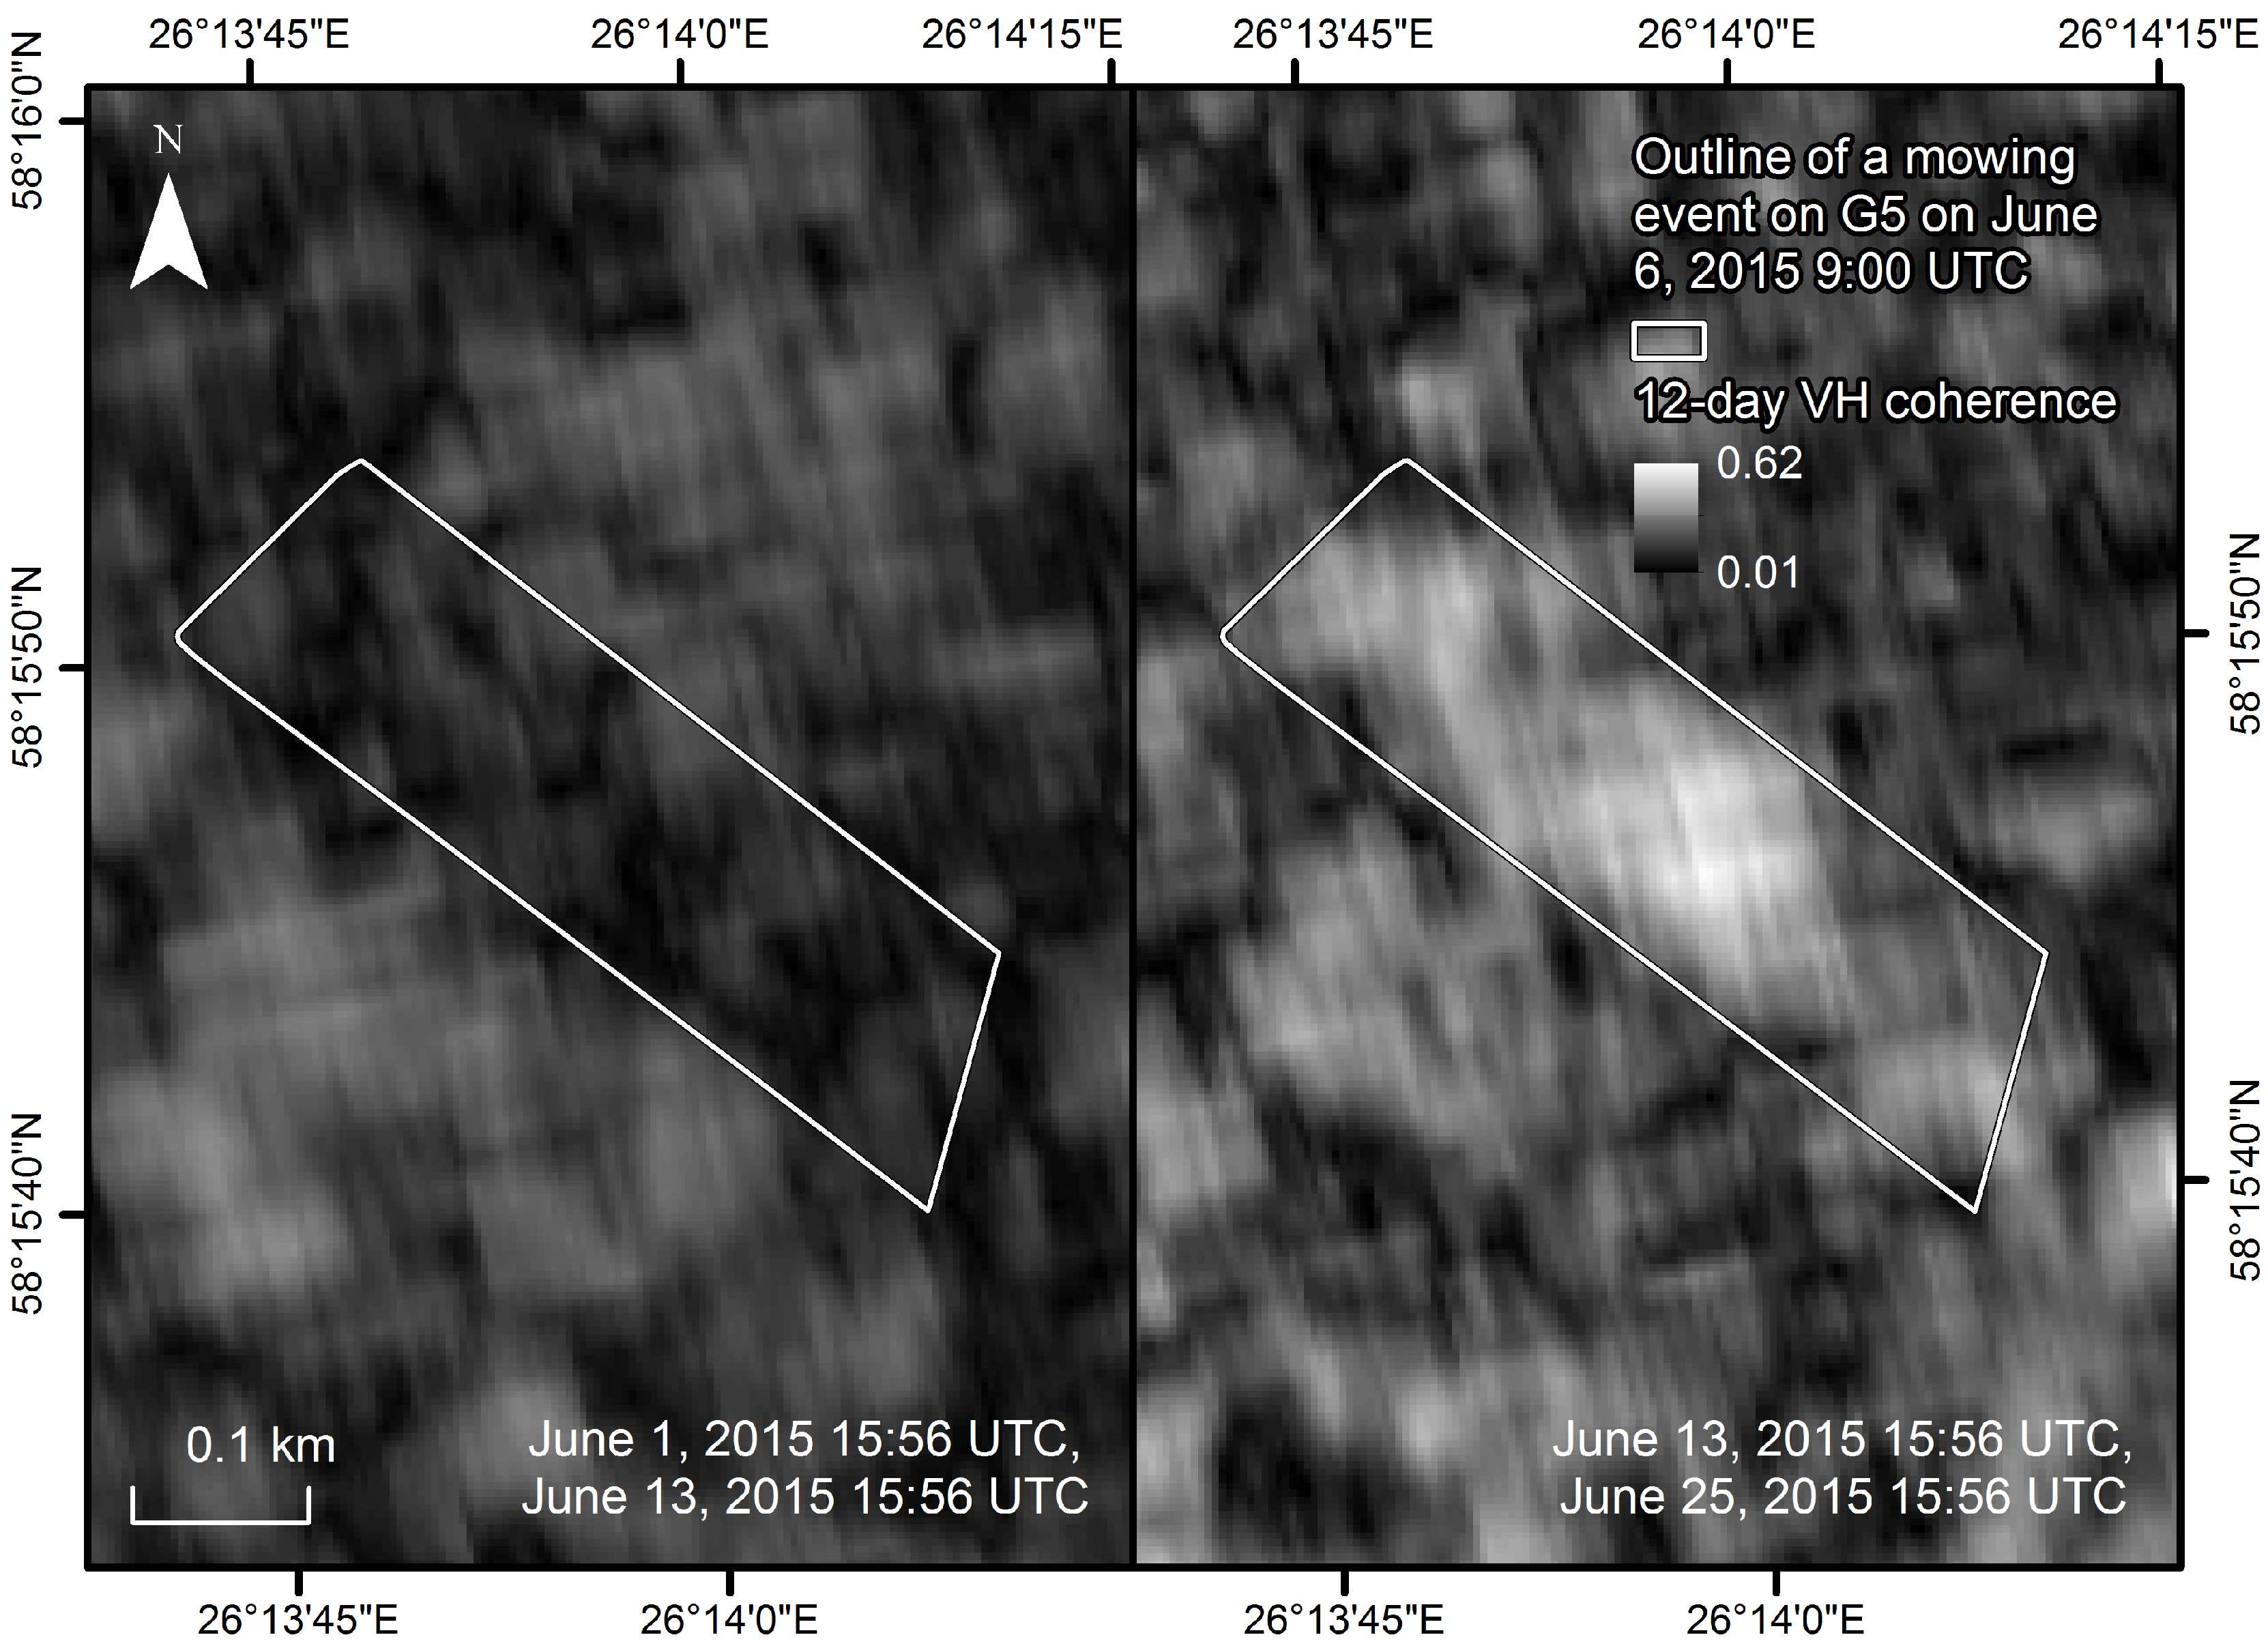
In the presence of vegetation, coherence values were also rather varied. However, some changes were apparent, and could be linked to mowing events. For example, R160
increased from 0.15 to 0.47 for G5 after a mowing event on 6 June.
Figure 4 illustrates the increase of coherence after this event. To a lesser extent,
increased from 0.18 to 0.34 for the same grassland after an event on 3 August. For the same events, R58
changed from 0.16 to 0.27 and from 0.24 to 0.38. The increase of coherence was mostly not so apparent for other grasslands that were inspected weekly. In the case of G6, the responses to an event in 8 June and 9 June were weak: R160
increased from 0.15 to 0.23 and R58 from 0.19 to 0.22. Response from R58 was probably influenced by rain—the 3-h precipitation estimate before the 18 June acquisition was 0.5 mm. The second mowing on 17 July was followed by a slight increase in R160 and R58
. The R160
value, however, might have been decreased by precipitation, as the 3-h precipitation estimate before the 21 July acquisition was 1.3 mm. R80’s
value also increased, from 0.14 to 0.27 for G4 after an event in mid July, while R160 coherence was severely influenced by rain.
Weaker responses could be observed in the cases of G1 and G2. An increase of was recorded after an event in July when R160 increased from 0.17 to 0.23 (G1) and R58 increased from 0.14 to 0.24 (G2). For other events, precipitation might have mitigated the increase. Precipitation estimates indicated rain in the case of the 21 July/12 August pair for G1, and the 19 July/31 July and 31 July/ 12 August pairs for G2. For both fields, remained low in the beginning of August, possibly because of plant growth. The 12 August/24 August coherence was low for G1 and G2, and field survey data indicated that grass had grown by about 30 cm on G1 and by 10 cm on G2 between the image pair acquisitions. This indicates that the 12-day repeat pass configuration is not temporally dense enough for the mowing detection in the case of rapidly growing vegetation.
The stronger response to mowing on G5 could be partially explained by the vegetation structure present on the grassland. The soil had a rather large moisture content (>50% soil moisture vs. <30% for other grasslands), and the grass was sparse, with lower wet above-ground biomass (AGB) values (e.g., 2.1 for G1, 4.1 for G3, and 1.6 for G5 in kg/m at the peak of the season). The sparseness of vegetation would cause more coherent backscatter from the soil, especially after partial removal of vegetation, resulting in higher coherence values. G5 was the only grassland where weak relation between soil moisture and coherence measurements was detected, with R = 0.25 for and R = 0.56 for .
After a mowing event on G3 in the middle of July, the increase of coherence values was small. Low coherence values computed from the R58 24 July/5 August image pair could be caused by the specific mowing method used. Grass was mowed above ≈30 cm to harvest the seeds, and the remaining straws were pressed to the ground. The biomass that was left on the ground decreased the portion of backscatter coming from the soil and led to lower coherence values. Additionally, the positions of these long straws could be changed by the wind between the acquisitions, thereby decreasing the coherence. Furthermore, R160 acquisitions were most probably also influenced by rain. Conversely, several polarimetric studies have reported higher sensitivity to harvesting events when vegetation was left on the ground after an event [
19,
20,
40].
Differences could also be observed between the results for VV and VH. The response of VH coherence () was rather different from that of for G1 in May and the beginning of June—values of were much smaller, by 0.2–0.3 units, ranging across all geometries. In the case of G2, R160 reached >0.30 in July, while remained under 0.20. Further differences in response could be observed for G5: 0.27 vs. 0.44 for R58 6 June/18 June image pair, and 0.38 vs. 0.27 for R58 5 August/17 August image pair, as well as for G6: 0.23 vs. 0.33 for R160 16 June/25 June image pair, and 0.13 vs. 0.28 for R80 26 July/7 August image pair. The divergences could have been caused by differences in scattering due to soil roughness and vegetation structure. For example, the VV backscatter for G1 in May (bare soil) was on average 10 dB higher than VH, with VH values dropping as low as −24 dB, reaching close to the noise-equivalent sigma zero (NESZ) value of −28 dB.
Easily observable differences existed between
and
values of different RONs. These could be explained by the difference in acquisition times, with conditions on the grasslands varying rapidly when the vegetation is growing. An additional source of decorrelation was likely the morning dew, as morning acquisitions (R80) produced consistently lower coherence values on average. The varying dew conditions can cause variation in the position of scatterers in a scene, thus decreasing coherence. The R58 geometry, on the other hand, might have resulted in lower coherence values on average, due to shallower incidence angles (for the middle of the study area, the incidence angles were 38.2
for R160, 44.8
for R58, and 39.3
for R80). This is in contrast to polarimetric approaches for harvest detection, where shallower incidence angles are often preferred [
41].
The observed differences in coherence responses after mowing events could be caused by several factors, such as soil roughness and moisture, species composition, and precipitation (or intercepted moisture). Additionally, time separation between a mowing event and first acquisition of the InSAR pair has to be taken into account. In the following two subsections, we analyse the impact of precipitation and time separation on the measured coherence in cases when a mowing event is known to have happened. These analyses will help to understand the general effects regardless of specific knowledge about species and soil conditions.
3.1. Effect of Precipitation
Analysis of the precipitation estimates results revealed that 3-h precipitation estimates described the interactions between the coherence and precipitation similarly to those of 1, 6, 12, and 24 h estimates. One reason for that could be the limited number of image pair samples available within 12 days after a mowing event. Larger variation between 1 to 24 h estimates might have been observed, given more data. On the other hand, the precipitation can dry out rather quickly, depending on the temperature on the grassland. The optimal time window length before the image acquisitions has to be analysed with a more extended sample size of mowing events. Given the similarity of the precipitation estimates of different time periods, only 3-h precipitation estimates were further used in this study.
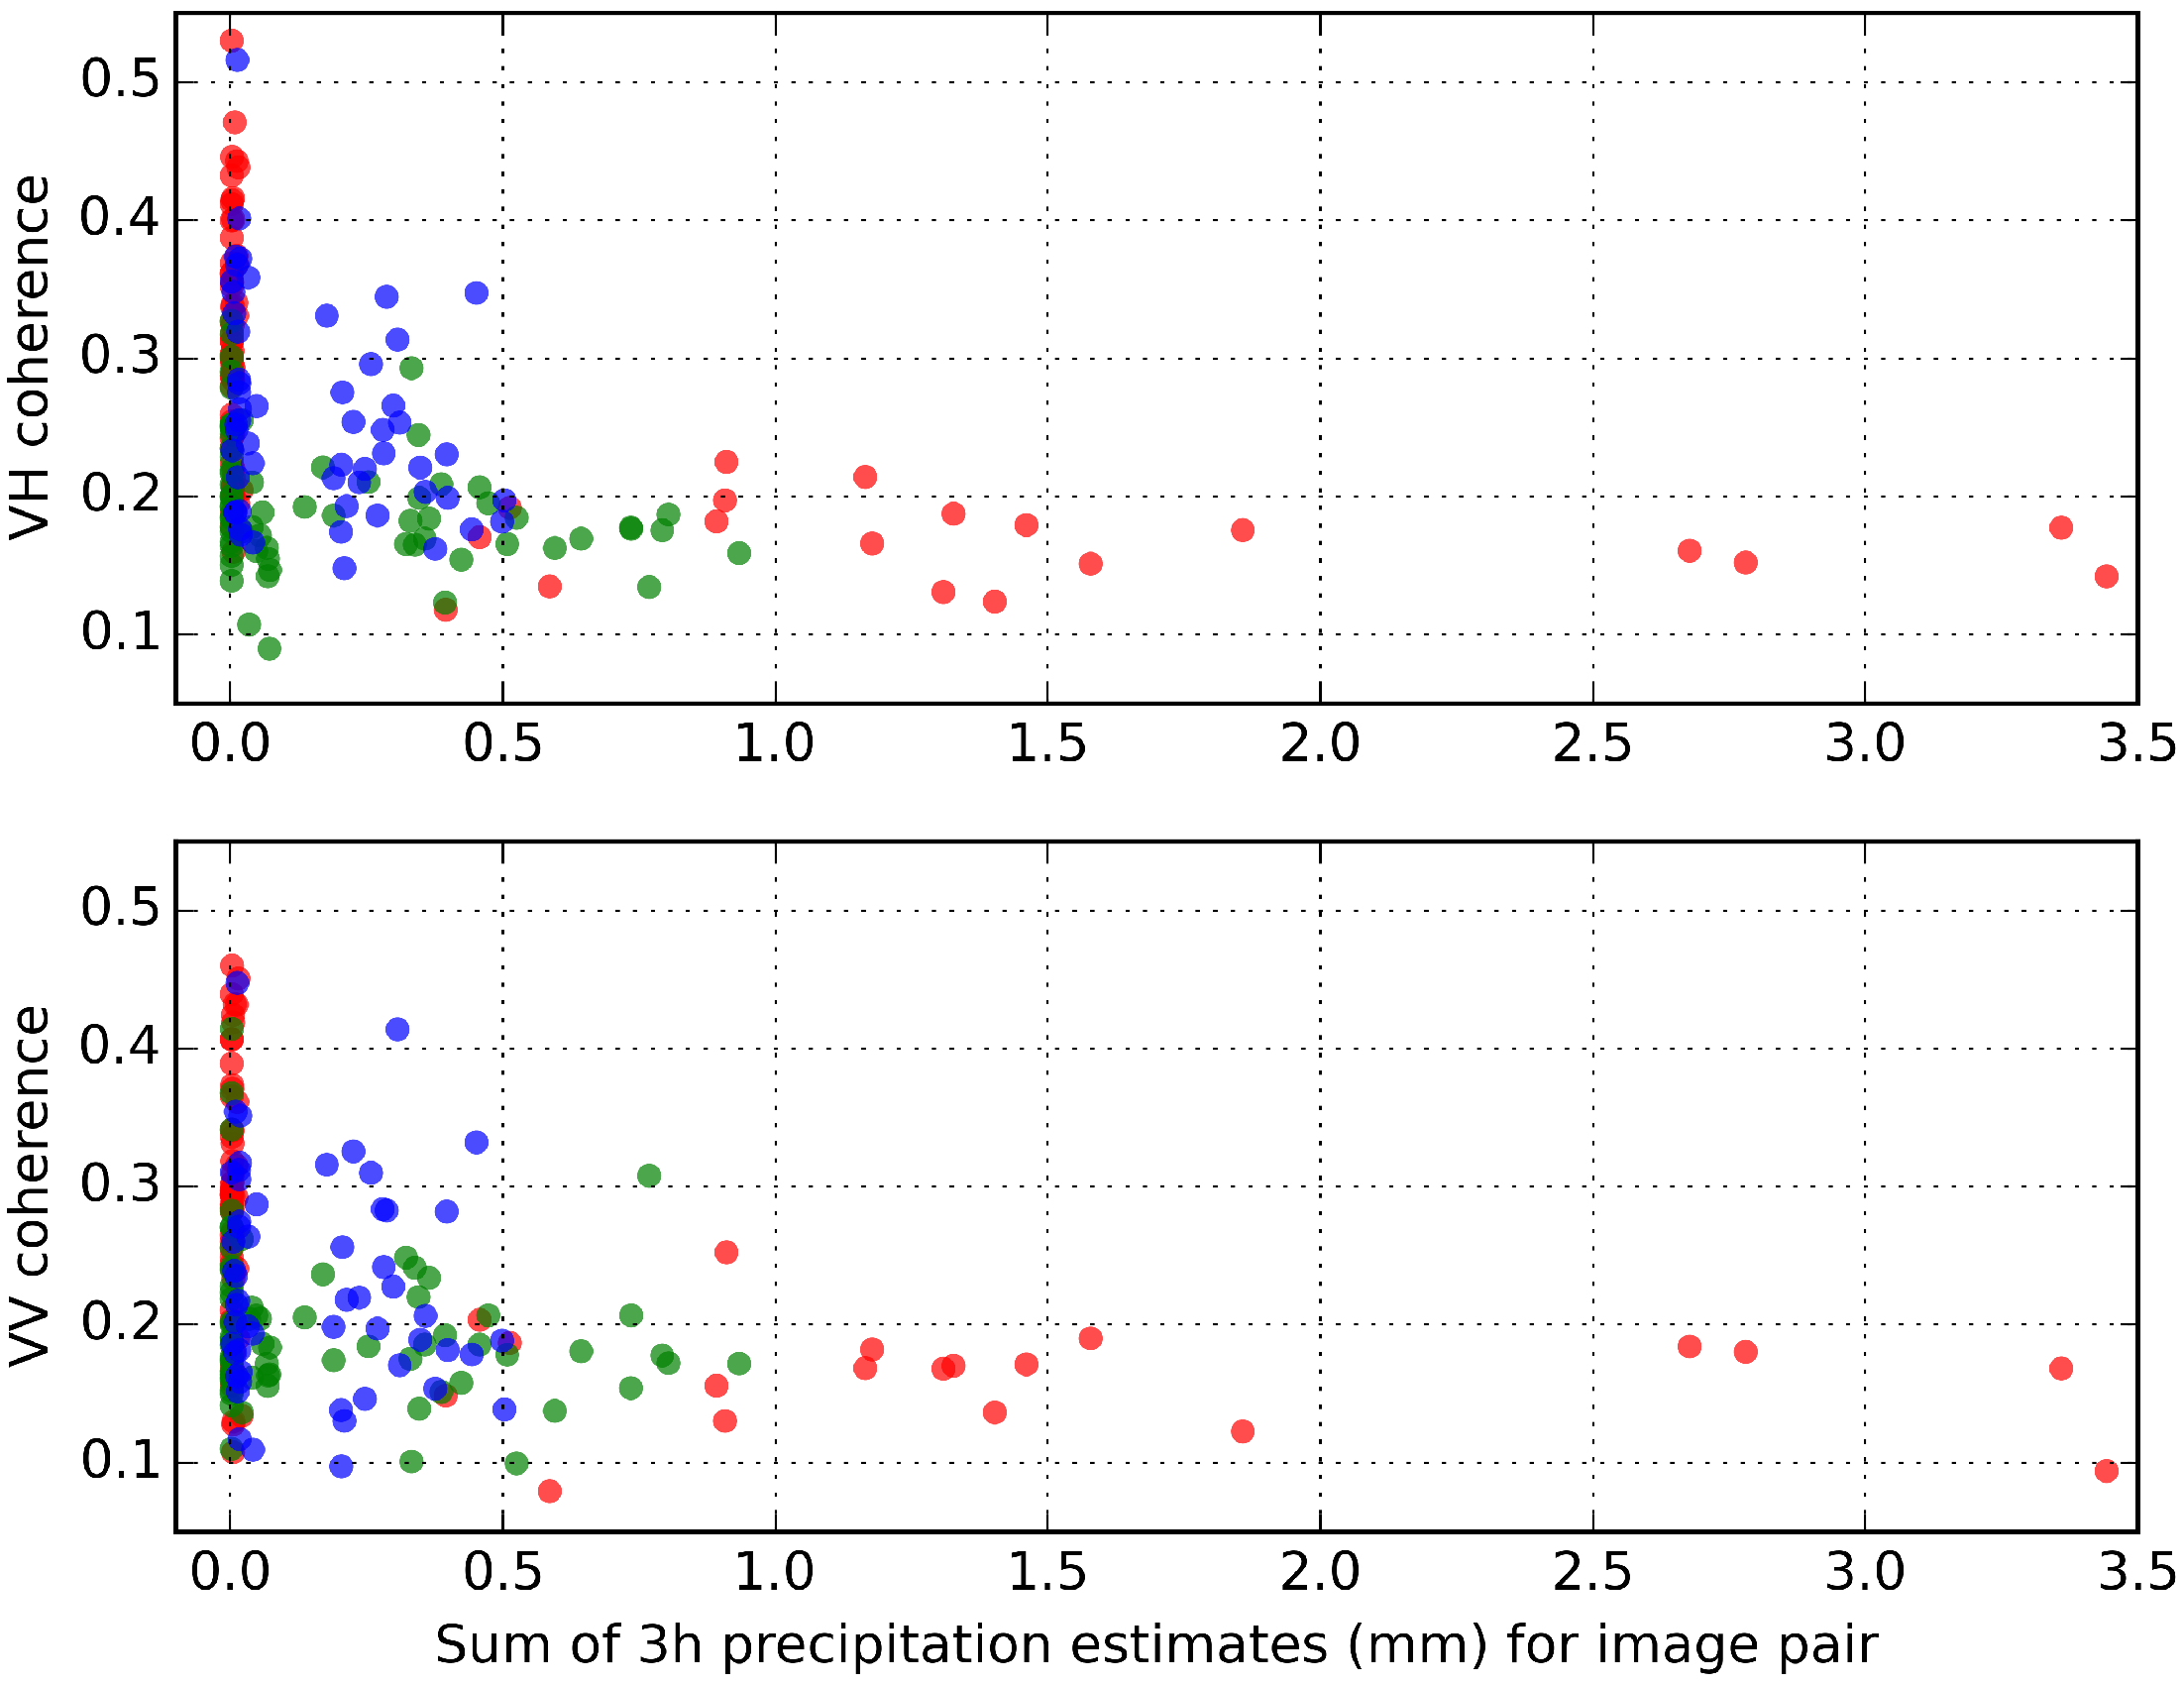
The relationship of coherence and 3-h precipitation estimates for the first image pair after a mowing event is shown in
Figure 5. When precipitation estimates were over 0.25 mm,
and
remained under 0.25 after a mowing event with a few exceptions, and
had slightly higher values than
. For further analysis, coherence values were divided into groups with 3-h precipitation estimates ≤0.25 mm and >0.25 mm. A threshold of 0.25 mm was chosen because it allowed all three image acquisition geometries to be divided into two groups based on 3-h precipitation estimate values, and these two groups can likely be associated with rain and rain-free conditions on the grasslands.
Figure 6 shows that the medians of R160 VH and VV coherence in these two groups differ significantly. Precipitation up to 3-h before one or both of the image acquisitions changes the structure and dielectric constant of the vegetation on grassland, remarkably decreasing the coherence. Loss of coherence due to precipitation has also been reported by Zalite et al. [
27] and Ahmed et al. [
42]. At the same time, R58 and R80 geometries did not show any significant differences—the notches around the median that represent 95% confidence intervals are overlapping. The 3-h precipitation estimate values were quite small before R80 and R58 acquisitions, and they might not have significantly affected the coherence. Additionally, the accuracy of the precipitation estimates has to be considered, as well as the small sample size. For R80, the median VH and VV coherence values were lower than 0.2 for the precipitation estimates ≤0.25 mm groups, so the drop of coherence could not be large for the precipitation estimates >0.25 mm group. The differences between VV and VH for this analysis were not significant.
3.2. Dependence on Time Separation
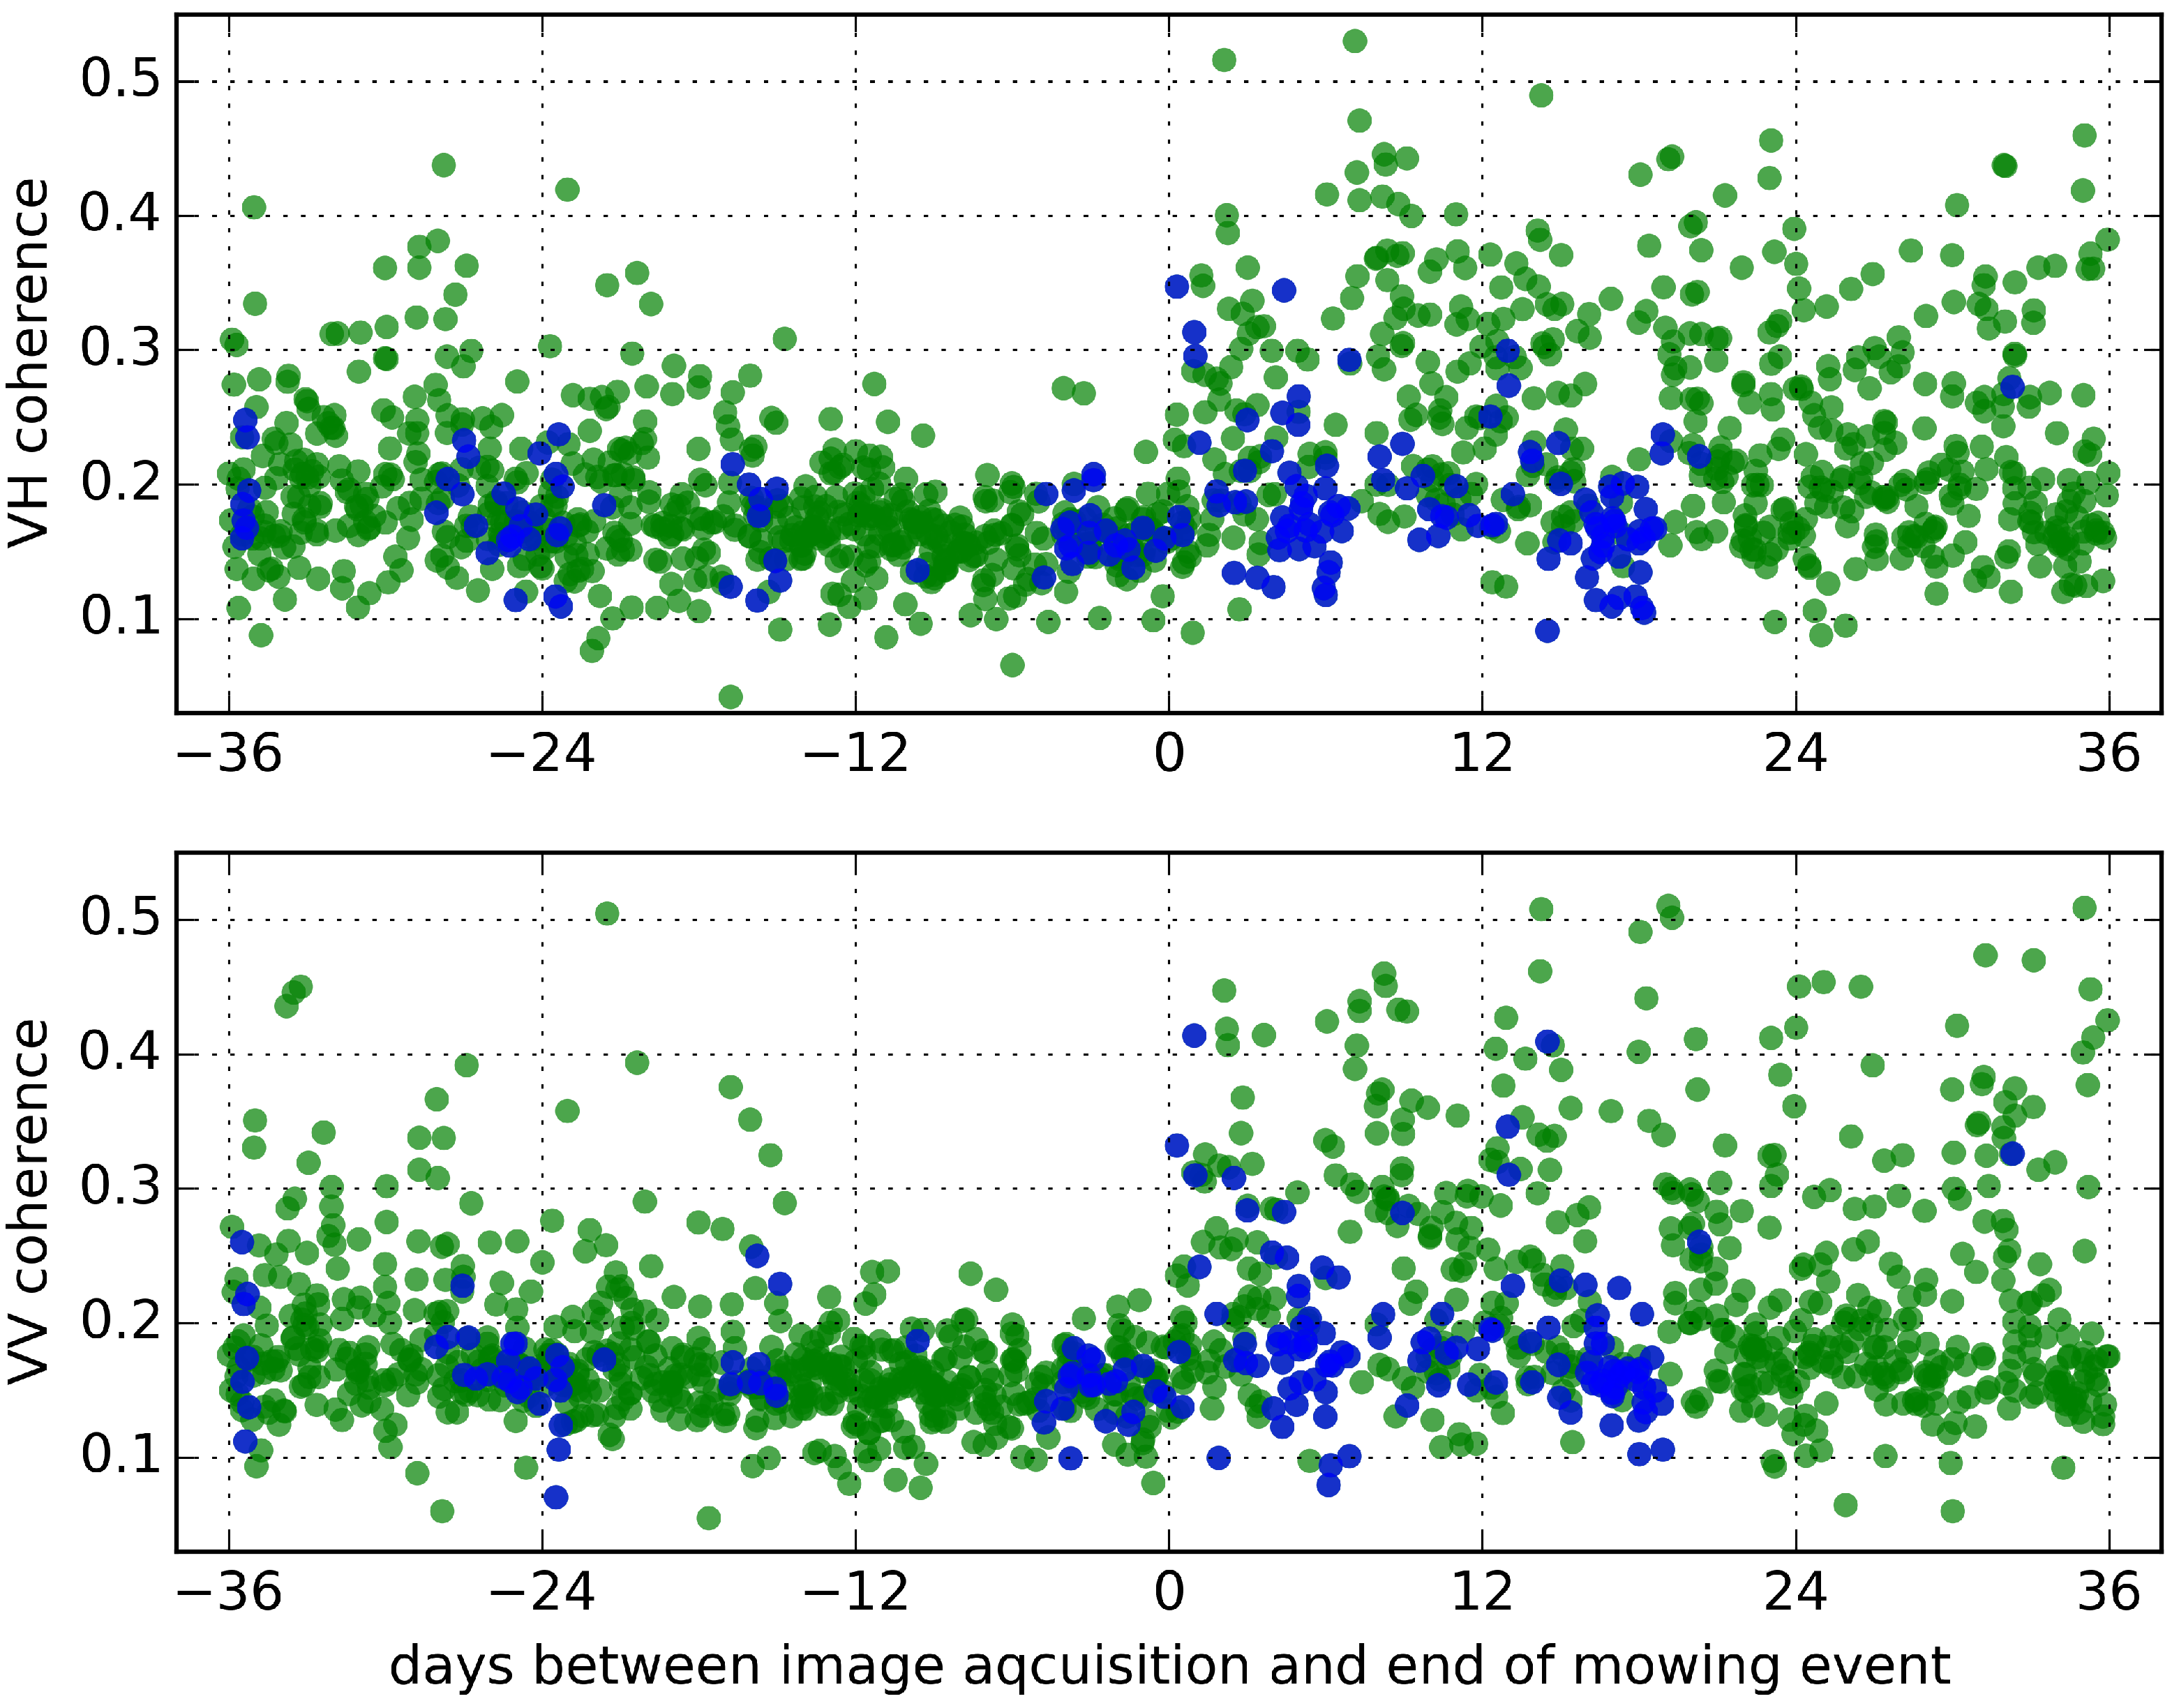
A decreasing trend in coherence values before a mowing event and an increase after it could be observed. These trends are presented in
Figure 7. In the case of rain, the coherence rarely exceeded 0.25. There were no clear gaps in the time separation values, indicating that there were enough samples to investigate the relationship between the coherence and time separation from a mowing event.
The coherence values were divided into six 12-day interval groups based on the time separation to investigate the changes in coherence (
Table 3). Not all of the 12-day repeat-pass acquisitions for R80 and R58 were available, thus twelve time separation groups out of eighteen had coherence measurements for all 77 mowing events. Precipitation filtering based on precipitation values >0.25 mm had the highest influence on the number of samples for R80, where 16% (R160 13%, R58 10%) of the samples were removed.
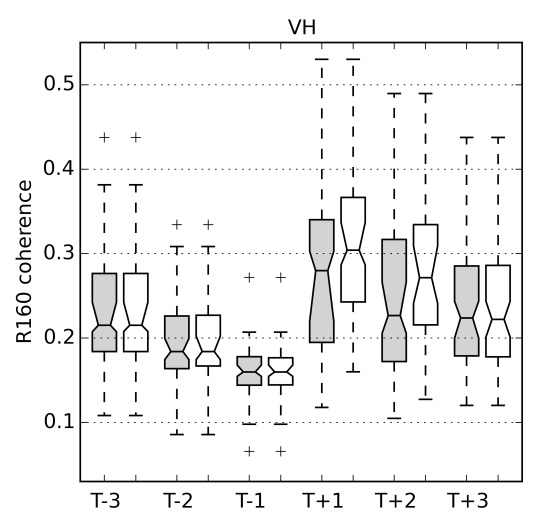
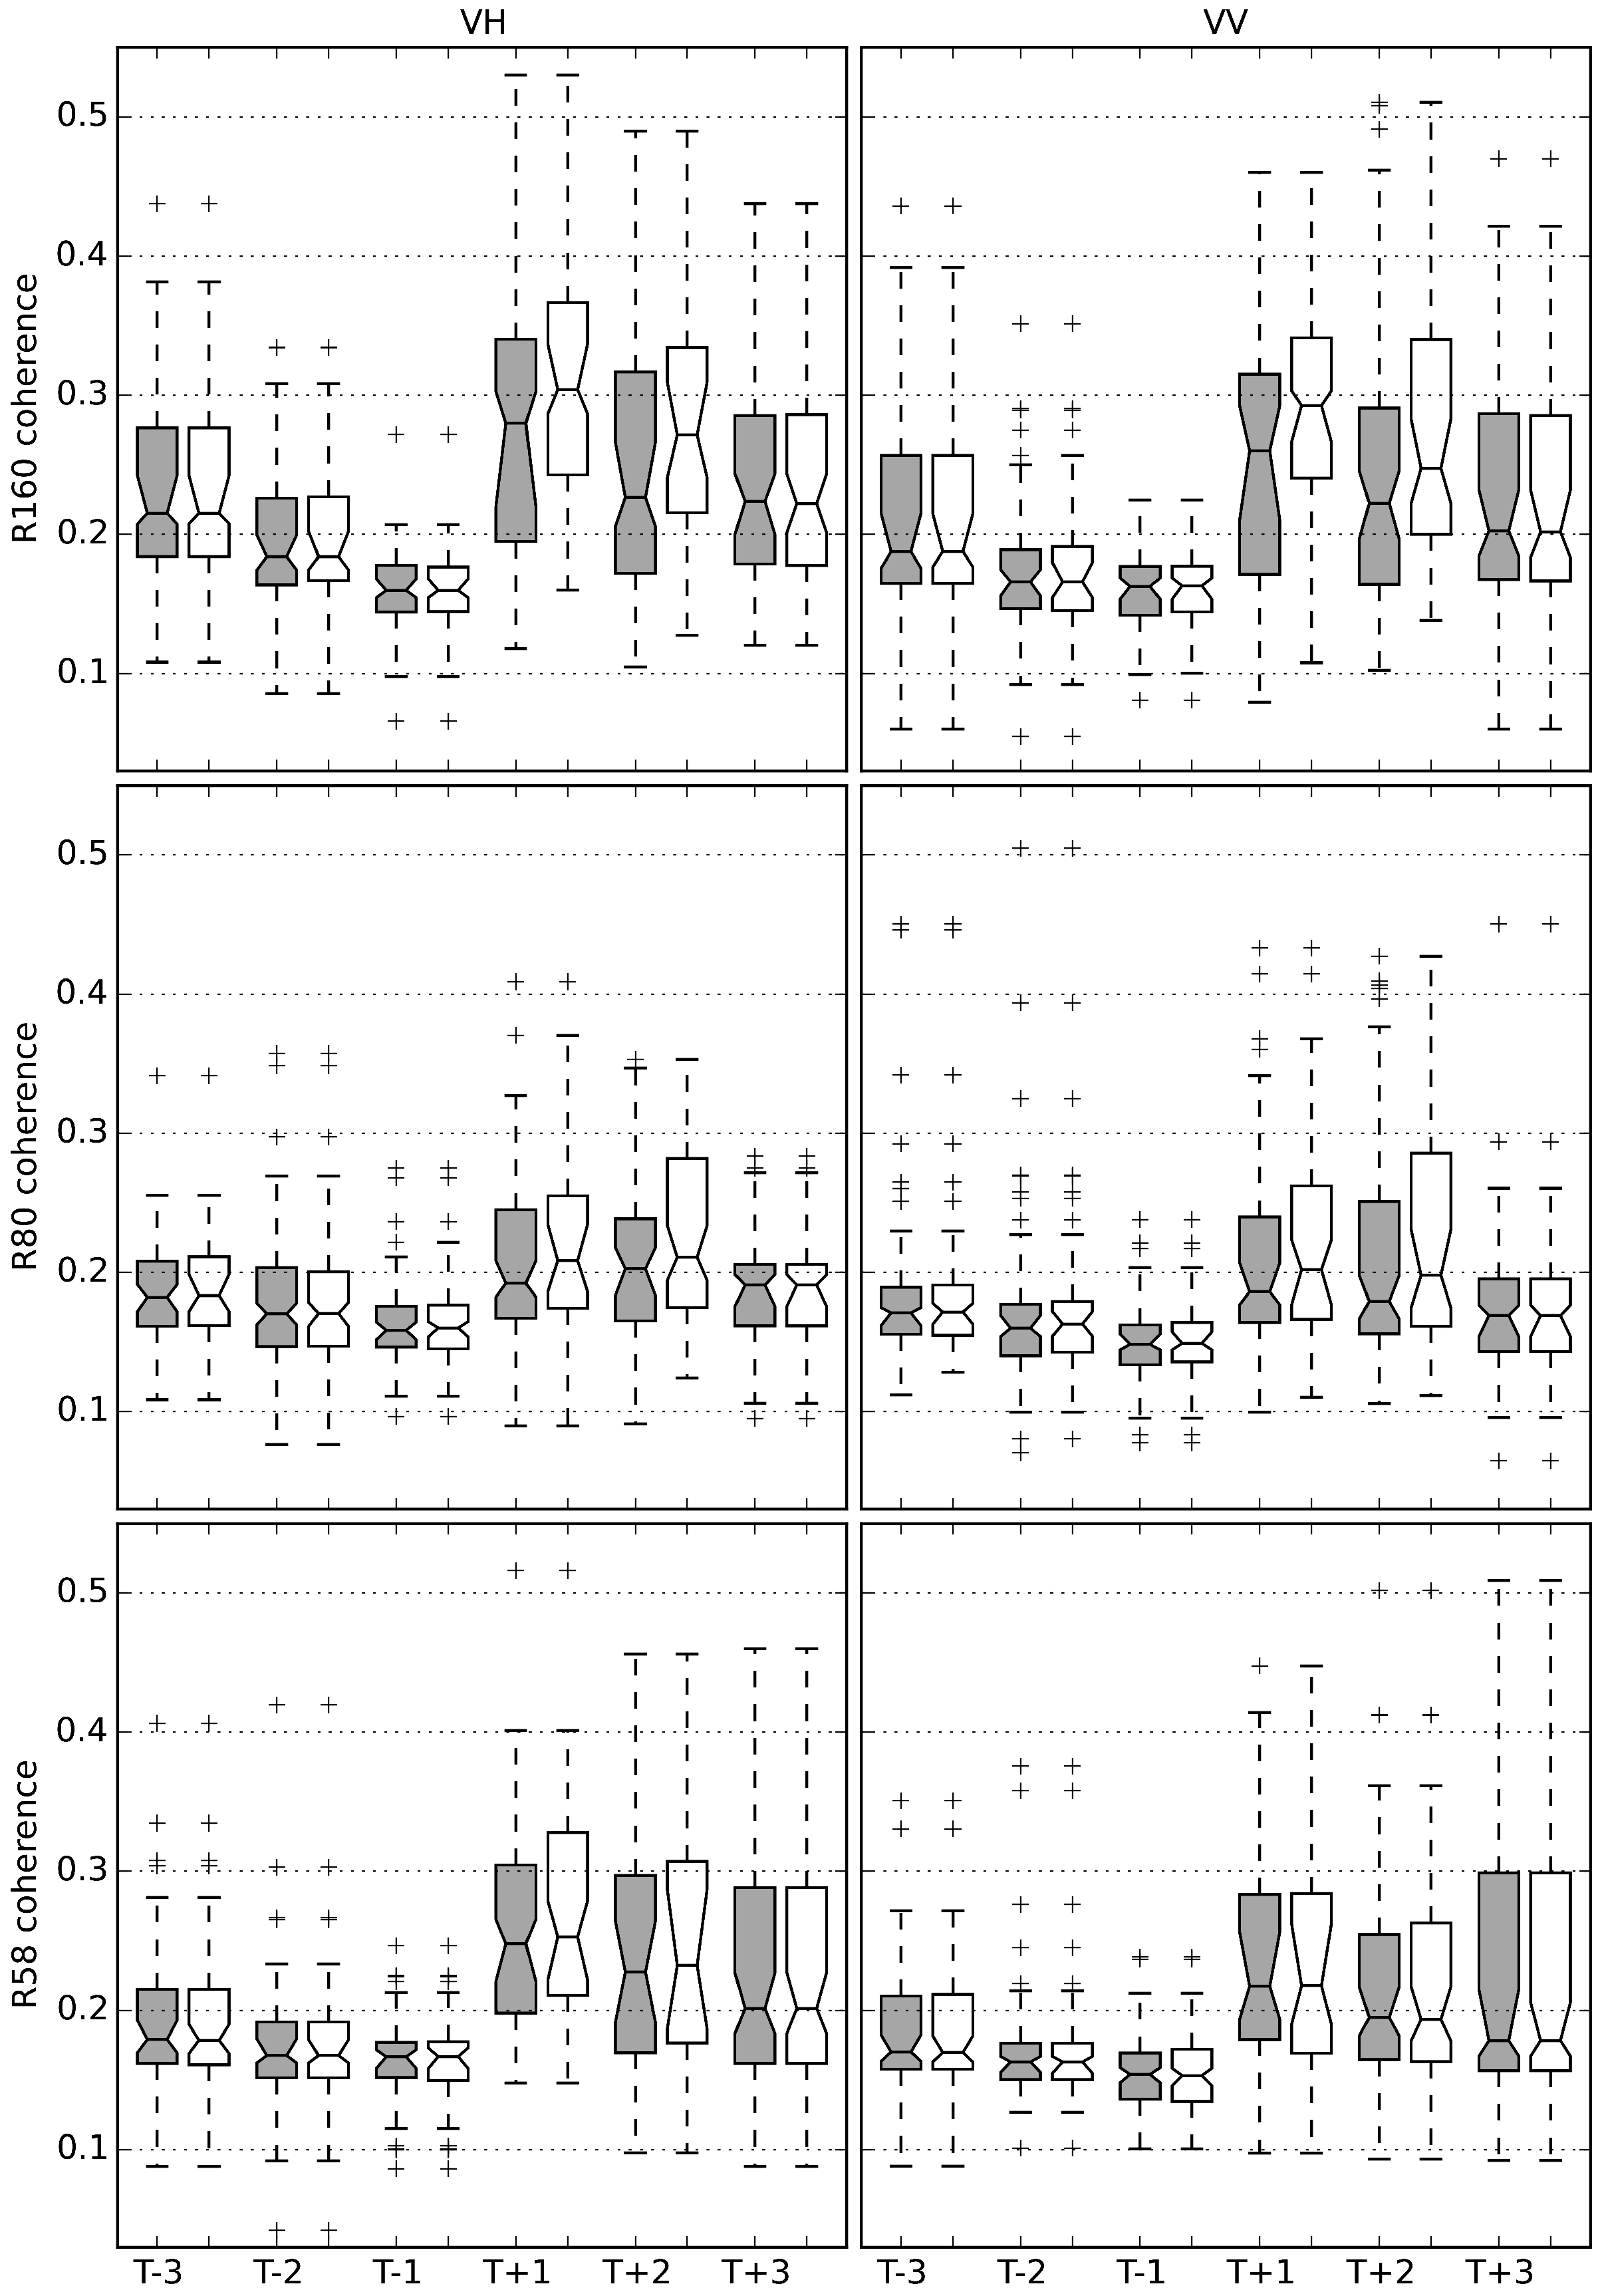
Results show that T
, T
, and T
median
and
values were statistically significantly higher compared to group T
(
Figure 8). The exact median values for the time separation groups and differences between them are given in
Table 4 for VH and in
Table 5 for VV. The mowing event influenced median
and
values significantly, even after 24 to 36 days after the mowing event. The only exception in the data set was the morning acquisition geometry R80
T
group, for which the median was not significantly different from the T
group median. Increase of coherence after a mowing event is in line with a similar previous study that was based on X-band data and 1-day interferometric pairs [
27]. In contrast to that study, the use of C-band in this experiment might have ensured that the coherence values were statistically significantly higher for a period of up to 36 days after an event.
The T group gave the best separation between the mowed and not mowed grasslands. In most cases, the upper quartile of the T group and the lower quartile of the T group did not overlap. The difference in median values for T and T groups was smallest for the R80 morning pass geometry. Even after the mowing, coherence values stayed close to 0.20. This was most probably caused by dew, which can decrease the coherence, as it affects the dielectric constant that shapes the backscattering intensities of grass and also the reflection properties in the vegetation layer, thus influencing the phase. The lowest coherence could be expected when one of the images in the coherence pair was taken in dew conditions and the other in dry conditions. Even when both images were taken in the dew conditions, the spatial distribution of water drops in the vegetation layer was most probably random, leading to low coherence values.
Variation of coherence was lower for T, T, and T groups compared to T, T, and T groups. Temporal decorrelation caused by tall grass decreases coherence values close to the noise floor. On the other hand, the decorrelation caused by the movement of plants was much smaller for shorter grass. In this case, other effects, such as weather conditions and human activities make the coherence much more variable. The medians of groups T and T are not significantly different.
Taking into account R160 and R58 geometries, the average difference between precipitation filtered T
median compared to T
, T
, and T
groups is 0.084 for
and 0.064 for
. Therefore, VH polarisation might have a slightly better ability to detect mowing events. On average, the confidence interval for VH median at the 95% confidence level is 0.035, and for VV median it is 0.031. A similar outcome has been observed in studies focused on the use of SAR backscatter for agricultural monitoring. Hajj et al. [
43] reported that the X-band HV polarisation is more sensitive to grasslands parameters than HH. Additionally, Baghdadi et al. [
16] concluded that the co-pol channels (HH and VV) have a slightly lower potential for the detection of the sugarcane harvest.
Taking into account all three image acquisition geometries, precipitation filtering affected the T
, T
, and T
groups more than the T
, T
, and T
groups. For T
, T
, and T
, the average difference in medians between filtered and unfiltered data was under 0.10%. At the same time, the average difference for T
, T
, and T
groups was 4.9%. High vegetation decorrelates both in dry and wet conditions; thus, the removal of events with precipitation has little effect for T
, T
, and T
groups. The median values of precipitation filtered and unfiltered groups were not statistically significantly different. The influence of precipitation filtering on separation between T
and T
/T
/T
can be evaluated from
Table 4 and
Table 5, where the coherence values after filtering are given in parenthesis.
4. Conclusions
In this paper, 12-day repeat pass Sentinel-1 interferometric coherence calculated for three acquisition geometries was analysed in relation to mowing events recorded on agricultural grasslands in Central Estonia over the vegetative season of 2015. Results showed that after a mowing event, median and values were statistically significantly higher when compared to pre-event values. The group containing coherence measurements from 0 to 12 days after a mowing event gave the best separation between mowed and not mowed grasslands. The coherence was higher even 24 to 36 days after a mowing event when compared to values from not mowed measurements. The increase of coherence for the VH polarisation was higher than for the VV polarisation.
Several factors impeded the increase of coherence after a mowing event. The factors were farming activities, such as sowing or ploughing, height of the cut, rapid growth of grass, and precipitation before image acquisitions. In the future, 6-day pairs consisting of Sentinel-1A and 1B acquisitions should alleviate some of these factors.
However, use of C-band SAR repeat pass interferometric coherence for mowing detection is feasible. The aforementioned factors that introduce ambiguities in event detection could be addressed by including ancillary data in the analysis. Further research should reveal how various farming methods, soil types, soil moisture, relative humidity, strong winds, topography, and grassland species influence the relationship between coherence and mowing. The accuracy of mowing detection using various estimation methods should be analysed. For instance, NPAs could possibly use these findings to optimise the work of validating the mowing requirement set by the European Union CAP. Additionally, the results may be beneficial for a general service for classification of management practises in agricultural areas.


