The authors would like to correct the abstract and Figure 3 and Figure 4 of this article [1] as follows:
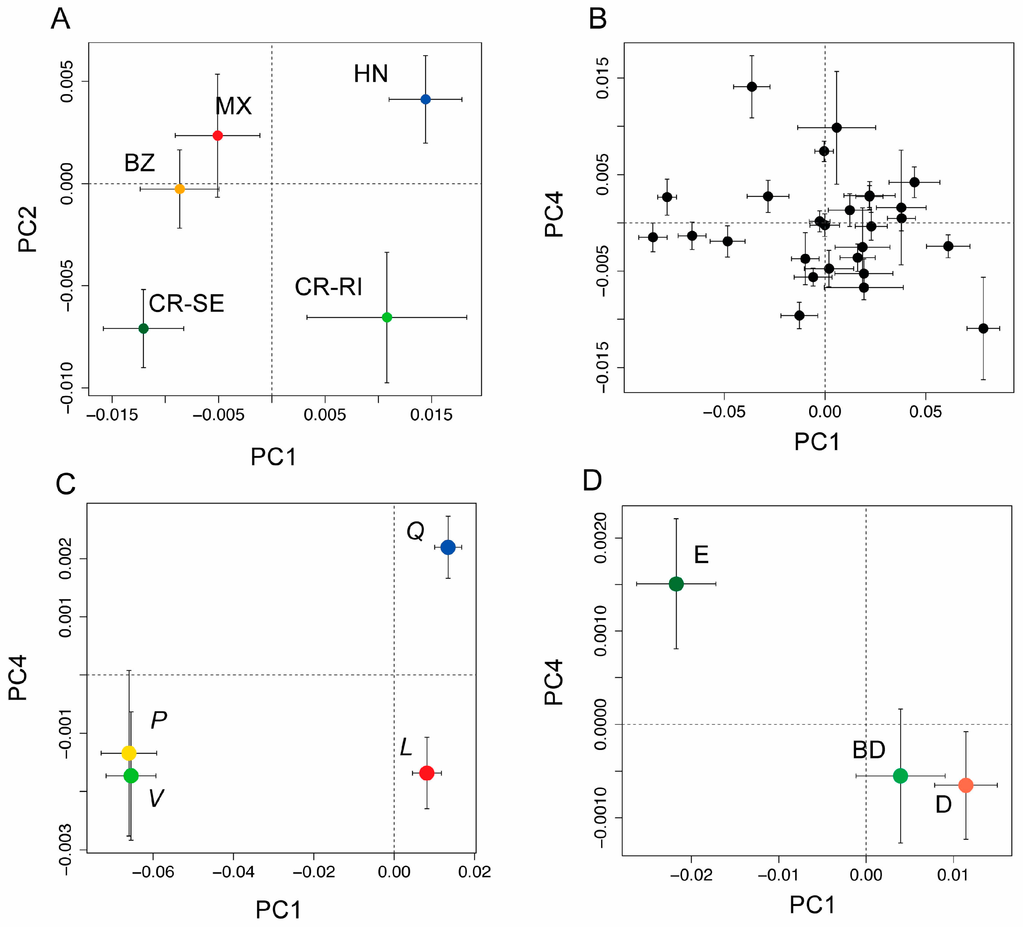
Figure 3.
(A) Bivariate plot of population means (±1 SE) from a principal coordinates (PCO) analysis PCO using leaf spectra from five populations of Quercus oleoides (BZ = Belize, MX = Mexico, HN = Honduras, CR-SE = Costa Rica, Santa Elena, and CR-RI = Costa Rica, Rincon), showing the first and second axes of variation. The first two components were significantly differentiated by population (see Table S2); (B) PCO scores showing population means (±1 SE) for the first and fourth principal components as black circles with 95% CI. These were the first two components that had significant phylogenetic signal (see Table S2); (C) PCO scores for the first and fourth principal components shown for the four higher order clades (live oaks, Virentes (V, green symbol); white oaks, section Quercus (Q, blue symbol), red oaks, section Lobatae (L, red symbol), and golden cup oaks, section Protobalanus (P, gold symbol); (D) PCO scores for leaf type (evergreen (E), deciduous (D) or brevi-deciduous (BD)), showing the first and fourth principle components, the first two components that were significantly differentiated by leaf type (see Table S3).
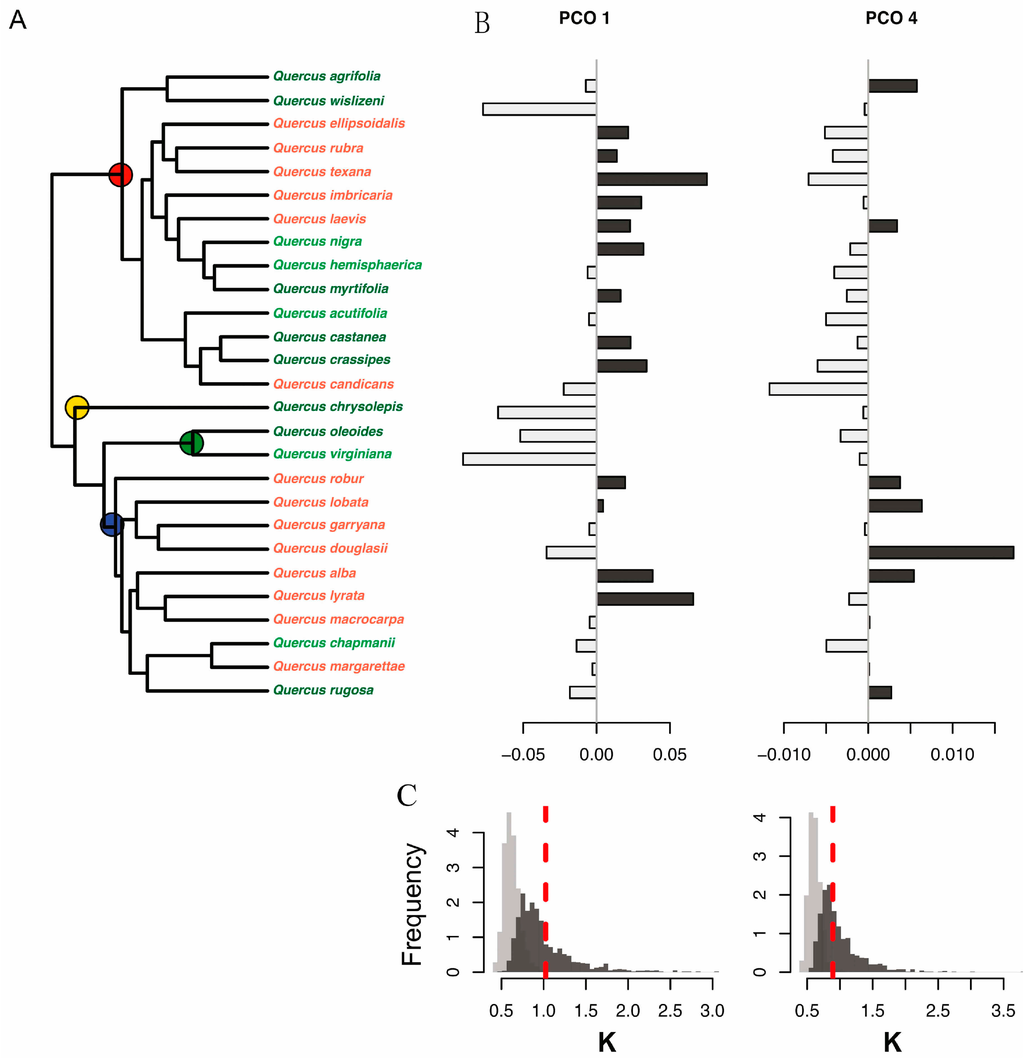
Figure 4.
(A) Molecular phylogeny of 28 oak species showing principal coordinate scores to the right of each species. Leaf habit is indicated by letter codes and coloring of species names, as follows: D = deciduous (red), E = evergreen (dark green), and BD = brevi-deciduous or semi-evergreen (light green). The four recognized higher level clades are indicated with colored circles as follows: red, red oaks (section Lobatae); blue, white oaks (section Quercus); green, live oaks (Virentes); and yellow, golden cup oaks (Protobalanus). Species values for the first and fourth principal coordinate (PCO) axes are shown to the right: (B) PCO1 and PCO4. Positive PCO axis values are shown in dark gray, negative in light gray. Distributions of observed values of Blomberg’s K statistic (red dashed lines) are shown relative to a Brownian motion (BM) model of evolution (dark gray bars) and relative to a white noise model in which phylogenetic relationships are completely randomized (light gray bars) for (C) PCO1 (left) and PCO4 (right) species scores. Observed K values for the PCO1 and PCO4 scores are consistent with a Brownian motion model of evolution and show higher phylogenetic conservatism than expected based on random relationships.
Abstract: Species and phylogenetic lineages have evolved to differ in the way that they acquire and deploy resources, with consequences for their physiological, chemical and structural attributes, many of which can be detected using spectral reflectance from leaves. Recent technological advances for assessing optical properties of plants offer opportunities to detect functional traits of organisms and differentiate levels of biological organization across the tree of life. Here, we connect leaf-level full range spectral data (400–2400 nm) of leaves to the hierarchical organization of plant diversity within the oak genus (Quercus) using field and greenhouse experiments in which environmental factors and plant age are controlled. We show that spectral data significantly differentiate populations within a species and that spectral similarity is significantly associated with phylogenetic similarity among species. We further show that hyperspectral information allows more accurate classification of taxa than spectrally-derived traits, which by definition are of lower dimensionality. Finally, model accuracy increases at higher levels in the hierarchical organization of plant diversity, such that we are able to better distinguish clades than species or populations. This pattern supports an evolutionary explanation for the degree of optical differentiation among plants and demonstrates potential for remote detection of genetic and phylogenetic diversity.
We apologize for any inconvenience caused to the readers by these changes. The manuscript will be updated and the original will remain available on the article webpage.
Reference
- Cavender-Bares, J.; Meireles, J.E.; Couture, J.; Kaproth, M.A.; Kingdon, C.C.; Singh, A.; Serbin, S.P.; Center, A.; Zuniga, E.; Pilz, G.; et al. Associations of leaf spectra with genetic and phylogenetic variation in Oaks: Prospects for remote detection of biodiversity. Remote Sens. 2016, 8, 221. [Google Scholar] [CrossRef]


© 2016 by the author; licensee MDPI, Basel, Switzerland. This article is an open access article distributed under the terms and conditions of the Creative Commons Attribution (CC-BY) license (http://creativecommons.org/licenses/by/4.0/).