2.1. The Theoretical Forward Model for Backscattering from Snowpack
Radar backscattering signals over snow-covered ground at a given incidence angle
can be considered to consist of four components: the surface scattering component from the air–snow interface
, a volume scattering component from snowpack
, the interaction component between snow volume and snow-ground interface
, and the direct ground scattering component
, so that
where
and
is the radar frequency, at polarization
,
is the power transmission coefficient at the air–snow interface (close to unity for dry snow),
is the refraction angle caused by the presence of snow, and
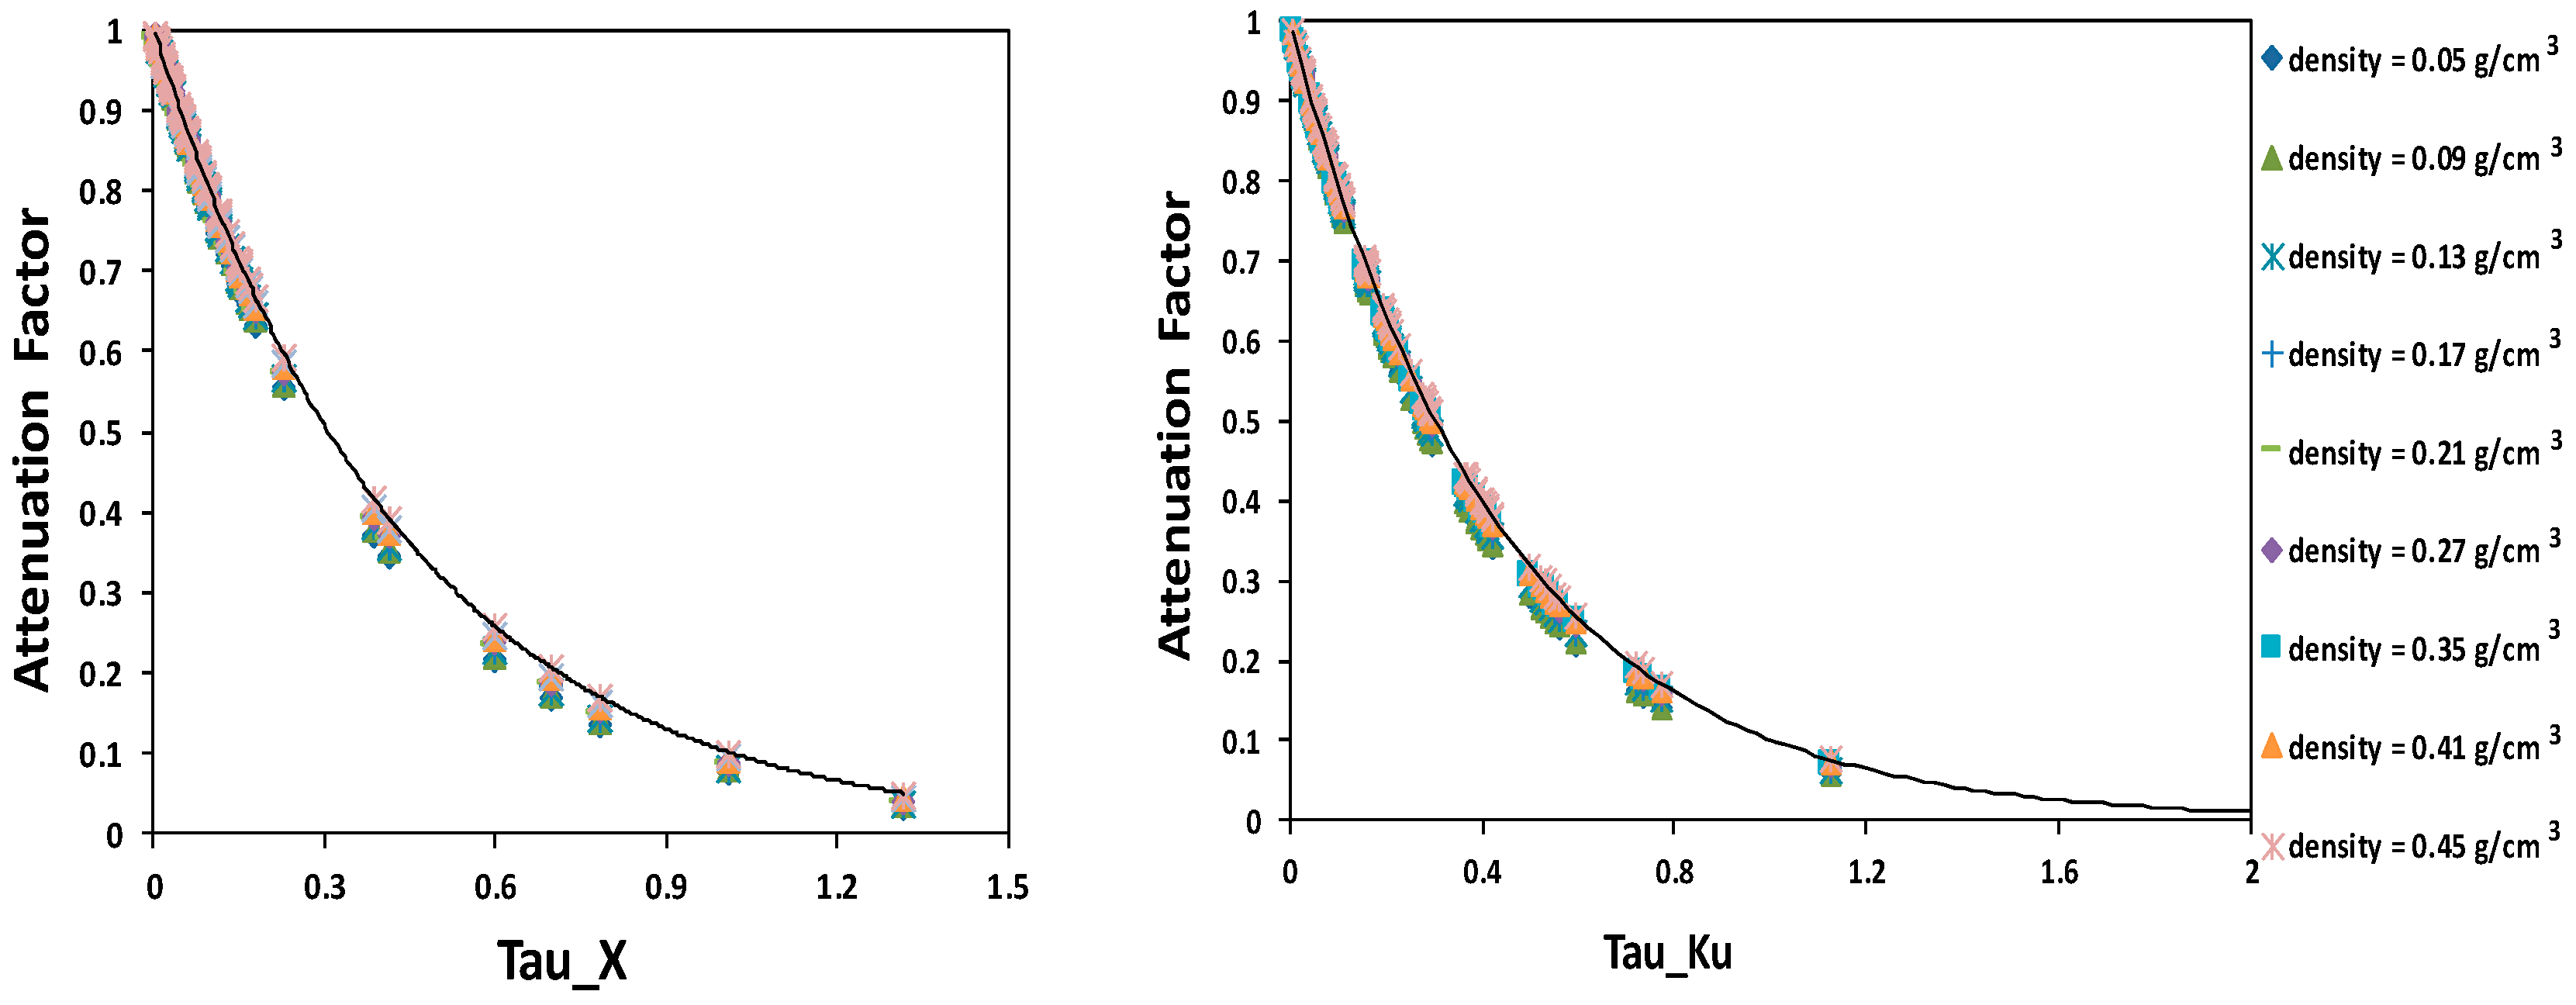
is the snow volume attenuation factor. The optical thickness
is the product of the snow extinction coefficient
and snow depth
. We utilize the bi-continuous-VRT model to simulate the backscattering from snowpack and the AIEM model to simulate the direct ground backscattering component at co-polarizations (VV and HH polarizations) and Oh model [
28] for that at VH polarization.
The bi-continuous-VRT model firstly simulates bi-continuous random structures by the level-cut method, which is more similar to real snow structure. Then, the scattering parameters (scattering coefficient, absorption coefficient, scattering phase matrix, etc.) calculated from the simulated incoherent scattered field are coupled to the radiative transfer equation. The polarimetric backscattering coefficient can then be obtained after solving the radiative transfer model.
For the soil backscattering model, one of the most popular models for soil surface backscattering at co-polarizations is the AIEM, which is more complex than other traditional surface scattering models, such as the Small Perturbation Model, Geometry Optical Model and Physical Optical Model. AIEM is an improved version of the Integral Equation Model (IEM) [
29], which has been verified against experimental
in-situ data [
23,
30]. For simulating the cross-polarization backscattering of bare soil, an empirical Oh model was developed based on polarimetric radar measurements with measured soil surface root mean square height (RMS height), correlation length, and dielectric constant [
28]. Several soil surface parameters (soil surface RMS height, surface correlation length, soil moisture content and auto-correlation function) are needed to do the surface backscattering simulation.
Signals from the air–snow surface can be ignored because for dry snow, these are very small compared with other scattering components at off-nadir incidence [
31]. The snow volume backscattering simulated by the bi-continuous-VRT model also includes the interaction component between snow volume and snow-ground interface. When the power transmission coefficient at the air–snow interface is assumed to be unity, Equation (1) can be expressed as:
Input parameters of the forward model described in Equation (5) include optical grain size, grain size distribution parameter, snow depth, snow density for the snow volume backscatter simulation and soil surface RMS height, soil correlation length, and soil moisture content for the ground surface backscatter simulation. Specifically, the optical grain size
, grain size distribution parameter “
b” and snow density are the input parameters to characterize the snow microstructure in bi-continuous-VRT model [
25]. The optical grain size
is defined as the grain size of identical spheres which have the same specific surface area (SSA) as the bicontinuous medium, which can be analytically derived. The grain size distribution parameter
b is an indicator of grain size distribution. As
b decreases, the clustering effect becomes stronger and aggregation effects are stronger [
32].
In previous theoretical models, most surfaces have been considered to have only one scale of roughness. However, the natural land surface is very complex and usually contains multiple roughness scales. To recognize a scale, the coherence of the backscattered signal over the scale must be retained. For a multiscale rough surface, only a range of roughness scales is effective in generating scattering at a given view angle and a frequency [
33]. Because of this, microwave at centimeter wavelength, may sense only roughness scales smaller or comparable to the wavelength at mid- or large-incident angles [
29]. Thus, considering a frequency range from X to Ku band, we take into account soil surface RMS height values from 0.001 cm to 0.1 cm in the process of backscattering simulation.
Taking all of the above factors into consideration, we generated a simulated database through running the bi-continuous-VRT model: a wide range of snow parameters (snow depth, particle size, volume fraction of ice, particle, and size variation,
etc.) and soil roughness conditions (soil surface RMS height, soil correlation length) are considered; a nominal incident angle of 40° at X and Ku bands is used, considering also the impact of snow density [
34] on incident angle at the snow surface. The ranges and intervals for the model parameters are shown in
Table 1. Considering most of the ground surface under dry snow cover is in the frozen state, soil moisture of ground is assumed to be 0.02 (m
3/m
3), which can be considered as realistic based on
in situ measurements [
32].
2.2. Model Validation with SARALPS-2007 Data
In this section, the theoretical forward backscattering model for snow covered ground described in Equation (5) is demonstrated against the SARALPS-2007 field experimental data from ESA (European Space Agency). Aimed at validation of the backscatter models and the development of snow retrieval algorithms, this experimental campaign collected fully polarimetric backscattering data of snow-covered ground at X and Ku bands (10 GHz and 17 GHz) with a ground-based Synthetic Aperture Radar (GB-SAR), operated with a variety of incident angles (from 30° to 70°). Kűhtai site located in a side valley above the Inn valley about 30 km southwest of Innsbruck is selected for the backscattering model simulation. Meteorological datasets are available from adjacent meteorological stations. A relatively flat meadow was used as the test site. Snow measurements were made at several locations within or close to the GB-SAR footprint. The prevailing snow conditions and GB-SAR data are described for each of the seven campaign days [
27]. However, there are only two observations for dry snow on 17 January and 5 February at Kűhtai/Untere Issalm test site. There was no HH polarization measurement available for 17 January. The detailed descriptions of the field measurements are summarized in
Table 2. Because the backscattering at cross polarization from underground at X and Ku band is underestimated by the Oh model [
28], a scale factor is introduced in the Oh model for cross-polarization backscattering simulation in order to match the cross-polarization backscattering observations of the bare soil under snow cover. We simulate the backscattering at different incident angles (30°, 40°, 50°, 60°) using the integrated theoretical model and compare the simulated results with GB-SAR observations. Soil surface roughness parameters were obtained from laser profiler and a roughness plate measurements; the snow density and snow depth values were obtained from snow pit observations. The performance of the model is assessed by comparison to measured signatures in dry snow conditions.
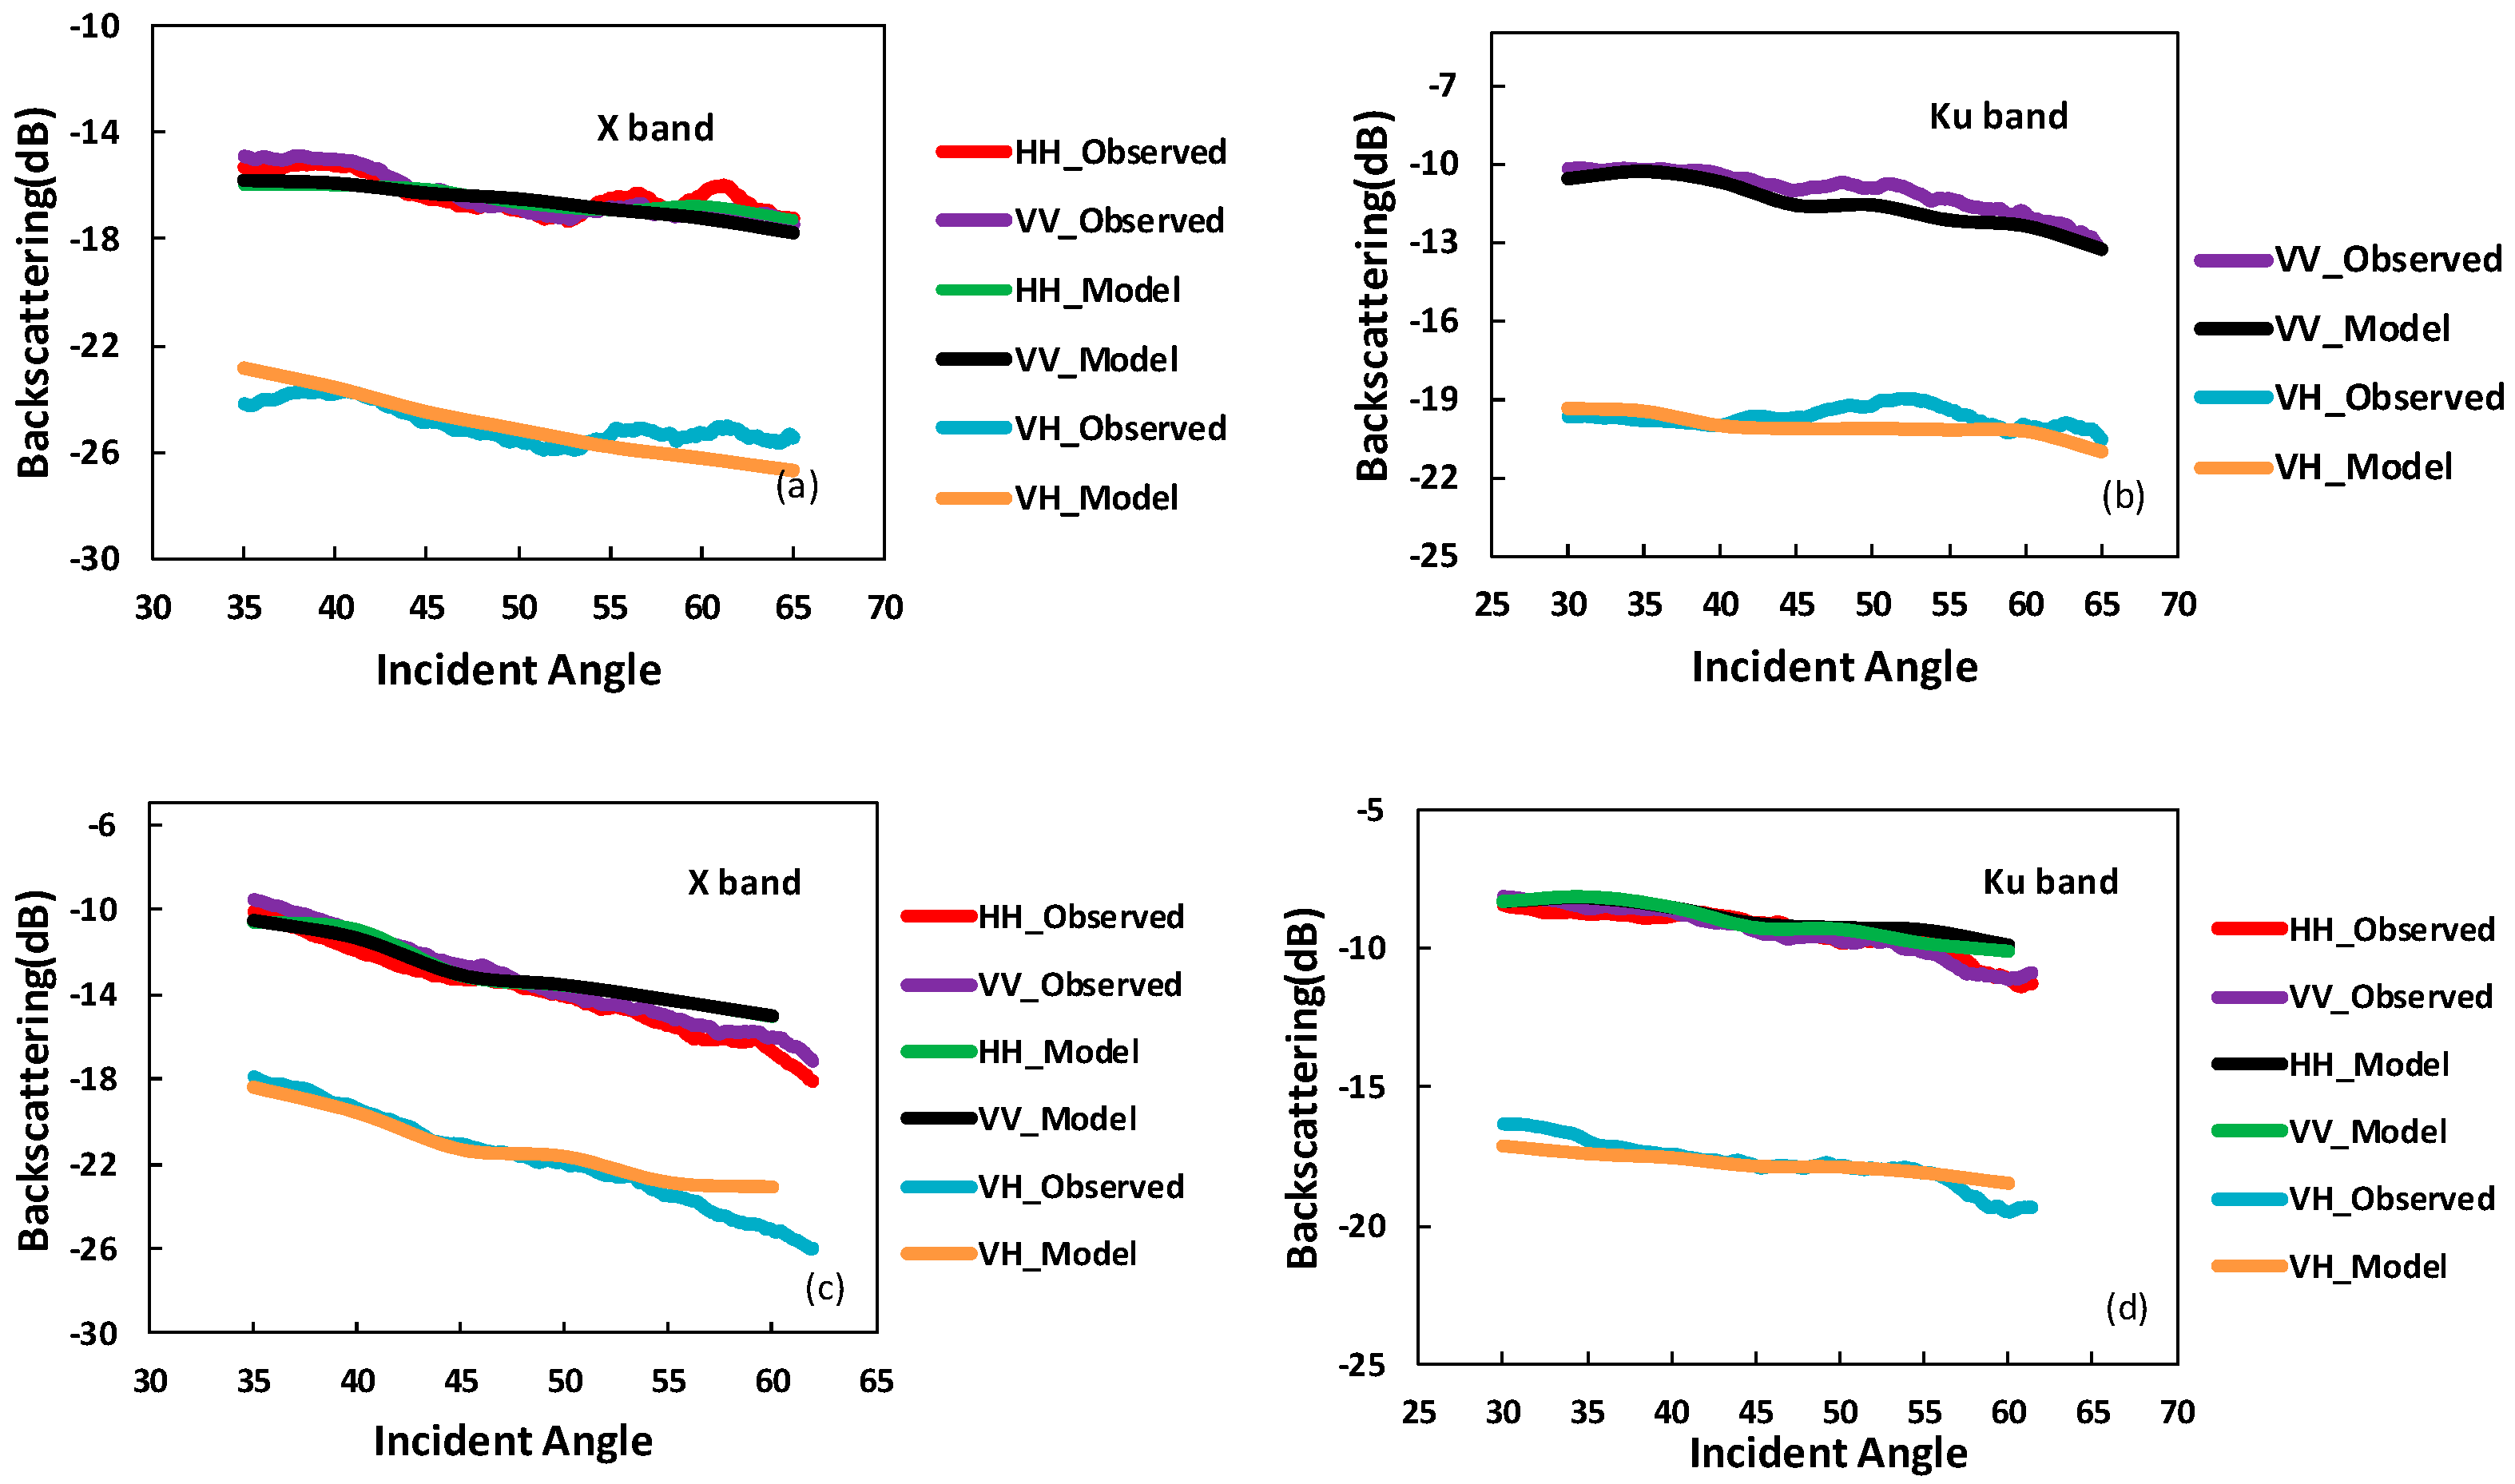
Figure 1 shows the comparison of the GB-SAR data with the model predictions on 17 January and 5 February 2007. For the snow volume backscattering simulation, the optical grain size
was 0.2 mm, the
b parameter was set to be 1.2. For the ground backscattering simulation, the soil RMS height was 0.95 cm, correlation length was 3.8 cm and the volumetric moisture mv was 0.02 m
3/m
3. This result shows reasonably good agreement for co-polarized backscatter at X and Ku bands between the forward model simulations and observations.
Table 3 shows the comparison between simulated backscattering and observed backscattering. R
2 stands for coefficient of determination. RMSE means root mean square error. The model accurately simulates the observed decreasing trend of backscattering with increased incident angles at both two bands.
Figure 1 also shows that the backscattering at Ku band is higher than that at X band.
2.3. Impacts of Grain Size on the Simulated Snowpack Backscattering
Optical grain size of bi-continuous medium here means equal surface-to-volume ratio compared with spheres [
35]. In this part, the simulated scattering properties of the snowpack at X and Ku bands are analyzed, using the created database of simulations (
Table 1). The total scattering at Ku band is dominated by the snow volume scattering, so the effects of snow volume scattering are more significant at Ku band than that at X band up to 7 dB [
36]. Moreover, the larger optical thickness at Ku band leads to a smaller one-way penetration depth (~3–4 m) than that at X band (in the order of 10 m).
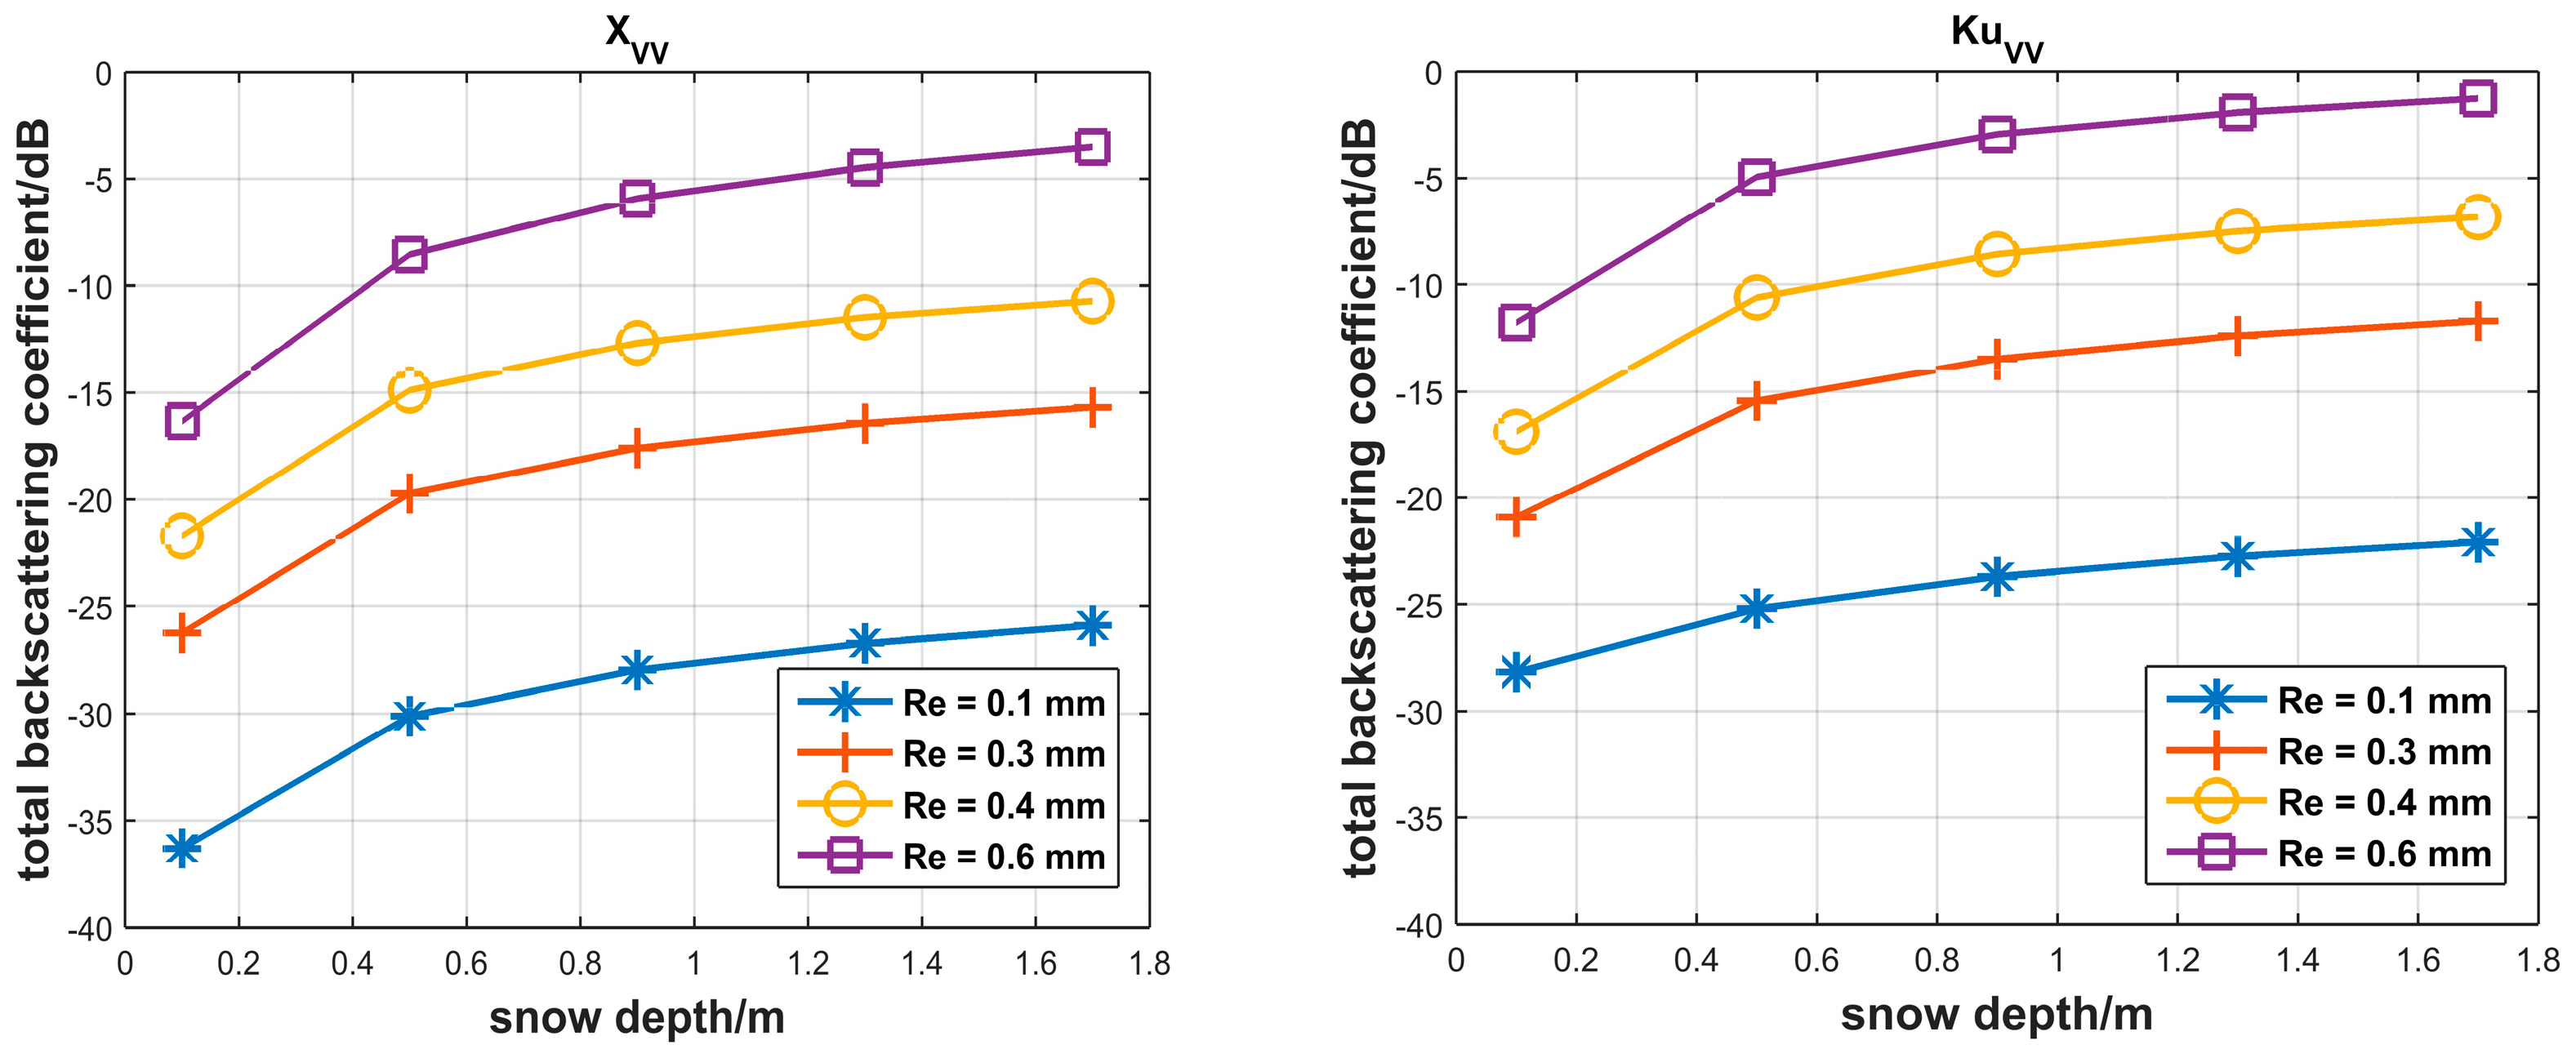
Figure 2 shows VV-polarized signals at Ku and X bands simulated by the bi-continuous-VRT model, varying with snow depth and optical grain size
(corresponding to the radius of snow grains), snow density and small soil moisture.
Figure 2 shows the signals of X and Ku bands at VV polarization both increasing with snow depth. As expected, the simulated signal at Ku band is stronger than that at X band because of the higher sensitivity to snow scattering properties at a higher frequency. This is also consistent with the findings from
Figure 1. The result also shows that optical grain size
has a significant effect on snow backscattering under constant
b parameter of 1.2 as the difference between the simulated signals for the lowest (0.1 mm) and biggest (0.6 mm)
is more than 15 dB at both two bands, while the dynamic range for an increase of 1.5 m is in the order of 10 dB.


 ,
, 


