Next Issue
Volume 9, February
Previous Issue
Volume 8, December
 
 
remotesensing-logo

Journal Browser

Journal Browser

Remote Sens., Volume 9, Issue 1 (January 2017) – 98 articles

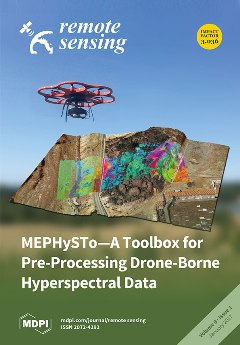
Cover Story (view full-size image): Unmanned Aerial Systems (UAS) or drones feature increasing popularity due to their ability to acquire high quality imagery of hardly accessible areas precisely, fast, and at any time. Equipped with a hyperspectral sensor, UAS are able to deliver characteristic spectral information for each recorded pixel, which may provide indications about type and composition of outcropping material. However, unpredictable movements of the drone as well as complex viewing geometry and illumination of the Earth’s surface require careful geometric and radiometric corrections of the acquired data. These corrections are crucial, especially in geological applications. MEPHySTo is a new dedicated Python-based open-source toolbox for the processing of drone-borne hyperspectral data. The created accurately corrected datasets are specifically designed for the challenges of geological surveys such as mineral exploration and [...] Read more.
  • Issues are regarded as officially published after their release is announced to the table of contents alert mailing list.
  • You may sign up for e-mail alerts to receive table of contents of newly released issues.
  • PDF is the official format for papers published in both, html and pdf forms. To view the papers in pdf format, click on the "PDF Full-text" link, and use the free Adobe Reader to open them.
Order results
Result details
Section
Select all
Export citation of selected articles as:
16 pages, 9913 KiB  
Article
Satellite Based Mapping of Ground PM2.5 Concentration Using Generalized Additive Modeling
by Bin Zou 1,2,*, Jingwen Chen 1, Liang Zhai 3,*, Xin Fang 1 and Zhong Zheng 4
1 School of Geosciences and Info-Physics, Central South University, Changsha 410083, China
2 Key Laboratory of Metallogenic Prediction of Nonferrous Metals and Geological Environment Monitoring, Ministry of Education, School of Geosciences and Info-Physics, Central South University, Changsha 410083, China
3 National Geographic Conditions Monitoring Research Center, Chinese Academy of Surveying and Mapping, Beijing 100830, China
4 College of Resources and Environment, Chengdu University of Information Technology, Chengdu 610225, China
Remote Sens. 2017, 9(1), 1; https://doi.org/10.3390/rs9010001 - 22 Dec 2016
Cited by 82 | Viewed by 8661
Abstract
Satellite-based PM2.5 concentration estimation is growing as a popular solution to map the PM2.5 spatial distribution due to the insufficiency of ground-based monitoring stations. However, those applications usually suffer from the simple hypothesis that the influencing factors are linearly correlated with [...] Read more.
Satellite-based PM2.5 concentration estimation is growing as a popular solution to map the PM2.5 spatial distribution due to the insufficiency of ground-based monitoring stations. However, those applications usually suffer from the simple hypothesis that the influencing factors are linearly correlated with PM2.5 concentrations, though non-linear mechanisms indeed exist in their interactions. Taking the Beijing-Tianjin-Hebei (BTH) region in China as a case, this study developed a generalized additive modeling (GAM) method for satellite-based PM2.5 concentration mapping. In this process, the linear and non-linear relationships between PM2.5 variation and associated contributing factors, such as the aerosol optical depth (AOD), industrial sources, land use type, road network, and meteorological variables, were comprehensively considered. The reliability of the GAM models was validated by comparison with typical linear land use regression (LUR) models. Results show that GAM modeling outperforms LUR modeling at both the annual and seasonal scale, with obvious higher model fitting-based adjusted R2 and lower RMSEs. This is confirmed by the cross-validation-based adjusted R2 with values of GAM-based spring, summer, autumn, winter, and annual models, which are 0.92, 0.78, 0.87, 0.85, and 0.90, respectively, while those of LUR models are 0.87, 0.71, 0.84, 0.84, and 0.85, respectively. Different to the LUR-based hypothesis of the “straight line” relations, the “smoothed curves” from GAM-based apportionment analysis reveals that factors contributing to PM2.5 variation are unstable with the alternate linear and non-linear relations. The GAM model-based PM2.5 concentration surfaces clearly demonstrate their superiority in disclosing the heterogeneous PM2.5 concentrations to the discrete observations. It can be concluded that satellite-based PM2.5 concentration mapping could be greatly improved by GAM modeling given its simultaneous considerations of the linear and non-linear influencing mechanisms of PM2.5. Full article
Show Figures

Graphical abstract

22 pages, 5044 KiB  
Article
Atmospheric Correction Performance of Hyperspectral Airborne Imagery over a Small Eutrophic Lake under Changing Cloud Cover
by Lauri Markelin 1,2,*, Stefan G. H. Simis 1, Peter D. Hunter 3, Evangelos Spyrakos 3, Andrew N. Tyler 3, Daniel Clewley 1 and Steve Groom 1
1 Plymouth Marine Laboratory (PML), Prospect Place, The Hoe, Plymouth PL1 3DH, UK
2 Finnish Geospatial Research Institute (FGI), Geodeetinrinne 2, 02430 Masala, Finland
3 Department of Biological and Environmental Sciences, University of Stirling, Stirling FK9 4LA, UK
Remote Sens. 2017, 9(1), 2; https://doi.org/10.3390/rs9010002 - 23 Dec 2016
Cited by 18 | Viewed by 9486
Abstract
Atmospheric correction of remotely sensed imagery of inland water bodies is essential to interpret water-leaving radiance signals and for the accurate retrieval of water quality variables. Atmospheric correction is particularly challenging over inhomogeneous water bodies surrounded by comparatively bright land surface. We present [...] Read more.
Atmospheric correction of remotely sensed imagery of inland water bodies is essential to interpret water-leaving radiance signals and for the accurate retrieval of water quality variables. Atmospheric correction is particularly challenging over inhomogeneous water bodies surrounded by comparatively bright land surface. We present results of AisaFENIX airborne hyperspectral imagery collected over a small inland water body under changing cloud cover, presenting challenging but common conditions for atmospheric correction. This is the first evaluation of the performance of the FENIX sensor over water bodies. ATCOR4, which is not specifically designed for atmospheric correction over water and does not make any assumptions on water type, was used to obtain atmospherically corrected reflectance values, which were compared to in situ water-leaving reflectance collected at six stations. Three different atmospheric correction strategies in ATCOR4 was tested. The strategy using fully image-derived and spatially varying atmospheric parameters produced a reflectance accuracy of ±0.002, i.e., a difference of less than 15% compared to the in situ reference reflectance. Amplitude and shape of the remotely sensed reflectance spectra were in general accordance with the in situ data. The spectral angle was better than 4.1° for the best cases, in the spectral range of 450–750 nm. The retrieval of chlorophyll-a (Chl-a) concentration using a popular semi-analytical band ratio algorithm for turbid inland waters gave an accuracy of ~16% or 4.4 mg/m3 compared to retrieval of Chl-a from reflectance measured in situ. Using fixed ATCOR4 processing parameters for whole images improved Chl-a retrieval results from ~6 mg/m3 difference to reference to approximately 2 mg/m3. We conclude that the AisaFENIX sensor, in combination with ATCOR4 in image-driven parametrization, can be successfully used for inland water quality observations. This implies that the need for in situ reference measurements is not as strict as has been assumed and a high degree of automation in processing is possible. Full article
(This article belongs to the Special Issue Water Optics and Water Colour Remote Sensing)
Show Figures

Graphical abstract

16 pages, 5507 KiB  
Article
An Integrated GNSS/INS/LiDAR-SLAM Positioning Method for Highly Accurate Forest Stem Mapping
by Chuang Qian 1,2, Hui Liu 1, Jian Tang 1,2,*, Yuwei Chen 2, Harri Kaartinen 2, Antero Kukko 2, Lingli Zhu 2, Xinlian Liang 2, Liang Chen 2 and Juha Hyyppä 2
1 GNSS Research Centre, Wuhan University, No. 129 Luoyu Road, Wuhan 430079, China
2 Centre of Excellence in Laser Scanning Research, Finnish Geospatial Research Institute (FGI), Geodeetinrinne 2, Kirkkonummi FI-02431, Finland
Remote Sens. 2017, 9(1), 3; https://doi.org/10.3390/rs9010003 - 23 Dec 2016
Cited by 122 | Viewed by 15315
Abstract
Forest mapping, one of the main components of performing a forest inventory, is an important driving force in the development of laser scanning. Mobile laser scanning (MLS), in which laser scanners are installed on moving platforms, has been studied as a convenient measurement [...] Read more.
Forest mapping, one of the main components of performing a forest inventory, is an important driving force in the development of laser scanning. Mobile laser scanning (MLS), in which laser scanners are installed on moving platforms, has been studied as a convenient measurement method for forest mapping in the past several years. Positioning and attitude accuracies are important for forest mapping using MLS systems. Inertial Navigation Systems (INSs) and Global Navigation Satellite Systems (GNSSs) are typical and popular positioning and attitude sensors used in MLS systems. In forest environments, because of the loss of signal due to occlusion and severe multipath effects, the positioning accuracy of GNSS is severely degraded, and even that of GNSS/INS decreases considerably. Light Detection and Ranging (LiDAR)-based Simultaneous Localization and Mapping (SLAM) can achieve higher positioning accuracy in environments containing many features and is commonly implemented in GNSS-denied indoor environments. Forests are different from an indoor environment in that the GNSS signal is available to some extent in a forest. Although the positioning accuracy of GNSS/INS is reduced, estimates of heading angle and velocity can maintain high accurate even with fewer satellites. GNSS/INS and the LiDAR-based SLAM technique can be effectively integrated to form a sustainable, highly accurate positioning and mapping solution for use in forests without additional hardware costs. In this study, information such as heading angles and velocities extracted from a GNSS/INS is utilized to improve the positioning accuracy of the SLAM solution, and two information-aided SLAM methods are proposed. First, a heading angle-aided SLAM (H-aided SLAM) method is proposed that supplies the heading angle from GNSS/INS to SLAM. Field test results show that the horizontal positioning accuracy of an entire trajectory of 800 m is 0.13 m and is significantly improved (by 70%) compared to that of a traditional GNSS/INS; second, a more complex information added SLAM solution that utilizes both heading angle and velocity information simultaneously (HV-aided SLAM) is investigated. Experimental results show that the horizontal positioning accuracy can reach a level of six centimetres with the HV-aided SLAM, which is a significant improvement (by 86%). Thus, a more accurate forest map is obtained by the proposed integrated method. Full article
(This article belongs to the Special Issue Multi-Sensor and Multi-Data Integration in Remote Sensing)
Show Figures

Graphical abstract

23 pages, 5834 KiB  
Article
Pyroclastic Flow Deposits and InSAR: Analysis of Long-Term Subsidence at Augustine Volcano, Alaska
by David B. McAlpin 1,*, Franz J. Meyer 1,2, Wenyu Gong 3, James E. Beget 1,4 and Peter W. Webley 1
1 Geophysical Institute, University of Alaska Fairbanks, Fairbanks, AK 99775, USA
2 Alaska Satellite Facility, Fairbanks, AK 99775, USA
3 State Key Laboratory of Earthquake Dynamics, Institute of Geology, China Earthquake Administration, Beijing 100029, China
4 Alaska Volcano Observatory, Fairbanks, AK 99775, USA
Remote Sens. 2017, 9(1), 4; https://doi.org/10.3390/rs9010004 - 24 Dec 2016
Cited by 7 | Viewed by 6977
Abstract
Deformation of pyroclastic flow deposits begins almost immediately after emplacement, and continues thereafter for months or years. This study analyzes the extent, volume, thickness, and variability in pyroclastic flow deposits (PFDs) on Augustine Volcano from measuring their deformation rates with interferometric synthetic aperture [...] Read more.
Deformation of pyroclastic flow deposits begins almost immediately after emplacement, and continues thereafter for months or years. This study analyzes the extent, volume, thickness, and variability in pyroclastic flow deposits (PFDs) on Augustine Volcano from measuring their deformation rates with interferometric synthetic aperture radar (InSAR). To conduct this analysis, we obtained 48 SAR images of Augustine Volcano acquired between 1992 and 2010, spanning its most recent eruption in 2006. The data were processed using d-InSAR time-series analysis to measure the thickness of the Augustine PFDs, as well as their surface deformation behavior. Because much of the 2006 PFDs overlie those from the previous eruption in 1986, geophysical models were derived to decompose deformation contributions from the 1986 deposits underlying the measured 2006 deposits. To accomplish this, we introduce an inversion approach to estimate geophysical parameters for both 1986 and 2006 PFDs. Our analyses estimate the expanded volume of pyroclastic flow material deposited during the 2006 eruption to be 3.3 × 10⁷ m3 ± 0.11 × 10⁷ m3, and that PFDs in the northeastern part of Augustine Island reached a maximum thickness of ~31 m with a mean of ~5 m. Similarly, we estimate the expanded volume of PFDs from the 1986 eruption at 4.6 × 10⁷ m3 ± 0.62 × 10⁷ m3, with a maximum thickness of ~31 m, and a mean of ~7 m. Full article
Show Figures

Graphical abstract

18 pages, 8268 KiB  
Article
Vegetation Dynamics in the Upper Guinean Forest Region of West Africa from 2001 to 2015
by Zhihua Liu *, Michael C. Wimberly and Francis K. Dwomoh
Geospatial Sciences Center of Excellence, South Dakota State University, Brookings, SD 57007, USA
Remote Sens. 2017, 9(1), 5; https://doi.org/10.3390/rs9010005 - 24 Dec 2016
Cited by 26 | Viewed by 10822
Abstract
The Upper Guinea Forest (UGF) region of West Africa is one of the most climatically marginal and human-impacted tropical forest regions in the world. Research on the patterns and drivers of vegetation change is critical for developing strategies to sustain ecosystem services in [...] Read more.
The Upper Guinea Forest (UGF) region of West Africa is one of the most climatically marginal and human-impacted tropical forest regions in the world. Research on the patterns and drivers of vegetation change is critical for developing strategies to sustain ecosystem services in the region and to understand how climate and land use change will affect other tropical forests around the globe. We compared six spectral indices calculated from the 2001–2015 MODIS optical-infrared reflectance data with manually-interpreted measurements of woody vegetation cover from high resolution imagery. The tasseled cap wetness (TCW) index was found to have the strongest association with woody vegetation cover, whereas greenness indices, such as the enhanced vegetation index (EVI), had relatively weak associations with woody cover. Trends in woody vegetation cover measured with the TCW index were analyzed using Mann–Kendall statistics and were contrasted with trends in vegetation greenness measured with EVI. In the drier West Sudanian Savanna and Guinean Forest-Savanna Mosaic ecoregions, EVI trends were primarily positive, and TCW trends were primarily negative, suggesting that woody vegetation cover was decreasing, while herbaceous vegetation cover is increasing. In the wettest tropical forests in the Western Guinean Lowland Forest ecoregion, declining trends in both TCW and EVI were indicative of widespread forest degradation resulting from human activities. Across all ecoregions, declines in woody cover were less prevalent in protected areas where human activities were restricted. Multiple lines of evidence suggested that human land use and resource extraction, rather than climate trends or short-term climatic anomalies, were the predominant drivers of recent vegetation change in the UGF region of West Africa. Full article
Show Figures

Graphical abstract

15 pages, 20256 KiB  
Article
A Method for Estimating the Aerodynamic Roughness Length with NDVI and BRDF Signatures Using Multi-Temporal Proba-V Data
by Mingzhao Yu 1,2, Bingfang Wu 1,*, Nana Yan 1, Qiang Xing 1 and Weiwei Zhu 1
1 Key Laboratory of Digital Earth Science, Institute of Remote Sensing and Digital Earth, Chinese Academy of Sciences, Olympic Village Science Park, W. Beichen Road, Beijing 100101, China
2 College of Resources and Environment, University of Chinese Academy of Sciences, Beijing 100049, China
Remote Sens. 2017, 9(1), 6; https://doi.org/10.3390/rs9010006 - 24 Dec 2016
Cited by 20 | Viewed by 6787
Abstract
Aerodynamic roughness length is an important parameter for surface fluxes estimates. This paper developed an innovative method for estimation of aerodynamic roughness length (z0m) over farmland with a new vegetation index, the Hot-darkspot Vegetation Index (HDVI). To obtain this new index, [...] Read more.
Aerodynamic roughness length is an important parameter for surface fluxes estimates. This paper developed an innovative method for estimation of aerodynamic roughness length (z0m) over farmland with a new vegetation index, the Hot-darkspot Vegetation Index (HDVI). To obtain this new index, the normalized-difference hot-darkspot index (NDHD) is introduced using a semi-empirical, kernel-driven bidirectional reflectance model with multi-temporal Proba-V 300-m top-of-canopy (TOC) reflectance products. A linear relationship between HDVI and z0m was found during the crop growth period. Wind profiles data from two field automatic weather station (AWS) were used to calibrate the model: one site is in Guantao County in Hai Basin, in which double-cropping systems and crop rotations with summer maize and winter wheat are implemented; the other is in the middle reach of the Heihe River Basin from the Heihe Watershed Allied Telemetry Experimental Research (HiWATER) project, with the main crop of spring maize. The iterative algorithm based on Monin–Obukhov similarity theory is employed to calculate the field z0m from time series. Results show that the relationship between HDVI and z0m is more pronounced than that between NDVI and z0m for spring maize at Yingke site, with an R2 value that improved from 0.636 to 0.772. At Guantao site, HDVI also exhibits better performance than NDVI, with R2 increasing from 0.630 to 0.793 for summer maize and from 0.764 to 0.790 for winter wheat. HDVI can capture the impacts of crop residue on z0m, whereas NDVI cannot. Full article
Show Figures

Graphical abstract

18 pages, 9116 KiB  
Article
Can We Go Beyond Burned Area in the Assessment of Global Remote Sensing Products with Fire Patch Metrics?
by Joana M. P. Nogueira 1, Julien Ruffault 1, Emilio Chuvieco 2 and Florent Mouillot 1,*
1 UMR CEFE 5175, Centre National de la Recherche Scientifique, Université de Montpellier, Université Paul-Valéry Montpellier, Ecole Pratique des Hautes Etudes, Institut de Recherche pour le Développement, 1919 route de Mende, 34293 Montpellier Cedex 5, France
2 Environmental Remote Sensing Research Group, Department of Geology, Geography and the Environment, University of Alcalá, C/Colegios 2, 28801 Alcalá de Henares, Spain
Remote Sens. 2017, 9(1), 7; https://doi.org/10.3390/rs9010007 - 25 Dec 2016
Cited by 39 | Viewed by 9173
Abstract
Global burned area (BA) datasets from satellite Earth observations provide information for carbon emission and for Dynamic Global Vegetation Model (DGVM) benchmarking. Fire patch identification from pixel-level information recently emerged as an additional way of providing informative features about fire regimes through the [...] Read more.
Global burned area (BA) datasets from satellite Earth observations provide information for carbon emission and for Dynamic Global Vegetation Model (DGVM) benchmarking. Fire patch identification from pixel-level information recently emerged as an additional way of providing informative features about fire regimes through the analysis of patch size distribution. We evaluated the ability of global BA products to accurately represent morphological features of fire patches, in the fire-prone Brazilian savannas. We used the pixel-level burned area from LANDSAT images, as well as two global products: MODIS MCD45A1 and the European Space Agency (ESA) fire Climate Change Initiative (FIRE_CCI) product for the 2002–2009 time period. Individual fire patches were compared by linear regressions to test the consistency of global products as a source of burned patch shape information. Despite commission and omission errors respectively reaching 0.74 and 0.81 for ESA FIRE_CCI and 0.64 and 0.62 for MCD45A1 when compared to LANDSAT due to missing small fires, correlations between patch areas showed R2 > 0.6 for all comparisons, with a slope of 0.99 between ESA FIRE_CCI and MCD45A1 but a lower slope (0.6–0.8) when compared to the LANDSAT data. Shape complexity between global products was less correlated (R2 = 0.5) with lower values (R2 = 0.2) between global products and LANDSAT data, due to their coarser resolution. For the morphological features of the ellipse fitted over fire patches, R2 reached 0.6 for the ellipse’s eccentricity and varied from 0.4 to 0.8 for its azimuthal directional angle. We conclude that global BA products underestimate total BA as they miss small fires, but they also underestimate burned patch areas. Patch complexity is the least correlated variable, but ellipse features appear to provide information to be further used for quality product assessment, global pyrogeography or DGVM benchmarking. Full article
Show Figures

Graphical abstract

20 pages, 2872 KiB  
Article
Measuring Leaf Water Content with Dual-Wavelength Intensity Data from Terrestrial Laser Scanners
by Samuli Junttila 1,2,*, Mikko Vastaranta 1,2, Xinlian Liang 2,3, Harri Kaartinen 2,3, Antero Kukko 2,3, Sanna Kaasalainen 4, Markus Holopainen 1,2, Hannu Hyyppä 2,5 and Juha Hyyppä 2,3
1 Department of Forest Sciences, University of Helsinki, Helsinki 00014, Finland
2 Centre of Excellence in Laser Scanning Research, Finnish Geospatial Research Institute FGI, Masala 02431, Finland
3 Department of Remote Sensing and Photogrammetry, Finnish Geospatial Research Institute FGI, Masala 02431, Finland
4 Department of Navigation and Positioning, Finnish Geospatial Research Institute FGI, Masala 02431, Finland
5 Department of Built Environment, Aalto University, P.O. Box 15800, Aalto 00076, Finland
Remote Sens. 2017, 9(1), 8; https://doi.org/10.3390/rs9010008 - 25 Dec 2016
Cited by 33 | Viewed by 10689
Abstract
Decreased leaf moisture content, typically measured as equivalent water thickness (EWT), is an early signal of tree stress caused by drought, disease, or pest insects. We investigated the use of two terrestrial laser scanners (TLSs) employing different wavelengths for improving the understanding how [...] Read more.
Decreased leaf moisture content, typically measured as equivalent water thickness (EWT), is an early signal of tree stress caused by drought, disease, or pest insects. We investigated the use of two terrestrial laser scanners (TLSs) employing different wavelengths for improving the understanding how EWT can be retrieved in a laboratory setting. Two wavelengths were examined for normalizing the effects of varying leaf structure and geometry on the measured intensity. The relationship between laser intensity features, using red (690 nm) and shortwave infrared (1550 nm) wavelengths, and the EWT of individual leaves or groups of needles were determined with and without intensity corrections. To account for wrinkles and curvatures of the leaves and needles, a model describing the relationship between incidence angle and backscattered intensity was applied. Additionally, a reflectance model describing both diffuse and specular reflectance was employed to remove the fraction of specular reflectance from backscattered intensity. A strong correlation (, RMSE = 0.004 g/cm2) was found between a normalized ratio of the two wavelengths and the measured EWT of samples. The applied intensity correction methods did not significantly improve the results of the study. The backscattered intensity responded to changes in EWT but more investigations are needed to test the suitability of TLSs to retrieve EWT in a forest environment. Full article
Show Figures

Graphical abstract

17 pages, 2639 KiB  
Article
Detecting Tree Stems from Volumetric TLS Data in Forest Environments with Rich Understory
by Johannes Heinzel * and Markus O. Huber
Swiss Federal Institute for Forest, Snow and Landscape Research WSL, Zürcherstraße 111, 8903 Birmensdorf, Switzerland
Remote Sens. 2017, 9(1), 9; https://doi.org/10.3390/rs9010009 - 28 Dec 2016
Cited by 64 | Viewed by 6948
Abstract
The present study introduces a method to identify tree stems from terrestrial laser scanning (TLS) data. We focused on forest environments of diverse and layered structure, which were technically characterized by strong occlusion effects with regards to laser scanning. The number and distribution [...] Read more.
The present study introduces a method to identify tree stems from terrestrial laser scanning (TLS) data. We focused on forest environments of diverse and layered structure, which were technically characterized by strong occlusion effects with regards to laser scanning. The number and distribution of tree stems are important information for the management of protective forests against natural hazards, for forest inventory, and for ecological studies. Our approach builds upon a three-dimensional (3D) voxel grid transformation of the original point cloud data, followed by two major steps of processing. Firstly, a series of morphological operations removed leaves and branches and left only potential stem segments. Secondly, the stem segments of each tree were combined by a multipart workflow, which uses shape and neighborhood criteria. At the same time, erroneous fragments and noise were removed from the dataset. As a result, each object in the voxel grid was represented by a single connected component referring to one specific tree stem. Testing the method on nine spatially independent plots provided detection rates of 97% for the number and location of stems from mature trees with a diameter >= 12 cm and 84% for smaller trees with a minimum of 130 cm total tree height. In summary, we obtained a dataset covering the number and locations of the stems from both mature and understory trees, while not aiming at a precise reconstruction of the stem shape. Full article
Show Figures

Figure 1

21 pages, 4657 KiB  
Article
Multi-Task Joint Sparse and Low-Rank Representation for the Scene Classification of High-Resolution Remote Sensing Image
by Kunlun Qi 1,2, Wenxuan Liu 3,4, Chao Yang 1,2, Qingfeng Guan 1,2,* and Huayi Wu 3,4
1 National Engineering Research Center of Geographic Information System, China University of Geosciences (Wuhan), Wuhan 430074, China
2 Faculty of Information Engineering, China University of Geosciences (Wuhan), Wuhan 430074, China
3 State Key Laboratory for Information Engineering in Surveying, Mapping and Remote Sensing (LIESMARS), Wuhan 430079, China
4 Collaborative Innovation Center of Geospatial Technology, Wuhan University, Wuhan 430079, China
Remote Sens. 2017, 9(1), 10; https://doi.org/10.3390/rs9010010 - 27 Dec 2016
Cited by 23 | Viewed by 5898
Abstract
Scene classification plays an important role in the intelligent processing of High-Resolution Satellite (HRS) remotely sensed images. In HRS image classification, multiple features, e.g., shape, color, and texture features, are employed to represent scenes from different perspectives. Accordingly, effective integration of multiple features [...] Read more.
Scene classification plays an important role in the intelligent processing of High-Resolution Satellite (HRS) remotely sensed images. In HRS image classification, multiple features, e.g., shape, color, and texture features, are employed to represent scenes from different perspectives. Accordingly, effective integration of multiple features always results in better performance compared to methods based on a single feature in the interpretation of HRS images. In this paper, we introduce a multi-task joint sparse and low-rank representation model to combine the strength of multiple features for HRS image interpretation. Specifically, a multi-task learning formulation is applied to simultaneously consider sparse and low-rank structures across multiple tasks. The proposed model is optimized as a non-smooth convex optimization problem using an accelerated proximal gradient method. Experiments on two public scene classification datasets demonstrate that the proposed method achieves remarkable performance and improves upon the state-of-art methods in respective applications. Full article
Show Figures

Figure 1

12 pages, 2874 KiB  
Article
Estimating the Biomass of Maize with Hyperspectral and LiDAR Data
by Cheng Wang 1,2, Sheng Nie 2,3,*, Xiaohuan Xi 2, Shezhou Luo 2 and Xiaofeng Sun 3
1 Beijing Advanced Innovation Center for Imaging Technology, Capital Normal University, Beijing 100094, China
2 Key Laboratory of Digital Earth Science, Institute of Remote Sensing and Digital Earth, Chinese Academy of Sciences, Beijing 100094, China
3 University of Chinese Academy of Sciences, Beijing 100049, China
Remote Sens. 2017, 9(1), 11; https://doi.org/10.3390/rs9010011 - 27 Dec 2016
Cited by 93 | Viewed by 9328
Abstract
The accurate estimation of crop biomass during the growing season is very important for crop growth monitoring and yield estimation. The objective of this paper was to explore the potential of hyperspectral and light detection and ranging (LiDAR) data for better estimation of [...] Read more.
The accurate estimation of crop biomass during the growing season is very important for crop growth monitoring and yield estimation. The objective of this paper was to explore the potential of hyperspectral and light detection and ranging (LiDAR) data for better estimation of the biomass of maize. First, we investigated the relationship between field-observed biomass with each metric, including vegetation indices (VIs) derived from hyperspectral data and LiDAR-derived metrics. Second, the partial least squares (PLS) regression was used to estimate the biomass of maize using VIs (only) and LiDAR-derived metrics (only), respectively. Third, the fusion of hyperspectral and LiDAR data was evaluated in estimating the biomass of maize. Finally, the biomass estimates were validated by a leave-one-out cross-validation (LOOCV) method. Results indicated that all VIs showed weak correlation with field-observed biomass and the highest correlation occurred when using the red edge-modified simple ratio index (ReMSR). Among all LiDAR-derived metrics, the strongest relationship was observed between coefficient of variation (H C V of digital terrain model (DTM) normalized point elevations with field-observed biomass. The combination of VIs through PLS regression could not improve the biomass estimation accuracy of maize due to the high correlation between VIs. In contrast, the H C V combined with H m e a n performed better than one LiDAR-derived metric alone in biomass estimation (R2 = 0.835, RMSE = 374.655 g/m2, RMSECV = 393.573 g/m2). Additionally, our findings indicated that the fusion of hyperspectral and LiDAR data can provide better biomass estimates of maize (R2 = 0.883, RMSE = 321.092 g/m2, RMSECV = 337.653 g/m2) compared with LiDAR or hyperspectral data alone. Full article
(This article belongs to the Special Issue Fusion of LiDAR Point Clouds and Optical Images)
Show Figures

Graphical abstract

20 pages, 4489 KiB  
Technical Note
Gap-Filling of Landsat 7 Imagery Using the Direct Sampling Method
by Gaohong Yin 1,*, Gregoire Mariethoz 2 and Matthew F. McCabe 1
1 Water Desalination and Reuse Center, Division of Biological and Environmental Sciences and Engineering, King Abdullah University of Science and Technology, Thuwal 23955, Saudi Arabia
2 Institute of Earth Surface Dynamics, University of Lausanne, Lausanne 1015, Switzerland
Remote Sens. 2017, 9(1), 12; https://doi.org/10.3390/rs9010012 - 27 Dec 2016
Cited by 83 | Viewed by 9696
Abstract
The failure of the Scan Line Corrector (SLC) on Landsat 7 imposed systematic data gaps on retrieved imagery and removed the capacity to provide spatially continuous fields. While a number of methods have been developed to fill these gaps, most of the proposed [...] Read more.
The failure of the Scan Line Corrector (SLC) on Landsat 7 imposed systematic data gaps on retrieved imagery and removed the capacity to provide spatially continuous fields. While a number of methods have been developed to fill these gaps, most of the proposed techniques are only applicable over relatively homogeneous areas. When they are applied to heterogeneous landscapes, retrieving image features and elements can become challenging. Here we present a gap-filling approach that is based on the adoption of the Direct Sampling multiple-point geostatistical method. The method employs a conditional stochastic resampling of known areas in a training image to simulate unknown locations. The approach is assessed across a range of both homogeneous and heterogeneous regions. Simulation results show that for homogeneous areas, satisfactory results can be obtained by simply adopting non-gap locations in the target image as baseline training data. For heterogeneous landscapes, bivariate simulations using an auxiliary variable acquired at a different date provides more accurate results than univariate simulations, especially as land cover complexity increases. Apart from recovering spatially continuous fields, one of the key advantages of the Direct Sampling is the relatively straightforward implementation process that relies on relatively few parameters. Full article
Show Figures

Graphical abstract

16 pages, 3684 KiB  
Article
A Prior Knowledge-Based Method to Derivate High-Resolution Leaf Area Index Maps with Limited Field Measurements
by Yuechan Shi 1,2, Jindi Wang 1,2,*, Jian Wang 1,2 and Yonghua Qu 1,2
1 State Key Laboratory of Remote Sensing Science, Research Center for Remote Sensing and GIS, School of Geography, Beijing Normal University, Beijing 100875, China
2 Beijing Key Laboratory for Remote Sensing of Environment and Digital Cities, Beijing Normal University, Beijing 100875, China
Remote Sens. 2017, 9(1), 13; https://doi.org/10.3390/rs9010013 - 27 Dec 2016
Cited by 11 | Viewed by 5284
Abstract
High-resolution leaf area index (LAI) maps from remote sensing data largely depend on empirical models, which link field LAI measurements to the vegetation index. The existing empirical methods often require the field measurements to be sufficient for constructing a reliable model. However, in [...] Read more.
High-resolution leaf area index (LAI) maps from remote sensing data largely depend on empirical models, which link field LAI measurements to the vegetation index. The existing empirical methods often require the field measurements to be sufficient for constructing a reliable model. However, in many regions of the world, there are limited field measurements available. This paper presents a prior knowledge-based (PKB) method to derivate LAI with limited field measurements, in an effort to improve the accuracy of empirical model. Based on the assumption that the experimental sites with the same vegetation type can be represented by similar models, a priori knowledge for crops was extracted from the published models in various cropland sites. The knowledge, composed of an initial guess of each model parameter with the associated uncertainty, was then combined with the local field measurements to determine a semi-empirical model using the Bayesian inversion method. The proposed method was evaluated at a cropland site in the Huailai region of Hebei Province, China. Compared with the regression method, the proposed PKB method can effectively improve the accuracy of empirical model and LAI estimation, when the field measurements were limited. The results demonstrate that a priori knowledge extracted from the universal sites can provide important auxiliary information to improve the representativeness of the empirical model in a given study area. Full article
Show Figures

Graphical abstract

23 pages, 13953 KiB  
Article
Automated Reconstruction of Building LoDs from Airborne LiDAR Point Clouds Using an Improved Morphological Scale Space
by Bisheng Yang 1,*, Ronggang Huang 1,*, Jianping Li 1, Mao Tian 1, Wenxia Dai 1 and Ruofei Zhong 2
1 State Key Laboratory of Information Engineering in Surveying, Mapping and Remote Sensing, Wuhan University, Wuhan 430079, China
2 Beijing Advanced Innovation Center for Imaging Technology, Capital Normal University, Beijing 100048, China
Remote Sens. 2017, 9(1), 14; https://doi.org/10.3390/rs9010014 - 27 Dec 2016
Cited by 59 | Viewed by 7652
Abstract
Reconstructing building models at different levels of detail (LoDs) from airborne laser scanning point clouds is urgently needed for wide application as this method can balance between the user’s requirements and economic costs. The previous methods reconstruct building LoDs from the finest 3D [...] Read more.
Reconstructing building models at different levels of detail (LoDs) from airborne laser scanning point clouds is urgently needed for wide application as this method can balance between the user’s requirements and economic costs. The previous methods reconstruct building LoDs from the finest 3D building models rather than from point clouds, resulting in heavy costs and inflexible adaptivity. The scale space is a sound theory for multi-scale representation of an object from a coarser level to a finer level. Therefore, this paper proposes a novel method to reconstruct buildings at different LoDs from airborne Light Detection and Ranging (LiDAR) point clouds based on an improved morphological scale space. The proposed method first extracts building candidate regions following the separation of ground and non-ground points. For each building candidate region, the proposed method generates a scale space by iteratively using the improved morphological reconstruction with the increase of scale, and constructs the corresponding topological relationship graphs (TRGs) across scales. Secondly, the proposed method robustly extracts building points by using features based on the TRG. Finally, the proposed method reconstructs each building at different LoDs according to the TRG. The experiments demonstrate that the proposed method robustly extracts the buildings with details (e.g., door eaves and roof furniture) and illustrate good performance in distinguishing buildings from vegetation or other objects, while automatically reconstructing building LoDs from the finest building points. Full article
(This article belongs to the Special Issue Airborne Laser Scanning)
Show Figures

Graphical abstract

20 pages, 3085 KiB  
Article
Joint Sparse Sub-Pixel Mapping Model with Endmember Variability for Remotely Sensed Imagery
by Xiong Xu 1,2, Xiaohua Tong 1,*, Antonio Plaza 2, Yanfei Zhong 3, Huan Xie 1 and Liangpei Zhang 3
1 College of Surveying and Geo-Informatics, Tongji University, 1239 Siping Road, Shanghai 200092, China
2 Hyperspectral Computing Laboratory, Department of Technology of Computers and Communications, Escuela Politecnica, University of Exremadura, Cáceres 10003, Spain
3 State Key Laboratory of Information Engineering in Surveying, Mapping, and Remote Sensing, Wuhan University, Wuhan 430079, China
Remote Sens. 2017, 9(1), 15; https://doi.org/10.3390/rs9010015 - 29 Dec 2016
Cited by 22 | Viewed by 7524
Abstract
Spectral unmixing and sub-pixel mapping have been used to estimate the proportion and spatial distribution of the different land-cover classes in mixed pixels at a sub-pixel scale. In the past decades, several algorithms were proposed in both categories; however, these two techniques are [...] Read more.
Spectral unmixing and sub-pixel mapping have been used to estimate the proportion and spatial distribution of the different land-cover classes in mixed pixels at a sub-pixel scale. In the past decades, several algorithms were proposed in both categories; however, these two techniques are generally regarded as independent procedures, with most sub-pixel mapping methods using abundance maps generated by spectral unmixing techniques. It should be noted that the utilized abundance map has a strong impact on the performance of the subsequent sub-pixel mapping process. Recently, we built a novel sub-pixel mapping model in combination with the linear spectral mixture model. Therefore, a joint sub-pixel mapping model was established that connects an original (coarser resolution) remotely sensed image with the final sub-pixel result directly. However, this approach focuses on incorporating the spectral information contained in the original image without addressing the spectral endmember variability resulting from variable illumination and environmental conditions. To address this important issue, in this paper we designed a new joint sparse sub-pixel mapping method under the assumption that various representative spectra for each endmember are known a priori and available in a library. In addition, the total variation (TV) regularization was also adopted to exploit the spatial information. The proposed approach was experimentally evaluated using both synthetic and real hyperspectral images, and the obtained results demonstrate that the method can achieve better results by considering the impact of endmember variability when compared with other sub-pixel mapping methods. Full article
(This article belongs to the Special Issue Spatial Enhancement of Hyperspectral Data and Applications)
Show Figures

Graphical abstract

19 pages, 4484 KiB  
Article
Using MODIS Data to Predict Regional Corn Yields
by Ho-Young Ban 1, Kwang Soo Kim 1, No-Wook Park 2 and Byun-Woo Lee 1,3,*
1 Department of Plant Science, College of Agriculture and Life Sciences, Seoul National University, 1 Gwanak-ro, Gwanak-gu, Seoul 08826, Korea
2 Department of Geoinformatic Engineering, Inha University, 100 Inha-ro, Nam-gu, Incheon 22212, Korea
3 Research Institute of Agriculture and Life Sciences, Seoul National University, 1 Gwanak-ro, Gwanak-gu, Seoul 08826, Korea
Remote Sens. 2017, 9(1), 16; https://doi.org/10.3390/rs9010016 - 28 Dec 2016
Cited by 27 | Viewed by 7807
Abstract
A simple approach was developed to predict corn yields using the MoDerate Resolution Imaging Spectroradiometer (MODIS) data product from two geographically separate major corn crop production regions: Illinois, USA and Heilongjiang, China. The MOD09A1 data, which are eight-day interval surface reflectance data, were [...] Read more.
A simple approach was developed to predict corn yields using the MoDerate Resolution Imaging Spectroradiometer (MODIS) data product from two geographically separate major corn crop production regions: Illinois, USA and Heilongjiang, China. The MOD09A1 data, which are eight-day interval surface reflectance data, were obtained from day of the year (DOY) 89 to 337 to calculate the leaf area index (LAI). The sum of the LAI from early in the season to a given date in the season (end of DOY (EOD)) was well fitted to a logistic function and represented seasonal changes in leaf area duration (LAD). A simple phenology model was derived to estimate the dates of emergence and maturity using the LAD-logistic function parameters b1 and b2, which represented the rate of increase in LAI and the date of maximum LAI, respectively. The phenology model predicted emergence and maturity dates fairly well, with root mean square error (RMSE) values of 6.3 and 4.9 days for the validation dataset, respectively. Two simple linear regression models (YP and YF) were established using LAD as the variable to predict corn yield. The yield model YP used LAD from predicted emergence to maturity, and the yield model YF used LAD for a predetermined period from DOY 89 to a particular EOD. When state/province corn yields for the validation dataset were predicted at DOY 321, near completion of the corn harvest, the YP model, including the predicted phenology, performed much better than the YF model, with RMSE values of 0.68 t/ha and 0.66 t/ha for Illinois and Heilongjiang, respectively. The YP model showed similar or better performance, even for the much earlier pre-harvest yield prediction at DOY 257. In addition, the model performance showed no difference between the two study regions with very different climates and cultivation methods, including cultivar and irrigation management. These results suggested that the approach described in this paper has potential for application to relatively wide agroclimatic regions with different cultivation methods and for extension to the other crops. However, it needs to be examined further in tropical and sub-tropical regions, which are very different from the two study regions with respect to agroclimatic constraints and agrotechnologies. Full article
Show Figures

Graphical abstract

18 pages, 1917 KiB  
Article
Advancing NASA’s AirMOSS P-Band Radar Root Zone Soil Moisture Retrieval Algorithm via Incorporation of Richards’ Equation
by Morteza Sadeghi 1,*, Alireza Tabatabaeenejad 2, Markus Tuller 3, Mahta Moghaddam 2 and Scott B. Jones 1
1 Department of Plants, Soils and Climate, Utah State University, Logan, UT 84322, USA
2 Ming Hsieh Department of Electrical Engineering, University of Southern California, Los Angeles, CA 90089, USA
3 Department of Soil, Water and Environmental Science, The University of Arizona, Tucson, AZ 85721, USA
Remote Sens. 2017, 9(1), 17; https://doi.org/10.3390/rs9010017 - 28 Dec 2016
Cited by 45 | Viewed by 11251
Abstract
P-band radar remote sensing applied during the Airborne Microwave Observatory of Subcanopy and Subsurface (AirMOSS) mission has shown great potential for estimation of root zone soil moisture. When retrieving the soil moisture profile (SMP) from P-band radar observations, a mathematical function describing the [...] Read more.
P-band radar remote sensing applied during the Airborne Microwave Observatory of Subcanopy and Subsurface (AirMOSS) mission has shown great potential for estimation of root zone soil moisture. When retrieving the soil moisture profile (SMP) from P-band radar observations, a mathematical function describing the vertical moisture distribution is required. Because only a limited number of observations are available, the number of free parameters of the mathematical model must not exceed the number of observed data. For this reason, an empirical quadratic function (second order polynomial) is currently applied in the AirMOSS inversion algorithm to retrieve the SMP. The three free parameters of the polynomial are retrieved for each AirMOSS pixel using three backscatter observations (i.e., one frequency at three polarizations of Horizontal-Horizontal, Vertical-Vertical and Horizontal-Vertical). In this paper, a more realistic, physically-based SMP model containing three free parameters is derived, based on a solution to Richards’ equation for unsaturated flow in soils. Evaluation of the new SMP model based on both numerical simulations and measured data revealed that it exhibits greater flexibility for fitting measured and simulated SMPs than the currently applied polynomial. It is also demonstrated that the new SMP model can be reduced to a second order polynomial at the expense of fitting accuracy. Full article
(This article belongs to the Special Issue Remote Sensing Applied to Soils: From Ground to Space)
Show Figures

Graphical abstract

16 pages, 5983 KiB  
Article
Potential of ALOS2 and NDVI to Estimate Forest Above-Ground Biomass, and Comparison with Lidar-Derived Estimates
by Gaia Vaglio Laurin 1,*, Francesco Pirotti 2, Mattia Callegari 3, Qi Chen 4, Giovanni Cuozzo 3, Emanuele Lingua 2, Claudia Notarnicola 3 and Dario Papale 1
1 Department for Innovation in Biological, Agro-Food and Forest Systems (DIBAF), University of Tuscia, 01100 Viterbo, Italy
2 Dipartimento Territorio e Sistemi Agro-Forestali (TESAF)/Interdepartmental Research Center of Geomatics (CIRGEO), University of Padova, 35020 Legnaro, Italy
3 European Academy of Bozen EURAC-Institute for Applied Remote Sensing, Viale Druso 1, 39100 Bolzano, Italy
4 Department of Geography, University of Hawai’i at Manoa, 422 Saunders Hall, 2424 Maile Way, Honolulu, HI 96822, USA
Remote Sens. 2017, 9(1), 18; https://doi.org/10.3390/rs9010018 - 29 Dec 2016
Cited by 63 | Viewed by 10255
Abstract
Remote sensing supports carbon estimation, allowing the upscaling of field measurements to large extents. Lidar is considered the premier instrument to estimate above ground biomass, but data are expensive and collected on-demand, with limited spatial and temporal coverage. The previous JERS and ALOS [...] Read more.
Remote sensing supports carbon estimation, allowing the upscaling of field measurements to large extents. Lidar is considered the premier instrument to estimate above ground biomass, but data are expensive and collected on-demand, with limited spatial and temporal coverage. The previous JERS and ALOS SAR satellites data were extensively employed to model forest biomass, with literature suggesting signal saturation at low-moderate biomass values, and an influence of plot size on estimates accuracy. The ALOS2 continuity mission since May 2014 produces data with improved features with respect to the former ALOS, such as increased spatial resolution and reduced revisit time. We used ALOS2 backscatter data, testing also the integration with additional features (SAR textures and NDVI from Landsat 8 data) together with ground truth, to model and map above ground biomass in two mixed forest sites: Tahoe (California) and Asiago (Alps). While texture was useful to improve the model performance, the best model was obtained using joined SAR and NDVI (R2 equal to 0.66). In this model, only a slight saturation was observed, at higher levels than what usually reported in literature for SAR; the trend requires further investigation but the model confirmed the complementarity of optical and SAR datatypes. For comparison purposes, we also generated a biomass map for Asiago using lidar data, and considered a previous lidar-based study for Tahoe; in these areas, the observed R2 were 0.92 for Tahoe and 0.75 for Asiago, respectively. The quantitative comparison of the carbon stocks obtained with the two methods allows discussion of sensor suitability. The range of local variation captured by lidar is higher than those by SAR and NDVI, with the latter showing overestimation. However, this overestimation is very limited for one of the study areas, suggesting that when the purpose is the overall quantification of the stored carbon, especially in areas with high carbon density, satellite data with lower cost and broad coverage can be as effective as lidar. Full article
(This article belongs to the Special Issue Remote Sensing of Above Ground Biomass)
Show Figures

Graphical abstract

16 pages, 10960 KiB  
Article
Multisource Remote Sensing Imagery Fusion Scheme Based on Bidimensional Empirical Mode Decomposition (BEMD) and Its Application to the Extraction of Bamboo Forest
by Guang Liu 1, Lei Li 1,2,*, Hui Gong 2, Qingwen Jin 1,3, Xinwu Li 1, Rui Song 1, Yun Chen 1, Yu Chen 1, Chengxin He 4, Yuqing Huang 4 and Yuefeng Yao 4
1 Key Laboratory of Digital Earth Science, Institute of Remote Sensing and Digital Earth, Chinese Academy of Sciences, Beijing 100094, China
2 Department of Surveying, School of Civil Engineering, Beijing Jiaotong University, Beijing 100044, China
3 Institute of Geography and Environment, Baoji University of Arts and Sciences, Baoji 721013, China
4 Guangxi Key Laboratory of Plant Conservation and Restoration Ecology in Karst Terrain, Guangxi Institute of Botany, Guangxi Zhuang Autonomous Region and Chinese Academy of Sciences, Guilin 541006, China
Remote Sens. 2017, 9(1), 19; https://doi.org/10.3390/rs9010019 - 29 Dec 2016
Cited by 21 | Viewed by 7275
Abstract
Most bamboo forests grow in humid climates in low-latitude tropical or subtropical monsoon areas, and they are generally located in hilly areas. Bamboo trunks are very straight and smooth, which means that bamboo forests have low structural diversity. These features are beneficial to [...] Read more.
Most bamboo forests grow in humid climates in low-latitude tropical or subtropical monsoon areas, and they are generally located in hilly areas. Bamboo trunks are very straight and smooth, which means that bamboo forests have low structural diversity. These features are beneficial to synthetic aperture radar (SAR) microwave penetration and they provide special information in SAR imagery. However, some factors (e.g., foreshortening) can compromise the interpretation of SAR imagery. The fusion of SAR and optical imagery is considered an effective method with which to obtain information on ground objects. However, most relevant research has been based on two types of remote sensing image. This paper proposes a new fusion scheme, which combines three types of image simultaneously, based on two fusion methods: bidimensional empirical mode decomposition (BEMD) and the Gram-Schmidt transform. The fusion of panchromatic and multispectral images based on the Gram-Schmidt transform can enhance spatial resolution while retaining multispectral information. BEMD is an adaptive decomposition method that has been applied widely in the analysis of nonlinear signals and to the nonstable signal of SAR. The fusion of SAR imagery with fused panchromatic and multispectral imagery using BEMD is based on the frequency information of the images. It was established that the proposed fusion scheme is an effective remote sensing image interpretation method, and that the value of entropy and the spatial frequency of the fused images were improved in comparison with other techniques such as the discrete wavelet, à-trous, and non-subsampled contourlet transform methods. Compared with the original image, information entropy of the fusion image based on BEMD improves about 0.13–0.38. Compared with the other three methods it improves about 0.06–0.12. The average gradient of BEMD is 4%–6% greater than for other methods. BEMD maintains spatial frequency 3.2–4.0 higher than other methods. The experimental results showed the proposed fusion scheme could improve the accuracy of bamboo forest classification. Accuracy increased by 12.1%, and inaccuracy was reduced by 11.0%. Full article
(This article belongs to the Special Issue Remote Sensing of Forest Health)
Show Figures

Graphical abstract

16 pages, 5868 KiB  
Article
Evaluation of a Phenology-Dependent Response Method for Estimating Leaf Area Index of Rice Across Climate Gradients
by Bora Lee 1,*, Hyojung Kwon 2, Akira Miyata 3, Steve Lindner 1 and John Tenhunen 1
1 Plant Ecology, Bayreuth Center of Ecology and Environmental Research (BayCEER), Universitätsstrasse 30, University of Bayreuth, 95447 Bayreuth, Germany
2 Department of Forest Ecosystems and Society, Oregon State University, 321 Richardson Hall, Corvallis, OR 97331, USA
3 Institute for Agro-Environmental Sciences, NARO, Tsukuba 305-8604, Japan
Remote Sens. 2017, 9(1), 20; https://doi.org/10.3390/rs9010020 - 29 Dec 2016
Cited by 18 | Viewed by 7010
Abstract
Accurate estimate of the seasonal leaf area index (LAI) in croplands is required for understanding not only intra- and inter-annual crop development, but also crop management. Lack of consideration in different growth phases in the relationship between LAI and vegetation indices (VI) often [...] Read more.
Accurate estimate of the seasonal leaf area index (LAI) in croplands is required for understanding not only intra- and inter-annual crop development, but also crop management. Lack of consideration in different growth phases in the relationship between LAI and vegetation indices (VI) often results in unsatisfactory estimation in the seasonal course of LAI. In this study, we partitioned the growing season into two phases separated by maximum VI ( VI max ) and applied the general regression model to the data gained from two phases. As an alternative method to capture the influence of seasonal phenological development on the LAI-VI relationship, we developed a consistent development curve method and compared its performance with the general regression approaches. We used the Normalized Difference VI (NDVI) and the Enhanced VI (EVI) from the rice paddy sites in Asia (South Korea and Japan) and Europe (Spain) to examine its applicability across different climate conditions and management cycles. When the general regression method was used, separating the season into two phases resulted in no better estimation than the estimation obtained with the entire season observation due to an abrupt change in seasonal LAI occurring during the transition between the before and after VI max . The consistent development curve method reproduced the seasonal patterns of LAI from both NDVI and EVI across all sites better than the general regression method. Despite less than satisfactory estimation of a local LAI max , the consistent development curve method demonstrates improvement in estimating the seasonal course of LAI. The method can aid in providing accurate seasonal LAI as an input into ecological process-based models. Full article
Show Figures

Graphical abstract

16 pages, 1369 KiB  
Article
Spatiotemporal Fusion of Remote Sensing Images with Structural Sparsity and Semi-Coupled Dictionary Learning
by Jingbo Wei 1,2, Lizhe Wang 2,3,*, Peng Liu 2 and Weijing Song 3
1 Institute of Space Science and Technology, Nanchang University, Nanchang 330031, China
2 School of Computer Science, China University of Geoscience, Wuhan 430074, China
3 Institute of Remote Sensing and Digital Earth, Chinese Academy of Sciences, Beijing 100094, China
Remote Sens. 2017, 9(1), 21; https://doi.org/10.3390/rs9010021 - 30 Dec 2016
Cited by 45 | Viewed by 6260
Abstract
Fusion of remote sensing images with different spatial and temporal resolutions is highly needed by diverse earth observation applications. A small number of spatiotemporal fusion methods using sparse representation appear to be more promising than traditional linear mixture methods in reflecting abruptly changing [...] Read more.
Fusion of remote sensing images with different spatial and temporal resolutions is highly needed by diverse earth observation applications. A small number of spatiotemporal fusion methods using sparse representation appear to be more promising than traditional linear mixture methods in reflecting abruptly changing terrestrial content. However, one of the main difficulties is that the results of sparse representation have reduced expressional accuracy; this is due in part to insufficient prior knowledge. For remote sensing images, the cluster and joint structural sparsity of the sparse coefficients could be employed as a priori knowledge. In this paper, a new optimization model is constructed with the semi-coupled dictionary learning and structural sparsity to predict the unknown high-resolution image from known images. Specifically, the intra-block correlation and cluster-structured sparsity are considered for single-channel reconstruction, and the inter-band similarity of joint-structured sparsity is considered for multichannel reconstruction, and both are implemented with block sparse Bayesian learning. The detailed optimization steps are given iteratively. In the experimental procedure, the red, green, and near-infrared bands of Landsat-7 and Moderate Resolution Imaging Spectrometer (MODIS) satellites are put to fusion with root mean square errors to check the prediction accuracy. It can be concluded from the experiment that the proposed methods can produce higher quality than state-of-the-art methods. Full article
Show Figures

Graphical abstract

13 pages, 12429 KiB  
Article
Deep Learning Based Oil Palm Tree Detection and Counting for High-Resolution Remote Sensing Images
by Weijia Li 1,2, Haohuan Fu 1,2,3,*, Le Yu 1,2 and Arthur Cracknell 4
1 Ministry of Education Key Laboratory for Earth System Modeling, Department of Earth System Science, Tsinghua University, Beijing 100084, China
2 Joint Center for Global Change Studies (JCGCS), Beijing 100084, China
3 National Supercomputing Center in Wuxi, Wuxi 214072, China
4 Division of Electronic Engineering and Physics, University of Dundee, Dundee DDI 4HN, UK
Remote Sens. 2017, 9(1), 22; https://doi.org/10.3390/rs9010022 - 30 Dec 2016
Cited by 348 | Viewed by 27055
Abstract
Oil palm trees are important economic crops in Malaysia and other tropical areas. The number of oil palm trees in a plantation area is important information for predicting the yield of palm oil, monitoring the growing situation of palm trees and maximizing their [...] Read more.
Oil palm trees are important economic crops in Malaysia and other tropical areas. The number of oil palm trees in a plantation area is important information for predicting the yield of palm oil, monitoring the growing situation of palm trees and maximizing their productivity, etc. In this paper, we propose a deep learning based framework for oil palm tree detection and counting using high-resolution remote sensing images for Malaysia. Unlike previous palm tree detection studies, the trees in our study area are more crowded and their crowns often overlap. We use a number of manually interpreted samples to train and optimize the convolutional neural network (CNN), and predict labels for all the samples in an image dataset collected through the sliding window technique. Then, we merge the predicted palm coordinates corresponding to the same palm tree into one palm coordinate and obtain the final palm tree detection results. Based on our proposed method, more than 96% of the oil palm trees in our study area can be detected correctly when compared with the manually interpreted ground truth, and this is higher than the accuracies of the other three tree detection methods used in this study. Full article
Show Figures

Graphical abstract

20 pages, 6006 KiB  
Article
Improving the Downscaling of Diurnal Land Surface Temperatures Using the Annual Cycle Parameters as Disaggregation Kernels
by Panagiotis Sismanidis 1,2,*, Iphigenia Keramitsoglou 1, Benjamin Bechtel 3 and Chris T. Kiranoudis 1,2
1 Institute for Astronomy, Astrophysics, Space Applications and Remote Sensing, National Observatory of Athens, Athens GR-15236, Greece
2 School of Chemical Engineering, National Technical University of Athens, Athens GR-15780, Greece
3 Center for Earth System Research and Sustainability, University of Hamburg, Hamburg DE-20146, Germany
Remote Sens. 2017, 9(1), 23; https://doi.org/10.3390/rs9010023 - 30 Dec 2016
Cited by 44 | Viewed by 5854
Abstract
The downscaling of geostationary diurnal thermal data can ease the lack of land surface temperature (LST) datasets that combine high spatial and temporal resolution. However, the downscaling of diurnal LST data is more demanding than single scenes. This is because the spatiotemporal interrelationships [...] Read more.
The downscaling of geostationary diurnal thermal data can ease the lack of land surface temperature (LST) datasets that combine high spatial and temporal resolution. However, the downscaling of diurnal LST data is more demanding than single scenes. This is because the spatiotemporal interrelationships of the original LST data have to be preserved and accurately reproduced by the downscaled LST (DLST) data. To that end, LST disaggregation kernels/predictors that provide information about the spatial distribution of LST during different times of a day can prove especially useful. Such LST predictors are the LST Annual Cycle Parameters (ACPs). In this work, multitemporal ACPs are employed for downscaling daytime and nighttime ~4 km geostationary LST from SEVIRI (Spinning Enhanced Visible and Infrared Imager) down to 1 km. The overall goal is to assess if the use of the ACPs can improve the estimation of the diurnal range of DLST (daytime DLST minus nighttime DLST). The evaluation is performed by comparing the DLST diurnal range maps with reference data from MODIS (Moderate Imaging Spectroradiometer) and also with data retrieved from a modified version of the TsHARP (Thermal Sharpening) algorithm. The results suggest that the ACPs increase the downscaling performance, improve the estimation of diurnal DLST range and produce more accurate spatial patterns. Full article
Show Figures

Figure 1

19 pages, 4835 KiB  
Article
Comparison of SEVIRI-Derived Cloud Occurrence Frequency and Cloud-Top Height with A-Train Data
by Chu-Yong Chung 1,*, Peter N. Francis 2, Roger W. Saunders 2 and Jhoon Kim 3
1 National Meteorological Satellite Center, Korea Meteorological Administration, 64-18 Guam-gil, Gwanghyewon-myeon, Jincheon-gun, Chuncheonbuk-do 27803, Korea
2 Met Office, FitzRoy road, Exeter, Devon EX1 3PB, UK
3 Department of Atmosphere Sciences, Yonsei University, 50 Yonsei-ro, Seodaemun-gu, Seoul 03722, Korea
Remote Sens. 2017, 9(1), 24; https://doi.org/10.3390/rs9010024 - 30 Dec 2016
Cited by 7 | Viewed by 5496
Abstract
To investigate the characteristics of Spinning Enhanced Visible and Infrared Imager (SEVIRI)-derived products from the UK Met Office algorithm, one year of cloud occurrence frequency (COF) and cloud-top height (CTH) data from May 2013 to April 2014 was analysed in comparison with Cloud [...] Read more.
To investigate the characteristics of Spinning Enhanced Visible and Infrared Imager (SEVIRI)-derived products from the UK Met Office algorithm, one year of cloud occurrence frequency (COF) and cloud-top height (CTH) data from May 2013 to April 2014 was analysed in comparison with Cloud Profiling Radar (CPR) and Cloud-Aerosol LiDAR with Orthogonal Polarization (CALIOP) cloud products observed from the A-Train constellation. Because CPR operated in daylight-only data collection mode, daytime products were validated in this study. It is important to note that the different sensor characteristics cause differences in CTH retrievals. The CTH of active instruments, CPR and CALIOP, is derived from the return time of the backscattered radar or LiDAR signal, while the infrared sensor, SEVIRI, measures a radiatively effective CTH. Therefore, some systematic differences in comparison results are expected. However, similarities in spatial distribution and seasonal variability of COFs were noted among SEVIRI, CALIOP, and CPR products, although COF derived by the SEVIRI algorithm showed biases of 14.35% and −3.90% compared with those from CPR and CALIOP measurements, respectively. We found that the SEVIRI algorithm estimated larger COF values than the CPR product, especially over oceans, whereas smaller COF was detected by SEVIRI measurements over land and in the tropics than by CALIOP, where multi-layer clouds and thin cirrus clouds are dominant. CTHs derived from SEVIRI showed better agreement with CPR than with CALIOP. Further comparison with CPR showed that SEVIRI CTH was highly sensitive to the CO2 bias correction used in the Minimum Residual method. Compared with CPR CTHs, SEVIRI has produced stable CTHs since the bias correction update in November 2013, with a correlation coefficient of 0.93, bias of −0.27 km, and standard deviation of 1.61 km. Full article
Show Figures

Graphical abstract

17 pages, 34846 KiB  
Article
Wavelet-Based Local Contrast Enhancement for Satellite, Aerial and Close Range Images
by Krystian Pyka
Department of Geoinformation, Photogrammetry and Environmental Remote Sensing, AGH University of Science and Technology, 30-059 Krakow, Poland
Remote Sens. 2017, 9(1), 25; https://doi.org/10.3390/rs9010025 - 1 Jan 2017
Cited by 16 | Viewed by 8370
Abstract
The methods used for image contrast enhancement in the wavelet domain have been previously documented. The essence of these methods lies in the manipulation of the image during the reconstruction process, by changing the relationship between the components that require transformation. This paper [...] Read more.
The methods used for image contrast enhancement in the wavelet domain have been previously documented. The essence of these methods lies in the manipulation of the image during the reconstruction process, by changing the relationship between the components that require transformation. This paper proposes a new variant based on using undecimated wavelet transform and adapting the Gaussian function for scaling the coefficients of detail wavelet components, so that the role of low coefficients in the reconstructed image is greater. The enhanced image is then created by combining the new components. Applying the Haar wavelet minimises the effects of the relationship disturbance between components, and creates a small buffer around the edge. The proposed method was tested using six images at different scales, collected with handheld photo cameras, and aerial and satellite optical sensors. The results of the tests indicate that the method can achieve comparable, or even better enhancement effects for weak edges, than the well-known unsharp masking and Retinex methods. The proposed method can be applied in order to improve the visual interpretation of remote sensing images taken by various sensors at different scales. Full article
Show Figures

Figure 1

25 pages, 15998 KiB  
Article
A New Contextual Parameterization of Evaporative Fraction to Reduce the Reliance of the TsVI Triangle Method on the Dry Edge
by Wenbin Zhu, Aifeng Lv, Shaofeng Jia * and Jiabao Yan
Key Laboratory of Water Cycle and Related Land Surface Processes, Institute of Geographic Sciences and Natural Resources Research, CAS, Beijing 100101, China
Remote Sens. 2017, 9(1), 26; https://doi.org/10.3390/rs9010026 - 4 Jan 2017
Cited by 9 | Viewed by 5102
Abstract
In this study, a new parameterization scheme of evaporative fraction (EF) was developed from the contextual information of remotely sensed radiative surface temperature ( T s ) and vegetation index (VI). In the traditional T s V I triangle methods, the Priestley-Taylor [...] Read more.
In this study, a new parameterization scheme of evaporative fraction (EF) was developed from the contextual information of remotely sensed radiative surface temperature ( T s ) and vegetation index (VI). In the traditional T s V I triangle methods, the Priestley-Taylor parameter of each pixel was interpolated for each VI interval; in our proposed new parameterization scheme (NPS), it was performed for each isopiestic line of soil surface moisture. Specifically, of mixed pixels was determined as the weighted-average value of bare soil and full-cover vegetation . The maximum T s of bare soil ( T s m a x ) is the sole parameter needed as the constraint of the dry edge. This has not only bypassed the task involved in the determination of the maximum T s of fully vegetated surface ( T c m a x ), but also made it possible to reduce the reliance of the T s V I triangle methods on the determination of the dry edge. Ground-based measurements taken during 21 days in 2004 were used to validate the EF retrievals. Results show that the accuracy achieved by the NPS is comparable to that achieved by the traditional T s V I triangle methods. Therefore, the simplicity of the proposed new parameterization scheme does not compromise its accuracy in monitoring EF. Full article
Show Figures

Graphical abstract

11 pages, 4910 KiB  
Article
A Low-Cost Smartphone Sensor-Based UV Camera for Volcanic SO2 Emission Measurements
by Thomas Charles Wilkes 1,*, Tom David Pering 1, Andrew John Samuel McGonigle 1,2,3, Giancarlo Tamburello 4 and Jon Raffe Willmott 5
1 Department of Geography, The University of Sheffield, Winter Street, Sheffield S10 2TN, UK
2 Istituto Nazionale di Geofisica e Vulcanologia, Sezione di Palermo, via Ugo La Malfa 153, 90146 Palermo, Italy
3 School of Geosciences, The University of Sydney, Sydney, NSW2006, Australia
4 Dipartimento di Scienze della Terra e del Mare (DiSTeM), Università di Palermo, via Archirafi, 22, 90123 Palermo, Italy
5 Department of Electronic and Electrical Engineering, The University of Sheffield, Portobello Centre, Pitt Street, Sheffield S1 4ET, UK
Remote Sens. 2017, 9(1), 27; https://doi.org/10.3390/rs9010027 - 1 Jan 2017
Cited by 41 | Viewed by 12904
Abstract
Recently, we reported on the development of low-cost ultraviolet (UV) cameras, based on the modification of sensors designed for the smartphone market. These units are built around modified Raspberry Pi cameras (PiCams; ≈USD 25), and usable system sensitivity was demonstrated in the UVA [...] Read more.
Recently, we reported on the development of low-cost ultraviolet (UV) cameras, based on the modification of sensors designed for the smartphone market. These units are built around modified Raspberry Pi cameras (PiCams; ≈USD 25), and usable system sensitivity was demonstrated in the UVA and UVB spectral regions, of relevance to a number of application areas. Here, we report on the first deployment of PiCam devices in one such field: UV remote sensing of sulphur dioxide emissions from volcanoes; such data provide important insights into magmatic processes and are applied in hazard assessments. In particular, we report on field trials on Mt. Etna, where the utility of these devices in quantifying volcanic sulphur dioxide (SO2) emissions was validated. We furthermore performed side-by-side trials of these units against scientific grade cameras, which are currently used in this application, finding that the two systems gave virtually identical flux time series outputs, and that signal-to-noise characteristics of the PiCam units appeared to be more than adequate for volcanological applications. Given the low cost of these sensors, allowing two-filter SO2 camera systems to be assembled for ≈USD 500, they could be suitable for widespread dissemination in volcanic SO2 monitoring internationally. Full article
Show Figures

Graphical abstract

24 pages, 4832 KiB  
Article
Assessment of Soil Degradation by Erosion Based on Analysis of Soil Properties Using Aerial Hyperspectral Images and Ancillary Data, Czech Republic
by Daniel Žížala 1,2,*, Tereza Zádorová 2 and Jiří Kapička 1
1 Research Institute for Soil and Water Conservation, Žabovřeská 250, Prague CZ 156 27, Czech Republic
2 Department of Soil Science and Soil Protection, Faculty of Agrobiology, Food and Natural Resources, Czech University of Life Sciences Prague, Kamýcká 29, Prague CZ 165 00, Czech Republic
Remote Sens. 2017, 9(1), 28; https://doi.org/10.3390/rs9010028 - 1 Jan 2017
Cited by 63 | Viewed by 11807
Abstract
The assessment of the soil redistribution and real long-term soil degradation due to erosion on agriculture land is still insufficient in spite of being essential for soil conservation policy. Imaging spectroscopy has been recognized as a suitable tool for soil erosion assessment in [...] Read more.
The assessment of the soil redistribution and real long-term soil degradation due to erosion on agriculture land is still insufficient in spite of being essential for soil conservation policy. Imaging spectroscopy has been recognized as a suitable tool for soil erosion assessment in recent years. In our study, we bring an approach for assessment of soil degradation by erosion by means of determining soil erosion classes representing soils differently influenced by erosion impact. The adopted methods include extensive field sampling, laboratory analysis, predictive modelling of selected soil surface properties using aerial hyperspectral data and the digital elevation model and fuzzy classification. Different multivariate regression techniques (Partial Least Square, Support Vector Machine, Random forest and Artificial neural network) were applied in the predictive modelling of soil properties. The properties with satisfying performance (R2 > 0.5) were used as input data in erosion classes determination by fuzzy C-means classification method. The study was performed at four study sites about 1 km2 large representing the most extensive soil units of the agricultural land in the Czech Republic (Chernozems and Luvisols on loess and Cambisols and Stagnosols on crystalline rocks). The influence of site-specific conditions on prediction of soil properties and classification of erosion classes was assessed. The prediction accuracy (R2) of the best performing models predicting the soil properties varies in range 0.8–0.91 for soil organic carbon content, 0.21–0.67 for sand content, 0.4–0.92 for silt content, 0.38–0.89 for clay content, 0.73–089 for Feox, 0.59–0.78 for Fed and 0.82 for CaCO3. The performance and suitability of different properties for erosion classes’ classification are highly variable at the study sites. Soil organic carbon was the most frequently used as the erosion classes’ predictor, while the textural classes showed lower applicability. The presented approach was successfully applied in Chernozem and Luvisol loess regions where the erosion classes were assessed with a good overall accuracy (82% and 67%, respectively). The model performance in two Cambisol/Stagnosol regions was rather poor (51%–52%). The results showed that the presented method can be directly and with a good performance applied in pedologically and geologically homogeneous areas. The sites with heterogeneous structure of the soil cover and parent material will require more precise local-fitted models and use of further auxiliary information such as terrain or geological data. The future application of presented approach at a regional scale promises to produce valuable data on actual soil degradation by erosion usable for soil conservation policy purposes. Full article
(This article belongs to the Special Issue Remote Sensing Applied to Soils: From Ground to Space)
Show Figures

Graphical abstract

20 pages, 6562 KiB  
Article
Improving Spectral Estimation of Soil Organic Carbon Content through Semi-Supervised Regression
by Huizeng Liu 1,2, Tiezhu Shi 1,3, Yiyun Chen 4, Junjie Wang 1,3, Teng Fei 5 and Guofeng Wu 1,3,*
1 Key Laboratory for Geo-Environmental Monitoring of Coastal Zone of the National Administration of Surveying, Mapping and GeoInformation & Shenzhen Key Laboratory of Spatial Smart Sensing and Services, Shenzhen University, Shenzhen 518060, China
2 Department of Geography, Hong Kong Baptist University, Kowloon Tong, Kowloon, Hong Kong, China
3 College of Life Sciences and Oceanography, Shenzhen University, Shenzhen 518060, China
4 School of Resource and Environmental Sciences, Wuhan University, Wuhan 430079, China
5 Suzhou Institute of Wuhan University, Suzhou 215123, China
Remote Sens. 2017, 9(1), 29; https://doi.org/10.3390/rs9010029 - 3 Jan 2017
Cited by 36 | Viewed by 6588
Abstract
Visible and near infrared (VIS-NIR) spectroscopy has been applied to estimate soil organic carbon (SOC) content with many modeling strategies and techniques, in which a crucial and challenging problem is to obtain accurate estimations using a limited number of samples with reference values [...] Read more.
Visible and near infrared (VIS-NIR) spectroscopy has been applied to estimate soil organic carbon (SOC) content with many modeling strategies and techniques, in which a crucial and challenging problem is to obtain accurate estimations using a limited number of samples with reference values (labeled samples). To solve such a challenging problem, this study, with Honghu City (Hubei Province, China) as a study area, aimed to apply semi-supervised regression (SSR) to estimate SOC contents from VIS-NIR spectroscopy. A total of 252 soil samples were collected in four field campaigns for laboratory-based SOC content determinations and spectral measurements. Semi-supervised regression with co-training based on least squares support vector machine regression (Co-LSSVMR) was applied for spectral estimations of SOC contents, and it was further compared with LSSVMR. Results showed that Co-LSSVMR could improve the estimations of SOC contents by exploiting samples without reference values (unlabeled samples) when the number of labeled samples was not excessively small and produce better estimations than LSSVMR. Therefore, SSR could reduce the number of labeled samples required in calibration given an accuracy threshold, and it holds advantages in SOC estimations from VIS-NIR spectroscopy with a limited number of labeled samples. Considering the increasing popularity of airborne platforms and sensors, SSR might be a promising modeling technique for SOC estimations from remotely sensed hyperspectral images. Full article
(This article belongs to the Special Issue Remote Sensing Applied to Soils: From Ground to Space)
Show Figures

Graphical abstract

22 pages, 1850 KiB  
Article
A Fully Automatic Instantaneous Fire Hotspot Detection Processor Based on AVHRR Imagery—A TIMELINE Thematic Processor
by Simon Plank *, Eva-Maria Fuchs and Corinne Frey
German Aerospace Center (DLR), German Remote Sensing Data Center (DFD), Muenchener Str. 20, 82234 Oberpfaffenhofen, Germany
Remote Sens. 2017, 9(1), 30; https://doi.org/10.3390/rs9010030 - 2 Jan 2017
Cited by 13 | Viewed by 5730
Abstract
The German Aerospace Center’s (DLR) TIMELINE project aims to develop an operational processing and data management environment to process 30 years of National Oceanic and Atmospheric Administration (NOAA)—Advanced Very High Resolution Radiometer (AVHRR) raw data into L1b, L2 and L3 products. This article [...] Read more.
The German Aerospace Center’s (DLR) TIMELINE project aims to develop an operational processing and data management environment to process 30 years of National Oceanic and Atmospheric Administration (NOAA)—Advanced Very High Resolution Radiometer (AVHRR) raw data into L1b, L2 and L3 products. This article presents the current status of the fully automated L2 active fire hotspot detection processor, which is based on single-temporal datasets in orbit geometry. Three different probability levels of fire detection are provided. The results of the hotspot processor were tested with simulated fire data. Moreover, the processing results of real AVHRR imagery were validated with five different datasets: MODIS hotspots, visually confirmed MODIS hotspots, fire-news data from the European Forest Fire Information System (EFFIS), burnt area mapping of the Copernicus Emergency Management Service (EMS) and data of the Piedmont fire database. Full article
Show Figures

Graphical abstract

22 pages, 7361 KiB  
Article
Subpixel Inundation Mapping Using Landsat-8 OLI and UAV Data for a Wetland Region on the Zoige Plateau, China
by Haoming Xia 1,2, Wei Zhao 1, Ainong Li 1,*, Jinhu Bian 1,3 and Zhengjian Zhang 1,3
1 Research Center for Digital Mountain and Remote Sensing Application, Institute of Mountain Hazards and Environment, Chinese Academy of Sciences, Chengdu 610041, China
2 College of Environment and Planning, Key Laboratory of Geospatial Technology for Middle and Lower Yellow River Regions, Henan University, Kaifeng 475004, China
3 University of Chinese Academy of Sciences, Beijing 100049, China
Remote Sens. 2017, 9(1), 31; https://doi.org/10.3390/rs9010031 - 2 Jan 2017
Cited by 39 | Viewed by 6590
Abstract
Wetland inundation is crucial to the survival and prosperity of fauna and flora communities in wetland ecosystems. Even small changes in surface inundation may result in a substantial impact on the wetland ecosystem characteristics and function. This study presented a novel method for [...] Read more.
Wetland inundation is crucial to the survival and prosperity of fauna and flora communities in wetland ecosystems. Even small changes in surface inundation may result in a substantial impact on the wetland ecosystem characteristics and function. This study presented a novel method for wetland inundation mapping at a subpixel scale in a typical wetland region on the Zoige Plateau, northeast Tibetan Plateau, China, by combining use of an unmanned aerial vehicle (UAV) and Landsat-8 Operational Land Imager (OLI) data. A reference subpixel inundation percentage (SIP) map at a Landsat-8 OLI 30 m pixel scale was first generated using high resolution UAV data (0.16 m). The reference SIP map and Landsat-8 OLI imagery were then used to develop SIP estimation models using three different retrieval methods (Linear spectral unmixing (LSU), Artificial neural networks (ANN), and Regression tree (RT)). Based on observations from 2014, the estimation results indicated that the estimation model developed with RT method could provide the best fitting results for the mapping wetland SIP (R2 = 0.933, RMSE = 8.73%) compared to the other two methods. The proposed model with RT method was validated with observations from 2013, and the estimated SIP was highly correlated with the reference SIP, with an R2 of 0.986 and an RMSE of 9.84%. This study highlighted the value of high resolution UAV data and globally and freely available Landsat data in combination with the developed approach for monitoring finely gradual inundation change patterns in wetland ecosystems. Full article
Show Figures

Figure 1

13 pages, 4427 KiB  
Technical Note
An Improved Estimation of Regional Fractional Woody/Herbaceous Cover Using Combined Satellite Data and High-Quality Training Samples
by Xu Liu 1, Hongyan Liu 1,*, Shuang Qiu 1, Xiuchen Wu 2, Yuhong Tian 2 and Qian Hao 1,3
1 College of Urban and Environmental Sciences and MOE Laboratory for Earth Surface Processes, Peking University, Beijing 100871, China
2 College of Resources Science and Technology, Beijing Normal University, Beijing 100875, China
3 Institute of Surface-Earth System Science, Tianjin University, Tianjin 300072, China
Remote Sens. 2017, 9(1), 32; https://doi.org/10.3390/rs9010032 - 2 Jan 2017
Cited by 16 | Viewed by 5473
Abstract
Mapping vegetation cover is critical for understanding and monitoring ecosystem functions in semi-arid biomes. As existing estimates tend to underestimate the woody cover in areas with dry deciduous shrubland and woodland, we present an approach to improve the regional estimation of woody and [...] Read more.
Mapping vegetation cover is critical for understanding and monitoring ecosystem functions in semi-arid biomes. As existing estimates tend to underestimate the woody cover in areas with dry deciduous shrubland and woodland, we present an approach to improve the regional estimation of woody and herbaceous fractional cover in the East Asia steppe. This developed approach uses Random Forest models by combining multiple remote sensing data—training samples derived from high-resolution image in a tailored spatial sampling and model inputs composed of specific metrics from MODIS sensor and ancillary variables including topographic, bioclimatic, and land surface information. We emphasize that effective spatial sampling, high-quality classification, and adequate geospatial information are important prerequisites of establishing appropriate model inputs and achieving high-quality training samples. This study suggests that the optimal models improve estimation accuracy (NMSE 0.47 for woody and 0.64 for herbaceous plants) and show a consistent agreement with field observations. Compared with existing woody estimate product, the proposed woody cover estimation can delineate regions with subshrubs and shrubs, showing an improved capability of capturing spatialized detail of vegetation signals. This approach can be applicable over sizable semi-arid areas such as temperate steppes, savannas, and prairies. Full article
Show Figures

Graphical abstract

22 pages, 13453 KiB  
Article
Decomposing DInSAR Time-Series into 3-D in Combination with GPS in the Case of Low Strain Rates: An Application to the Hyblean Plateau, Sicily, Italy
by Andreas Vollrath 1,*, Francesco Zucca 1,†, David Bekaert 2,3,†, Alessandro Bonforte 4,†, Francesco Guglielmino 4,†, Andrew J. Hooper 3,† and Salvatore Stramondo 5,†
1 Department of Earth and Environmental Science, University of Pavia, Via Ferrata 1, 27100 Pavia, Italy
2 Jet Propulsion Laboratory, California Institute of Technology, 4800 Oak Grove Drive, Pasadena, CA 91109, USA
3 COMET, School of Earth and Environment, University of Leeds, Leeds LS2 9JT, UK
4 Istituto Nazionale di Geofisica e Vulcanologia (INGV), Sezione di Catania—Osservatorio Etneo, Piazza Roma 2, 95125 Catania, Italy
5 Istituto Nazionale di Geofisica e Vulcanologia (INGV), Via di Vigna Murata, 605, 00143 Roma, Italy
These authors contributed equally to this work.
Remote Sens. 2017, 9(1), 33; https://doi.org/10.3390/rs9010033 - 4 Jan 2017
Cited by 23 | Viewed by 8274
Abstract
Differential Interferometric SAR (DInSAR) time-series techniques can be used to derive surface displacement rates with accuracies of 1 mm/year, by measuring the one-dimensional distance change between a satellite and the surface over time. However, the slanted direction of the measurements complicates interpretation of [...] Read more.
Differential Interferometric SAR (DInSAR) time-series techniques can be used to derive surface displacement rates with accuracies of 1 mm/year, by measuring the one-dimensional distance change between a satellite and the surface over time. However, the slanted direction of the measurements complicates interpretation of the signal, especially in regions that are subject to multiple deformation processes. The Simultaneous and Integrated Strain Tensor Estimation from Geodetic and Satellite Deformation Measurements (SISTEM) algorithm enables decomposition into a three-dimensional velocity field through joint inversion with GNSS measurements, but has never been applied to interseismic deformation where strain rates are low. Here, we apply SISTEM for the first time to detect tectonic deformation on the Hyblean Foreland Plateau in South-East Sicily. In order to increase the signal-to-noise ratio of the DInSAR data beforehand, we reduce atmospheric InSAR noise using a weather model and combine it with a multi-directional spatial filtering technique. The resultant three-dimensional velocity field allows identification of anthropogenic, as well as tectonic deformation, with sub-centimeter accuracies in areas of sufficient GPS coverage. Our enhanced method allows for a more detailed view of ongoing deformation processes as compared to the single use of either GNSS or DInSAR only and thus is suited to improve assessments of regional seismic hazard. Full article
Show Figures

Graphical abstract

17 pages, 7603 KiB  
Article
Assessment of Regional Vegetation Response to Climate Anomalies: A Case Study for Australia Using GIMMS NDVI Time Series between 1982 and 2006
by Wanda De Keersmaecker 1,2,*, Stef Lhermitte 3, Michael J. Hill 4,5, Laurent Tits 6, Pol Coppin 2 and Ben Somers 1
1 Division of Forest, Nature and Landscape, KU Leuven, Leuven 3001, Belgium
2 Division of Crop Biotechnics, KU Leuven, Leuven 3001, Belgium
3 Department of Geoscience & Remote Sensing, Delft University of Technology, 2628 CD Delft, The Netherlands
4 Department of Earth System Science and Policy, University of North Dakota, Grand Forks, ND 58202, USA
5 CSIRO Land and Water, Canberra ACT 2601, Australia
6 Remote Sensing Department, Flemish Institute for Technological Research (VITO), Antwerp Mol 2400, Belgium
Remote Sens. 2017, 9(1), 34; https://doi.org/10.3390/rs9010034 - 4 Jan 2017
Cited by 50 | Viewed by 8727
Abstract
Within the context of climate change, it is of utmost importance to quantify the stability of ecosystems with respect to climate anomalies. It is well acknowledged that ecosystem stability may change over time. As these temporal stability changes may provide a warning for [...] Read more.
Within the context of climate change, it is of utmost importance to quantify the stability of ecosystems with respect to climate anomalies. It is well acknowledged that ecosystem stability may change over time. As these temporal stability changes may provide a warning for increased vulnerability of the system, this study provides a methodology to quantify and assess these temporal changes in vegetation stability. Within this framework, vegetation stability changes were quantified over Australia from 1982 to 2006 using GIMMS NDVI and climate time series (i.e., SPEI (Standardized Precipitation and Evaporation Index)). Starting from a stability assessment on the complete time series, we aim to assess: (i) the magnitude and direction of stability changes; and (ii) the similarity in these changes for different stability metrics, i.e., the standard deviation of the NDVI anomaly (SD), auto-correlation at lag one of the NDVI anomaly (AC) and the correlation of NDVI anomaly with SPEI (CS). Results show high variability in magnitude and direction for the different stability metrics. Large areas and types of Australian vegetation showed an increase in variability (SD) over time; however, vegetation memory (AC) decreased. The association of NDVI anomalies with drought events (CS) showed a mixed response: the association increased in the western part, while it decreased in the eastern part. This methodology shows the potential for quantifying vegetation responses to major climate shifts and land use change, but results could be enhanced with higher resolution time series data. Full article
Show Figures

Graphical abstract

27 pages, 18344 KiB  
Article
Rebuilding Long Time Series Global Soil Moisture Products Using the Neural Network Adopting the Microwave Vegetation Index
by Panpan Yao 1,2, Jiancheng Shi 2,3,*, Tianjie Zhao 2,3, Hui Lu 3,4 and Amen Al-Yaari 5
1 University of Chinese Academy of Sciences, Beijing 100049
2 State Key Laboratory of Remote Sensing Science, Institute of Remote Sensing and Digital Earth, Chinese Academy of Sciences, Beijing 100101, China
3 The Joint Center for Global Change Studies, Beijing 100875, China
4 Ministry of Education Key Laboratory for Earth System Modeling, Department of Earth System Science, Tsinghua University, Beijing 100084, China
5 INRA, UMR1391 ISPA, 33140 Villenave d’Ornon, France
Remote Sens. 2017, 9(1), 35; https://doi.org/10.3390/rs9010035 - 4 Jan 2017
Cited by 30 | Viewed by 7194 | Correction
Abstract
This study presents a back propagation neural network (BPNN) method to rebuild a global and long-term soil moisture (SM) series, adopting the microwave vegetation index (MVI). The data used in our study include Soil Moisture and Ocean Salinity (SMOS) Level 3 soil moisture [...] Read more.
This study presents a back propagation neural network (BPNN) method to rebuild a global and long-term soil moisture (SM) series, adopting the microwave vegetation index (MVI). The data used in our study include Soil Moisture and Ocean Salinity (SMOS) Level 3 soil moisture (SMOSL3sm) data, the Advanced Microwave Scanning Radiometer-Earth Observing System (AMSR-E), and Advanced Microwave Scanning Radiometer 2 (AMSR2) Level 3 brightness temperature (TB) data and L3 SM products. The BPNNs on each grid were trained over July 2010–June 2011, and the entire year of 2013, with SMOSL3sm as a training target, and taking the reflectivities (Rs) of the C/X/Ku/Ka/Q bands, and the MVI from AMSR-E/AMSR2 TB data, as input, in which the MVI is used to correct for vegetation effects. The training accuracy of networks was evaluated by comparing soil moisture products produced using BPNNs (NNsm hereafter) with SMOSL3sm during the BPNN training period, in terms of correlation coefficient (CC), bias (Bias), and the root mean square error (RMSE). Good global results were obtained with CC = 0.67, RMSE = 0.055 m3/m3 and Bias = −0.0005 m3/m3, particularly over Australia, Central USA, and Central Asia. With these trained networks over each pixel, a global and long-term soil moisture time series, i.e., 2003–2015, was built using AMSR-E TB from 2003 to 2011 and AMSR2 TB from 2012 to 2015. Then, NNsm products were evaluated against in situ SM observations from all SCAN (Soil Climate Analysis Network) sites (SCANsm). The results show that NNsm has a good agreement with in situ data, and can capture the temporal dynamics of in situ SM, with CC = 0.52, RMSE = 0.084 m3/m3 and Bias = −0.002 m3/m3. We also evaluate the accuracy of NNsm by comparing with AMSR-E/AMSR2 SM products, with results of a regression method. As a conclusion, this study provides a promising BPNN method adopting MVI to rebuild a long-term SM time series, and this could provide useful insights for the future Water Cycle Observation Mission (WCOM). Full article
Show Figures

Graphical abstract

20 pages, 6195 KiB  
Article
Compilation and Validation of SAR and Optical Data Products for a Complete and Global Map of Inland/Ocean Water Tailored to the Climate Modeling Community
by Céline Lamarche 1,*, Maurizio Santoro 2, Sophie Bontemps 1, Raphaël D’Andrimont 1, Julien Radoux 1, Laura Giustarini 3, Carsten Brockmann 4, Jan Wevers 4, Pierre Defourny 1 and Olivier Arino 5
1 Earth and Life Institute—Environment, Université catholique de Louvain, Croix du Sud 2, 1348 Louvain-la-Neuve, Belgium
2 GAMMA Remote Sensing AG, 3073 Gümligen, Switzerland
3 Luxembourg Institute of Science and Technology, 5 Avenue des Hauts-Fourneaux, L-4362 Esch/Alzette, Luxembourg
4 Brockmann-Consult GmbH, Max-Planck Str. 2, 21502 Geesthacht, Germany
5 European Space Agency, 00044 Frascati, Italy
Remote Sens. 2017, 9(1), 36; https://doi.org/10.3390/rs9010036 - 11 Jan 2017
Cited by 82 | Viewed by 14214
Abstract
Accurate maps of surface water extent are of paramount importance for water management, satellite data processing and climate modeling. Several maps of water bodies based on remote sensing data have been released during the last decade. Nonetheless, none has a truly (90 [...] Read more.
Accurate maps of surface water extent are of paramount importance for water management, satellite data processing and climate modeling. Several maps of water bodies based on remote sensing data have been released during the last decade. Nonetheless, none has a truly (90 N/90 S) global coverage while being thoroughly validated. This paper describes a global, spatially-complete (void-free) and accurate mask of inland/ocean water for the 2000–2012 period, built in the framework of the European Space Agency (ESA) Climate Change Initiative (CCI). This map results from the synergistic combination of multiple individual SAR and optical water body and auxiliary datasets. A key aspect of this work is the original and rigorous stratified random sampling designed for the quality assessment of binary classifications where one class is marginally distributed. Input and consolidated products were assessed qualitatively and quantitatively against a reference validation database of 2110 samples spread throughout the globe. Using all samples, overall accuracy was always very high among all products, between 98 % and 100 % . The CCI global map of open water bodies provided the best water class representation (F-score of 89 % ) compared to its constitutive inputs. When focusing on the challenging areas for water bodies’ mapping, such as shorelines, lakes and river banks, all products yielded substantially lower accuracy figures with overall accuracies ranging between 74 % and 89 % . The inland water area of the CCI global map of open water bodies was estimated to be 3.17 million km 2 ± 0.24 million km 2 . The dataset is freely available through the ESA CCI Land Cover viewer. Full article
(This article belongs to the Special Issue Validation and Inter-Comparison of Land Cover and Land Use Data)
Show Figures

Graphical abstract

13 pages, 30103 KiB  
Letter
Identification of Statistically Homogeneous Pixels Based on One-Sample Test
by Keng-Fan Lin * and Daniele Perissin
Lyles School of Civil Engineering, Purdue University, West Lafayette, IN 47907, USA
Remote Sens. 2017, 9(1), 37; https://doi.org/10.3390/rs9010037 - 4 Jan 2017
Cited by 21 | Viewed by 5920
Abstract
Statistically homogeneous pixels (SHP) play a crucial role in synthetic aperture radar (SAR) analysis. In past studies, various two-sample tests were applied on multitemporal SAR data stacks under the assumption of having stationary backscattering properties over time. In this letter, we propose the [...] Read more.
Statistically homogeneous pixels (SHP) play a crucial role in synthetic aperture radar (SAR) analysis. In past studies, various two-sample tests were applied on multitemporal SAR data stacks under the assumption of having stationary backscattering properties over time. In this letter, we propose the Robust T-test (TR) to improve the effectiveness of test operation. The TR test reduces the impact of temporal variabilities and outliers, thus helping to identify SHP with assurances of similar temporal behaviors. This method includes three steps: (1) signal suppression; (2) outlier removal; and (3) one-sample test. In the experiments, we apply the TR test on both simulated and real data. Different stack sizes, types of distributions, and hypothesis tests are compared. Results of both experiments signify that the TR test outperforms conventional approaches and provides reliable SHP for SAR image analysis. Full article
Show Figures

Graphical abstract

13 pages, 3406 KiB  
Article
Improving Land Surface Temperature Retrievals over Mountainous Regions
by Virgílio A. Bento 1,*, Carlos C. DaCamara 1, Isabel F. Trigo 1,2, João P. A. Martins 1,2 and Anke Duguay-Tetzlaff 3
1 Instituto Dom Luiz, University of Lisbon, IDL, Campo Grande, Ed. C1, 1749-016 Lisbon, Portugal
2 Instituto Português do Mar e da Atmosfera, I.P., Rua C do Aeroporto, 1749-077 Lisbon, Portugal
3 Federal Office of Meteorology and Climatology MeteoSwiss, Operation Center 1, CH-8058 Zurich-Airport, Switzerland
Remote Sens. 2017, 9(1), 38; https://doi.org/10.3390/rs9010038 - 5 Jan 2017
Cited by 16 | Viewed by 5731
Abstract
Algorithms for Land Surface Temperature (LST) retrieval from infrared measurements are usually sensitive to the amount of water vapor present in the atmosphere. The Satellite Application Facilities on Climate Monitoring and Land Surface Analysis (CM SAF and LSA SAF) are currently compiling a [...] Read more.
Algorithms for Land Surface Temperature (LST) retrieval from infrared measurements are usually sensitive to the amount of water vapor present in the atmosphere. The Satellite Application Facilities on Climate Monitoring and Land Surface Analysis (CM SAF and LSA SAF) are currently compiling a 25 year LST Climate data record (CDR), which uses water vapor information from ERA-Int reanalysis. However, its relatively coarse spatial resolution may lead to systematic errors in the humidity profiles with implications in LST, particularly over mountainous areas. The present study compares LST estimated with three different retrieval algorithms: a radiative transfer-based physical mono-window (PMW), a statistical mono-window (SMW), and a generalized split-windows (GSW). The algorithms were tested over the Alpine region using ERA-Int reanalysis data and relied on the finer spatial scale Consortium for Small-Scale Modelling (COSMO) model data as a reference. Two methods were developed to correct ERA-Int water vapor misestimation: (1) an exponential parametrization of total precipitable water (TPW) appropriate for SMW/GSW; and (2) a level reduction method to be used in PMW. When ERA-Int TPW was used, the algorithm missed the right TPW class in 87% of the cases. When the exponential parametrization was used, the missing class rate decreased to 9%, and when the level reduction method was applied, the LST corrections went up to 1.7 K over the study region. Overall, the correction for pixel orography in TPW leads to corrections in LST estimations, which are relevant to ensure that long-term LST records meet climate requirements, particularly over mountainous regions. Full article
Show Figures

Graphical abstract

21 pages, 17575 KiB  
Article
Woody Vegetation Die off and Regeneration in Response to Rainfall Variability in the West African Sahel
by Martin Brandt 1,*, Gray Tappan 2, Abdoul Aziz Diouf 3, Gora Beye 3, Cheikh Mbow 4 and Rasmus Fensholt 1
1 Department of Geosciences and Natural Resource Management, University of Copenhagen, 1350 Copenhagen, Denmark
2 Data Center Sioux Falls, Earth Resources Observation Systems (EROS), US Geological Survey (USGS), SD 57198, USA
3 Centre de Suivi Ecologique, BP 15532 Dakar-Fann, Senegal
4 ICRAF (World Agroforestry Center), Science Domain 6, 00100 Nairobi, Kenya
Remote Sens. 2017, 9(1), 39; https://doi.org/10.3390/rs9010039 - 5 Jan 2017
Cited by 53 | Viewed by 11043
Abstract
The greening in the Senegalese Sahel has been linked to an increase in net primary productivity, with significant long-term trends being closely related to the woody strata. This study investigates woody plant growth and mortality within greening areas in the pastoral areas of [...] Read more.
The greening in the Senegalese Sahel has been linked to an increase in net primary productivity, with significant long-term trends being closely related to the woody strata. This study investigates woody plant growth and mortality within greening areas in the pastoral areas of Senegal, and how these dynamics are linked to species diversity, climate, soil and human management. We analyse woody cover dynamics by means of multi-temporal and multi-scale Earth Observation, satellite based rainfall and in situ data sets covering the period 1994 to 2015. We find that favourable conditions (forest reserves, low human population density, sufficient rainfall) led to a rapid growth of Combretaceae and Balanites aegyptiaca between 2000 and 2013 with an average increase of 4% woody cover. However, the increasing dominance and low drought resistance of drought prone species bears the risk of substantial woody cover losses following drought years. This was observed in 2014–2015, with a die off of Guiera senegalensis in most places of the study area. We show that woody cover and woody cover trends are closely related to mean annual rainfall, but no clear relationship with rainfall trends was found over the entire study period. The observed spatial and temporal variation contrasts with the simplified labels of “greening” or “degradation”. While in principal a low woody plant diversity negatively impacts regional resilience, the Sahelian system is showing signs of resilience at decadal time scales through widespread increases in woody cover and high regeneration rates after periodic droughts. We have reaffirmed that the woody cover in Sahel responds to its inherent climatic variability and does not follow a linear trend. Full article
(This article belongs to the Special Issue Remote Sensing of Land Degradation and Drivers of Change)
Show Figures

Graphical abstract

11 pages, 3432 KiB  
Letter
AssesSeg—A Command Line Tool to Quantify Image Segmentation Quality: A Test Carried Out in Southern Spain from Satellite Imagery
by Antonio Novelli 1,*, Manuel A. Aguilar 2, Fernando J. Aguilar 2, Abderrahim Nemmaoui 2 and Eufemia Tarantino 1
1 DICATECh, Politecnico di Bari, Via Orabona 4, Bari 70125, Italy
2 Escuela Superior de Ingeniería de la Universidad de Almeria (UAL), Almeria, Ctra. Sacramento, s/n, La Cañada de San Urbano Almería 04120, Spain
Remote Sens. 2017, 9(1), 40; https://doi.org/10.3390/rs9010040 - 5 Jan 2017
Cited by 34 | Viewed by 7110
Abstract
This letter presents the capabilities of a command line tool created to assess the quality of segmented digital images. The executable source code, called AssesSeg, was written in Python 2.7 using open source libraries. AssesSeg (University of Almeria, Almeria, Spain; Politecnico di Bari, [...] Read more.
This letter presents the capabilities of a command line tool created to assess the quality of segmented digital images. The executable source code, called AssesSeg, was written in Python 2.7 using open source libraries. AssesSeg (University of Almeria, Almeria, Spain; Politecnico di Bari, Bari, Italy) implements a modified version of the supervised discrepancy measure named Euclidean Distance 2 (ED2) and was tested on different satellite images (Sentinel-2, Landsat 8, and WorldView-2). The segmentation was applied to plastic covered greenhouse detection in the south of Spain (Almería). AssesSeg outputs were utilized to find the best band combinations for the performed segmentations of the images and showed a clear positive correlation between segmentation accuracy and the quantity of available reference data. This demonstrates the importance of a high number of reference data in supervised segmentation accuracy assessment problems. Full article
Show Figures

Graphical abstract

19 pages, 25727 KiB  
Article
Inside a Cucuteni Settlement: Remote Sensing Techniques for Documenting an Unexplored Eneolithic Site from Northeastern Romania
by Andrei Asăndulesei
Interdisciplinary Research Department—Field Science, Arheoinvest Platform, “Alexandru Ioan Cuza” University of Iași, St. Lascăr Catargi 54, 700107 Iași, Romania
Remote Sens. 2017, 9(1), 41; https://doi.org/10.3390/rs9010041 - 6 Jan 2017
Cited by 39 | Viewed by 8837
Abstract
This paper presents recent results of an integrated non-invasive investigation carried out in a previously unexplored settlement from northeastern Romania, belonging to the last great Eneolithic civilisation of Old Europe, the Cucuteni-Trypillia cultural complex. Although there is a long history of research [...] Read more.
This paper presents recent results of an integrated non-invasive investigation carried out in a previously unexplored settlement from northeastern Romania, belonging to the last great Eneolithic civilisation of Old Europe, the Cucuteni-Trypillia cultural complex. Although there is a long history of research concerning this culture, at only a handful of sites has archaeological research completed a comprehensive planimetric image. This makes it impossible to determine a typological evolution of the internal organisation of Cucutenian sites, both diachronically, across the three great phases of the culture (A, A−B and B for the Romanian area), and spatially, from SE Transylvania to the Republic of Moldova, and towards the steppes of the Ukraine. Accordingly, in certain environmental conditions, many essential behavioural aspects of Cucutenian communities are far from understood. Consequently, the generalisation and integration of non-invasive prospecting methods—Light Detection and Ranging (LiDAR), aerial photography, earth resistivity, magnetometry, and their integration through Geographic Information System (GIS)—clearly represents a feasible alternative for deciphering the Cucuteni culture. These complementary investigation methods were applied for this case study, emphasis being put on the conjoint use of datasets from each technique. On the basis of results recently obtained from the Războieni–Dealul Mare/Dealul Boghiu site, innovative characteristics are described concerning intra-site spatial organisation, a typology of the fortification systems, the existence of ritual or delimitation ditches, and the presence of habitations outside fortified areas. Full article
(This article belongs to the Special Issue Archaeological Prospecting and Remote Sensing)
Show Figures

Graphical abstract

16 pages, 2883 KiB  
Article
Hyperspectral Remote Sensing for Detecting Soil Salinization Using ProSpecTIR-VS Aerial Imagery and Sensor Simulation
by Odílio Coimbra da Rocha Neto 1,*, Adunias Dos Santos Teixeira 1, Raimundo Alípio de Oliveira Leão 1, Luis Clenio Jario Moreira 1 and Lênio Soares Galvão 2
1 Departamento de Engenharia Agrícola, Universidade Federal do Ceará (UFC), Caixa Postal 12.168, Fortaleza CE 60450-760, Brazil
2 Instituto Nacional de Pesquisas Espaciais (INPE), Divisão de Sensoriamento Remoto, Caixa Postal 515, São José dos Campos SP 12245-970, Brazil
Remote Sens. 2017, 9(1), 42; https://doi.org/10.3390/rs9010042 - 6 Jan 2017
Cited by 44 | Viewed by 7542
Abstract
Soil salinization due to irrigation affects agricultural productivity in the semi-arid region of Brazil. In this study, the performance of four computational models to estimate electrical conductivity (EC) (soil salinization) was evaluated using laboratory reflectance spectroscopy. To investigate the influence of bandwidth and [...] Read more.
Soil salinization due to irrigation affects agricultural productivity in the semi-arid region of Brazil. In this study, the performance of four computational models to estimate electrical conductivity (EC) (soil salinization) was evaluated using laboratory reflectance spectroscopy. To investigate the influence of bandwidth and band positioning on the EC estimates, we simulated the spectral resolution of two hyperspectral sensors (airborne ProSpecTIR-VS and orbital Hyperspectral Infrared Imager (HyspIRI)) and three multispectral instruments (RapidEye/REIS, High Resolution Geometric (HRG)/SPOT-5, and Operational Land Imager (OLI)/Landsat-8)). Principal component analysis (PCA) and the first-order derivative analysis were applied to the data to generate metrics associated with soil brightness and spectral features, respectively. The three sets of data (reflectance, PCA, and derivative) were tested as input variable for Extreme Learning Machine (ELM), Ordinary Least Square regression (OLS), Partial Least Squares Regression (PLSR), and Multilayer Perceptron (MLP). Finally, the laboratory models were inverted to a ProSpecTIR-VS image (400–2500 nm) acquired with 1-m spatial resolution in the northeast of Brazil. The objective was to estimate EC over exposed soils detected using the Normalized Difference Vegetation Index (NDVI). The results showed that the predictive ability of the linear models and ELM was better than that of the MLP, as indicated by higher values of the coefficient of determination (R2) and ratio of the performance to deviation (RPD), and lower values of the root mean square error (RMSE). Metrics associated with soil brightness (reflectance and PCA scores) were more efficient in detecting changes in the EC produced by soil salinization than metrics related to spectral features (derivative). When applied to the image, the PLSR model with reflectance had an RMSE of 1.22 dS·m−1 and an RPD of 2.21, and was more suitable for detecting salinization (10–20 dS·m−1) in exposed soils (NDVI < 0.30) than the other models. For all computational models, lower values of RMSE and higher values of RPD were observed for the narrowband-simulated sensors compared to the broadband-simulated instruments. The soil EC estimates improved from the RapidEye to the HRG and OLI spectral resolutions, showing the importance of shortwave intervals (SWIR-1 and SWIR-2) in detecting soil salinization when the reflectance of selected bands is used in data modelling. Full article
Show Figures

Graphical abstract

25 pages, 9623 KiB  
Article
A One-Source Approach for Estimating Land Surface Heat Fluxes Using Remotely Sensed Land Surface Temperature
by Yongmin Yang 1,2, Jianxiu Qiu 3,*, Hongbo Su 4,5,*, Qingmei Bai 6, Suhua Liu 4,7, Lu Li 4,7, Yilei Yu 8,9 and Yaoxian Huang 3
1 State Key Laboratory of Simulation and Regulation of Water Cycle in River Basin, Beijing 100038, China
2 Research Center on Flood and Drought Disaster Reduction of the Ministry of Water Resources, China Institute of Water Resources and Hydropower Research, Beijing 100038, China
3 Guangdong Provincial Key Laboratory of Urbanization and Geo-simulation, School of Geography and Planning, Sun Yat-sen University, Guangzhou 510275, China
4 Key Laboratory of Water Cycle & Related Land Surface Processes, Institute of Geographic Sciences and Natural Resources Research, Beijing 100101, China
5 Department of Civil, Environmental and Geomatics Engineering, Florida Atlantic University, Boca Raton, FL 33431, USA
6 Xi’an Meteorological Bureau, Xi’an 710016, China
7 Graduate University of Chinese Academy of Sciences, Beijing 100049, China
8 Institute of Wetland Research, Chinese Academy of Forestry, Beijing 100091, China
9 Beijing Key Laboratory of Wetland Services and Restoration, Beijing 100091, China
Remote Sens. 2017, 9(1), 43; https://doi.org/10.3390/rs9010043 - 6 Jan 2017
Cited by 13 | Viewed by 6908
Abstract
The partitioning of available energy between sensible heat and latent heat is important for precise water resources planning and management in the context of global climate change. Land surface temperature (LST) is a key variable in energy balance process and remotely sensed LST [...] Read more.
The partitioning of available energy between sensible heat and latent heat is important for precise water resources planning and management in the context of global climate change. Land surface temperature (LST) is a key variable in energy balance process and remotely sensed LST is widely used for estimating surface heat fluxes at regional scale. However, the inequality between LST and aerodynamic surface temperature (Taero) poses a great challenge for regional heat fluxes estimation in one-source energy balance models. To address this issue, we proposed a One-Source Model for Land (OSML) to estimate regional surface heat fluxes without requirements for empirical extra resistance, roughness parameterization and wind velocity. The proposed OSML employs both conceptual VFC/LST trapezoid model and the electrical analog formula of sensible heat flux (H) to analytically estimate the radiometric-convective resistance (rae) via a quartic equation. To evaluate the performance of OSML, the model was applied to the Soil Moisture-Atmosphere Coupling Experiment (SMACEX) in United States and the Multi-Scale Observation Experiment on Evapotranspiration (MUSOEXE) in China, using remotely sensed retrievals as auxiliary data sets at regional scale. Validated against tower-based surface fluxes observations, the root mean square deviation (RMSD) of H and latent heat flux (LE) from OSML are 34.5 W/m2 and 46.5 W/m2 at SMACEX site and 50.1 W/m2 and 67.0 W/m2 at MUSOEXE site. The performance of OSML is very comparable to other published studies. In addition, the proposed OSML model demonstrates similar skills of predicting surface heat fluxes in comparison to SEBS (Surface Energy Balance System). Since OSML does not require specification of aerodynamic surface characteristics, roughness parameterization and meteorological conditions with high spatial variation such as wind speed, this proposed method shows high potential for routinely acquisition of latent heat flux estimation over heterogeneous areas. Full article
(This article belongs to the Special Issue Remote Sensing of Climate Change and Water Resources)
Show Figures

Graphical abstract

19 pages, 4523 KiB  
Article
The Effect of Algal Blooms on Carbon Emissions in Western Lake Erie: An Integration of Remote Sensing and Eddy Covariance Measurements
by Zutao Ouyang 1,*, Changliang Shao 1, Housen Chu 2, Richard Becker 3, Thomas Bridgeman 3,4, Carol A. Stepien 3,4,5, Ranjeet John 1 and Jiquan Chen 1,*
1 Department of Geography, Environment, and Spatial Sciences & Center of Global Change and Earth Observation, Michigan State University, East Lansing, MI 48823, USA
2 Department of Environmental Sciences, Policy, and Management University of California, Berkeley, CA 94720, USA
3 Department of Environmental Sciences, University of Toledo, Toledo, OH 43606, USA
4 Lake Erie Center, University of Toledo, Oregon, OH 43616, USA
5 Ocean Environment Research Division, NOAA PMEL, 7600 Sand Point Way NE, Seattle, WA 98115, USA
Remote Sens. 2017, 9(1), 44; https://doi.org/10.3390/rs9010044 - 6 Jan 2017
Cited by 23 | Viewed by 10082
Abstract
Lakes are important components for regulating carbon cycling within landscapes. Most lakes are regarded as CO2 sources to the atmosphere, except for a few eutrophic ones. Algal blooms are common phenomena in many eutrophic lakes and can cause many environmental stresses, yet [...] Read more.
Lakes are important components for regulating carbon cycling within landscapes. Most lakes are regarded as CO2 sources to the atmosphere, except for a few eutrophic ones. Algal blooms are common phenomena in many eutrophic lakes and can cause many environmental stresses, yet their effects on the net exchange of CO2 (FCO2) at large spatial scales have not been adequately addressed. We integrated remote sensing and Eddy Covariance (EC) technologies to investigate the effects that algal blooms have on FCO2 in the western basin of Lake Erie—a large lake infamous for these blooms. Three years of long-term EC data (2012–2014) at two sites were analyzed. We found that at both sites: (1) daily FCO2 significantly correlated with daily temperature, light, and wind speed during the algal bloom periods; (2) monthly FCO2 was negatively correlated with chlorophyll-a concentration; and (3) the year with larger algal blooms was always associated with lower carbon emissions. We concluded that large algal blooms could reduce carbon emissions in the western basin of Lake Erie. However, considering the complexity of processes within large lakes, the weak relationship we found, and the potential uncertainties that remain in our estimations of FCO2 and chlorophyll-a, we argue that additional data and analyses are needed to validate our conclusion and examine the underlying regulatory mechanisms. Full article
(This article belongs to the Special Issue Remote Sensing of Climate Change and Water Resources)
Show Figures

Graphical abstract

18 pages, 9630 KiB  
Article
The Spatiotemporal Pattern of Urban Expansion in China: A Comparison Study of Three Urban Megaregions
by Wenjuan Yu 1,2 and Weiqi Zhou 1,2,*
1 University of Chinese Academy of Sciences, No. 19A Yuquan Road, Beijing 100049, China
2 State Key Laboratory of Urban and Regional Ecology, Research Center for Eco-Environmental Sciences, Chinese Academy of Sciences, No. 18 Shuangqing Road, Beijing 100085, China
Remote Sens. 2017, 9(1), 45; https://doi.org/10.3390/rs9010045 - 6 Jan 2017
Cited by 77 | Viewed by 8203
Abstract
Urban megaregions have emerged as a new urbanized form. However, previous studies mostly focused on urban expansion at the city scale, particularly for large cities. Understanding urban expansion at the regional scale including cities having different sizes is important for extending current knowledge [...] Read more.
Urban megaregions have emerged as a new urbanized form. However, previous studies mostly focused on urban expansion at the city scale, particularly for large cities. Understanding urban expansion at the regional scale including cities having different sizes is important for extending current knowledge of urban growth and its environmental and ecological impacts. Here, we addressed two questions: (1) How do the extent, rate, and morphological model of urban expansion vary at both the regional and city scales? (2) How do factors, such as city size and expansion rate, influence urban expansion models? We focused on the three largest urban megaregions in China, Beijing-Tianjin-Hebei (BTH), Yangtze River Delta (YRD) and Pearl River Delta (PRD). We quantified and compared the spatiotemporal pattern of urban expansion during 2000–2010 at both the regional and city scales based on remote sensing data. We used correlation analysis and linear regressions to address our research questions. We found that (1) the three urban megaregions experienced rapid and massive urban growth, but the spatiotemporal pattern varied greatly. Urban expansion was dominated by edge-expansion in the BTH, edge-expansion and infilling in the YRD, and infilling in the PRD. Cities in the same megaregion tended to have similar expansion morphology; (2) geographical location influenced the model of urban expansion the most, followed by city size and by its expansion rate. Small-sized cities were more likely to develop in a leapfrogging model, while cities with relatively rapid expansion tended to grow in an edge-expansion model. Full article
(This article belongs to the Special Issue Remote Sensing of Urban Ecology)
Show Figures

Graphical abstract

19 pages, 11533 KiB  
Article
Evaluation of Landsat-Based METRIC Modeling to Provide High-Spatial Resolution Evapotranspiration Estimates for Amazonian Forests
by Izaya Numata 1,*, Kul Khand 2, Jeppe Kjaersgaard 3, Mark A. Cochrane 1 and Sonaira S. Silva 4
1 Geospatial Sciences Center of Excellence, South Dakota State University, Brookings, SD 57007, USA
2 Biosystems and Agricultural Engineering Department, Oklahoma State University, Stillwater, OK 74078, USA
3 South Dakota Water Resources Institute, South Dakota State University, Brookings, SD 57007, USA
4 Campus Floresta, Universidade Federal do Acre, Rio Branco de69920-900, Brazil
Remote Sens. 2017, 9(1), 46; https://doi.org/10.3390/rs9010046 - 6 Jan 2017
Cited by 44 | Viewed by 7935
Abstract
While forest evapotranspiration (ET) dynamics in the Amazon have been studied both as point estimates using flux towers, as well as spatially coarse surfaces using satellite data, higher resolution (e.g., 30 m resolution) ET estimates are necessary to address finer spatial variability associated [...] Read more.
While forest evapotranspiration (ET) dynamics in the Amazon have been studied both as point estimates using flux towers, as well as spatially coarse surfaces using satellite data, higher resolution (e.g., 30 m resolution) ET estimates are necessary to address finer spatial variability associated with forest biophysical characteristics and their changes by natural and human impacts. The objective of this study is to evaluate the potential of the Landsat-based METRIC (Mapping Evapotranspiration at high Resolution with Internalized Calibration) model to estimate high-resolution (30 m) forest ET by comparing to flux tower ET (FT ET) data collected over seasonally dry tropical forests in Rondônia, the southwestern region of the Amazon. Analyses were conducted at daily, monthly and seasonal scales for the dry seasons (June–September for Rondônia) of 2000–2002. Overall daily ET comparison between FT ET and METRIC ET across the study site showed r2 = 0.67 with RMSE = 0.81 mm. For seasonal ET comparison, METRIC-derived ET estimates showed an agreement with FT ET measurements during the dry season of r2 >0.70 and %MAE <15%. We also discuss some challenges and potential applications of METRIC for Amazonian forests. Full article
Show Figures

Graphical abstract

23 pages, 2868 KiB  
Article
Estimating Aboveground Biomass in Tropical Forests: Field Methods and Error Analysis for the Calibration of Remote Sensing Observations
by Fabio Gonçalves 1,*, Robert Treuhaft 2, Beverly Law 3, André Almeida 4, Wayne Walker 5, Alessandro Baccini 5, João Roberto Dos Santos 6 and Paulo Graça 7
1 Canopy Remote Sensing Solutions, Florianópolis, SC 88032, Brazil
2 Jet Propulsion Laboratory, California Institute of Technology, Pasadena, CA 91109, USA
3 Department of Forest Ecosystems & Society, Oregon State University, Corvallis, OR 97331, USA
4 Departamento de Engenharia Agrícola, Universidade Federal de Sergipe, SE 49100, Brazil
5 Woods Hole Research Center, Falmouth, MA 02540, USA
6 National Institute for Space Research (INPE), São José dos Campos, SP 12227, Brazil
7 Department of Environmental Dynamics, National Institute for Research in Amazonia (INPA), Manaus, AM 69067, Brazil
Remote Sens. 2017, 9(1), 47; https://doi.org/10.3390/rs9010047 - 7 Jan 2017
Cited by 25 | Viewed by 11620
Abstract
Mapping and monitoring of forest carbon stocks across large areas in the tropics will necessarily rely on remote sensing approaches, which in turn depend on field estimates of biomass for calibration and validation purposes. Here, we used field plot data collected in a [...] Read more.
Mapping and monitoring of forest carbon stocks across large areas in the tropics will necessarily rely on remote sensing approaches, which in turn depend on field estimates of biomass for calibration and validation purposes. Here, we used field plot data collected in a tropical moist forest in the central Amazon to gain a better understanding of the uncertainty associated with plot-level biomass estimates obtained specifically for the calibration of remote sensing measurements. In addition to accounting for sources of error that would be normally expected in conventional biomass estimates (e.g., measurement and allometric errors), we examined two sources of uncertainty that are specific to the calibration process and should be taken into account in most remote sensing studies: the error resulting from spatial disagreement between field and remote sensing measurements (i.e., co-location error), and the error introduced when accounting for temporal differences in data acquisition. We found that the overall uncertainty in the field biomass was typically 25% for both secondary and primary forests, but ranged from 16 to 53%. Co-location and temporal errors accounted for a large fraction of the total variance (>65%) and were identified as important targets for reducing uncertainty in studies relating tropical forest biomass to remotely sensed data. Although measurement and allometric errors were relatively unimportant when considered alone, combined they accounted for roughly 30% of the total variance on average and should not be ignored. Our results suggest that a thorough understanding of the sources of error associated with field-measured plot-level biomass estimates in tropical forests is critical to determine confidence in remote sensing estimates of carbon stocks and fluxes, and to develop strategies for reducing the overall uncertainty of remote sensing approaches. Full article
(This article belongs to the Special Issue Digital Forest Resource Monitoring and Uncertainty Analysis)
Show Figures

Graphical abstract

23 pages, 38601 KiB  
Article
Progress in Remote Sensing of Photosynthetic Activity over the Amazon Basin
by Celio Helder Resende De Sousa 1,*, Thomas Hilker 2,†, Richard Waring 1, Yhasmin Mendes De Moura 3 and Alexei Lyapustin 4
1 Department of Forest Ecosystems and Society, Oregon State University, Corvallis, OR 97331, USA
2 Department of Forest Engineering, Resources and Management, Oregon State University, Corvallis, OR 97331, USA
3 Instituto Nacional de Pesquisas Espaciais (INPE), Divisão de Sensoriamento Remoto, São José dos Campos, SP 12227-010, Brazil
4 NASA Goddard Space Flight Center, Greenbelt, MD 20771, USA
Deceased.
Remote Sens. 2017, 9(1), 48; https://doi.org/10.3390/rs9010048 - 7 Jan 2017
Cited by 12 | Viewed by 10422
Abstract
Although quantifying the massive exchange of carbon that takes place over the Amazon Basin remains a challenge, progress is being made as the remote sensing community moves from using traditional, reflectance-based vegetation indices, such as the Normalized Difference Vegetation Index (NDVI), to the [...] Read more.
Although quantifying the massive exchange of carbon that takes place over the Amazon Basin remains a challenge, progress is being made as the remote sensing community moves from using traditional, reflectance-based vegetation indices, such as the Normalized Difference Vegetation Index (NDVI), to the more functional Photochemical Reflectance Index (PRI). This new index, together with satellite-derived estimates of canopy light interception and Sun-Induced Fluorescence (SIF), provide improved estimates of Gross Primary Production (GPP). This paper traces the development of these new approaches, compares the results of their analyses from multiple years of data acquired across the Amazon Basin and suggests further improvements in instrument design, data acquisition and processing. We demonstrated that our estimates of PRI are in generally good agreement with eddy-flux tower measurements of photosynthetic light use efficiency (ε) at four sites in the Amazon Basin: r2 values ranged from 0.37 to 0.51 for northern flux sites and to 0.78 for southern flux sites. This is a significant advance over previous approaches seeking to establish a link between global-scale photosynthetic activity and remotely-sensed data. When combined with measurements of Sun-Induced Fluorescence (SIF), PRI provides realistic estimates of seasonal variation in photosynthesis over the Amazon that relate well to the wet and dry seasons. We anticipate that our findings will steer the development of improved approaches to estimate photosynthetic activity over the tropics. Full article
Show Figures

Graphical abstract

21 pages, 4668 KiB  
Article
Detecting Inter-Annual Variations in the Phenology of Evergreen Conifers Using Long-Term MODIS Vegetation Index Time Series
by Laura Ulsig 1,*, Caroline J. Nichol 1,*, Karl F. Huemmrich 2, David R. Landis 3, Elizabeth M. Middleton 4, Alexei I. Lyapustin 4, Ivan Mammarella 5, Janne Levula 6 and Albert Porcar-Castell 7
1 School of GeoSciences, Crew Building, University of Edinburgh, Alexander Crum Brown Road, Edinburgh EH9 3FF, UK
2 Joint Center for Earth Systems Technology (JCET), University of Maryland Baltimore County, Catonsville, MD 20771, USA
3 Global Science & Technology, Greenbelt, MD 20770, USA
4 NASA Goddard Space Flight Center, Earth Sciences, Greenbelt, MD 20771, USA
5 Department of Physics, University of Helsinki, P.O. Box 48, Helsinki 00014, Finland
6 SMEARII, Hyytiälä Forestry Field Station, Deptartment of Physics, University of Helsinki, Hyytiäläntie 124, Korkeakoski FI 35500, Finland
7 Department of Forest Sciences, Viikki Plant Science Center (ViPS), University of Helsinki, P.O. Box 27, Helsinki 00014, Finland
Remote Sens. 2017, 9(1), 49; https://doi.org/10.3390/rs9010049 - 7 Jan 2017
Cited by 50 | Viewed by 7829
Abstract
Long-term observations of vegetation phenology can be used to monitor the response of terrestrial ecosystems to climate change. Satellite remote sensing provides the most efficient means to observe phenological events through time series analysis of vegetation indices such as the Normalized Difference Vegetation [...] Read more.
Long-term observations of vegetation phenology can be used to monitor the response of terrestrial ecosystems to climate change. Satellite remote sensing provides the most efficient means to observe phenological events through time series analysis of vegetation indices such as the Normalized Difference Vegetation Index (NDVI). This study investigates the potential of a Photochemical Reflectance Index (PRI), which has been linked to vegetation light use efficiency, to improve the accuracy of MODIS-based estimates of phenology in an evergreen conifer forest. Timings of the start and end of the growing season (SGS and EGS) were derived from a 13-year-long time series of PRI and NDVI based on a MAIAC (multi-angle implementation of atmospheric correction) processed MODIS dataset and standard MODIS NDVI product data. The derived dates were validated with phenology estimates from ground-based flux tower measurements of ecosystem productivity. Significant correlations were found between the MAIAC time series and ground-estimated SGS (R2 = 0.36–0.8), which is remarkable since previous studies have found it difficult to observe inter-annual phenological variations in evergreen vegetation from satellite data. The considerably noisier NDVI product could not accurately predict SGS, and EGS could not be derived successfully from any of the time series. While the strongest relationship overall was found between SGS derived from the ground data and PRI, MAIAC NDVI exhibited high correlations with SGS more consistently (R2 > 0.6 in all cases). The results suggest that PRI can serve as an effective indicator of spring seasonal transitions, however, additional work is necessary to confirm the relationships observed and to further explore the usefulness of MODIS PRI for detecting phenology. Full article
Show Figures

Graphical abstract

22 pages, 5321 KiB  
Article
Forward Scatter Radar for Air Surveillance: Characterizing the Target-Receiver Transition from Far-Field to Near-Field Regions
by Marta Tecla Falconi *, Davide Comite, Alessandro Galli, Debora Pastina, Pierfrancesco Lombardo and Frank Silvio Marzano
Department of Information Engineering, Electronics and Telecommunications, Sapienza University of Rome, Via Eudossiana, 18, 00184 Rome, Italy
Remote Sens. 2017, 9(1), 50; https://doi.org/10.3390/rs9010050 - 8 Jan 2017
Cited by 19 | Viewed by 9014
Abstract
A generalized electromagnetic model is presented in order to predict the response of forward scatter radar (FSR) systems for air-target surveillance applications in both far-field and near-field conditions. The relevant scattering problem is tackled by developing the Helmholtz–Kirchhoff formula and Babinet’s principle to [...] Read more.
A generalized electromagnetic model is presented in order to predict the response of forward scatter radar (FSR) systems for air-target surveillance applications in both far-field and near-field conditions. The relevant scattering problem is tackled by developing the Helmholtz–Kirchhoff formula and Babinet’s principle to express the scattered and the total fields in typical FSR configurations. To fix the distinctive features of this class of problems, our approach is applied here to metallic targets with canonical rectangular shapes illuminated by a plane wave, but the model can straightforwardly be used to account for more general scenarios. By exploiting suitable approximations, a simple analytical formulation is derived allowing us to efficiently describe the characteristics of the FSR response for a target transitioning with respect to the receiver from far-field to near-field regions. The effects of different target electrical sizes and detection distances on the received signal, as well as the impact of the trajectory of the moving object, are evaluated and discussed. All of the results are shown in terms of quantities normalized to the wavelength and can be generalized to different configurations once the carrier frequency of the FSR system is set. The range of validity of the proposed closed-form approach has been checked by means of numerical analyses, involving comparisons also with a customized implementation of a full-wave commercial CAD tool. The outcomes of this study can pave the way for significant extensions on the applicability of the FSR technique. Full article
(This article belongs to the Special Issue Radar Systems for the Societal Challenges)
Show Figures

Graphical abstract

21 pages, 7113 KiB  
Article
NIR-Red Spectra-Based Disaggregation of SMAP Soil Moisture to 250 m Resolution Based on OzNet in Southeastern Australia
by Nengcheng Chen 1,2,*, Yuqi He 1 and Xiang Zhang 1,3
1 State Key Laboratory of Information Engineering in Surveying, Mapping and Remote Sensing, Wuhan University, Wuhan 430079, China
2 Collaborative Innovation Center of Geospatial Technology, Wuhan University, Wuhan 430079, China
3 Department of Agronomy, Purdue University, West Lafayette, IN 47907, USA
Remote Sens. 2017, 9(1), 51; https://doi.org/10.3390/rs9010051 - 8 Jan 2017
Cited by 26 | Viewed by 6555 | Correction
Abstract
To meet the demand of regional hydrological and agricultural applications, a new method named near infrared-red (NIR-red) spectra-based disaggregation (NRSD) was proposed to perform a disaggregation of Soil Moisture Active Passive (SMAP) products from 36 km to 250 m resolution. The NRSD combined [...] Read more.
To meet the demand of regional hydrological and agricultural applications, a new method named near infrared-red (NIR-red) spectra-based disaggregation (NRSD) was proposed to perform a disaggregation of Soil Moisture Active Passive (SMAP) products from 36 km to 250 m resolution. The NRSD combined proposed normalized soil moisture index (NSMI) with SMAP data to obtain 250 m resolution soil moisture mapping. This NRSD method was validated with the data from in situ OzNet network in May and September 2015. Results showed that NRSD performed a decent downscaling (root-mean-square error (RMSE) = 0.04 m3/m3 and 0.12 m3/m3 in May and September, respectively). Based on the validation, it was found that the proposed NSMI was a new alternative indicator for denoting the heterogeneity of soil moisture at sub-kilometer scales. Attributed to the excellent performance of the NSMI, NRSD has a higher overall accuracy, finer spatial representation within SMAP pixels and wider applicable scope on usability tests for land cover, vegetation density and drought condition than the disaggregation based on physical and theoretical scale change (DISPATCH) has at 250 m resolution. This revealed that the NRSD method is expected to provide soil moisture mapping at 250-resolution for large-scale hydrological and agricultural studies. Full article
Show Figures

Graphical abstract

17 pages, 6684 KiB  
Article
Estimating Savanna Clumping Index Using Hemispherical Photographs Integrated with High Resolution Remote Sensing Images
by Jucai Li 1,2, Wenjie Fan 1,2,*, Yuan Liu 1,2, Gaolong Zhu 3, Jingjing Peng 1,2 and Xiru Xu 1,2
1 Institute of Remote Sensing and Geographic Information System, Peking University, No. 5 Yiheyuan Road, Beijing 100871, China
2 The Beijing Key Laboratory of Spatial Information Integration and 3S Application, Beijing 100871, China
3 Department of Geography, Minjiang University, Fuzhou 350108, China
Remote Sens. 2017, 9(1), 52; https://doi.org/10.3390/rs9010052 - 8 Jan 2017
Cited by 28 | Viewed by 5554
Abstract
In contrast to herbaceous canopies and forests, savannas are grassland ecosystems with sparsely distributed individual trees, so the canopy is spatially heterogeneous and open, whereas the woody cover in savannas, e.g., tree cover, adversely affects ecosystem structures and functions. Studies have shown that [...] Read more.
In contrast to herbaceous canopies and forests, savannas are grassland ecosystems with sparsely distributed individual trees, so the canopy is spatially heterogeneous and open, whereas the woody cover in savannas, e.g., tree cover, adversely affects ecosystem structures and functions. Studies have shown that the dynamics of canopy structure are related to available water, climate, and human activities in the form of porosity, leaf area index (LAI), and clumping index (CI). Therefore, it is important to identify the biophysical parameters of savanna ecosystems, and undertake practical actions for savanna conservation and management. The canopy openness presents a challenge for evaluating canopy LAI and other biophysical parameters, as most remotely sensed methods were developed for homogeneous and closed canopies. Clumping index is a key variable that can represent the clumping effect from spatial distribution patterns of components within a canopy. However, it is a difficult task to measure the clumping index of the moderate resolution savanna pixels directly using optical instruments, such as the Tracing Radiation and Architecture of Canopies, LAI-2000 Canopy Analyzer, or digital hemispherical photography. This paper proposed a new method using hemispherical photographs combined with high resolution remote sensing images to estimate the clumping index of savanna canopies. The effects of single tree LAI, crown density, and herbaceous layer on the clumping index of savanna pixels were also evaluated. The proposed method effectively calculated the clumping index of moderate resolution pixels. The clumping indices of two study regions located in Ejina Banner and Weichang were compared with the clumping index product over China’s landmass. Full article
Show Figures

Figure 1

19 pages, 4917 KiB  
Article
Image Fusion for Spatial Enhancement of Hyperspectral Image via Pixel Group Based Non-Local Sparse Representation
by Jing Yang 1,3, Ying Li 1,*, Jonathan Cheung-Wai Chan 2 and Qiang Shen 3
1 School of Computer Science, Northwestern Polytechnical University, Xi’an 710129, China
2 Department of Electronics and Informatics, Vrije Universiteit Brussel, 1050 Brussels, Belgium
3 Department of Computer Science, Institute of Mathematics, Physics and Computer Science, Aberystwyth University, SY23 3DB Aberystwyth, UK
Remote Sens. 2017, 9(1), 53; https://doi.org/10.3390/rs9010053 - 9 Jan 2017
Cited by 27 | Viewed by 7726
Abstract
Restricted by technical and budget constraints, hyperspectral images (HSIs) are usually obtained with low spatial resolution. In order to improve the spatial resolution of a given hyperspectral image, a new spatial and spectral image fusion approach via pixel group based non-local sparse representation [...] Read more.
Restricted by technical and budget constraints, hyperspectral images (HSIs) are usually obtained with low spatial resolution. In order to improve the spatial resolution of a given hyperspectral image, a new spatial and spectral image fusion approach via pixel group based non-local sparse representation is proposed, which exploits the spectral sparsity and spectral non-local self-similarity of the hyperspectral image. The proposed approach fuses the hyperspectral image with a high-spatial-resolution multispectral image of the same scene to obtain a hyperspectral image with high spatial and spectral resolutions. The input hyperspectral image is used to train the spectral dictionary, while the sparse codes of the desired HSI are estimated by jointly encoding the similar pixels in each pixel group extracted from the high-spatial-resolution multispectral image. To improve the accuracy of the pixel group based non-local sparse representation, the similar pixels in a pixel group are selected by utilizing both the spectral and spatial information. The performance of the proposed approach is tested on two remote sensing image datasets. Experimental results suggest that the proposed method outperforms a number of sparse representation based fusion techniques, and can preserve the spectral information while recovering the spatial details under large magnification factors. Full article
(This article belongs to the Special Issue Spatial Enhancement of Hyperspectral Data and Applications)
Show Figures

Graphical abstract

21 pages, 2526 KiB  
Article
Modeling and Partitioning of Regional Evapotranspiration Using a Satellite-Driven Water-Carbon Coupling Model
by Zhongmin Hu 1,2,*, Genan Wu 1,2, Liangxia Zhang 3, Shenggong Li 1,2, Xianjin Zhu 1, Han Zheng 1,2, Leiming Zhang 1,2, Xiaomin Sun 1,2 and Guirui Yu 1,2
1 Synthesis Research Center of Chinese Ecosystem Research Network, Key Laboratory of Ecosystem Network Observation and Modeling, Institute of Geographic Sciences and Natural Resources Research, Chinese Academy of Sciences, Beijing 100101, China
2 University of Chinese Academy of Sciences, Beijing 100039, China
3 Jiangsu Key Laboratory of Agricultural Meteorology, and College of Applied Meteorology, Nanjing University of Information Science and Technology, Nanjing 210044, China
Remote Sens. 2017, 9(1), 54; https://doi.org/10.3390/rs9010054 - 10 Jan 2017
Cited by 38 | Viewed by 6705
Abstract
The modeling and partitioning of regional evapotranspiration (ET) are key issues in global hydrological and ecological research. We incorporated a stomatal conductance model and a light-use efficiency-based gross primary productivity (GPP) model into the Shuttleworth–Wallace model to develop a simplified carbon-water coupling model, [...] Read more.
The modeling and partitioning of regional evapotranspiration (ET) are key issues in global hydrological and ecological research. We incorporated a stomatal conductance model and a light-use efficiency-based gross primary productivity (GPP) model into the Shuttleworth–Wallace model to develop a simplified carbon-water coupling model, SWH, for estimating ET using meteorological and remote sensing data. To enable regional application of the SWH model, we optimized key parameters with measurements from global eddy covariance (EC) tower sites. In addition, we estimated soil water content with the principle of the bucket system. The model prediction of ET agreed well with the estimates obtained with the EC measurements, with an average R2 of 0.77 and a root mean square error of 0.72 mm·day−1. The model performance was generally better for woody ecosystems than herbaceous ecosystems. Finally, the spatial patterns of ET and relevant model outputs (i.e., GPP, water-use efficiency and the ratio of soil water evaporation to ET) in China with the model simulations were assessed. Full article
Show Figures

Graphical abstract

21 pages, 3410 KiB  
Article
Estimating Biomass of Native Grass Grown under Complex Management Treatments Using WorldView-3 Spectral Derivatives
by Mbulisi Sibanda 1,*, Onisimo Mutanga 1, Mathieu Rouget 1 and Lalit Kumar 2
1 School of Agriculture, Earth and Environmental Science, University of KwaZulu-Natal, P. Bag X01, Scottsville, Pietermaritzburg 3209, South Africa
2 School of Environmental & Rural Science, University of New England, Armidale NSW 2351, Australia
Remote Sens. 2017, 9(1), 55; https://doi.org/10.3390/rs9010055 - 11 Jan 2017
Cited by 63 | Viewed by 8378
Abstract
The ability of texture models and red-edge to facilitate the detection of subtle structural vegetation traits could aid in discriminating and mapping grass quantity, a challenge that has been longstanding in the management of grasslands in southern Africa. Subsequently, this work sought to [...] Read more.
The ability of texture models and red-edge to facilitate the detection of subtle structural vegetation traits could aid in discriminating and mapping grass quantity, a challenge that has been longstanding in the management of grasslands in southern Africa. Subsequently, this work sought to explore the robustness of integrating texture metrics and red-edge in predicting the above-ground biomass of grass growing under different levels of mowing and burning in grassland management treatments. Based on the sparse partial least squares regression algorithm, the results of this study showed that red-edge vegetation indices improved above-ground grass biomass from a root mean square error of perdition (RMSEP) of 0.83 kg/m2 to an RMSEP of 0.55 kg/m2. Texture models further improved the accuracy of grass biomass estimation to an RMSEP of 0.35 kg/m2. The combination of texture models and red-edge derivatives (red-edge-derived vegetation indices) resulted in an optimal prediction accuracy of RMSEP 0.2 kg/m2 across all grassland management treatments. These results illustrate the prospect of combining texture metrics with the red-edge in predicting grass biomass across complex grassland management treatments. This offers the detailed spatial information required for grassland policy-making and sustainable grassland management in data-scarce regions such as southern Africa. Full article
(This article belongs to the Special Issue Remote Sensing of Above Ground Biomass)
Show Figures

Graphical abstract

8 pages, 5293 KiB  
Letter
Pointing Verification Method for Spaceborne Lidars
by Axel Amediek * and Martin Wirth
Deutsches Zentrum für Luft- und Raumfahrt, Institut für Physik der Atmosphäre, Oberpfaffenhofen, Münchener Str. 20, 82234 Wessling, Germany
Remote Sens. 2017, 9(1), 56; https://doi.org/10.3390/rs9010056 - 10 Jan 2017
Cited by 6 | Viewed by 5935
Abstract
High precision acquisition of atmospheric parameters from the air or space by means of lidar requires accurate knowledge of laser pointing. Discrepancies between the assumed and actual pointing can introduce large errors due to the Doppler effect or a wrongly assumed air pressure [...] Read more.
High precision acquisition of atmospheric parameters from the air or space by means of lidar requires accurate knowledge of laser pointing. Discrepancies between the assumed and actual pointing can introduce large errors due to the Doppler effect or a wrongly assumed air pressure at ground level. In this paper, a method for precisely quantifying these discrepancies for airborne and spaceborne lidar systems is presented. The method is based on the comparison of ground elevations derived from the lidar ranging data with high-resolution topography data obtained from a digital elevation model and allows for the derivation of the lateral and longitudinal deviation of the laser beam propagation direction. The applicability of the technique is demonstrated by using experimental data from an airborne lidar system, confirming that geo-referencing of the lidar ground spot trace with an uncertainty of less than 10 m with respect to the used digital elevation model (DEM) can be obtained. Full article
Show Figures

Graphical abstract

15 pages, 10596 KiB  
Article
Detection of Water Bodies from AVHRR Data—A TIMELINE Thematic Processor
by Andreas J. Dietz *, Igor Klein, Ursula Gessner, Corinne M. Frey, Claudia Kuenzer and Stefan Dech
German Remote Sensing Data Center (DFD), Earth Observation Center (EOC), German Aerospace Center (DLR), Oberpfaffenhofen, 82234 Wessling, Germany
Remote Sens. 2017, 9(1), 57; https://doi.org/10.3390/rs9010057 - 10 Jan 2017
Cited by 17 | Viewed by 6257
Abstract
The assessment of water body dynamics is not only in itself a topic of strong demand, but the presence of water bodies is important information when it comes to the derivation of products such as land surface temperature, leaf area index, or snow/ice [...] Read more.
The assessment of water body dynamics is not only in itself a topic of strong demand, but the presence of water bodies is important information when it comes to the derivation of products such as land surface temperature, leaf area index, or snow/ice cover mapping from satellite data. For the TIMELINE project, which aims to derive such products for a long time series of Advanced Very High Resolution Radiometer (AVHRR) data for Europe, precise water masks are therefore not only an important stand-alone product themselves, they are also an essential interstage information layer, which has to be produced automatically after preprocessing of the raw satellite data. The respective orbit segments from AVHRR are usually more than 2000 km wide and several thousand km long, thus leading to fundamentally different observation geometries, including varying sea surface temperatures, wave patterns, and sediment and algae loads. The water detection algorithm has to be able to manage these conditions based on a limited amount of spectral channels and bandwidths. After reviewing and testing already available methods for water body detection, we concluded that they cannot fully overcome the existing challenges and limitations. Therefore an extended approach was implemented, which takes into account the variations of the reflectance properties of water surfaces on a local to regional scale; the dynamic local threshold determination will train itself automatically by extracting a coarse-scale classification threshold, which is refined successively while analyzing subsets of the orbit segment. The threshold is then interpolated by fitting a minimum curvature surface before additional steps also relying on the brightness temperature are included to reduce possible misclassifications. The classification results have been validated using Landsat and Moderate Resolution Imaging Spectroradiometer (MODIS) data and proven an overall accuracy of 93.4%, with the majority of errors being connected to flawed geolocation accuracy of the AVHRR data. The presented approach enables the derivation of long-term water body time series from AVHRR data and is the basis for applied geoscientific studies on large-scale water body dynamics. Full article
Show Figures

Graphical abstract

17 pages, 8069 KiB  
Article
UAV-Borne Profiling Radar for Forest Research
by Yuwei Chen 1,*, Teemu Hakala 1, Mika Karjalainen 1, Ziyi Feng 1,2, Jian Tang 1,3, Paula Litkey 1, Antero Kukko 1, Anttoni Jaakkola 1 and Juha Hyyppä 1
1 Department of Remote Sensing and Photogrammetry, Finnish Geospatial Research Institute, Geodeetinrinne 2, 02431 Kirkkonummi, Finland
2 Department of Network Communication, Aalto University, 02150 Espoo, Finland
3 GNSS Research Center, Wuhan University, 129 Luoyu Road, Wuhan, 430079, China
Remote Sens. 2017, 9(1), 58; https://doi.org/10.3390/rs9010058 - 10 Jan 2017
Cited by 32 | Viewed by 9364
Abstract
Microwave Radar is an attractive solution for forest mapping and inventories because microwave signals penetrates into the forest canopy and the backscattering signal can provide information regarding the whole forest structure. Satellite-borne and airborne imaging radars have been used in forest resources mapping [...] Read more.
Microwave Radar is an attractive solution for forest mapping and inventories because microwave signals penetrates into the forest canopy and the backscattering signal can provide information regarding the whole forest structure. Satellite-borne and airborne imaging radars have been used in forest resources mapping for many decades. However, their accuracy with respect to the main forest inventory attributes substantially varies depending on the wavelength and techniques used in the estimation. Systems providing canopy backscatter as a function of canopy height are, practically speaking, missing. Therefore, there is a need for a radar system that would enable the scientific community to better understand the radar backscatter response from the forest canopy. Consequently, we undertook a research study to develop an unmanned aerial vehicle (UAV)-borne profiling (i.e., waveform) radar that could be used to improve the understanding of the radar backscatter response for forestry mapping and inventories. A frequency modulation continuous waveform (FMCW) profiling radar, termed FGI-Tomoradar, was introduced, designed and tested. One goal is the total weight of the whole system is less than 7 kg, including the radar system and georeferencing system, with centimetre-level positioning accuracy. Achieving this weight goal would enable the FGI-Tomoradar system to be installed on the Mini-UAV platform. The prototype system had all four linear polarization measuring capabilities, with bistatic configuration in Ku-band. In system performance tests in this study, FGI-Tomoradar was mounted on a manned helicopter together with a Riegl VQ-480-U laser scanner and tested in several flight campaigns performed at the Evo site, Finland. Airborne laser scanning data was simultaneously collected to investigate the differences and similarities of the outputs for the same target area for better understanding the penetration of the microwave signal into the forest canopy. Preliminary analysis confirmed that the profiling radar measures a clear signal from the canopy structure and has substantial potential to improve our understanding of radar forest mapping using the UAV platform. Full article
Show Figures

Graphical abstract

16 pages, 5689 KiB  
Article
Estimating Canopy Gap Fraction Using ICESat GLAS within Australian Forest Ecosystems
by Craig Mahoney 1,*, Chris Hopkinson 1, Natascha Kljun 2 and Eva Van Gorsel 3
1 Department of Geography, University of Lethbridge, Lethbridge, AB T1K 3M4, Canada
2 Department of Geography, Swansea University, Singleton Park, Swansea SA2 8PP, UK
3 CSIRO Oceans and Atmosphere, Wilf Crane Crescent, Yarralumla ACT 2600, Australia
Remote Sens. 2017, 9(1), 59; https://doi.org/10.3390/rs9010059 - 11 Jan 2017
Cited by 9 | Viewed by 6395
Abstract
Spaceborne laser altimetry waveform estimates of canopy Gap Fraction (GF) vary with respect to discrete return airborne equivalents due to their greater sensitivity to reflectance differences between canopy and ground surfaces resulting from differences in footprint size, energy thresholding, noise characteristics and sampling [...] Read more.
Spaceborne laser altimetry waveform estimates of canopy Gap Fraction (GF) vary with respect to discrete return airborne equivalents due to their greater sensitivity to reflectance differences between canopy and ground surfaces resulting from differences in footprint size, energy thresholding, noise characteristics and sampling geometry. Applying scaling factors to either the ground or canopy portions of waveforms has successfully circumvented this issue, but not at large scales. This study develops a method to scale spaceborne altimeter waveforms by identifying which remotely-sensed vegetation, terrain and environmental attributes are best suited to predicting scaling factors based on an independent measure of importance. The most important attributes were identified as: soil phosphorus and nitrogen contents, vegetation height, MODIS vegetation continuous fields product and terrain slope. Unscaled and scaled estimates of GF are compared to corresponding ALS data for all available data and an optimized subset, where the latter produced most encouraging results (R2 = 0.89, RMSE = 0.10). This methodology shows potential for successfully refining estimates of GF at large scales and identifies the most suitable attributes for deriving appropriate scaling factors. Large-scale active sensor estimates of GF can establish a baseline from which future monitoring investigations can be initiated via upcoming Earth Observation missions. Full article
Show Figures

Graphical abstract

13 pages, 4696 KiB  
Article
First Results of a Tandem Terrestrial-Unmanned Aerial mapKITE System with Kinematic Ground Control Points for Corridor Mapping
by Pere Molina 1,*, Marta Blázquez 1, Davide A. Cucci 2 and Ismael Colomina 1
1 GeoNumerics, Avda. Carl Friedrich Gauss 11, E08860 Castelldefels, Spain
2 Geodetic Engineering Laboratory (TOPO), École Polytécthnique Fédéral de Lausanne (EPFL), Batiment GC Station 18, CH-1015 Lausanne, Switzerland
Remote Sens. 2017, 9(1), 60; https://doi.org/10.3390/rs9010060 - 11 Jan 2017
Cited by 16 | Viewed by 6897
Abstract
In this article, we report about the first results of the mapKITE system, a tandem terrestrial-aerial concept for geodata acquisition and processing, obtained in corridor mapping missions. The system combines an Unmanned Aerial System (UAS) and a Terrestrial Mobile Mapping System (TMMS) operated [...] Read more.
In this article, we report about the first results of the mapKITE system, a tandem terrestrial-aerial concept for geodata acquisition and processing, obtained in corridor mapping missions. The system combines an Unmanned Aerial System (UAS) and a Terrestrial Mobile Mapping System (TMMS) operated in a singular way: real-time waypoints are computed from the TMMS platform and sent to the UAS in a follow-me scheme. This approach leads to a simultaneous acquisition of aerial-plus-ground geodata and, moreover, opens the door to an advanced post-processing approach for sensor orientation. The current contribution focuses on analysing the impact of the new, dynamic Kinematic Ground Control Points (KGCPs), which arise inherently from the mapKITE paradigm, as an alternative to conventional, costly Ground Control Points (GCPs). In the frame of a mapKITE campaign carried out in June 2016, we present results entailing sensor orientation and calibration accuracy assessment through ground check points, and precision and correlation analysis of self-calibration parameters’ estimation. Conclusions indicate that the mapKITE concept eliminates the need for GCPs when using only KGCPs plus a couple of GCPs at each corridor end, achieving check point horizontal accuracy of μ E , N 1.7 px (3.4 cm) and μ h 4.3 px (8.6 cm). Since obtained from a simplified version of the system, these preliminary results are encouraging from a future perspective. Full article
(This article belongs to the Special Issue Recent Trends in UAV Remote Sensing)
Show Figures

Graphical abstract

31 pages, 6705 KiB  
Article
Atmospheric Corrections and Multi-Conditional Algorithm for Multi-Sensor Remote Sensing of Suspended Particulate Matter in Low-to-High Turbidity Levels Coastal Waters
by Stéfani Novoa 1, David Doxaran 1,*, Anouck Ody 1, Quinten Vanhellemont 2, Virginie Lafon 3, Bertrand Lubac 4 and Pierre Gernez 5
1 Laboratoire d’Océanographie de Villefranche, UMR7093 CNRS/UPMC, 181 Chemin du Lazaret, 06230 Villefranche-sur-Mer, France
2 Royal Belgian Institute of Natural Sciences, Brussels 1000, Belgium
3 GEO-Transfert, UMR 5805 Environnements et Paléo-environnements Océaniques et Continentaux (EPOC), Université de Bordeaux, Allée Geoffroy Saint-Hilaire, 33615 Pessac, France
4 UMR CNRS 5805 EPOC, OASU, Université de Bordeaux, site de Talence, Bâtiment B18, Allée Geoffroy Saint-Hilaire, 33615 Bordeaux Cedex, France
5 Mer Molécules Santé (EA 2160 MMS), Université de Nantes, 2 rue de la Houssinière BP 92208, 44322 Nantes Cedex 3, France
Remote Sens. 2017, 9(1), 61; https://doi.org/10.3390/rs9010061 - 12 Jan 2017
Cited by 159 | Viewed by 14326
Abstract
The accurate measurement of suspended particulate matter (SPM) concentrations in coastal waters is of crucial importance for ecosystem studies, sediment transport monitoring, and assessment of anthropogenic impacts in the coastal ocean. Ocean color remote sensing is an efficient tool to monitor SPM spatio-temporal [...] Read more.
The accurate measurement of suspended particulate matter (SPM) concentrations in coastal waters is of crucial importance for ecosystem studies, sediment transport monitoring, and assessment of anthropogenic impacts in the coastal ocean. Ocean color remote sensing is an efficient tool to monitor SPM spatio-temporal variability in coastal waters. However, near-shore satellite images are complex to correct for atmospheric effects due to the proximity of land and to the high level of reflectance caused by high SPM concentrations in the visible and near-infrared spectral regions. The water reflectance signal (ρw) tends to saturate at short visible wavelengths when the SPM concentration increases. Using a comprehensive dataset of high-resolution satellite imagery and in situ SPM and water reflectance data, this study presents (i) an assessment of existing atmospheric correction (AC) algorithms developed for turbid coastal waters; and (ii) a switching method that automatically selects the most sensitive SPM vs. ρw relationship, to avoid saturation effects when computing the SPM concentration. The approach is applied to satellite data acquired by three medium-high spatial resolution sensors (Landsat-8/Operational Land Imager, National Polar-Orbiting Partnership/Visible Infrared Imaging Radiometer Suite and Aqua/Moderate Resolution Imaging Spectrometer) to map the SPM concentration in some of the most turbid areas of the European coastal ocean, namely the Gironde and Loire estuaries as well as Bourgneuf Bay on the French Atlantic coast. For all three sensors, AC methods based on the use of short-wave infrared (SWIR) spectral bands were tested, and the consistency of the retrieved water reflectance was examined along transects from low- to high-turbidity waters. For OLI data, we also compared a SWIR-based AC (ACOLITE) with a method based on multi-temporal analyses of atmospheric constituents (MACCS). For the selected scenes, the ACOLITE-MACCS difference was lower than 7%. Despite some inaccuracies in ρw retrieval, we demonstrate that the SPM concentration can be reliably estimated using OLI, MODIS and VIIRS, regardless of their differences in spatial and spectral resolutions. Match-ups between the OLI-derived SPM concentration and autonomous field measurements from the Loire and Gironde estuaries’ monitoring networks provided satisfactory results. The multi-sensor approach together with the multi-conditional algorithm presented here can be applied to the latest generation of ocean color sensors (namely Sentinel2/MSI and Sentinel3/OLCI) to study SPM dynamics in the coastal ocean at higher spatial and temporal resolutions. Full article
(This article belongs to the Special Issue Water Optics and Water Colour Remote Sensing)
Show Figures

Graphical abstract

38 pages, 323 KiB  
Editorial
Acknowledgement to Reviewers of Remote Sensing in 2016
by Remote Sensing Editorial Office
MDPI AG, St. Alban-Anlage 66, 4052 Basel, Switzerland
Remote Sens. 2017, 9(1), 62; https://doi.org/10.3390/rs9010062 - 12 Jan 2017
Viewed by 9809
Abstract
The editors of Remote Sensing would like to express their sincere gratitude to the following reviewers for assessing manuscripts in 2016.[...] Full article
25 pages, 3336 KiB  
Article
Evaluation of Methods for Aerodynamic Roughness Length Retrieval from Very High-Resolution Imaging LIDAR Observations over the Heihe Basin in China
by Robin Faivre 1,*, Jérôme Colin 1 and Massimo Menenti 2,3
1 ICube Laboratory, UMR 7357 CNRS-University of Strasbourg, F-67412 Illkirch Cedex, France
2 Department of Geoscience and Remote Sensing (GRS), Delft University of Technology, 2628 CN Delft, The Netherlands
3 State Key Laboratory of Remote Sensing Science, Institute of Remote Sensing and Digital Earth, Chinese Academy of Sciences, Beijing 100101, China
Remote Sens. 2017, 9(1), 63; https://doi.org/10.3390/rs9010063 - 12 Jan 2017
Cited by 18 | Viewed by 6183
Abstract
The parameterization of heat transfer based on remote sensing data, and the Surface Energy Balance System (SEBS) scheme to retrieve turbulent heat fluxes, already proved to be very appropriate for estimating evapotranspiration (ET) over homogeneous land surfaces. However, the use of such a [...] Read more.
The parameterization of heat transfer based on remote sensing data, and the Surface Energy Balance System (SEBS) scheme to retrieve turbulent heat fluxes, already proved to be very appropriate for estimating evapotranspiration (ET) over homogeneous land surfaces. However, the use of such a method over heterogeneous landscapes (e.g., semi-arid regions or agricultural land) becomes more difficult, since the principle of similarity theory is compromised by the presence of different heat sources at various heights. This study aims to propose and evaluate some models based on vegetation geometry partly developed by Colin and Faivre, to retrieve the surface aerodynamic roughness length for momentum transfer ( z 0 m ), which is a key parameter in the characterization of heat transfer. A new approach proposed by the authors consisted in the use of a Digital Surface Model (DSM) as boundary condition for experiments with a Computational Fluid Dynamics (CFD) model to reproduce 3D wind fields, and to invert them to retrieve a spatialized roughness parameter. Colin and Faivre also applied the geometrical Raupach’s approach for the same purpose. These two methods were evaluated against two empirical ones, widely used in Surface Energy Balance Index (SEBI) based algorithms (Moran; Brutsaert), and also against an alternate geometrical model proposed by Menenti and Ritchie. The investigation was carried out in the Yingke oasis (China) using very-high resolution remote sensing data (VNIR, TIR & LIDAR), for a precise description of the land surface, and a fine evaluation of estimated heat fluxes based on in-situ measurements. A set of five numerical experiments was carried out to evaluate each roughness model. It appears that methods used in experiments 2 (based on Brutsaert) and 4 (based on Colin and Faivre) are the most accurate to estimate the aerodynamic roughness length, according to the estimated heat fluxes. However, the formulation used in experiment 2 allows to minimize errors in both latent and sensible heat flux, and to preserve a good partitioning. An additional evaluation of these two methods based on another k B 1 parameterization could be necessary, given that the latter is not always compatible with the CFD-based retrieval method. Full article
Show Figures

Graphical abstract

26 pages, 9059 KiB  
Article
Intercomparison of XH2O Data from the GOSAT TANSO-FTS (TIR and SWIR) and Ground-Based FTS Measurements: Impact of the Spatial Variability of XH2O on the Intercomparison
by Hirofumi Ohyama 1,*, Shuji Kawakami 2, Kei Shiomi 2, Isamu Morino 3 and Osamu Uchino 3
1 Institute for Space-Earth Environmental Research (ISEE), Nagoya University, Nagoya 464-8601, Japan
2 Japan Aerospace Exploration Agency (JAXA), 2-1-1 Sengen, Tsukuba 305-8505, Japan
3 National Institute for Environmental Studies (NIES), 16-2 Onogawa, Tsukuba 305-8506, Japan
Remote Sens. 2017, 9(1), 64; https://doi.org/10.3390/rs9010064 - 12 Jan 2017
Cited by 7 | Viewed by 6322
Abstract
Spatial and temporal variability of atmospheric water vapor (H2O) is extremely high, and therefore it is difficult to accurately evaluate the measurement precision of H2O data by a simple comparison between the data derived from two different instruments. We [...] Read more.
Spatial and temporal variability of atmospheric water vapor (H2O) is extremely high, and therefore it is difficult to accurately evaluate the measurement precision of H2O data by a simple comparison between the data derived from two different instruments. We determined the measurement precisions of column-averaged dry-air mole fractions of H2O (XH2O) retrieved independently from spectral radiances in the thermal infrared (TIR) and the short-wavelength infrared (SWIR) regions measured using a Thermal And Near-infrared Sensor for carbon Observation-Fourier Transform Spectrometer (TANSO-FTS) onboard the Greenhouse gases Observing SATellite (GOSAT), by an intercomparison between the two TANSO-FTS XH2O data products and the ground-based FTS XH2O data. Furthermore, the spatial variability of XH2O was also estimated in the intercomparison process. Mutually coincident XH2O data above land for the period ranging from April 2009 to May 2014 were intercompared with different spatial coincidence criteria. We found that the precisions of the TANSO-FTS TIR and TANSO-FTS SWIR XH2O were 7.3%–7.7% and 3.5%–4.5%, respectively, and that the spatial variability of XH2O was 6.7% within a radius of 50 km and 18.5% within a radius of 200 km. These results demonstrate that, in order to accurately evaluate the measurement precision of XH2O, it is necessary to set more rigorous spatial coincidence criteria or to take into account the spatial variability of XH2O as derived in the present study. Full article
Show Figures

Graphical abstract

19 pages, 42438 KiB  
Article
Spatiotemporal Variability of Land Surface Phenology in China from 2001–2014
by Zhaohui Luo and Shixiao Yu *
State Key Laboratory of Biocontrol/Guangzhou Key Laboratory of Urban Landscape Dynamics, Department of Ecology, School of Life Sciences Sun Yat-sen University, Guangzhou 510275, China
Remote Sens. 2017, 9(1), 65; https://doi.org/10.3390/rs9010065 - 12 Jan 2017
Cited by 45 | Viewed by 6400
Abstract
Land surface phenology is a highly sensitive and simple indicator of vegetation dynamics and climate change. However, few studies on spatiotemporal distribution patterns and trends in land surface phenology across different climate and vegetation types in China have been conducted since 2000, a [...] Read more.
Land surface phenology is a highly sensitive and simple indicator of vegetation dynamics and climate change. However, few studies on spatiotemporal distribution patterns and trends in land surface phenology across different climate and vegetation types in China have been conducted since 2000, a period during which China has experienced remarkably strong El Niño events. In addition, even fewer studies have focused on changes of the end of season (EOS) and length of season (LOS) despite their importance. In this study, we used four methods to reconstruct Moderate Resolution Imaging Spectroradiometer (MODIS) Enhanced Vegetation Index (EVI) dataset and chose the best smoothing result to estimate land surface phenology. Then, the phenophase trends were analyzed via the Mann-Kendall method. We aimed to assess whether trends in land surface phenology have continued since 2000 in China at both national and regional levels. We also sought to determine whether trends in land surface phenology in subtropical or high altitude areas are the same as those observed in high latitude areas and whether those trends are uniform among different vegetation types. The result indicated that the start of season (SOS) was progressively delayed with increasing latitude and altitude. In contrast, EOS exhibited an opposite trend in its spatial distribution, and LOS showed clear spatial patterns over this region that decreased from south to north and from east to west at a national scale. The trend of SOS was advanced at a national level, while the trend in Southern China and the Tibetan Plateau was opposite to that in Northern China. The transaction zone of the SOS within Northern China and Southern China occurred approximately between 31.4°N and 35.2°N. The trend in EOS and LOS were delayed and extended, respectively, at both national and regional levels except that of LOS in the Tibetan Plateau, which was shortened by delayed SOS onset more than by delayed EOS onset. The absolute magnitude of SOS was decreased after 2000 compared with previous studies, and the phenophase trends are species specific. Full article
Show Figures

Graphical abstract

16 pages, 11108 KiB  
Article
Investigation of Urbanization Effects on Land Surface Phenology in Northeast China during 2001–2015
by Rui Yao 1,†, Lunche Wang 1,*,†, Xin Huang 2,*,†, Xian Guo 3, Zigeng Niu 1 and Hongfu Liu 1
1 Laboratory of Critical Zone Evolution, School of Earth Sciences, China University of Geosciences, Wuhan 430074, China
2 School of Remote Sensing and Information Engineering, Wuhan University, Wuhan 430079, China
3 State Key Laboratory of Resources and Environmental Information Systems, Institute of Geographic Sciences and Natural Resources Research, Chinese Academy of Sciences, Beijing 100101, China
These authors contributed equally to this work.
Remote Sens. 2017, 9(1), 66; https://doi.org/10.3390/rs9010066 - 12 Jan 2017
Cited by 54 | Viewed by 7490
Abstract
The urbanization effects on land surface phenology (LSP) have been investigated by many studies, but few studies have focused on the temporal variations of urbanization effects on LSP. In this study, we used the Moderate-resolution Imaging Spectroradiometer (MODIS) Enhanced Vegetation Index (EVI), MODIS [...] Read more.
The urbanization effects on land surface phenology (LSP) have been investigated by many studies, but few studies have focused on the temporal variations of urbanization effects on LSP. In this study, we used the Moderate-resolution Imaging Spectroradiometer (MODIS) Enhanced Vegetation Index (EVI), MODIS Land Surface Temperature (LST) data and China’s Land Use/Cover Datasets (CLUDs) to investigate the temporal variations of urban heat island intensity (UHII) and urbanization effects on LSP in Northeast China during 2001–2015. LST and phenology differences between urban and rural areas represented the urban heat island intensity and urbanization effects on LSP, respectively. A Mann–Kendall nonparametric test and Sen’s slope were used to evaluate the trends of urbanization effects on LSP and urban heat island intensity. The results indicated that the average LSP during 2001–2015 was characterized by high spatial heterogeneity. The start of the growing season (SOS) in old urban areas had become earlier and earlier compared to rural areas, and the differences in SOS between urbanized areas and rural areas changed greatly during 2001–2015 (−0.79 days/year, p < 0.01). Meanwhile, the length of the growing season (LOS) in urban and adjacent areas had become increasingly longer than rural areas, especially in urbanized areas (0.92 days/year, p < 0.01), but the differences in the end of the growing season (EOS) between urban and adjacent areas did not change significantly. Next, the UHII increased in spring and autumn during the whole study period. Moreover, the correlation analysis indicated that the increasing urban heat island intensity in spring contributed greatly to the increases of urbanization effects on SOS, but the increasing urban heat island intensity in autumn did not lead to the increases of urbanization effects on EOS in Northeast China. Full article
Show Figures

Graphical abstract

21 pages, 10827 KiB  
Article
Spectral–Spatial Classification of Hyperspectral Imagery with 3D Convolutional Neural Network
by Ying Li 1,*, Haokui Zhang 1 and Qiang Shen 2
1 School of Computer Science, Northwestern Polytechnical University, Xi’an 710129, Shaanxi, China
2 Department of Computer Science, Institute of Mathematics, Physics and Computer Science, Aberystwyth University, Aberystwyth SY23 3DB, UK
Remote Sens. 2017, 9(1), 67; https://doi.org/10.3390/rs9010067 - 13 Jan 2017
Cited by 1105 | Viewed by 36278
Abstract
Recent research has shown that using spectral–spatial information can considerably improve the performance of hyperspectral image (HSI) classification. HSI data is typically presented in the format of 3D cubes. Thus, 3D spatial filtering naturally offers a simple and effective method for simultaneously extracting [...] Read more.
Recent research has shown that using spectral–spatial information can considerably improve the performance of hyperspectral image (HSI) classification. HSI data is typically presented in the format of 3D cubes. Thus, 3D spatial filtering naturally offers a simple and effective method for simultaneously extracting the spectral–spatial features within such images. In this paper, a 3D convolutional neural network (3D-CNN) framework is proposed for accurate HSI classification. The proposed method views the HSI cube data altogether without relying on any preprocessing or post-processing, extracting the deep spectral–spatial-combined features effectively. In addition, it requires fewer parameters than other deep learning-based methods. Thus, the model is lighter, less likely to over-fit, and easier to train. For comparison and validation, we test the proposed method along with three other deep learning-based HSI classification methods—namely, stacked autoencoder (SAE), deep brief network (DBN), and 2D-CNN-based methods—on three real-world HSI datasets captured by different sensors. Experimental results demonstrate that our 3D-CNN-based method outperforms these state-of-the-art methods and sets a new record. Full article
Show Figures

Graphical abstract

27 pages, 7958 KiB  
Article
Monitoring Forest Dynamics in the Andean Amazon: The Applicability of Breakpoint Detection Methods Using Landsat Time-Series and Genetic Algorithms
by Fabián Santos 1,2,*, Olena Dubovyk 1 and Gunter Menz 3,†
1 Centre for Remote Sensing of Land Surfaces (ZFL), University of Bonn, Walter-Flex Str. 3, 53113 Bonn, Germany
2 Center for Development Research (ZEF), University of Bonn, Walter-Flex-Str. 3, 53113 Bonn, Germany
3 Remote Sensing Research Group (RSRG), Department of Geography, University of Bonn, Meckenheimer Allee 166, 53115 Bonn, Germany
Deceased on 9 August 2016.
Remote Sens. 2017, 9(1), 68; https://doi.org/10.3390/rs9010068 - 12 Jan 2017
Cited by 10 | Viewed by 8221
Abstract
The Andean Amazon is an endangered biodiversity hot spot but its forest dynamics are less studied than those of the Amazon lowland and forests from middle or high latitudes. This is because its landscape variability, complex topography and cloudy conditions constitute a challenging [...] Read more.
The Andean Amazon is an endangered biodiversity hot spot but its forest dynamics are less studied than those of the Amazon lowland and forests from middle or high latitudes. This is because its landscape variability, complex topography and cloudy conditions constitute a challenging environment for any remote-sensing assessment. Breakpoint detection with Landsat time-series data is an established robust approach for monitoring forest dynamics around the globe but has not been properly evaluated for implementation in the Andean Amazon. We analyzed breakpoint detection-generated forest dynamics in order to determine its limitations when applied to three different study areas located along an altitude gradient in the Andean Amazon in Ecuador. Using all available Landsat imagery for the period 1997–2016, we evaluated different pre-processing approaches, noise reduction techniques, and breakpoint detection algorithms. These procedures were integrated into a complex function called the processing chain generator. Calibration was not straightforward since it required us to define values for 24 parameters. To solve this problem, we implemented a novel approach using genetic algorithms. We calibrated the processing chain generator by applying a stratified training sampling and a reference dataset based on high resolution imagery. After the best calibration solution was found and the processing chain generator executed, we assessed accuracy and found that data gaps, inaccurate co-registration, radiometric variability in sensor calibration, unmasked cloud, and shadows can drastically affect the results, compromising the application of breakpoint detection in mountainous areas of the Andean Amazon. Moreover, since breakpoint detection analysis of landscape variability in the Andean Amazon requires a unique calibration of algorithms, the time required to optimize analysis could complicate its proper implementation and undermine its application for large-scale projects. In exceptional cases when data quality and quantity were adequate, we recommend the pre-processing approaches, noise reduction algorithms and breakpoint detection algorithms procedures that can enhance results. Finally, we include recommendations for achieving a faster and more accurate calibration of complex functions applied to remote sensing using genetic algorithms. Full article
(This article belongs to the Special Issue Digital Forest Resource Monitoring and Uncertainty Analysis)
Show Figures

Graphical abstract

17 pages, 5089 KiB  
Article
Refinement of Hyperspectral Image Classification with Segment-Tree Filtering
by Lu Li 1,2, Chengyi Wang 1,*, Jingbo Chen 1 and Jianglin Ma 1
1 Institute of Remote Sensing and Digital Earth, Chinese Academy of Sciences, Datun Road North 20A, Beijing 100101, China
2 The University of Chinese Academy of Sciences, Beijing 100049, China
Remote Sens. 2017, 9(1), 69; https://doi.org/10.3390/rs9010069 - 16 Jan 2017
Cited by 8 | Viewed by 6857
Abstract
This paper proposes a novel method of segment-tree filtering to improve the classification accuracy of hyperspectral image (HSI). Segment-tree filtering is a versatile method that incorporates spatial information and has been widely applied in image preprocessing. However, to use this powerful framework in [...] Read more.
This paper proposes a novel method of segment-tree filtering to improve the classification accuracy of hyperspectral image (HSI). Segment-tree filtering is a versatile method that incorporates spatial information and has been widely applied in image preprocessing. However, to use this powerful framework in hyperspectral image classification, we must reduce the original feature dimensionality to avoid the Hughes problem; otherwise, the computational costs are high and the classification accuracy by original bands in the HSI is unsatisfactory. Therefore, feature extraction is adopted to produce new salient features. In this paper, the Semi-supervised Local Fisher (SELF) method of discriminant analysis is used to reduce HSI dimensionality. Then, a tree-structure filter that adaptively incorporates contextual information is constructed. Additionally, an initial classification map is generated using multi-class support vector machines (SVMs), and segment-tree filtering is conducted using this map. Finally, a simple Winner-Take-All (WTA) rule is applied to determine the class of each pixel in an HSI based on the maximum probability. The experimental results demonstrate that the proposed method can improve HSI classification accuracy significantly. Furthermore, a comparison between the proposed method and the current state-of-the-art methods, such as Extended Morphological Profiles (EMPs), Guided Filtering (GF), and Markov Random Fields (MRFs), suggests that our method is both competitive and robust. Full article
(This article belongs to the Special Issue Learning to Understand Remote Sensing Images)
Show Figures

Graphical abstract

24 pages, 7892 KiB  
Article
IceMap250—Automatic 250 m Sea Ice Extent Mapping Using MODIS Data
by Charles Gignac 1,2,*, Monique Bernier 1,2, Karem Chokmani 1,2 and Jimmy Poulin 1,2
1 Institut National de la Recherche Scientifique—Centre Eau Terre Environnement, 490 rue de la Couronne, Quebec, QC G1K 9A9, Canada
2 Centre d’Etudes Nordiques, Universite Laval, Pavillon Abitibi-Price, 2405 rue de la Terrasse, Local 1202, Quebec, QC G1V 0A6, Canada
Remote Sens. 2017, 9(1), 70; https://doi.org/10.3390/rs9010070 - 13 Jan 2017
Cited by 19 | Viewed by 8475
Abstract
The sea ice cover in the North evolves at a rapid rate. To adequately monitor this evolution, tools with high temporal and spatial resolution are needed. This paper presents IceMap250, an automatic sea ice extent mapping algorithm using MODIS reflective/emissive bands. Hybrid cloud-masking [...] Read more.
The sea ice cover in the North evolves at a rapid rate. To adequately monitor this evolution, tools with high temporal and spatial resolution are needed. This paper presents IceMap250, an automatic sea ice extent mapping algorithm using MODIS reflective/emissive bands. Hybrid cloud-masking using both the MOD35 mask and a visibility mask, combined with downscaling of Bands 3–7 to 250 m, are utilized to delineate sea ice extent using a decision tree approach. IceMap250 was tested on scenes from the freeze-up, stable cover, and melt seasons in the Hudson Bay complex, in Northeastern Canada. IceMap250 first product is a daily composite sea ice presence map at 250 m. Validation based on comparisons with photo-interpreted ground-truth show the ability of the algorithm to achieve high classification accuracy, with kappa values systematically over 90%. IceMap250 second product is a weekly clear sky map that provides a synthesis of 7 days of daily composite maps. This map, produced using a majority filter, makes the sea ice presence map even more accurate by filtering out the effects of isolated classification errors. The synthesis maps show spatial consistency through time when compared to passive microwave and national ice services maps. Full article
Show Figures

Graphical abstract

17 pages, 9422 KiB  
Article
Monitoring Annual Urban Changes in a Rapidly Growing Portion of Northwest Arkansas with a 20-Year Landsat Record
by Ryan Reynolds 1,†, Lu Liang 1,2,*,†, XueCao Li 3 and John Dennis 1
1 School of Forestry and Natural Resources, University of Arkansas at Monticello, Monticello, AR 71656, USA
2 Arkansas Forest Resources Center, University of Arkansas Division of Agriculture, Monticello, AR 71656, USA
3 Department of Geological & Atmospheric Science, Iowa State University, Ames, IA 50014, USA
These authors contributed equally to this work.
Remote Sens. 2017, 9(1), 71; https://doi.org/10.3390/rs9010071 - 13 Jan 2017
Cited by 30 | Viewed by 8187
Abstract
Northwest Arkansas has undergone a significant urban transformation in the past several decades and is considered to be one of the fastest growing regions in the United States. The urban area expansion and the associated demographic increases bring unprecedented pressure to the environment [...] Read more.
Northwest Arkansas has undergone a significant urban transformation in the past several decades and is considered to be one of the fastest growing regions in the United States. The urban area expansion and the associated demographic increases bring unprecedented pressure to the environment and natural resources. To better understand the consequences of urbanization, accurate and long-term depiction on urban dynamics is critical. Although urban mapping activities using remote sensing have been widely conducted, long-term urban growth mapping at an annual pace is rare and the low accuracy of change detection remains a challenge. In this study, a time series Landsat stack covering the period from 1995 to 2015 was employed to detect the urban dynamics in Northwest Arkansas via a two-stage classification approach. A set of spectral indices that have been proven to be useful in urban area extraction together with the original Landsat spectral bands were used in the maximum likelihood classifier and random forest classifier to distinguish urban from non-urban pixels for each year. A temporal trajectory polishing method, involving temporal filtering and heuristic reasoning, was then applied to the sequence of classified urban maps for further improvement. Based on a set of validation samples selected for five distinct years, the average overall accuracy of the final polished maps was 91%, which improved the preliminary classifications by over 10%. Moreover, results from this study also indicated that the temporal trajectory polishing method was most effective with initial low accuracy classifications. The resulting urban dynamic map is expected to provide unprecedented details about the area, spatial configuration, and growing trends of urban land-cover in Northwest Arkansas. Full article
Show Figures

Graphical abstract

24 pages, 5761 KiB  
Article
Assessment of Mono- and Split-Window Approaches for Time Series Processing of LST from AVHRR—A TIMELINE Round Robin
by Corinne Myrtha Frey *, Claudia Kuenzer and Stefan Dech
German Remote Sensing Data Center (DFD), Earth Observation Center (EOC), German Aerospace Center (DLR), Oberpfaffenhofen, D-82234 Wessling, Germany
Remote Sens. 2017, 9(1), 72; https://doi.org/10.3390/rs9010072 - 13 Jan 2017
Cited by 16 | Viewed by 6783
Abstract
Processing of land surface temperature from long time series of AVHRR (Advanced Very High Resolution Radiometer) requires stable algorithms, which are well characterized in terms of accuracy, precision and sensitivity. This assessment presents a comparison of four mono-window (Price 1983, Qin et al., [...] Read more.
Processing of land surface temperature from long time series of AVHRR (Advanced Very High Resolution Radiometer) requires stable algorithms, which are well characterized in terms of accuracy, precision and sensitivity. This assessment presents a comparison of four mono-window (Price 1983, Qin et al., 2001, Jiménez-Muñoz and Sobrino 2003, linear approach) and six split-window algorithms (Price 1984, Becker and Li 1990, Ulivieri et al., 1994, Wan and Dozier 1996, Yu 2008, Jiménez-Muñoz and Sobrino 2008) to estimate LST from top of atmosphere brightness temperatures, emissivity and columnar water vapour. Where possible, new coefficients were estimated matching the spectral response curves of the different AVHRR sensors of the past and present. The consideration of unique spectral response curves is necessary to avoid artificial anomalies and wrong trends when processing time series data. Using simulated data on the base of a large atmospheric profile database covering many different states of the atmosphere, biomes and geographical regions, it was assessed (a) to what accuracy and precision LST can be estimated using before mentioned algorithms and (b) how sensitive the algorithms are to errors in their input variables. It was found, that the split-window algorithms performed almost equally well, differences were found mainly in their sensitivity to input bands, resulting in the Becker and Li 1990 and Price 1984 split-window algorithm to perform best. Amongst the mono-window algorithms, larger deviations occurred in terms of accuracy, precision and sensitivity. The Qin et al., 2001 algorithm was found to be the best performing mono-window algorithm. A short comparison of the application of the Becker and Li 1990 coefficients to AVHRR with the MODIS LST product confirmed the approach to be physically sound. Full article
Show Figures

Graphical abstract

20 pages, 3618 KiB  
Article
MODIS Time Series to Detect Anthropogenic Interventions and Degradation Processes in Tropical Pasture
by Daniel Alves Aguiar 1,2,*, Marcio Pupin Mello 3, Sandra Furlan Nogueira 4, Fabio Guimarães Gonçalves 5, Marcos Adami 6 and Bernardo Friedrich Theodor Rudorff 1
1 Agrosatélite Geotecnologia Aplicada, Florianópolis 88032, Brazil
2 Divisão de Sensoriamento Remoto, Instituto Nacional de Pesquisas Espaciais, São José dos Campos 12227, Brazil
3 The Boeing Company, Boeing Research & Technology—Brazil, São José dos Campos 12227, Brazil
4 Brazilian Agricultural Research Corporation (EMBRAPA), Monitoramento por Satélite, Campinas 70770, Brazil
5 Canopy Remote Sensing Solutions, Florianópolis 88032, Brazil
6 Centro Regional da Amazônia, Instituto Nacional de Pesquisas Espaciais, Bélem 66077-830, Brazil
Remote Sens. 2017, 9(1), 73; https://doi.org/10.3390/rs9010073 - 14 Jan 2017
Cited by 22 | Viewed by 7246
Abstract
The unavoidable diet change in emerging countries, projected for the coming years, will significantly increase the global consumption of animal protein. It is expected that Brazilian livestock production, responsible for close to 15% of global production, be prepared to answer to the increasing [...] Read more.
The unavoidable diet change in emerging countries, projected for the coming years, will significantly increase the global consumption of animal protein. It is expected that Brazilian livestock production, responsible for close to 15% of global production, be prepared to answer to the increasing demand of beef. Consequently, the evaluation of pasture quality at regional scale is important to inform public policies towards a rational land use strategy directed to improve livestock productivity in the country. Our hypothesis is that MODIS images can be used to evaluate the processes of degradation, restoration and renovation of tropical pastures. To test this hypothesis, two field campaigns were performed covering a route of approximately 40,000 km through nine Brazilian states. To characterize the sampled pastures, biophysical parameters were measured and observations about the pastures, the adopted management and the landscape were collected. Each sampled pasture was evaluated using a time series of MODIS EVI2 images from 2000–2012, according to a new protocol based on seven phenological metrics, 14 Boolean criteria and two numerical criteria. The theoretical basis of this protocol was derived from interviews with producers and livestock experts during a third field campaign. The analysis of the MODIS EVI2 time series provided valuable historical information on the type of intervention and on the biological degradation process of the sampled pastures. Of the 782 pastures sampled, 26.6% experienced some type of intervention, 19.1% were under biological degradation, and 54.3% presented neither intervention nor trend of biomass decrease during the period analyzed. Full article
(This article belongs to the Special Issue Remote Sensing of Land Degradation and Drivers of Change)
Show Figures

Graphical abstract

29 pages, 8295 KiB  
Article
Assessing the Potential of Sentinel-2 and Pléiades Data for the Detection of Prosopis and Vachellia spp. in Kenya
by Wai-Tim Ng 1,*, Purity Rima 2,3, Kathrin Einzmann 1, Markus Immitzer 1, Clement Atzberger 1 and Sandra Eckert 4
1 Institute for Surveying, Remote Sensing and Land Information, University of Natural Resources and Life Sciences, Vienna (BOKU), Peter Jordan Str. 82, A-1190 Vienna, Austria
2 Kenya Forestry Research Institute (KEFRI), Baringo Sub Centre, P.O. BOX 57-30403, Marigat, Kenya
3 Faculty of Arts and Humanities, Department of Geography, Chuka University, P.O. Box 109-60400, Chuka, Kenya
4 Centre for Development and Environment, University of Bern, Hallerstrasse 10, CH-3012 Bern, Switzerland
Remote Sens. 2017, 9(1), 74; https://doi.org/10.3390/rs9010074 - 16 Jan 2017
Cited by 95 | Viewed by 14372
Abstract
Prosopis was introduced to Baringo, Kenya in the early 1980s for provision of fuelwood and for controlling desertification through the Fuelwood Afforestation Extension Project (FAEP). Since then, Prosopis has hybridized and spread throughout the region. Prosopis has negative ecological impacts on biodiversity and [...] Read more.
Prosopis was introduced to Baringo, Kenya in the early 1980s for provision of fuelwood and for controlling desertification through the Fuelwood Afforestation Extension Project (FAEP). Since then, Prosopis has hybridized and spread throughout the region. Prosopis has negative ecological impacts on biodiversity and socio-economic effects on livelihoods. Vachellia tortilis, on the other hand, is the dominant indigenous tree species in Baringo and is an important natural resource, mostly preferred for wood, fodder and charcoal production. High utilization due to anthropogenic pressure is affecting the Vachellia populations, whereas the well adapted Prosopis—competing for nutrients and water—has the potential to replace the native Vachellia vegetation. It is vital that both species are mapped in detail to inform stakeholders and for designing management strategies for controlling the Prosopis invasion. For the Baringo area, few remote sensing studies have been carried out. We propose a detailed and robust object-based Random Forest (RF) classification on high spatial resolution Sentinel-2 (ten meter) and Pléiades (two meter) data to detect Prosopis and Vachellia spp. for Marigat sub-county, Baringo, Kenya. In situ reference data were collected to train a RF classifier. Classification results were validated by comparing the outputs to independent reference data of test sites from the “Woody Weeds” project and the Out-Of-Bag (OOB) confusion matrix generated in RF. Our results indicate that both datasets are suitable for object-based Prosopis and Vachellia classification. Higher accuracies were obtained by using the higher spatial resolution Pléiades data (OOB accuracy 0.83 and independent reference accuracy 0.87–0.91) compared to the Sentinel-2 data (OOB accuracy 0.79 and independent reference accuracy 0.80–0.96). We conclude that it is possible to separate Prosopis and Vachellia with good accuracy using the Random Forest classifier. Given the cost of Pléiades, the free of charge Sentinel-2 data provide a viable alternative as the increased spectral resolution compensates for the lack of spatial resolution. With global revisit times of five days from next year onwards, Sentinel-2 based classifications can probably be further improved by using temporal information in addition to the spectral signatures. Full article
Show Figures

Graphical abstract

24 pages, 8021 KiB  
Article
Decline of Geladandong Glacier Elevation in Yangtze River’s Source Region: Detection by ICESat and Assessment by Hydroclimatic Data
by Nengfang Chao 1, Zhengtao Wang 2, Cheinway Hwang 2,3,*, Taoyong Jin 2 and Yung-Sheng Cheng 3
1 MOE Key Laboratory of Fundamental Physical Quantities Measurement, School of Physics, Huazhong University of Science and Technology, Wuhan 430074, China
2 School of Geodesy and Geomatics, Wuhan University, Wuhan 430079, China
3 Department of Civil Engineering, National Chiao Tung University, 1001 Ta Hsueh Rd., Hsinchu 300, Taiwan
Remote Sens. 2017, 9(1), 75; https://doi.org/10.3390/rs9010075 - 14 Jan 2017
Cited by 23 | Viewed by 7724
Abstract
Several studies have indicated that glaciers in the Qinghai-Tibet plateau are thinning, resulting in reduced water supplies to major rivers such as the Yangtze, Yellow, Lancang, Indus, Ganges, Brahmaputra in China, and south Asia. Three rivers in the upstream of Yangtze River originate [...] Read more.
Several studies have indicated that glaciers in the Qinghai-Tibet plateau are thinning, resulting in reduced water supplies to major rivers such as the Yangtze, Yellow, Lancang, Indus, Ganges, Brahmaputra in China, and south Asia. Three rivers in the upstream of Yangtze River originate from glaciers around the Geladandong snow mountain group in central Tibet. Here we used elevation observations from Ice, Cloud, and land Elevation Satellite (ICESat) and reference elevations from a 3-arc-second digital elevation model (DEM) of Shuttle Radar Terrestrial Mission (SRTM), assisted with Landsat-7 images, to detect glacier elevation changes in the western (A), central (B), and eastern (C) regions of Geladandong. Robust fitting was used to determine rates of glacier elevation changes in regions with dense ICESat data, whereas a new method called rate averaging was employed to find rates in regions of low data density. The rate of elevation change was −0.158 ± 0.066 m·a−1 over 2003–2009 in the entire Geladandong and it was −0.176 ± 0.102 m·a−1 over 2003–2008 in Region C (by robust fitting). The rates in Regions A, B, and C were −0.418 ± 0.322 m·a−1 (2000–2009), −0.432 ± 0.020 m·a−1 (2000–2003), and −0.321 ± 0.139 m·a−1 (2000–2008) (by rate averaging). We used in situ hydroclimatic dataset to assess these negative rates: the glacier thinning was caused by temperature rises around Geladandong, based on the temperature records over 1979–2009, 1957–2013, and 1966–2013 at stations Tuotuohe, Wudaoliang, and Anduo. The thinning Geladandong glaciers led to increased discharges recorded at the river gauge stations Tuotuohe and Chumda over 1956–2012. An unabated Geladandong glacier melting will reduce its long-term water supply to the Yangtze River Basin, causing irreversible socioeconomic consequences and seriously degrading the ecological system of the Yangtze River Basin. Full article
(This article belongs to the Special Issue Earth Observations for a Better Future Earth)
Show Figures

Graphical abstract

17 pages, 8384 KiB  
Article
Stochastic Spatio-Temporal Models for Analysing NDVI Distribution of GIMMS NDVI3g Images
by Ana F. Militino 1,2,3,*, Maria Dolores Ugarte 1,2,3 and Unai Pérez-Goya 1
1 Department of Statistics and Operations Research, Public University of Navarre, 31006 Pamplona, Spain
2 Institute for Advanced Materials (InaMat), Public University of Navarre, 31006 Pamplona, Spain
3 Department of Mathematics, Spanish Open University (UNED), 31006 Pamplona, Spain
Remote Sens. 2017, 9(1), 76; https://doi.org/10.3390/rs9010076 - 15 Jan 2017
Cited by 27 | Viewed by 7178
Abstract
The normalized difference vegetation index (NDVI) is an important indicator for evaluating vegetation change, monitoring land surface fluxes or predicting crop models. Due to the great availability of images provided by different satellites in recent years, much attention has been devoted to testing [...] Read more.
The normalized difference vegetation index (NDVI) is an important indicator for evaluating vegetation change, monitoring land surface fluxes or predicting crop models. Due to the great availability of images provided by different satellites in recent years, much attention has been devoted to testing trend changes with a time series of NDVI individual pixels. However, the spatial dependence inherent in these data is usually lost unless global scales are analyzed. In this paper, we propose incorporating both the spatial and the temporal dependence among pixels using a stochastic spatio-temporal model for estimating the NDVI distribution thoroughly. The stochastic model is a state-space model that uses meteorological data of the Climatic Research Unit (CRU TS3.10) as auxiliary information. The model will be estimated with the Expectation-Maximization (EM) algorithm. The result is a set of smoothed images providing an overall analysis of the NDVI distribution across space and time, where fluctuations generated by atmospheric disturbances, fire events, land-use/cover changes or engineering problems from image capture are treated as random fluctuations. The illustration is carried out with the third generation of NDVI images, termed NDVI3g, of the Global Inventory Modeling and Mapping Studies (GIMMS) in continental Spain. This data are taken in bymonthly periods from January 2011 to December 2013, but the model can be applied to many other variables, countries or regions with different resolutions. Full article
Show Figures

Graphical abstract

25 pages, 33934 KiB  
Article
Examining Multi-Legend Change Detection in Amazon with Pixel and Region Based Methods
by Mariane S. Reis *, Luciano V. Dutra, Sidnei J. S. Sant’Anna and Maria Isabel S. Escada
Brazilian National Institute for Space Research—INPE, São José dos Campos 12245, SP, Brazil
Remote Sens. 2017, 9(1), 77; https://doi.org/10.3390/rs9010077 - 15 Jan 2017
Cited by 10 | Viewed by 8030
Abstract
Post-classification comparison is one of the most widely used change detection methods. However, it presents several operational problems that are often ignored, such as the occurrence of impossible transitions, difficulties in accuracy assessment and results not accurate enough for the purpose. This work [...] Read more.
Post-classification comparison is one of the most widely used change detection methods. However, it presents several operational problems that are often ignored, such as the occurrence of impossible transitions, difficulties in accuracy assessment and results not accurate enough for the purpose. This work aims to evaluate post-classification comparison change detection results obtained from LANDSAT5/TM data in a region of the Brazilian Amazon, using three legends in different levels of detail and both pixel wise and region based classifiers. A distinctive characteristic of the used approach is that each change mapping is the result of the combination of 100 land cover classifications for each date, obtained using varied training samples. This approach allowed to account for the training samples choice into the methodology, as well as the construction of confidence mappings. We presented and discussed different approaches for evaluating change results, such as the likelihood of land cover transitions occurring within the study area and time gap, the use of rectangular matrices to incorporate the occurrence of impossible or non evaluable changes and classification uncertainty. In general, change mappings obtained from region based classifications showed better results than the ones obtained from pixel based classifications. Globally, the use of region based approaches, in contrast to pixel based ones, led to an increase in accuracy of 15.5% for the change mapping from the most detailed legend, 7.8% for the one with the legend with intermediate level of detail and 3.6% for the less detailed one. In addition, individual transitions between land cover classes were better identified using region based approaches, with the exception of transitions from a non agriculture class to an agricultural one. The proposed quality mappings are useful to help to evaluate the change mappings, mainly in legend levels with higher level of detail and if reference samples are unreliable or unavailable. It was possible to access, in a spatially explicit way, that at least 29.0% of the pixel based change mapping and 21.9% of the region based one from the most detailed legend were erroneous classified, without ground truth information on the evaluated date. These values decreased to 0.5% and 1.4% (respectively the pixel and region based approaches) for results with the legend with the intermediate level of detail and are non existent in the results from the less detailed legend. The more generalized the legend (lower number of classes), the most similar are the accuracy of region and pixel based change mappings. These accuracy values also increase as fewer classes are considered in the legend, since similar classes are assembled during clustering, which reduces the overlap between groups. However, this accuracy is still low for operational purposes in areas with few changes, even considering the very high accuracy of the land cover classifications used to generate the change mappings (land cover classification with Overall Accuracy higher than 0.98 resulted in change mappings with Overall Accuracy around 0.83). Full article
(This article belongs to the Special Issue Digital Forest Resource Monitoring and Uncertainty Analysis)
Show Figures

Graphical abstract

19 pages, 8067 KiB  
Article
Automated Extraction of Inundated Areas from Multi-Temporal Dual-Polarization RADARSAT-2 Images of the 2011 Central Thailand Flood
by Pisut Nakmuenwai 1,2,*, Fumio Yamazaki 2 and Wen Liu 2
1 Geo-Informatics and Space Technology Development Agency, Bangkok 10210, Thailand
2 Department of Urban Environment Systems, Chiba University, Chiba 263-8522, Japan
Remote Sens. 2017, 9(1), 78; https://doi.org/10.3390/rs9010078 - 15 Jan 2017
Cited by 57 | Viewed by 8844
Abstract
This study examines a novel extraction method for SAR imagery data of widespread flooding, particularly in the Chao Phraya river basin of central Thailand, where flooding occurs almost every year. Because the 2011 flood was among the largest events and of a long [...] Read more.
This study examines a novel extraction method for SAR imagery data of widespread flooding, particularly in the Chao Phraya river basin of central Thailand, where flooding occurs almost every year. Because the 2011 flood was among the largest events and of a long duration, a large number of satellites observed it, and imagery data are available. At that time, RADARSAT-2 data were mainly used to extract the affected areas by the Thai government, whereas ThaiChote-1 imagery data were also used as optical supporting data. In this study, the same data were also employed in a somewhat different and more detailed manner. Multi-temporal dual-polarized RADARSAT-2 images were used to classify water areas using a clustering-based thresholding technique, neighboring valley-emphasis, to establish an automated extraction system. The novel technique has been proposed to improve classification speed and efficiency. This technique selects specific water references throughout the study area to estimate local threshold values and then averages them by an area weight to obtain the threshold value for the entire area. The extracted results were validated using high-resolution optical images from the GeoEye-1 and ThaiChote-1 satellites and water elevation data from gaging stations. Full article
Show Figures

Figure 1

13 pages, 19396 KiB  
Article
Near Real-Time Browsable Landsat-8 Imagery
by Cheng-Chien Liu 1,2,*, Ryosuke Nakamura 3, Ming-Hsun Ko 1, Tomoya Matsuo 1, Soushi Kato 3, Hsiao-Yuan Yin 4 and Chung-Shiou Huang 5
1 Global Earth Observation and Data Analysis Centre, National Cheng Kung University, No. 1 Ta-Hsueh Road, Tainan 701, Taiwan
2 Department of Earth Sciences, National Cheng Kung University, No. 1 Ta-Hsueh Road, Tainan 701, Taiwan
3 Information Technology Research Institute, National Institute of Advanced Industrial Science and Technology, Tsukuba 305-8568, Japan
4 Debris Flow Disaster Prevention Center, Soil and Water Conservation Bureau, Council of Agriculture, Nantou 54044, Taiwan
5 Hsinchu Forest District Office, Forestry Bureau, Council of Agriculture, The Executive Yuan, Hsinchu 30046, Taiwan
Remote Sens. 2017, 9(1), 79; https://doi.org/10.3390/rs9010079 - 16 Jan 2017
Cited by 4 | Viewed by 7979
Abstract
The successful launch and operation of Landsat-8 extends the remarkable 40-year acquisition of space-based land remote-sensing data. To respond quickly to emergency needs, real-time data are directly downlinked to 17 ground stations across the world on a routine basis. With a size of [...] Read more.
The successful launch and operation of Landsat-8 extends the remarkable 40-year acquisition of space-based land remote-sensing data. To respond quickly to emergency needs, real-time data are directly downlinked to 17 ground stations across the world on a routine basis. With a size of approximately 1 Gb per scene, however, the standard level-1 product provided by these stations is not able to serve the general public. Users would like to browse the most up-to-date and historical images of their regions of interest (ROI) at full-resolution from all kinds of devices without the need for tedious data downloading, decompressing, and processing. This paper reports on the Landsat-8 automatic image processing system (L-8 AIPS) that incorporates the function of mask developed by United States Geological Survey (USGS), the pan-sharpening technique of spectral summation intensity modulation, the adaptive contrast enhancement technique, as well as the Openlayers and Google Maps/Earth compatible superoverlay technique. Operation of L-8 AIPS enables the most up-to-date Landsat-8 images of Taiwan to be browsed with a clear contrast enhancement regardless of the cloud condition, and in only one hour’s time after receiving the raw data from the USGS Level 1 Product Generation System (LPGS). For any ROI in Taiwan, all historical Landsat-8 images can also be quickly viewed in time series at full resolution (15 m). The debris flow triggered by Typhoon Soudelor (8 August 2015), as well as the barrier lake formed and the large-scale destruction of vegetation after Typhoon Nepartak (7 July 2016), are given as three examples of successful applications to demonstrate that the gap between the user’s needs and the existing Level-1 product from LPGS can be bridged by providing browsable images in near real-time. Full article
Show Figures

Graphical abstract

25 pages, 7594 KiB  
Article
Is Spatial Resolution Critical in Urbanization Velocity Analysis? Investigations in the Pearl River Delta
by Chunzhu Wei 1,*, Thomas Blaschke 1, Pavlos Kazakopoulos 1, Hannes Taubenböck 2 and Dirk Tiede 1
1 Department of Geoinformatics—Z_GIS, University of Salzburg, Schillerstrasse 30, 5020 Salzburg, Austria
2 German Aerospace Center (DLR), German Remote Sensing Data Center, Oberpfaffenhofen, 82234 Weßling, Germany
Remote Sens. 2017, 9(1), 80; https://doi.org/10.3390/rs9010080 - 17 Jan 2017
Cited by 10 | Viewed by 9481
Abstract
Grid-based urbanization velocity analysis of remote sensing imagery is used to measure urban growth rates. However, it remains unclear how critical the spatial resolution of the imagery is to such grid-based approaches. This research therefore investigated how urbanization velocity estimates respond to different [...] Read more.
Grid-based urbanization velocity analysis of remote sensing imagery is used to measure urban growth rates. However, it remains unclear how critical the spatial resolution of the imagery is to such grid-based approaches. This research therefore investigated how urbanization velocity estimates respond to different spatial resolutions, as determined by the grid sizes used. Landsat satellite images of the Pearl River Delta (PRD) in China from the years 2000, 2005, 2010 and 2015 were hierarchically aggregated using different grid sizes. Statistical analyses of urbanization velocity derived using different spatial resolutions (or grid sizes) were used to investigate the relationships between socio-economic indicators and the velocity of urbanization for 27 large cities in PRD. The results revealed that those cities with above-average urbanization velocities remain unaffected by the spatial resolution (or grid-size), and the relationships between urbanization velocities and socio-economic indicators are independent of spatial resolution (or grid sizes) used. Moreover, empirical variogram models, the local variance model, and the geographical variance model all indicated that coarse resolution version (480 m) of Landsat images based on aggregated pixel yielded more appropriate results than the original fine resolution version (30 m), when identifying the characteristics of spatial autocorrelation and spatial structure variability of urbanization patterns and processes. The results conclude that the most appropriate spatial resolution for investigations into urbanization velocities is not always the highest resolution. The resulting patterns of urbanization velocities at different spatial resolutions can be used as a basis for studying the spatial heterogeneity of other datasets with variable spatial resolutions, especially for evaluating the capability of a multi-resolution dataset in reflecting spatial structure and spatial autocorrelation features in an urban environment. Full article
(This article belongs to the Special Issue Societal and Economic Benefits of Earth Observation Technologies)
Show Figures

Graphical abstract

20 pages, 2316 KiB  
Article
Distinguishing Intensity Levels of Grassland Fertilization Using Vegetation Indices
by Jens L. Hollberg 1,2,* and Jürgen Schellberg 1,2
1 Center for Remote Sensing of Land Surfaces, University of Bonn, Walter-Flex-Str. 3, Bonn NRW 53113, Germany
2 Institute of Crop Science and Resource Conservation, University of Bonn, Auf dem Hügel 6, Bonn NRW 53121, Germany
Remote Sens. 2017, 9(1), 81; https://doi.org/10.3390/rs9010081 - 16 Jan 2017
Cited by 21 | Viewed by 7109
Abstract
Monitoring the reaction of grassland canopies on fertilizer application is of major importance to enable a well-adjusted management supporting a sustainable production of the grass crop. Up to date, grassland managers estimate the nutrient status and growth dynamics of grasslands by costly and [...] Read more.
Monitoring the reaction of grassland canopies on fertilizer application is of major importance to enable a well-adjusted management supporting a sustainable production of the grass crop. Up to date, grassland managers estimate the nutrient status and growth dynamics of grasslands by costly and time-consuming field surveys, which only provide low temporal and spatial data density. Grassland mapping using remotely-sensed Vegetation Indices (VIs) has the potential to contribute to solving these problems. In this study, we explored the potential of VIs for distinguishing five differently-fertilized grassland communities. Therefore, we collected spectral signatures of these communities in a long-term fertilization experiment (since 1941) in Germany throughout the growing seasons 2012–2014. Fifteen VIs were calculated and their seasonal developments investigated. Welch tests revealed that the accuracy of VIs for distinguishing these grassland communities varies throughout the growing season. Thus, the selection of the most promising single VI for grassland mapping was dependent on the date of the spectra acquisition. A random forests classification using all calculated VIs reduced variations in classification accuracy within the growing season and provided a higher overall precision of classification. Thus, we recommend a careful selection of VIs for grassland mapping or the utilization of temporally-stable methods, i.e., including a set of VIs in the random forests algorithm. Full article
Show Figures

Graphical abstract

21 pages, 6011 KiB  
Article
Mapping Extent Dynamics of Small Lakes Using Downscaling MODIS Surface Reflectance
by Xianghong Che 1,2, Yaping Yang 1,*, Min Feng 3, Tong Xiao 4, Shengli Huang 5, Yang Xiang 6 and Zugang Chen 1,2
1 State Key Laboratory of Resources and Environmental Information System, Institute of Geographic Sciences and Natural Resources Research, Chinese Academy of Sciences, Beijing 100101, China
2 University of Chinese Academy of Sciences, Beijing 100049, China
3 Global Land Cover Facility, Department of Geographical Sciences, University of Maryland, College Park, MD 20742, USA
4 Department of Ecological Remote Sensing, Satellite Environment Center, Ministry of Environmental Protection, Beijing 100094, China
5 US Department of Agriculture Forest Service, Region 5, Remote Sensing Laboratory, McClellan, CA 95652, USA
6 College of Tourism and Environment, ShaanXi Normal University, Xi’an 710100, China
Remote Sens. 2017, 9(1), 82; https://doi.org/10.3390/rs9010082 - 17 Jan 2017
Cited by 16 | Viewed by 6484
Abstract
Lake extent is an indicator of water capacity as well as the aquatic ecological and environmental conditions. Due to the small sizes and rapid water dynamics, monitoring the extent of small lakes fluctuating between 2.5 and 30 km2 require observations with both [...] Read more.
Lake extent is an indicator of water capacity as well as the aquatic ecological and environmental conditions. Due to the small sizes and rapid water dynamics, monitoring the extent of small lakes fluctuating between 2.5 and 30 km2 require observations with both high spatial and temporal resolutions. The paper applied an improved surface reflectance (SR) downscaling method (i.e., IMAR (Improved Modified Adaptive Regression model)) to downscale the daily SR acquired by the Moderate Resolution Imaging Spectroradiometer (MODIS) Terra platform to a consistent 250-m resolution, and derived monthly water extent of four small lakes in the Tibetan Plateau (Longre Co, Ayonggongma Co, Ayonggama Co, and Ayongwama Co)) from 2000 to 2014. Using Landsat ETM+ acquired on the same date, the downscaled MODIS SR and identified water extent were compared to the original MODIS, observations downscaled using an early SR downscaling method (MAR (Modified Adaptive Regression model)) and Wavelet fusion. The results showed IMAR achieved the highest correlation coefficients (R2) (0.89–0.957 for SR and 0.79–0.933 for water extent). The errors in the derived water extents were significantly decreased comparing to the results of MAR and Wavelet fusion, and lakes morphometry of IMAR is more comparable to Landsat results. The detected lake extents dynamic between 2000 and 2014 were analyzed using the trend and season decomposition model (BFAST), indicating an increasing trend after 2005, and it likely had higher correlations with temperature and precipitation variation in the Tibetan region (R2: 0.598–0.728 and 0.61–0.735, respectively). Full article
Show Figures

Graphical abstract

25 pages, 33574 KiB  
Article
DInSAR-Based Detection of Land Subsidence and Correlation with Groundwater Depletion in Konya Plain, Turkey
by Fabiana Caló 1,*, Davide Notti 2, Jorge Pedro Galve 2, Saygin Abdikan 3, Tolga Görüm 4, Antonio Pepe 1 and Füsun Balik Şanli 5
1 National Research Council (CNR) of Italy—Institute for the Electromagnetic Sensing of the Environment (IREA), via Diocleziano 328, 80124 Napoli, Italy
2 Department of Geodynamics, University of Granada, 18071 Granada, Spain
3 Department of Geomatics Engineering, Engineering Faculty, Bulent Ecevit University, 67100 Zonguldak, Turkey
4 Geography Department, Istanbul University, Ordu Cad. No. 6, 34459 Laleli, Istanbul, Turkey
5 Department of Geomatic Engineering, Civil Engineering Faculty, Yildiz Technical University, 34220 Esenler, Istanbul, Turkey
Remote Sens. 2017, 9(1), 83; https://doi.org/10.3390/rs9010083 - 17 Jan 2017
Cited by 71 | Viewed by 16084
Abstract
In areas where groundwater overexploitation occurs, land subsidence triggered by aquifer compaction is observed, resulting in high socio-economic impacts for the affected communities. In this paper, we focus on the Konya region, one of the leading economic centers in the agricultural and industrial [...] Read more.
In areas where groundwater overexploitation occurs, land subsidence triggered by aquifer compaction is observed, resulting in high socio-economic impacts for the affected communities. In this paper, we focus on the Konya region, one of the leading economic centers in the agricultural and industrial sectors in Turkey. We present a multi-source data approach aimed at investigating the complex and fragile environment of this area which is heavily affected by groundwater drawdown and ground subsidence. In particular, in order to analyze the spatial and temporal pattern of the subsidence process we use the Small BAseline Subset DInSAR technique to process two datasets of ENVISAT SAR images spanning the 2002–2010 period. The produced ground deformation maps and associated time-series allow us to detect a wide land subsidence extending for about 1200 km2 and measure vertical displacements reaching up to 10 cm in the observed time interval. DInSAR results, complemented with climatic, stratigraphic and piezometric data as well as with land-cover changes information, allow us to give more insights on the impact of climate changes and human activities on groundwater resources depletion and land subsidence. Full article
(This article belongs to the Special Issue Earth Observations for Geohazards)
Show Figures

Graphical abstract

13 pages, 22756 KiB  
Article
Characterization of Active Layer Thickening Rate over the Northern Qinghai-Tibetan Plateau Permafrost Region Using ALOS Interferometric Synthetic Aperture Radar Data, 2007–2009
by Yuanyuan Jia 1,*, Jin-Woo Kim 2, C. K. Shum 1,3, Zhong Lu 2, Xiaoli Ding 4, Lei Zhang 4, Kamil Erkan 5, Chung-Yen Kuo 6, Kun Shang 1, Kuo-Hsin Tseng 7 and Yuchan Yi 1
1 Division of Geodetic Science, School of Earth Science, Ohio State University, Columbus, OH 43210, USA
2 Roy M. Huffington Department of Earth Sciences, Southern Methodist University, Dallas, TX 75275, USA
3 State Key Laboratory of Geodesy and Earth’s Dynamics, Institute of Geodesy and Geophysics, Chinese Academy of Sciences, Wuhan 430077, China
4 Department of Land Surveying and Geo-Informatics, Hong Kong Polytechnic University, Hong Kong, China
5 Department of Civil Engineering, Marmara University, 34722 Istanbul, Turkey
6 Department of Geomatics, National Cheng Kung University, 70101 Tainan, Taiwan
7 Center for Space and Remote Sensing Research, National Central University, 32001 Taoyuan, Taiwan
Remote Sens. 2017, 9(1), 84; https://doi.org/10.3390/rs9010084 - 17 Jan 2017
Cited by 49 | Viewed by 6610
Abstract
The Qinghai-Tibetan plateau (QTP), also known as the Third Pole and the World Water Tower, is the largest and highest plateau with distinct and competing surface and subsurface processes. It is covered by a large layer of discontinuous and sporadic alpine permafrost which [...] Read more.
The Qinghai-Tibetan plateau (QTP), also known as the Third Pole and the World Water Tower, is the largest and highest plateau with distinct and competing surface and subsurface processes. It is covered by a large layer of discontinuous and sporadic alpine permafrost which has degraded 10% during the past few decades. The average active layer thickness (ALT) increase rate is approximately 7.5 cm·yr−1 from 1995 to 2007, based on soil temperature measurements from 10 borehole sites along Qinghai-Tibetan Highway, and approximately 6.3 cm·yr−1, 2006–2010, using soil temperature profiles for 27 monitoring sites along Qinghai-Tibetan railway. In this study, we estimated the ALT and its AL thickening rate in the northern QTP near the railway using ALOS PALSAR L-band small baseline subset interferometric synthetic aperture radar (SBAS-InSAR) data observed land subsidence and the corresponding ALT modeling. The InSAR estimated ALT and AL thickening rate were validated with ground-based observations from the borehole site WD4 within our study region, indicating excellent agreement. We concluded that we have generated high spatial resolution (30 m) and spatially-varying ALT and AL thickening rates, 2007–2009, over approximately an area of 150 km2 of permafrost-covered region in the northern QTP. Full article
(This article belongs to the Special Issue Remote Sensing in Tibet and Siberia)
Show Figures

Graphical abstract

14 pages, 3440 KiB  
Article
Remote Sensing-Based Assessment of the 2005–2011 Bamboo Reproductive Event in the Arakan Mountain Range and Its Relation with Wildfires
by Francesco Fava 1,* and Roberto Colombo 2
1 International Livestock Research Institute, P.O. Box 30709, Nairobi 00100, Kenya
2 Remote Sensing of Environmental Dynamics Lab., Dept. of Earth and Environmental Sciences, University of Milano-Bicocca, Piazza della Scienza 1, Milano 20126, Italy
Remote Sens. 2017, 9(1), 85; https://doi.org/10.3390/rs9010085 - 18 Jan 2017
Cited by 15 | Viewed by 8491
Abstract
Pulse ecological events have major impacts on regional and global biogeochemical cycles, potentially inducing a vast set of cascading ecological effects. This study analyzes the widespread reproductive event of bamboo (Melocanna baccifera) that occurred in the Arakan Mountains (Southeast Asia) from [...] Read more.
Pulse ecological events have major impacts on regional and global biogeochemical cycles, potentially inducing a vast set of cascading ecological effects. This study analyzes the widespread reproductive event of bamboo (Melocanna baccifera) that occurred in the Arakan Mountains (Southeast Asia) from 2005 to 2011, and investigates the possible relationship between massive fuel loading due to bamboo synchronous mortality over large areas and wildfire regime. Multiple remote sensing data products are used to map the areal extent of the bamboo-dominated forest. MODIS NDVI time series are then analyzed to detect the spatiotemporal patterns of the reproductive event. Finally, MODIS Active Fire and Burned Area Products are used to investigate the distribution and extension of wildfires before and after the reproductive event. Bamboo dominates about 62,000 km2 of forest in Arakan. Over 65% of the region shows evidence of synchronous bamboo flowering, fruiting, and mortality over large areas, with wave-like spatiotemporal dynamics. A significant change in the regime of wildfires is observed, with total burned area doubling in the bamboo-dominated forest area and reaching almost 16,000 km2. Wildfires also severely affect the remnant patches of the evergreen forest adjacent to the bamboo forest. These results demonstrate a clear interconnection between the 2005–2011 bamboo reproductive event and the wildfires spreading in the region, with potential relevant socio-economic and environmental impacts. Full article
Show Figures

Graphical abstract

14 pages, 9138 KiB  
Article
A Self-Calibrating Runoff and Streamflow Remote Sensing Model for Ungauged Basins Using Open-Access Earth Observation Data
by Ate Poortinga 1,2,3,*, Wim Bastiaanssen 4,5, Gijs Simons 4,6, David Saah 2,3,7, Gabriel Senay 8, Mark Fenn 1, Brian Bean 1 and John Kadyszewski 9
1 Winrock International, Vietnam Forests and Deltas program, 98 To Ngoc Van, Tay Ho, Hanoi 100803, Vietnam
2 Spatial Informatics Group, 2529 Yolanda Ct., Pleasanton, CA 94566, USA
3 SERVIR-Mekong, SM Tower, 24th Floor, 979/69 Paholyothin Road, Samsen Nai Phayathai, Bangkok 10400, Thailand
4 Faculty of Civil Engineering and Geosciences, Department of Water Management, Delft University of Technology, Stevinweg 1, Delft 2628 CN, The Netherlands
5 UNESCO-IHE, Westvest 7, Delft 2611 AX, The Netherlands
6 FutureWater, Costerweg 1V, Wageningen 6702 AA, The Netherlands
7 Geospatial Analysis Lab, University of San Francisco, 2130 Fulton St., San Francisco, CA 94117, USA
8 USGS EROS Center, North Central Climate Science Center, Colorado State University, Fort Collins, CO 80523, USA
9 Winrock International, 2121 Crystal Drive, Suite 500, Arlington, VA 22202, USA
Remote Sens. 2017, 9(1), 86; https://doi.org/10.3390/rs9010086 - 18 Jan 2017
Cited by 35 | Viewed by 9008
Abstract
Due to increasing pressures on water resources, there is a need to monitor regional water resource availability in a spatially and temporally explicit manner. However, for many parts of the world, there is insufficient data to quantify stream flow or ground water infiltration [...] Read more.
Due to increasing pressures on water resources, there is a need to monitor regional water resource availability in a spatially and temporally explicit manner. However, for many parts of the world, there is insufficient data to quantify stream flow or ground water infiltration rates. We present the results of a pixel-based water balance formulation to partition rainfall into evapotranspiration, surface water runoff and potential ground water infiltration. The method leverages remote sensing derived estimates of precipitation, evapotranspiration, soil moisture, Leaf Area Index, and a single F coefficient to distinguish between runoff and storage changes. The study produced significant correlations between the remote sensing method and field based measurements of river flow in two Vietnamese river basins. For the Ca basin, we found R2 values ranging from 0.88–0.97 and Nash–Sutcliffe efficiency (NSE) values varying between 0.44–0.88. The R2 for the Red River varied between 0.87–0.93 and NSE values between 0.61 and 0.79. Based on these findings, we conclude that the method allows for a fast and cost-effective way to map water resource availability in basins with no gauges or monitoring infrastructure, without the need for application of sophisticated hydrological models or resource-intensive data. Full article
Show Figures

Graphical abstract

21 pages, 3055 KiB  
Article
Citizen Science and Crowdsourcing for Earth Observations: An Analysis of Stakeholder Opinions on the Present and Future
by Suvodeep Mazumdar *, Stuart Wrigley and Fabio Ciravegna
Department of Computer Science, University of Sheffield, Sheffield S1 4DP, UK
Remote Sens. 2017, 9(1), 87; https://doi.org/10.3390/rs9010087 - 19 Jan 2017
Cited by 24 | Viewed by 13171
Abstract
The impact of Crowdsourcing and citizen science activities on academia, businesses, governance and society has been enormous. This is more prevalent today with citizens and communities collaborating with organizations, businesses and authorities to contribute in a variety of manners, starting from mere data [...] Read more.
The impact of Crowdsourcing and citizen science activities on academia, businesses, governance and society has been enormous. This is more prevalent today with citizens and communities collaborating with organizations, businesses and authorities to contribute in a variety of manners, starting from mere data providers to being key stakeholders in various decision-making processes. The “Crowdsourcing for observations from Satellites” project is a recently concluded study supported by demonstration projects funded by European Space Agency (ESA). The objective of the project was to investigate the different facets of how crowdsourcing and citizen science impact upon the validation, use and enhancement of Observations from Satellites (OS) products and services. This paper presents our findings in a stakeholder analysis activity involving participants who are experts in crowdsourcing, citizen science for Earth Observations. The activity identified three critical areas that needs attention by the community as well as provides suggestions to potentially help in addressing some of the challenges identified. Full article
(This article belongs to the Special Issue Citizen Science and Earth Observation)
Show Figures

Graphical abstract

17 pages, 19605 KiB  
Article
The Need for Accurate Geometric and Radiometric Corrections of Drone-Borne Hyperspectral Data for Mineral Exploration: MEPHySTo—A Toolbox for Pre-Processing Drone-Borne Hyperspectral Data
by Sandra Jakob *, Robert Zimmermann and Richard Gloaguen
Helmholtz-Zentrum Dresden-Rossendorf, Helmholtz Institute Freiberg for Resource Technology, Division “Exploration Technology”, Chemnitzer Str. 40, 09599 Freiberg, Germany
Remote Sens. 2017, 9(1), 88; https://doi.org/10.3390/rs9010088 - 18 Jan 2017
Cited by 170 | Viewed by 21772
Abstract
Drone-borne hyperspectral imaging is a new and promising technique for fast and precise acquisition, as well as delivery of high-resolution hyperspectral data to a large variety of end-users. Drones can overcome the scale gap between field and air-borne remote sensing, thus providing high-resolution [...] Read more.
Drone-borne hyperspectral imaging is a new and promising technique for fast and precise acquisition, as well as delivery of high-resolution hyperspectral data to a large variety of end-users. Drones can overcome the scale gap between field and air-borne remote sensing, thus providing high-resolution and multi-temporal data. They are easy to use, flexible and deliver data within cm-scale resolution. So far, however, drone-borne imagery has prominently and successfully been almost solely used in precision agriculture and photogrammetry. Drone technology currently mainly relies on structure-from-motion photogrammetry, aerial photography and agricultural monitoring. Recently, a few hyperspectral sensors became available for drones, but complex geometric and radiometric effects complicate their use for geology-related studies. Using two examples, we first show that precise corrections are required for any geological mapping. We then present a processing toolbox for frame-based hyperspectral imaging systems adapted for the complex correction of drone-borne hyperspectral imagery. The toolbox performs sensor- and platform-specific geometric distortion corrections. Furthermore, a topographic correction step is implemented to correct for rough terrain surfaces. We recommend the c-factor-algorithm for geological applications. To our knowledge, we demonstrate for the first time the applicability of the corrected dataset for lithological mapping and mineral exploration. Full article
Show Figures

Graphical abstract

19 pages, 8194 KiB  
Article
High Resolution Aerosol Optical Depth Retrieval Using Gaofen-1 WFV Camera Data
by Kun Sun 1, Xiaoling Chen 1,2,*, Zhongmin Zhu 1,3,* and Tianhao Zhang 1
1 State Key Laboratory of Information Engineering in Surveying, Mapping and Remote Sensing, Wuhan University, Wuhan 430079, China
2 The Key Laboratory of Poyang Lake Wetland and Watershed Research, Ministry of Education, Jiangxi Normal University, Nanchang 330022, China
3 College of Information Science and Engineering, Wuchang Shouyi University, Wuhan 430064, China
Remote Sens. 2017, 9(1), 89; https://doi.org/10.3390/rs9010089 - 19 Jan 2017
Cited by 33 | Viewed by 9172
Abstract
Aerosol Optical Depth (AOD) is crucial for urban air quality assessment. However, the frequently used moderate-resolution imaging spectroradiometer (MODIS) AOD product at 10 km resolution is too coarse to be applied in a regional-scale study. Gaofen-1 (GF-1) wide-field-of-view (WFV) camera data, with high [...] Read more.
Aerosol Optical Depth (AOD) is crucial for urban air quality assessment. However, the frequently used moderate-resolution imaging spectroradiometer (MODIS) AOD product at 10 km resolution is too coarse to be applied in a regional-scale study. Gaofen-1 (GF-1) wide-field-of-view (WFV) camera data, with high spatial and temporal resolution, has great potential in estimation of AOD. Due to the lack of shortwave infrared (SWIR) band and complex surface reflectivity brought from high spatial resolution, it is difficult to retrieve AOD from GF-1 WFV data with traditional methods. In this paper, we propose an improved AOD retrieval algorithm for GF-1 WFV data. The retrieved AOD has a spatial resolution of 160 m and covers all land surface types. Significant improvements in the algorithm include: (1) adopting an improved clear sky composite method by using the MODIS AOD product to identify the clearest days and correct the background atmospheric effect; and (2) obtaining local aerosol models from long-term CIMEL sun-photometer measurements. Validation against MODIS AOD and ground measurements showed that the GF-1 WFV AOD has a good relationship with MODIS AOD (R2 = 0.66; RMSE = 0.27) and ground measurements (R2 = 0.80; RMSE = 0.25). Nevertheless, the proposed algorithm was found to overestimate AOD in some cases, which will need to be improved upon in future research. Full article
(This article belongs to the Special Issue Remote Sensing of Atmospheric Pollution)
Show Figures

Graphical abstract

20 pages, 7004 KiB  
Article
Satellite Attitude Determination and Map Projection Based on Robust Image Matching
by Toru Kouyama 1,*, Atsunori Kanemura 1, Soushi Kato 1, Nevrez Imamoglu 1, Tetsuya Fukuhara 2 and Ryosuke Nakamura 1
1 National Institute of Advanced Industrial Science and Technology (AIST), Tokyo 135-0064, Japan
2 Department of Physics, Rikkyo University, Tokyo 171-8501, Japan
Remote Sens. 2017, 9(1), 90; https://doi.org/10.3390/rs9010090 - 20 Jan 2017
Cited by 32 | Viewed by 13251
Abstract
Small satellites have limited payload and their attitudes are sometimes difficult to determine from the limited onboard sensors alone. Wrong attitudes lead to inaccurate map projections and measurements that require post-processing correction. In this study, we propose an automated and robust scheme that [...] Read more.
Small satellites have limited payload and their attitudes are sometimes difficult to determine from the limited onboard sensors alone. Wrong attitudes lead to inaccurate map projections and measurements that require post-processing correction. In this study, we propose an automated and robust scheme that derives the satellite attitude from its observation images and known satellite position by matching land features from an observed image and from well-registered base-map images. The scheme combines computer vision algorithms (i.e., feature detection, and robust optimization) and geometrical constraints of the satellite observation. Applying the proposed method to UNIFORM-1 observations, which is a 50 kg class small satellite, satellite attitudes were determined with an accuracy of 0.02°, comparable to that of star trackers, if the satellite position is accurately determined. Map-projected images can be generated based on the accurate attitudes. Errors in the satellite position can add systematic errors to derived attitudes. The proposed scheme focuses on determining satellite attitude with feature detection algorithms applying to raw satellite images, unlike image registration studies which register already map-projected images. By delivering accurate attitude determination and map projection, the proposed method can improve the image geometries of small satellites, and thus reveal fine-scale information about the Earth. Full article
Show Figures

Graphical abstract

2 pages, 145 KiB  
Comment
Comment on Hicham Bahi, et al. Effects of Urbanization and Seasonal Cycle on the Surface Urban Heat Island Patterns in the Coastal Growing Cities: A Case Study of Casablanca, Morocco. Remote Sens. 2016, 8, 829
by Brent M. Lofgren
National Oceanic and Atmospheric Administration, Great Lakes Environmental Research Laboratory, Ann Arbor, MI 48108, USA
Remote Sens. 2017, 9(1), 91; https://doi.org/10.3390/rs9010091 - 20 Jan 2017
Cited by 1 | Viewed by 4433
Abstract
A statement in this recently published paper makes a point that is largely at odds with the main point of the paper that is cited. Stating that higher air temperatures lead to greater evapotranspiration is an oversimplification; the true story is more complex. [...] Read more.
A statement in this recently published paper makes a point that is largely at odds with the main point of the paper that is cited. Stating that higher air temperatures lead to greater evapotranspiration is an oversimplification; the true story is more complex. Although this is by no means central to the conclusions of the paper being commented on, we have demonstrated the danger in taking too literally the idea that air temperature determines potential evapotranspiration. Full article
16 pages, 13422 KiB  
Article
A Graph-Based Approach for 3D Building Model Reconstruction from Airborne LiDAR Point Clouds
by Bin Wu 1,2, Bailang Yu 1,2,*, Qiusheng Wu 3, Shenjun Yao 1,2, Feng Zhao 4, Weiqing Mao 4 and Jianping Wu 1,2,*
1 Key Laboratory of Geographic Information Science (Ministry of Education), East China Normal University, Shanghai 200241, China
2 School of Geographic Sciences, East China Normal University, Shanghai 200241, China
3 Department of Geography, Binghamton University, State University of New York, Binghamton, NY 13902, USA
4 Shanghai Surveying and Mapping Institute, 419 Wuning Rd., Shanghai 200063, China
Remote Sens. 2017, 9(1), 92; https://doi.org/10.3390/rs9010092 - 20 Jan 2017
Cited by 80 | Viewed by 13871
Abstract
3D building model reconstruction is of great importance for environmental and urban applications. Airborne light detection and ranging (LiDAR) is a very useful data source for acquiring detailed geometric and topological information of building objects. In this study, we employed a graph-based method [...] Read more.
3D building model reconstruction is of great importance for environmental and urban applications. Airborne light detection and ranging (LiDAR) is a very useful data source for acquiring detailed geometric and topological information of building objects. In this study, we employed a graph-based method based on hierarchical structure analysis of building contours derived from LiDAR data to reconstruct urban building models. The proposed approach first uses a graph theory-based localized contour tree method to represent the topological structure of buildings, then separates the buildings into different parts by analyzing their topological relationships, and finally reconstructs the building model by integrating all the individual models established through the bipartite graph matching process. Our approach provides a more complete topological and geometrical description of building contours than existing approaches. We evaluated the proposed method by applying it to the Lujiazui region in Shanghai, China, a complex and large urban scene with various types of buildings. The results revealed that complex buildings could be reconstructed successfully with a mean modeling error of 0.32 m. Our proposed method offers a promising solution for 3D building model reconstruction from airborne LiDAR point clouds. Full article
(This article belongs to the Special Issue Remote Sensing for 3D Urban Morphology)
Show Figures

Graphical abstract

18 pages, 10465 KiB  
Article
Multi-Staged NDVI Dependent Snow-Free Land-Surface Shortwave Albedo Narrowband-to-Broadband (NTB) Coefficients and Their Sensitivity Analysis
by Shi Peng 1,2, Jianguang Wen 1,3,*, Qing Xiao 1, Dongqin You 1, Baocheng Dou 1,4, Qiang Liu 3,4 and Yong Tang 1
1 State Key Laboratory of Remote Sensing Science, Institute of Remote Sensing and Digital Earth, Chinese Academy of Sciences, No. 20A Datun Road, P.O. Box 9718, Beijing 100101, China
2 University of Chinese Academy of Sciences, Beijing 100049, China
3 Joint Center for Global Change Studies, Beijing 100875, China
4 College of Global Change and Earth System Science, Beijing Normal University, No. 19 XinjiekouWai Street, Haidian District, Beijing 100875, China
Remote Sens. 2017, 9(1), 93; https://doi.org/10.3390/rs9010093 - 20 Jan 2017
Cited by 12 | Viewed by 6381
Abstract
Narrowband-to-broadband conversion is a critical procedure for mapping land-surface broadband albedo using multi-spectral narrowband remote-sensing observations. Due to the significant difference in optical characteristics between soil and vegetation, NTB conversion is influenced by the variation in vegetation coverage on different surface types. To [...] Read more.
Narrowband-to-broadband conversion is a critical procedure for mapping land-surface broadband albedo using multi-spectral narrowband remote-sensing observations. Due to the significant difference in optical characteristics between soil and vegetation, NTB conversion is influenced by the variation in vegetation coverage on different surface types. To reduce this influence, this paper applies an approach that couples NTB coefficient with the NDVI. Multi-staged NDVI dependent NTB coefficient look-up tables (LUT) for Moderate Resolution Imaging Spectroradiometer (MODIS), Polarization and Directionality of Earth’s Reflectance (POLDER) and Advanced Very High Resolution Radiometer (AVHRR) were calculated using 6000 spectra samples collected from two typical spectral databases. Sensitivity analysis shows that NTB conversion is affected more by the NDVI for sensors with fewer band numbers, such as POLDER and AVHRR. Analysis of the validation results based on simulations, in situ measurements and global albedo products indicates that by using the multi-staged NDVI dependent NTB method, the conversion accuracies of these two sensors could be improved by 2%–13% on different NDVI classes compared with the general method. This improvement could be as high as 15%, on average, and 35% on dense vegetative surface compared with the global broadband albedo product of POLDER. This paper shows that it is necessary to consider surface reflectance characteristics associated with the NDVI on albedo-NTB conversion for remote sensors with fewer than five bands. Full article
Show Figures

Graphical abstract

35 pages, 66049 KiB  
Article
Operational High Resolution Land Cover Map Production at the Country Scale Using Satellite Image Time Series
by Jordi Inglada *, Arthur Vincent, Marcela Arias, Benjamin Tardy, David Morin and Isabel Rodes
CESBIO, Université de Toulouse, CNES/CNRS/IRD/UPS, Toulouse, France
Remote Sens. 2017, 9(1), 95; https://doi.org/10.3390/rs9010095 - 22 Jan 2017
Cited by 321 | Viewed by 34108
Abstract
A detailed and accurate knowledge of land cover is crucial for many scientific and operational applications, and as such, it has been identified as an Essential Climate Variable. This accurate knowledge needs frequent updates. This paper presents a methodology for the fully automatic [...] Read more.
A detailed and accurate knowledge of land cover is crucial for many scientific and operational applications, and as such, it has been identified as an Essential Climate Variable. This accurate knowledge needs frequent updates. This paper presents a methodology for the fully automatic production of land cover maps at country scale using high resolution optical image time series which is based on supervised classification and uses existing databases as reference data for training and validation. The originality of the approach resides in the use of all available image data, a simple pre-processing step leading to a homogeneous set of acquisition dates over the whole area and the use of a supervised classifier which is robust to errors in the reference data. The produced maps have a kappa coefficient of 0.86 with 17 land cover classes. The processing is efficient, allowing a fast delivery of the maps after the acquisition of the image data, does not need expensive field surveys for model calibration and validation, nor human operators for decision making, and uses open and freely available imagery. The land cover maps are provided with a confidence map which gives information at the pixel level about the expected quality of the result. Full article
Show Figures

Graphical abstract

18 pages, 13392 KiB  
Article
Hierarchical Terrain Classification Based on Multilayer Bayesian Network and Conditional Random Field
by Chu He 1,2,*, Xinlong Liu 1, Di Feng 1, Bo Shi 1, Bin Luo 2 and Mingsheng Liao 2
1 Electronic and Information School, Wuhan University, Wuhan 430072, China
2 State Key Laboratory for Information Engineering in Surveying, Mapping and Remote Sensing, Wuhan University, Wuhan 430079, China
Remote Sens. 2017, 9(1), 96; https://doi.org/10.3390/rs9010096 - 22 Jan 2017
Cited by 10 | Viewed by 6236
Abstract
This paper presents a hierarchical classification approach for Synthetic Aperture Radar (SAR) images. The Conditional Random Field (CRF) and Bayesian Network (BN) are employed to incorporate prior knowledge into this approach for facilitating SAR image classification. (1) A multilayer region pyramid is constructed [...] Read more.
This paper presents a hierarchical classification approach for Synthetic Aperture Radar (SAR) images. The Conditional Random Field (CRF) and Bayesian Network (BN) are employed to incorporate prior knowledge into this approach for facilitating SAR image classification. (1) A multilayer region pyramid is constructed based on multiscale oversegmentation, and then, CRF is used to model the spatial relationships among those extracted regions within each layer of the region pyramid; the boundary prior knowledge is exploited and integrated into the CRF model as a strengthened constraint to improve classification performance near the boundaries. (2) Multilayer BN is applied to establish the causal connections between adjacent layers of the constructed region pyramid, where the classification probabilities of those sub-regions in the lower layer, conditioned on their parents’ regions in the upper layer, are used as adjacent links. More contextual information is taken into account in this framework, which is a benefit to the performance improvement. Several experiments are conducted on real ESAR and TerraSAR data, and the results show that the proposed method achieves better classification accuracy. Full article
Show Figures

Graphical abstract

31 pages, 1089 KiB  
Article
Gross Primary Production of a Wheat Canopy Relates Stronger to Far Red Than to Red Solar-Induced Chlorophyll Fluorescence
by Yves Goulas 1,*, Antoine Fournier 1, Fabrice Daumard 1, Sébastien Champagne 1, Abderrahmane Ounis 1, Olivier Marloie 2 and Ismael Moya 1
1 LMD/IPSL, CNRS, ENS, PSL Research University, Ecole polytechnique, Université Paris-Saclay, UPMC Univ Paris 06, Sorbonne Universités, 91128 Palaiseau, France
2 Institut National de la Recherche Agronomique, Unité Environnement Méditerranéen et Modélisation des Agro-Hydrosystèmes, 84914 Avignon, France
Remote Sens. 2017, 9(1), 97; https://doi.org/10.3390/rs9010097 - 22 Jan 2017
Cited by 91 | Viewed by 9808
Abstract
Sun-induced chlorophyll fluorescence (SIF) is a radiation flux emitted by chlorophyll molecules in the red (RSIF) and far red region (FRSIF), and is considered as a potential indicator of the functional state of photosynthesis in remote sensing applications. Recently, ground studies and space [...] Read more.
Sun-induced chlorophyll fluorescence (SIF) is a radiation flux emitted by chlorophyll molecules in the red (RSIF) and far red region (FRSIF), and is considered as a potential indicator of the functional state of photosynthesis in remote sensing applications. Recently, ground studies and space observations have demonstrated a strong empirical linear relationship between FRSIF and carbon uptake through photosynthesis (GPP, gross primary production). In this study, we investigated the potential of RSIF and FRSIF to represent the functional status of photosynthesis at canopy level on a wheat crop. RSIF and FRSIF were continuously measured in the O2-B (SIF687) and O2-A bands (SIF760) at a high frequency rate from a nadir view at a height of 21 m, simultaneously with carbon uptake using eddy covariance (EC) techniques. The relative fluorescence yield (Fyield) and the photochemical yield were acquired at leaf level using active fluorescence measurements. SIF was normalized with photosynthetically active radiation (PAR) to derive apparent spectral fluorescence yields (ASFY687, ASFY760). At the diurnal scale, we found limited variations of ASFY687 and ASFY760 during sunny days. We also did not find any link between Fyield and light use efficiency (LUE) derived from EC, which would prevent SIF from indicating LUE changes. The coefficient of determination ( r 2 ) of the linear regression between SIF and GPP is found to be highly variable, depending on the emission wavelength, the time scale of observation, sky conditions, and the phenological stage. Despite its photosystem II (PSII) origin, SIF687 correlates less than SIF760 with GPP in any cases. The strongest SIF–GPP relationship was found for SIF760 during canopy growth. When canopy is in a steady state, SIF687 and SIF760 are almost as effective as PAR in predicting GPP. Our results imply some constraints in the use of simple linear relationships to infer GPP from SIF, as they are expected to be better predictive with far red SIF for canopies with a high dynamic range of green biomass and a low LUE variation range. Full article
Show Figures

Graphical abstract

14 pages, 1296 KiB  
Article
Fusion of Ultrasonic and Spectral Sensor Data for Improving the Estimation of Biomass in Grasslands with Heterogeneous Sward Structure
by Thomas Moeckel *, Hanieh Safari, Björn Reddersen, Thomas Fricke and Michael Wachendorf
Department of Grassland Science and Renewable Plant Resources, University of Kassel, Steinstr. 19, D-37213 Witzenhausen, Germany
Remote Sens. 2017, 9(1), 98; https://doi.org/10.3390/rs9010098 - 21 Jan 2017
Cited by 71 | Viewed by 9424
Abstract
An accurate estimation of biomass is needed to understand the spatio-temporal changes of forage resources in pasture ecosystems and to support grazing management decisions. A timely evaluation of biomass is challenging, as it requires efficient means such as technical sensing methods to assess [...] Read more.
An accurate estimation of biomass is needed to understand the spatio-temporal changes of forage resources in pasture ecosystems and to support grazing management decisions. A timely evaluation of biomass is challenging, as it requires efficient means such as technical sensing methods to assess numerous data and create continuous maps. In order to calibrate ultrasonic and spectral sensors, a field experiment with heterogeneous pastures continuously stocked by cows at three grazing intensities was conducted. Sensor data fusion by combining ultrasonic sward height (USH) with narrow band normalized difference spectral index (NDSI) (R2CV = 0.52) or simulated WorldView2 (WV2) (R2CV = 0.48) satellite broad bands increased the prediction accuracy significantly, compared to the exclusive use of USH or spectral measurements. Some combinations were even better than the use of the full hyperspectral information (R2CV = 0.48). Spectral regions related to plant water content were found to be of particular importance (996–1225 nm). Fusion of ultrasonic and spectral sensors is a promising approach to assess biomass even in heterogeneous pastures. However, the suggested technique may have limited usefulness in the second half of the growing season, due to an increasing abundance of senesced material. Full article
(This article belongs to the Special Issue Remote Sensing of Above Ground Biomass)
Show Figures

Figure 1

Previous Issue
Next Issue
Back to TopTop