Abstract
Rice lodging identification relies on manual in situ assessment and often leads to a compensation dispute in agricultural disaster assessment. Therefore, this study proposes a comprehensive and efficient classification technique for agricultural lands that entails using unmanned aerial vehicle (UAV) imagery. In addition to spectral information, digital surface model (DSM) and texture information of the images was obtained through image-based modeling and texture analysis. Moreover, single feature probability (SFP) values were computed to evaluate the contribution of spectral and spatial hybrid image information to classification accuracy. The SFP results revealed that texture information was beneficial for the classification of rice and water, DSM information was valuable for lodging and tree classification, and the combination of texture and DSM information was helpful in distinguishing between artificial surface and bare land. Furthermore, a decision tree classification model incorporating SFP values yielded optimal results, with an accuracy of 96.17% and a Kappa value of 0.941, compared with that of a maximum likelihood classification model (90.76%). The rice lodging ratio in paddies at the study site was successfully identified, with three paddies being eligible for disaster relief. The study demonstrated that the proposed spatial and spectral hybrid image classification technology is a promising tool for rice lodging assessment.
1. Introduction
Grains are the foundation of social development, and efficient and accurate classification of agricultural lands can facilitate the control of crop production for social stability. According to statistics published by the Food and Agriculture Organization of the United Nations, among various grains, rice (Oryza sativa L.) accounts for 20% of the world’s dietary energy and is the staple food of >50% of the world’s population [1]. However, frequent natural disasters such as typhoons, heavy rains, and droughts hinder rice production and can cause substantial financial losses for smallholder farmers [2,3,4,5], particularly in intensive agricultural practice areas such as Taiwan.
Many countries have implemented compensatory measures for agricultural losses caused by natural disasters [6,7]. Currently, in situ disaster assessment of agricultural lands is mostly conducted manually worldwide. According to the Implementation Rules of Agricultural Natural Disaster Relief in Taiwan, township offices must perform a preliminary disaster assessment within 3 days of a disaster and complete a comprehensive disaster investigation within 7 days. After reporting to the county government, township offices must conduct sampling reviews within 2 weeks. A sampled agricultural paddy with ≥20% lodging is considered a disaster area; to able to receive cash and project assistance for rapidly restoring damaged agricultural land, a sampling accuracy of ≥90% is required. All assessments are conducted through estimation and random sampling because of the vast land area of the country and labor constraints. Consequently, assessments frequently yield inaccurate and overdue loss reports because of time and human labor constraints. In addition, local authorities often deliberately overreport losses in order to obtain generous subsidies from the central government and gain favor from local communities. Therefore, overreporting affects disaster control and relief policies. Moreover, in irregular damaged agricultural fields, directly calculating the damaged areas with the unaided eyes is difficult. Furthermore, the affected farmers are required to preserve evidence of the damage during assessment; thus, they are not allowed to resume cultivation for at least 2 weeks, which considerably affects their livelihood. Therefore, to provide a quantitative assessment method and rapidly alleviate farmers’ burdens, developing a comprehensive and efficient agricultural disaster assessment approach to accelerate the disaster relief process is imperative.
Remote sensing has been broadly applied to disaster assessment [8,9,10,11]. To reduce compensation disputes on crop lodging interpretation assessment after an agricultural disaster, many remote sensing applications have been applied to agricultural disaster assessment [12,13,14]. For example, satellite images captured through synthetic aperture radar (SAR) have been widely used for agricultural management, classification, and disaster assessment [15]. However, limited by the fixed capturing time and spatial resolution, satellite images often cannot provide accurate real-time data for disaster interpretation [16]. In addition, SAR requires constant retracking during imaging because of the fixed baseline length, resulting in low spatial and temporal consistency levels and thus reducing the applicability of SAR images in disaster interpretation [15].
Unmanned aerial vehicles (UAVs), which have been rapidly developed in the past few years, exhibit advantages of low cost and easy operation [17,18,19,20]. UAVs fly at lower heights than satellites and can instantly capture bird’s-eye view images with a high subdecimeter spatial resolution by flying designated routes according to demands. Owing to the advanced techniques of computer vision and digital photogrammetry, UAV images can be used to produce comprehensive georectified image mosaics, three-dimensional (3D) point cloud data [21], and digital surface models (DSMs) through many techniques and image-based modeling (IBM) algorithms such as Structure-from-Motion (SfM), multiview stereo (MVS), scale-invariant feature transform (SIFT), and speeded-up robust features (SURF) [22,23,24]. Therefore, UAVs have been widely applied in production forecasting for agricultural lands [25,26,27,28,29], carbon stock estimation in forests [30], agricultural land classification, and agricultural disaster assessment [31,32,33,34,35]. In addition, height data derived from UAV image-generated DSMs have received considerable attention because studies have revealed that height data possess a critical contribution to classification and have the potential to improve classification accuracy compared with the use of UAV images only [36,37].
This study proposes a comprehensive and efficient rice lodging interpretation method entailing the application of a spatial and spectral hybrid image classification technique to UAV imagery. The study site was an approximately 306-ha crop field that had recently experienced agricultural losses in southern Taiwan. Specifically, spatial information including height data derived from a UAV image-generated DSM and textural features of the site was gathered. In addition to the original spectral information regarding the site, single feature probability (SFP), representing the spectral characteristics of each pixel of the UAV images, was computed to signify the probability metric based on the pixel value and training samples. Through the incorporation of the spatial and spectral information, the classification accuracy was assessed using maximum likelihood classification (MLC) [38,39] and decision tree classification (DTC) [40]. Finally, the proposed hybrid image classification technique was applied to the damaged paddies within the study site to interpret the rice lodging ratio.
2. Materials and Methods
Figure 1 depicts the flowchart of the study protocol, starting with UAV imaging. DSM specifications were formulated by applying IBM 3D reconstruction algorithms to UAV images. Moreover, texture analysis was conducted followed by image combination to produce spatial and spectral hybrid images. After training samples were selected from the site, the SFP value was computed, which was later used as the threshold value in the DTC process. Finally, image classification accuracy was evaluated using MLC and DTC, and the rice lodging ratio at the study site was interpreted.
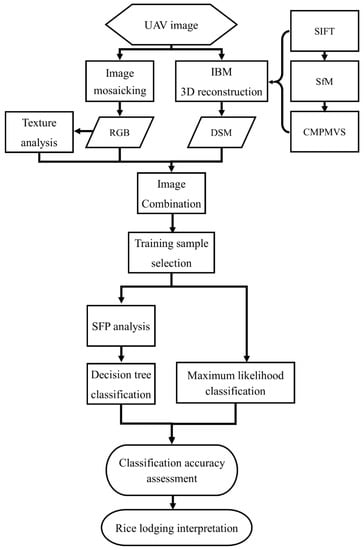
Figure 1.
Research Flowchart.
2.1. Study Site
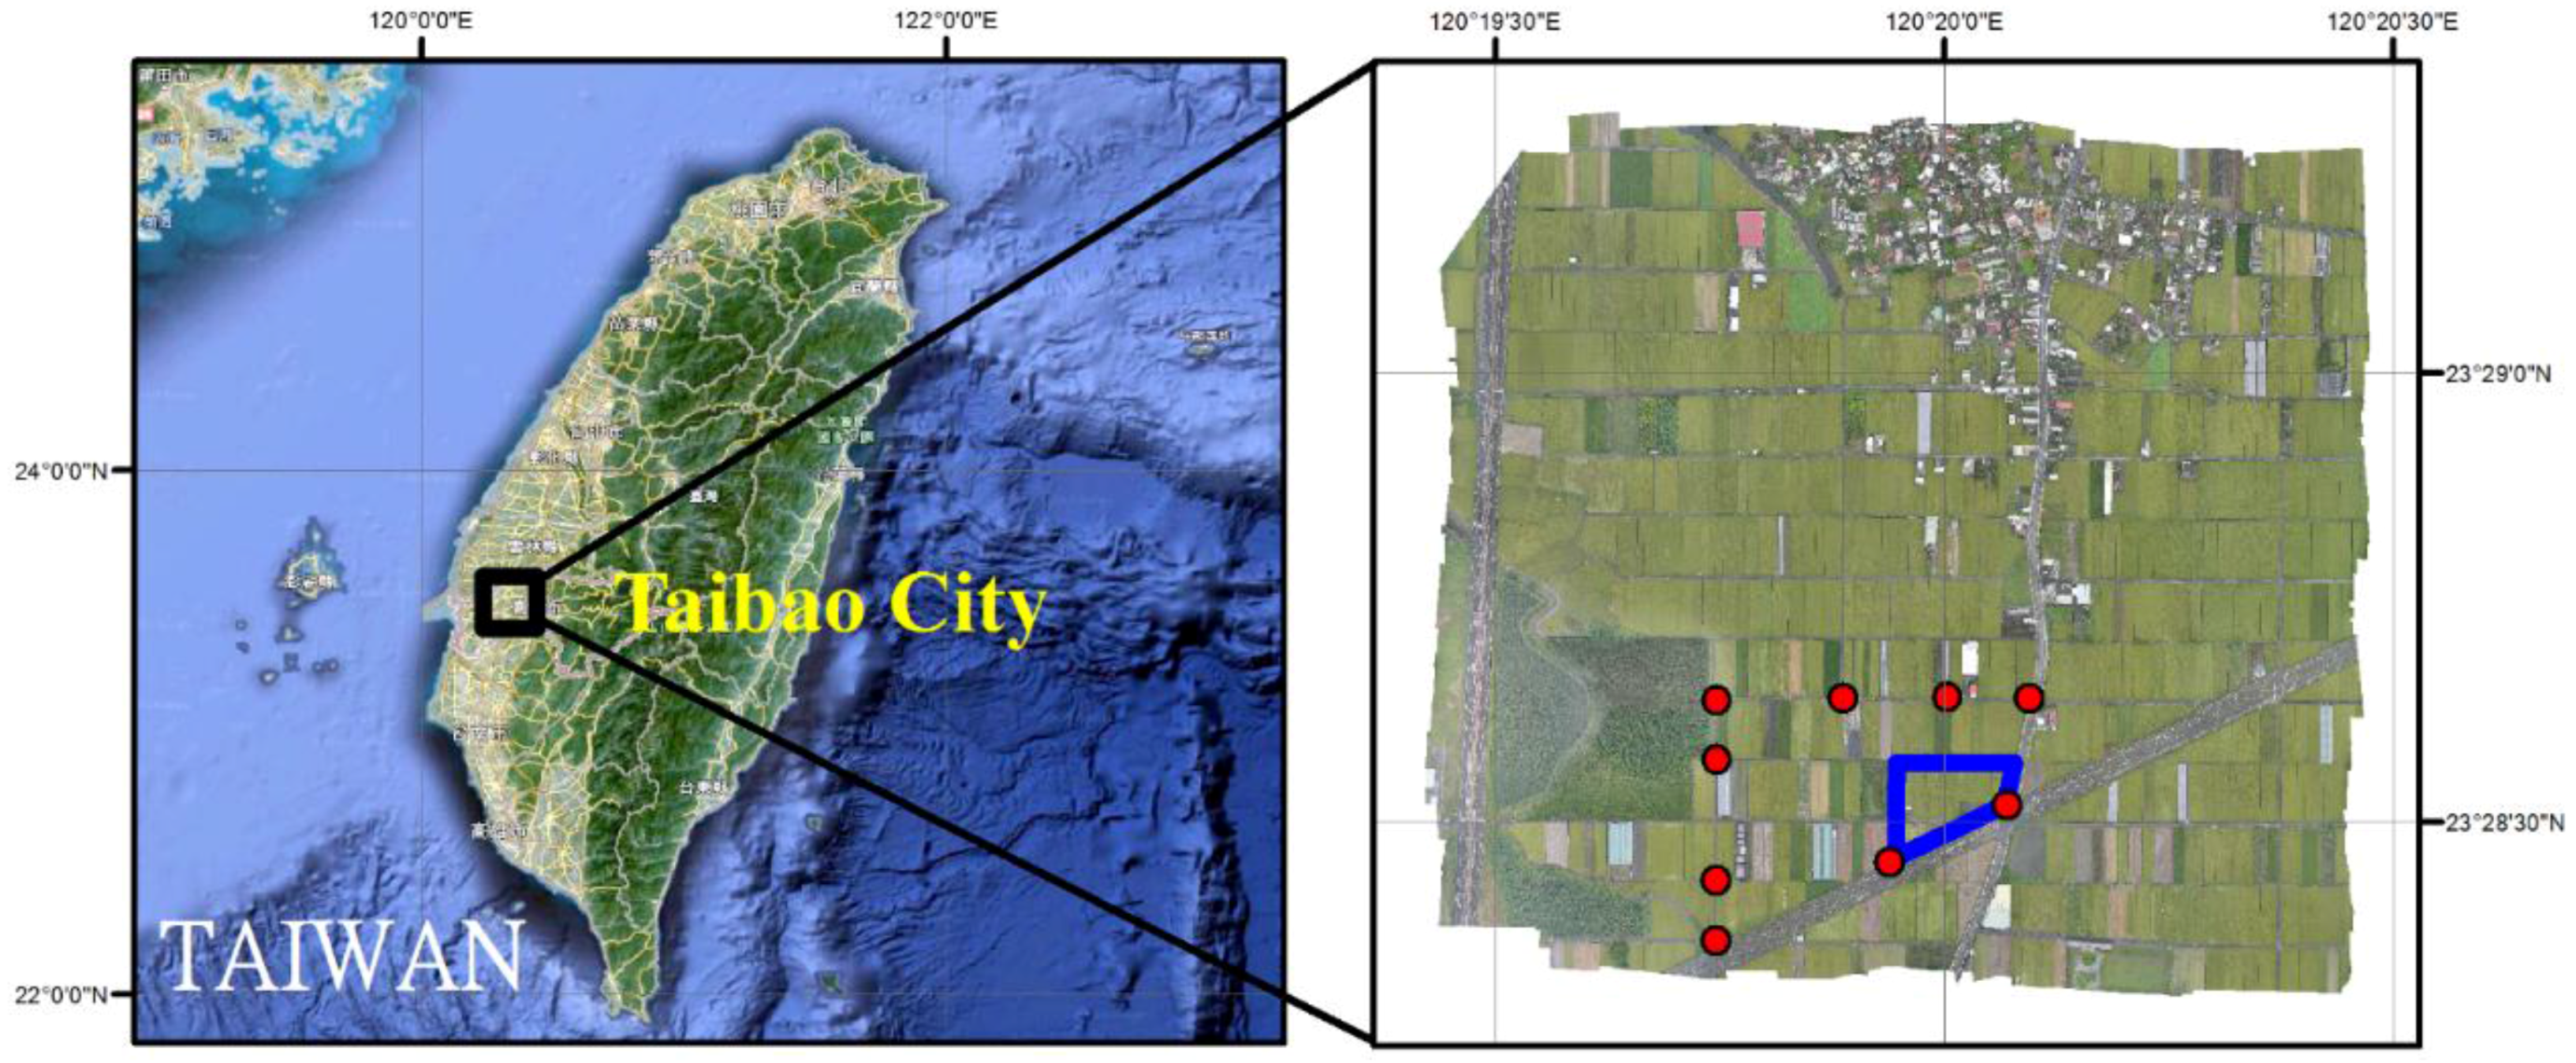
The study site is located in the Chianan Plain and Taibao City, Chiayi County, with a rice production area of approximately 12,000 ha, which is the second largest county in Taiwan (Figure 2).
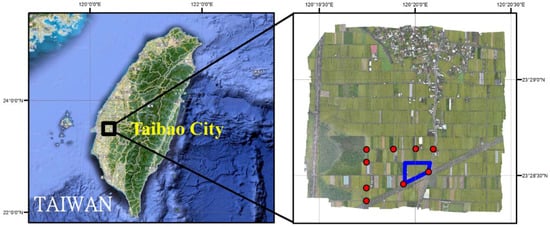
Figure 2.
Location of UAV imaging area, study site (blue polygon), and ground control points (red dot).
Farmers in Taibao City harvest rice twice a year during June–July and September–November; however, they frequently experience rice lodging caused by heavy rains and strong storms associated with weather fronts and typhoons.
On 3 June 2014, a record-breaking rainfall of 235.5 mm/h in Chiayi County associated with a frontal event caused considerable agricultural losses of approximately US$ 80,000. The Chiayi County Government executed an urgent UAV mission to assess the area of rice lodging on 7 June 2014. In total, 424 images were acquired across 306 ha by using an Avian-S fixed-wing UAV with a spatial resolution of 5.5 cm/pixel at a flight height of 233 m, with approximately 3 ha of the rice field used as the study site. The UAV was equipped with a lightweight Samsung NX200 (Samsung Electronics Co., Ltd., Yongin, South Korea) digital camera with a 20.3-megapixel APS-C CMOS sensor, an image size of 23.5 mm × 15.7 mm, and a focal length of 16 mm. The camera recorded data in the visible spectrum by using an RGB color filter. The weather condition was sunny with 10-km/h winds at ground level.
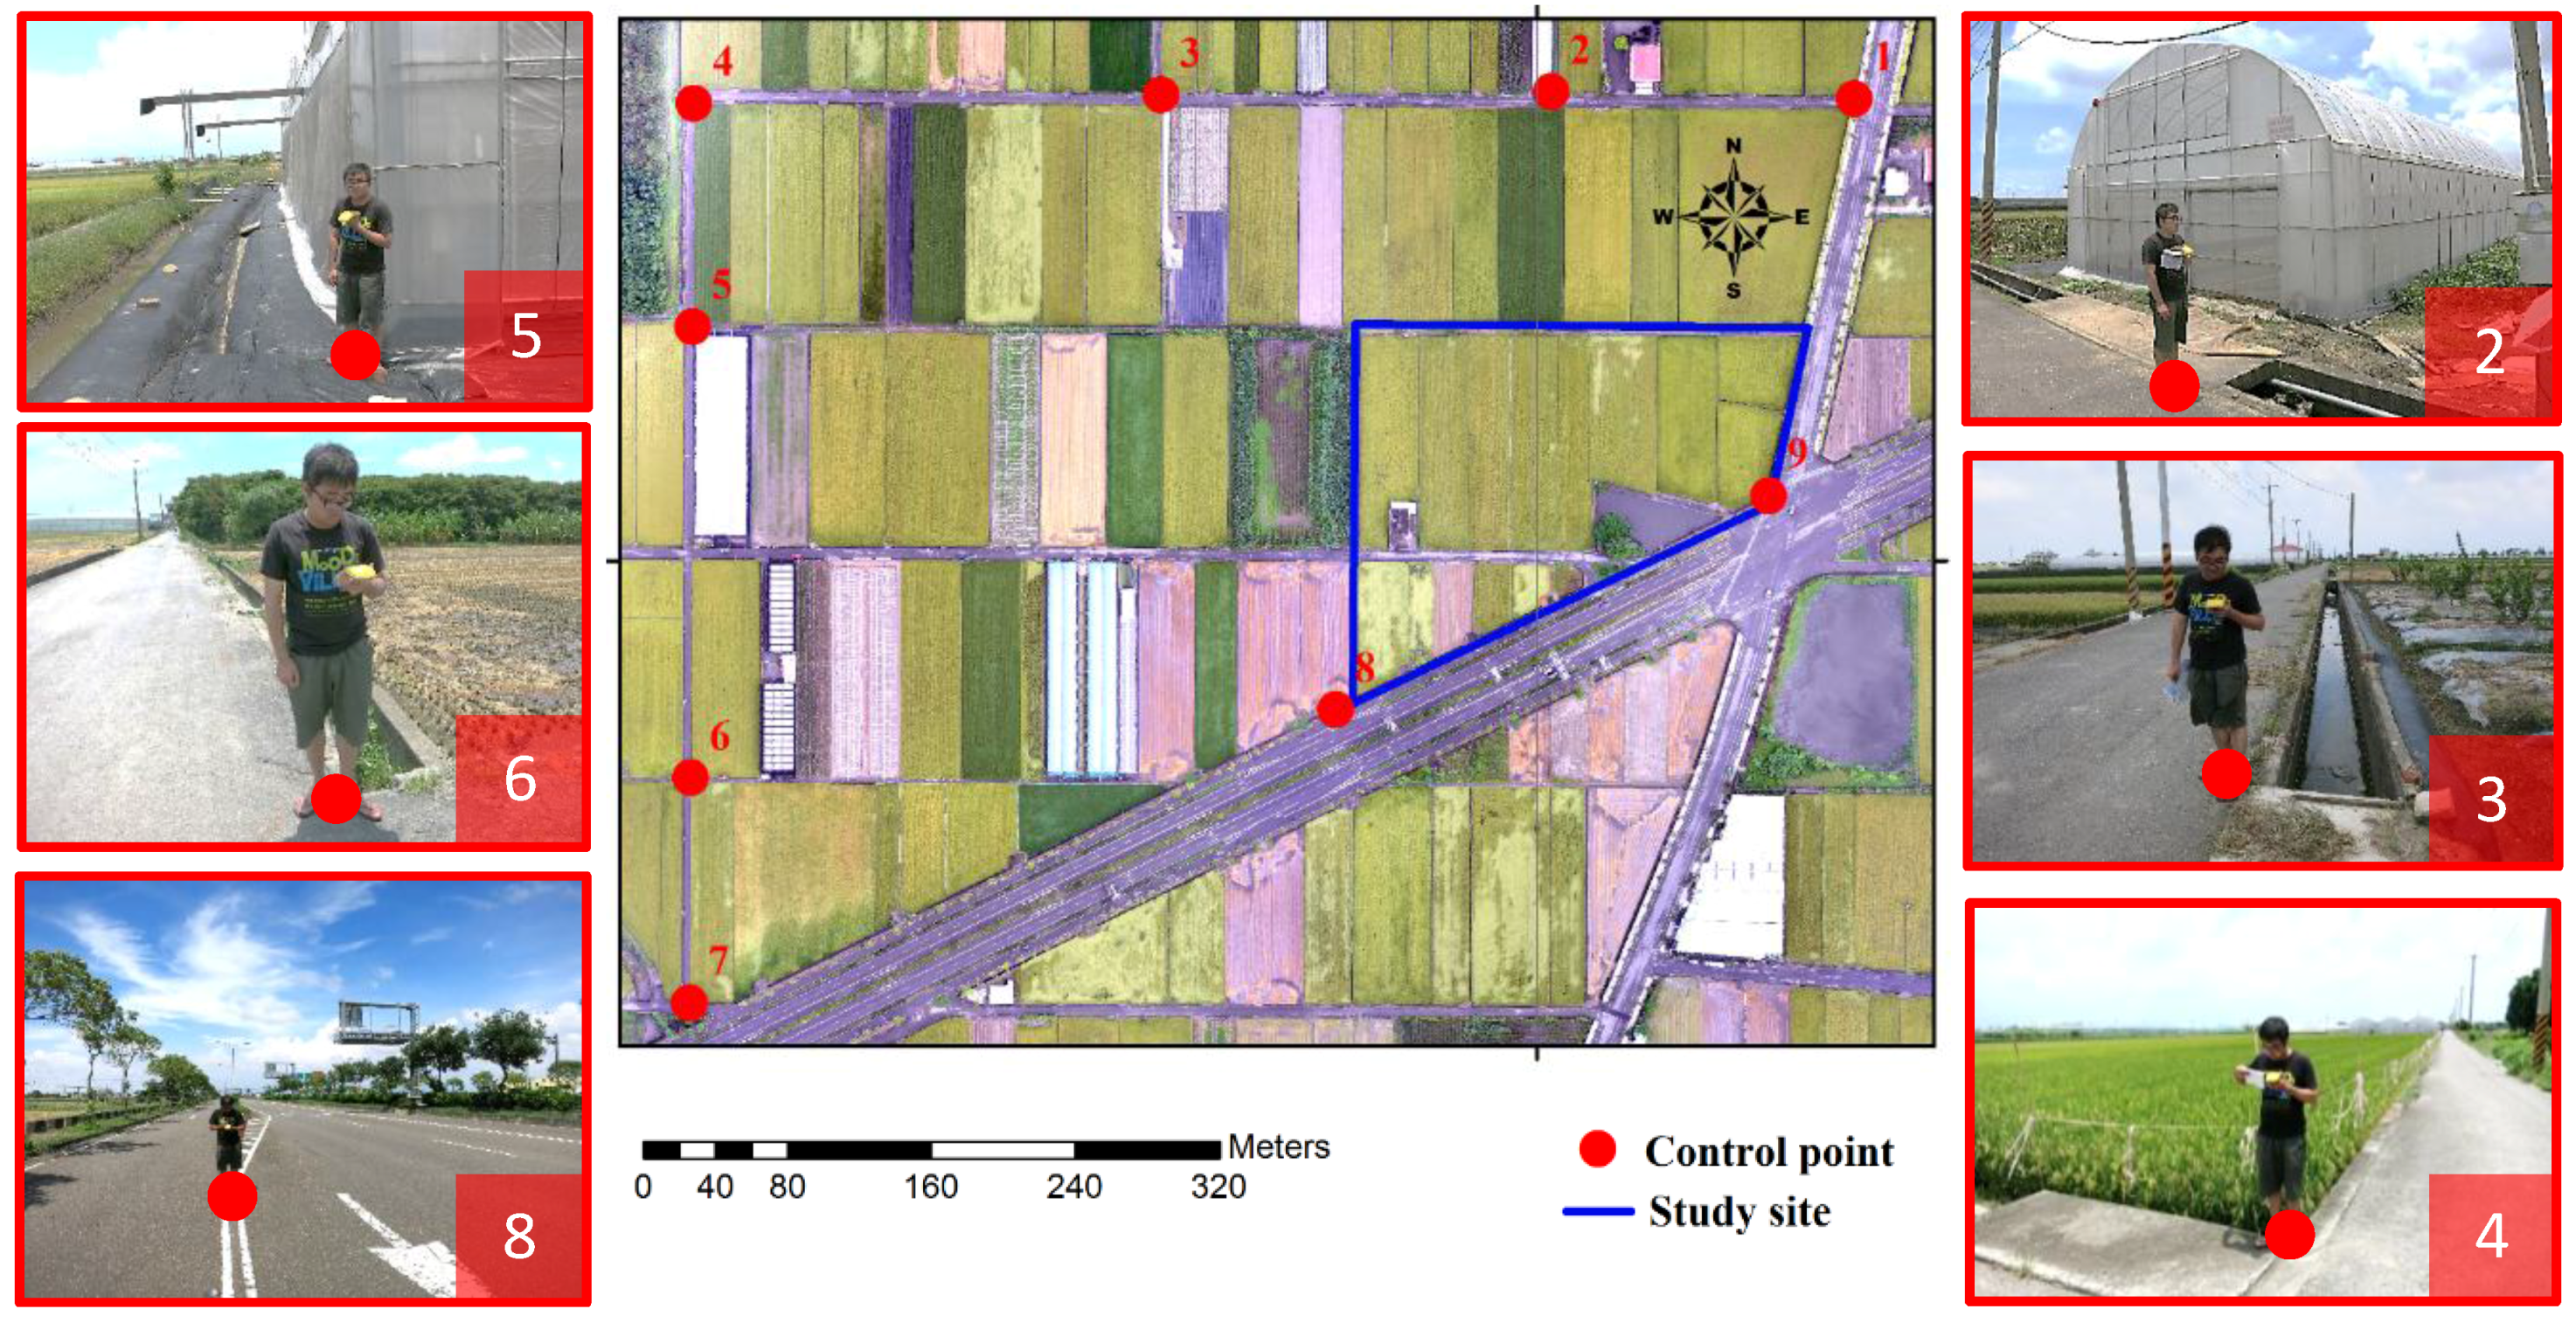
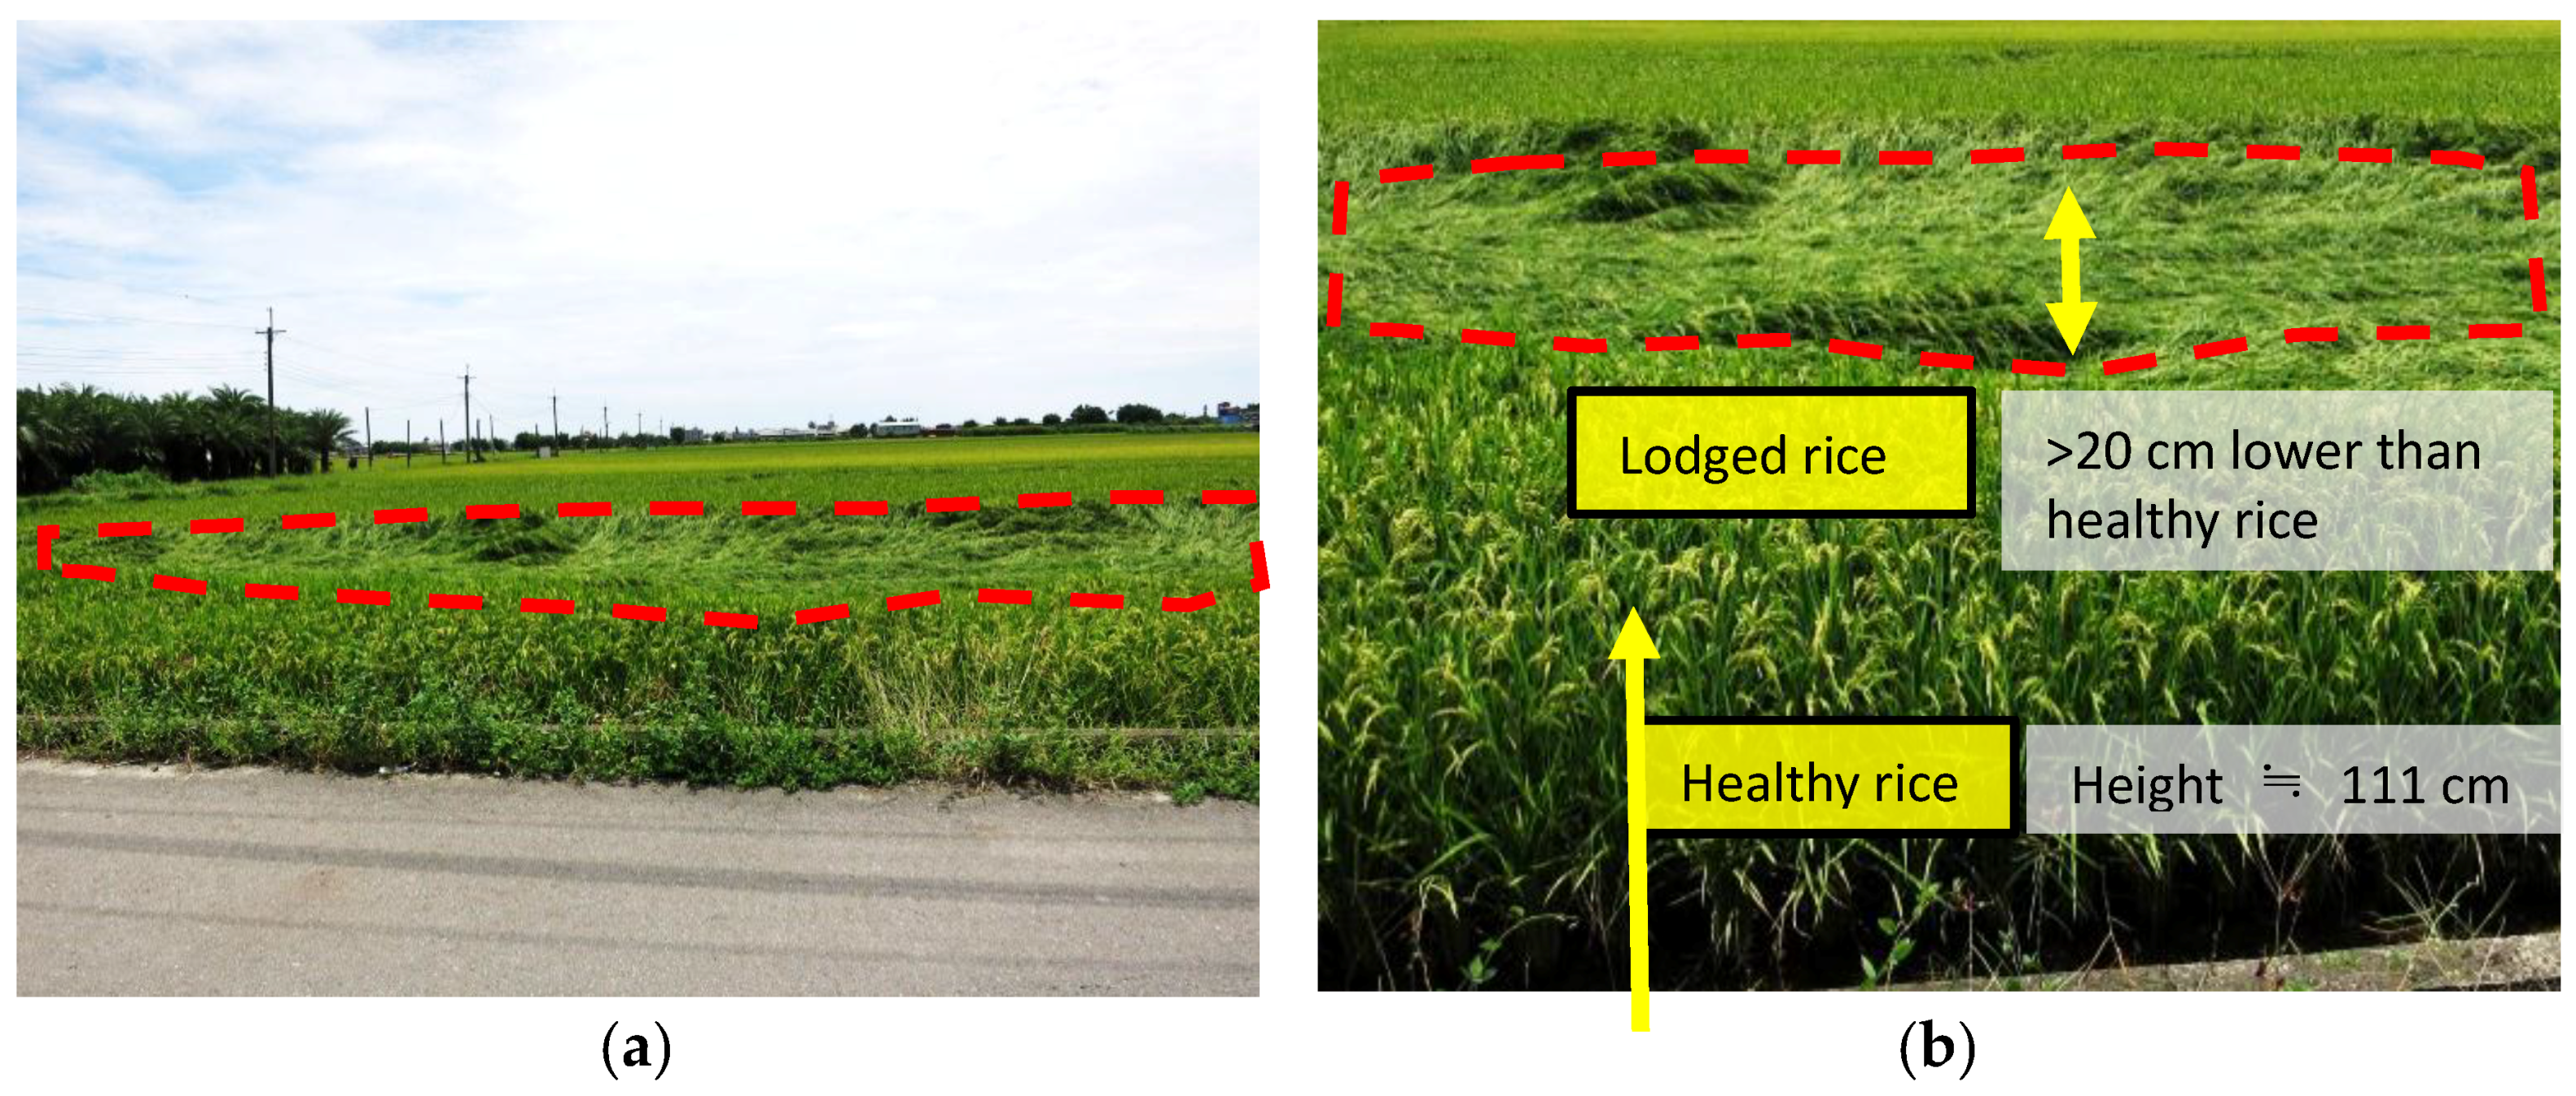
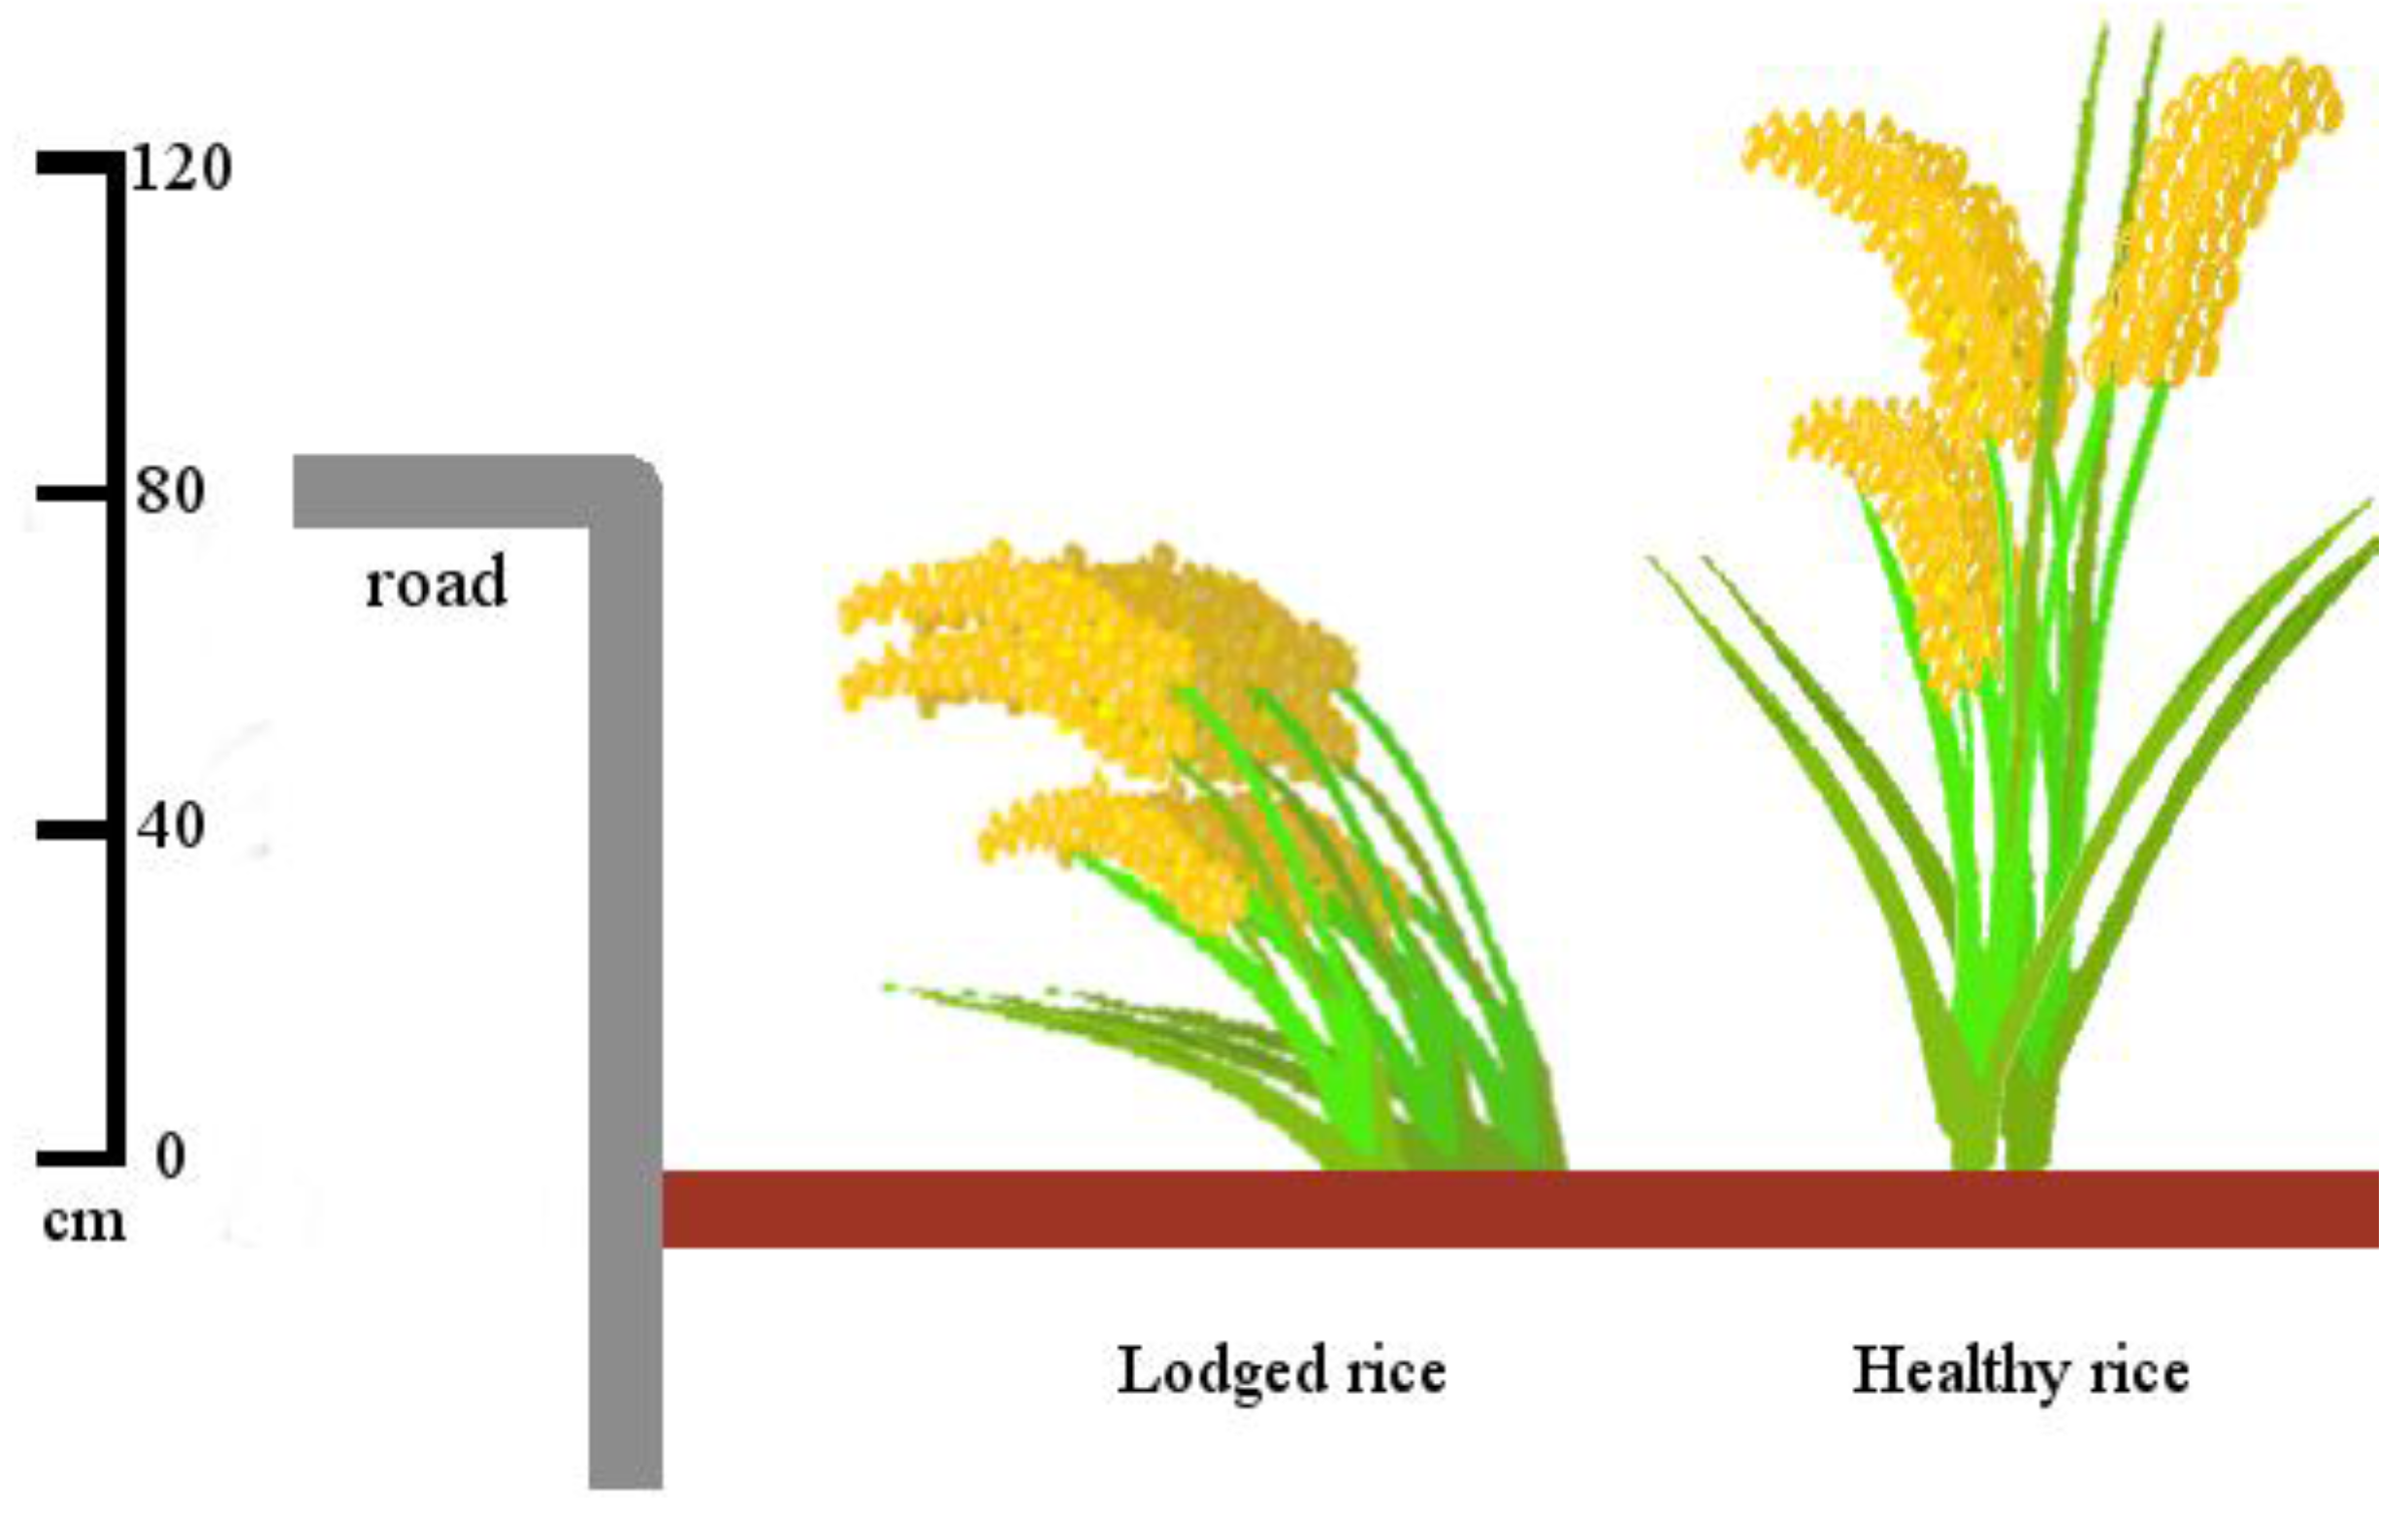
To improve the image accuracy of UAVs in this study, nine ground control points (GCPs) were deployed with highly distinguishable features such as the edges of paddies or road lines. A GeoXH GPS handheld with real-time H-Star technology for subfoot (30 cm) nominal accuracy was placed on the ground to acquire the coordinates of nine GCPs (Figure 3). The rice lodging images and ground truth information were obtained through field surveys. A Trimble M3 Total Station was employed to measure the height difference between the lodged and healthy rice (Figure 4). The study site covers approximately 3 ha and features six land cover types: rice, lodging, tree, water body, artificial surface, and bare land. According to the field survey, the cultivar in the study site is TaiKeng 2 (O. sativa L. c.v. Taiken 2, TK 2). With excellent consumption quality, TK 2 is one of the most popular japonica rice varieties in Taiwan with a plant height of 111.2–111.3 cm [41]. A quick observation revealed the lodged rice to be at least 20 cm lower than the healthy rice (Figure 4b), resulting in the plant height being lower than 90 cm (Figure 5).

Figure 3.
Control points (red dot) with in situ pictures.
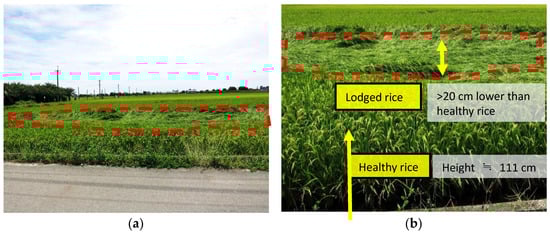
Figure 4.
(a) an in situ rice-lodging picture and (b) a close look at lodged and healthy rice.

Figure 5.
A schematic diagram of plant height comparison of lodged and healthy rice.
2.2. Image-Based Modeling
IBM is a new trend of photometric modeling for generating realistic and accurate virtual 3D models of the environment. Through the use of the invariant feature points of images detected through SIFT, the SfM technique was adopted to simulate the moving tracks of cameras and to identify the target objects in a 3D environment, and the feature points were matched in 3D coordinates. Subsequently, the SfM-generated weakly supported surfaces with a low point cloud density were reinforced using multiview reconstruction software, CMPMVS, to complete 3D model reconstructions. In brief, IBM can be divided into three major steps, namely SIFT, SfM, and CMPMVS; detailed procedures were provided by Yang et al. [42].
SIFT entails matching the feature points to the local features on images that are invariant to image rotation and scaling and partially invariant to changes in illumination and 3D camera viewpoint [43]. SIFT produces highly distinctive features for object and scene recognition by searching for stable features across all possible scales by using a continuous scale function known as scale space [43,44,45,46].
Then, SfM determines the spatial structure according to the motion of the camera and 3D coordinates of the objects by matching identical feature points obtained using SIFT on different images [47,48]. The exchangeable image format used by digital cameras is used to obtain the basic image attributes for estimating motion tracking. Subsequently, the camera position is estimated using the kernel geometry of the feature points. The relationship between the corresponding feature points of the two images is then identified in the trajectory of the feature points. Through the optimization of the estimated point positions on multiple overlapping images by applying bundle adjustment, the coordinates are calculated to determine the intersections and resections of the elements and point positions inside and outside the camera. According to the coordinates of the corresponding positions, a point cloud comprising 3D coordinates and RGB color data is formed.
Finally, CMPMVS, a multiview reconstruction program based on clustering views for multiview stereo and patch-based multiview stereo algorithms, is used to reinforce the SfM-generated weakly supported surfaces of low-textured, transparent, or reflective objects with low point cloud density (e.g., green houses and ponds in agricultural fields). CMPMVS can be used to generate a textured mesh and reconstruct the surface of the final 3D model by using a multiview stereo application [49,50].
2.3. Texture Analysis
Texture analysis is considered an important method of measuring the spatial heterogeneity of remotely sensed images, including pattern variability, shape, and size [51]. By measuring the frequency of gray-tone changes or color-space correlation, texture analysis can describe image details and determine the relationship between pixels [52,53].
Texture analysis is typically categorized into four categories, namely structural, statistical, model-based, and transform approaches [54], of which the statistical approach indirectly represents the texture by using the nondeterministic properties that govern the distributions and relationships between the gray tones of an image; this approach has been demonstrated to outperform the transform-based and structural methods. Regarding the measurement level, the statistical approach can be categorized into first-order statistics, such as mean and variance, and second-order statistics, such as angular second moment (ASM), entropy, contrast, correlation, dissimilarity, and homogeneity [55,56,57,58]. For second-order statistics, the spatial distribution of spectral values is considered and measured using a gray-level co-occurrence matrix, which presents the texture information of an image in adjacency relationships between specific gray tones. According to a study on human texture discrimination, the textures in gray-level images are spontaneously discriminated only if they differ in second-order moments. Therefore, six second-order statistics, namely ASM, entropy, contrast, correlation, dissimilarity, and homogeneity, were employed in this study to measure the texture characteristics. In addition, two first-order statistics, namely mean and variance, were evaluated for comparison.
2.4. Single Feature Probability
SFP, a pixel-based Bayesian-classifier, is used to compute a probability metric (with a value ranging between 0 and 1) for each pixel of the input image based on the pixel value and training samples. The Bayesian network is appropriate because of its ability to handle both continuous and discrete variables, learn from training samples, and return a query metric for candidate pixels demonstrating a goodness of fit to the training samples. Within the selected training areas, representative pixels of land use types are used for computing pixel cue metrics to train the pixel classifier. Candidate pixels from images are then evaluated by the pixel classifier to quantify the degree to which they resemble the training pixels. The pixel cue metrics can include human visual attributes, such as color/tone, texture, and site/situation, and also visually undetectable information, such as spectral transforms or vegetation indices. Higher/lower probability values are assigned to those pixels whose values are similar/different from the training samples [59,60,61]. Subsequently, the feature probability layer (ranging between 0 and 1) is outputted, with each pixel value representing the probability of being the object of interest [62].
2.5. Image Classification
Various classification algorithms have been applied to remotely sensed data for terrain pattern recognition [8,63]. Two supervised classification algorithms, namely MLC and DTC, were employed in the current study, and the classification accuracy levels were assessed.
2.5.1. Maximum Likelihood Classification
The maximum likelihood decision rule is centered on probability [64]. In MLC, the mean vector and covariance matrix in each training set class are calculated, under the assumption that all characteristic values are normally distributed. Subsequently, the probability of belonging is calculated for the unknown pixels, and the pixels are categorized into the training set class with the highest probability [65,66,67]. Because MLC is a supervised classifier, the classification highly depends on the centroid and variation of training sets. Therefore, the selection of training data is crucial in MLC; in this study, two selection criteria were followed: representativeness and efficiency.
2.5.2. Decision Tree Classification
DTC, comprising internal and external nodes connected by branches, is a hierarchical model composed of decision rules that recursively split independent variables into homogeneous zones [68]. Each internal node is associated with a decision rule, whereas each external node indicates the classification results. The tree-structured DTC, a widely used classification technique in machine learning, has been extensively applied to various data analysis systems such as electronic sensors [69] and land cover classification [70]. This study used the classification and regression trees for constructing binary trees with appropriate SFP information employed as the decision rule for each internal node.
3. Results
3.1. Image-Based Modeling
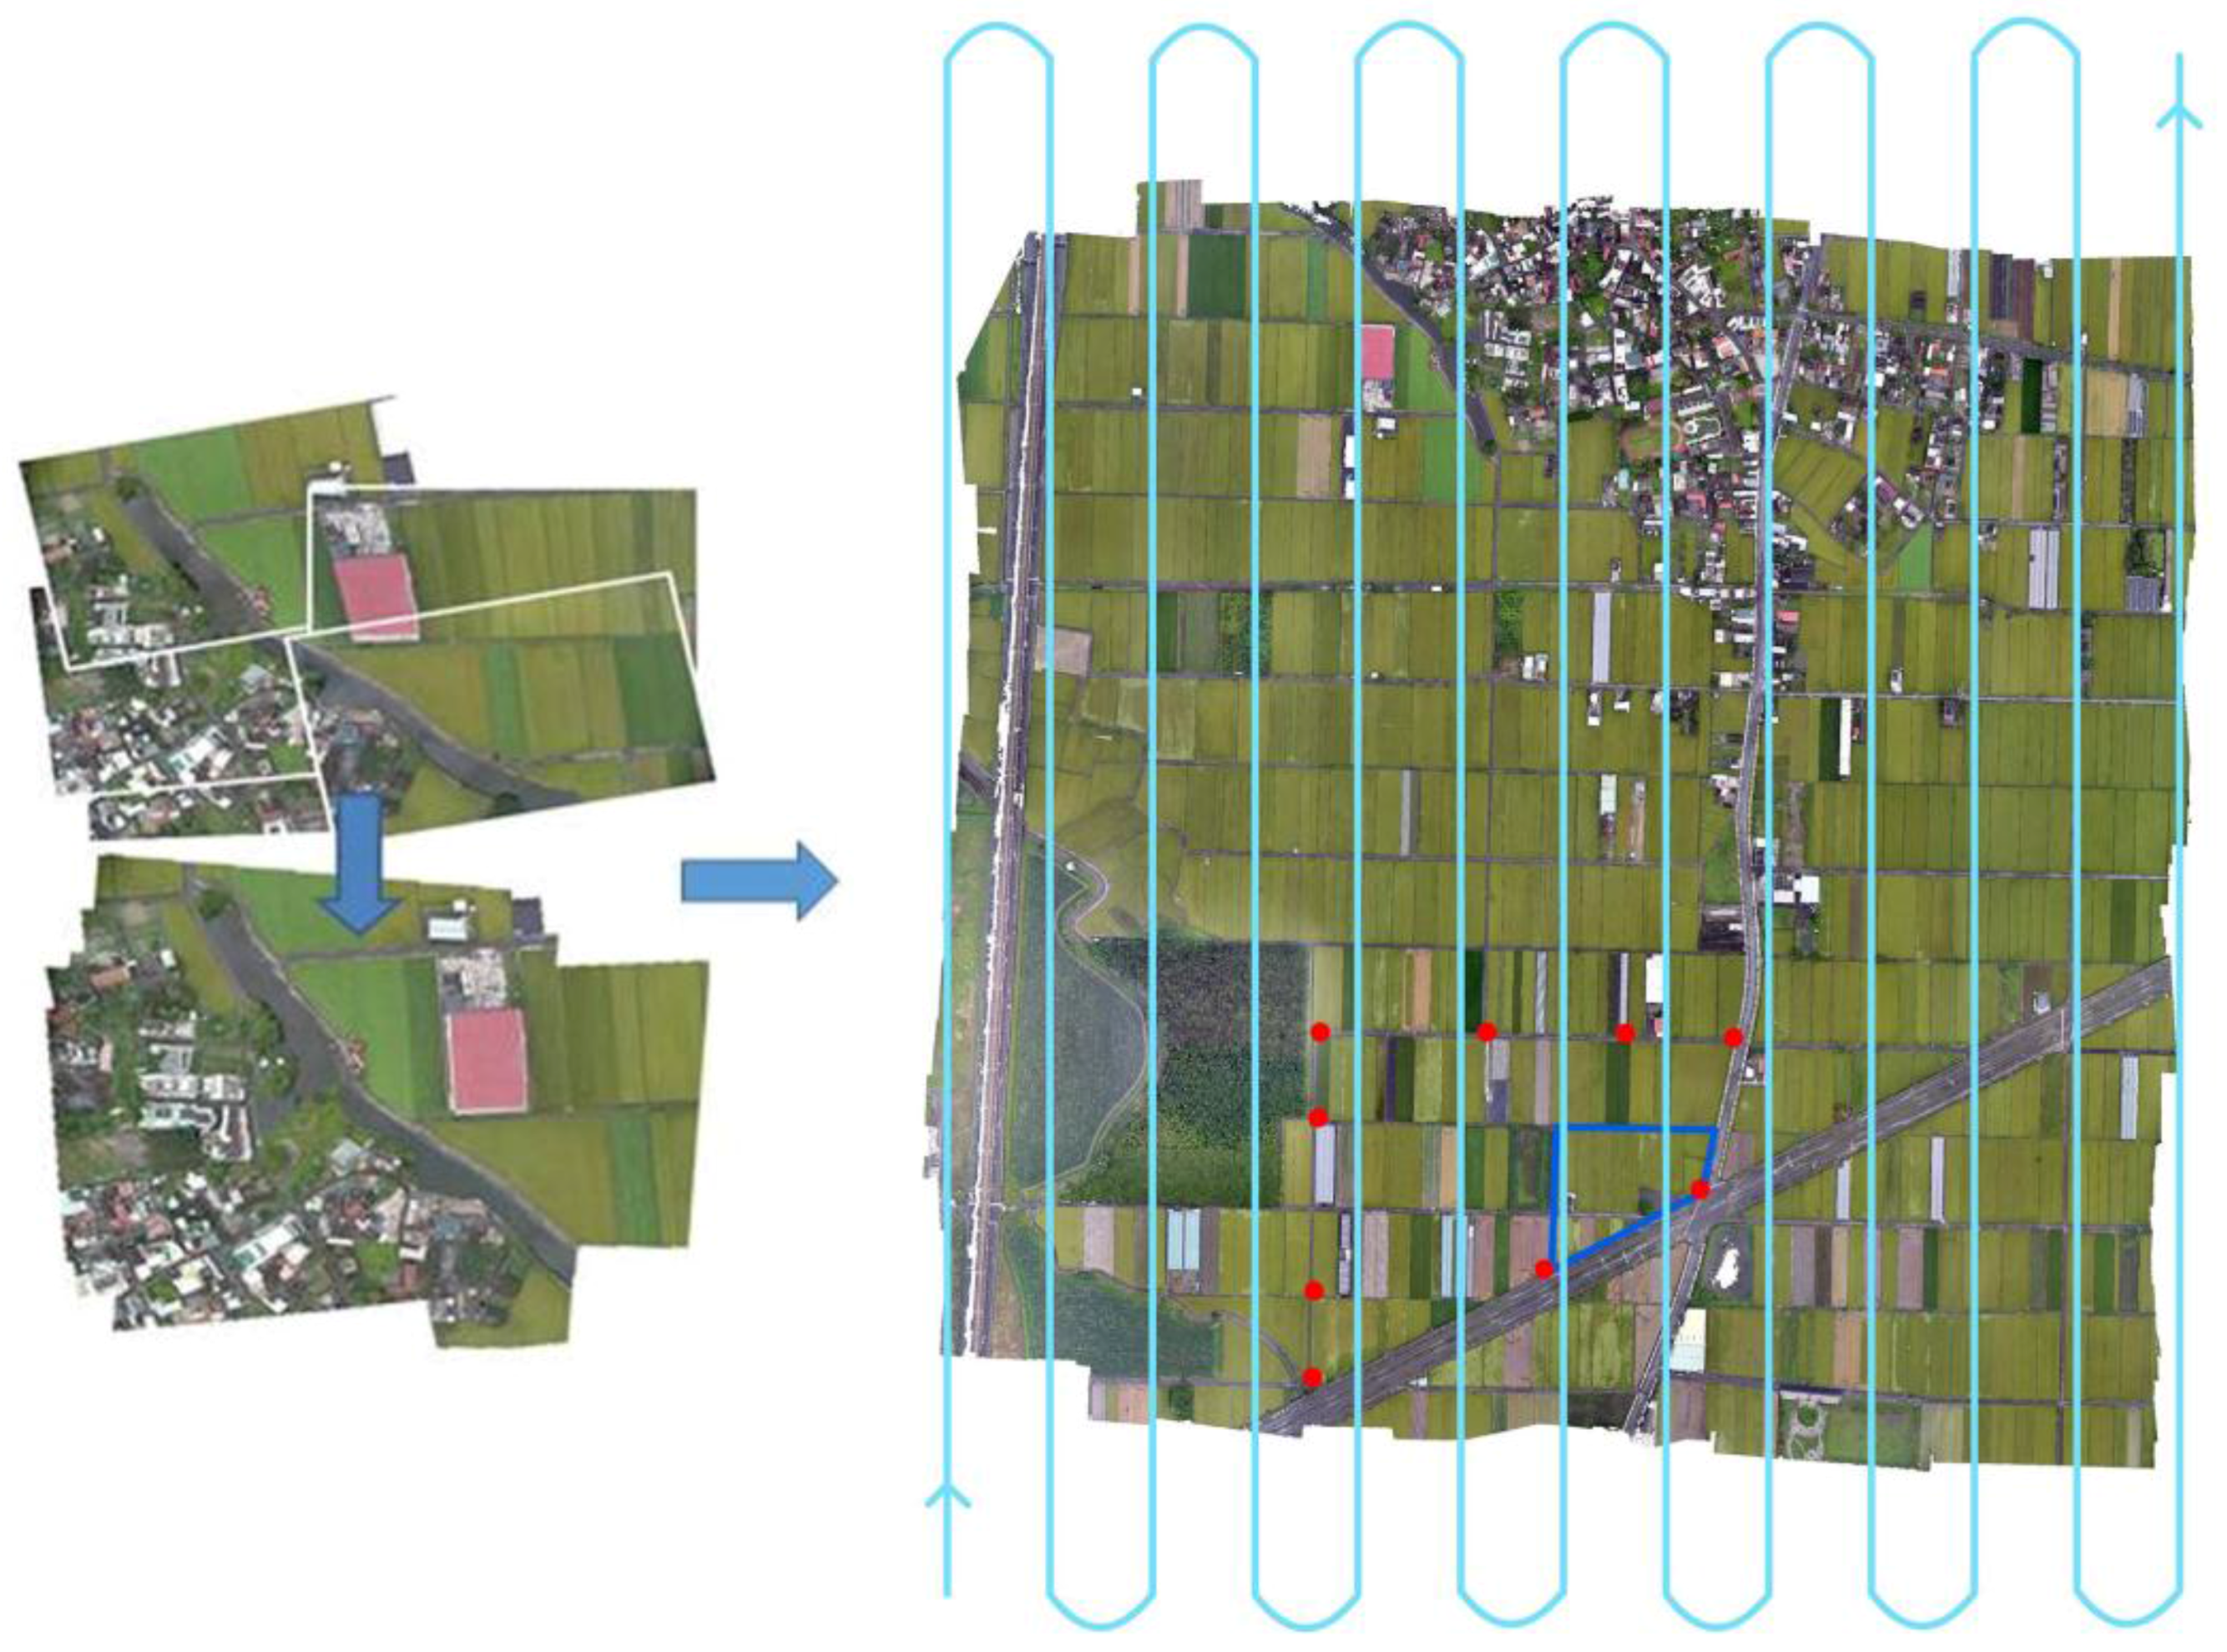
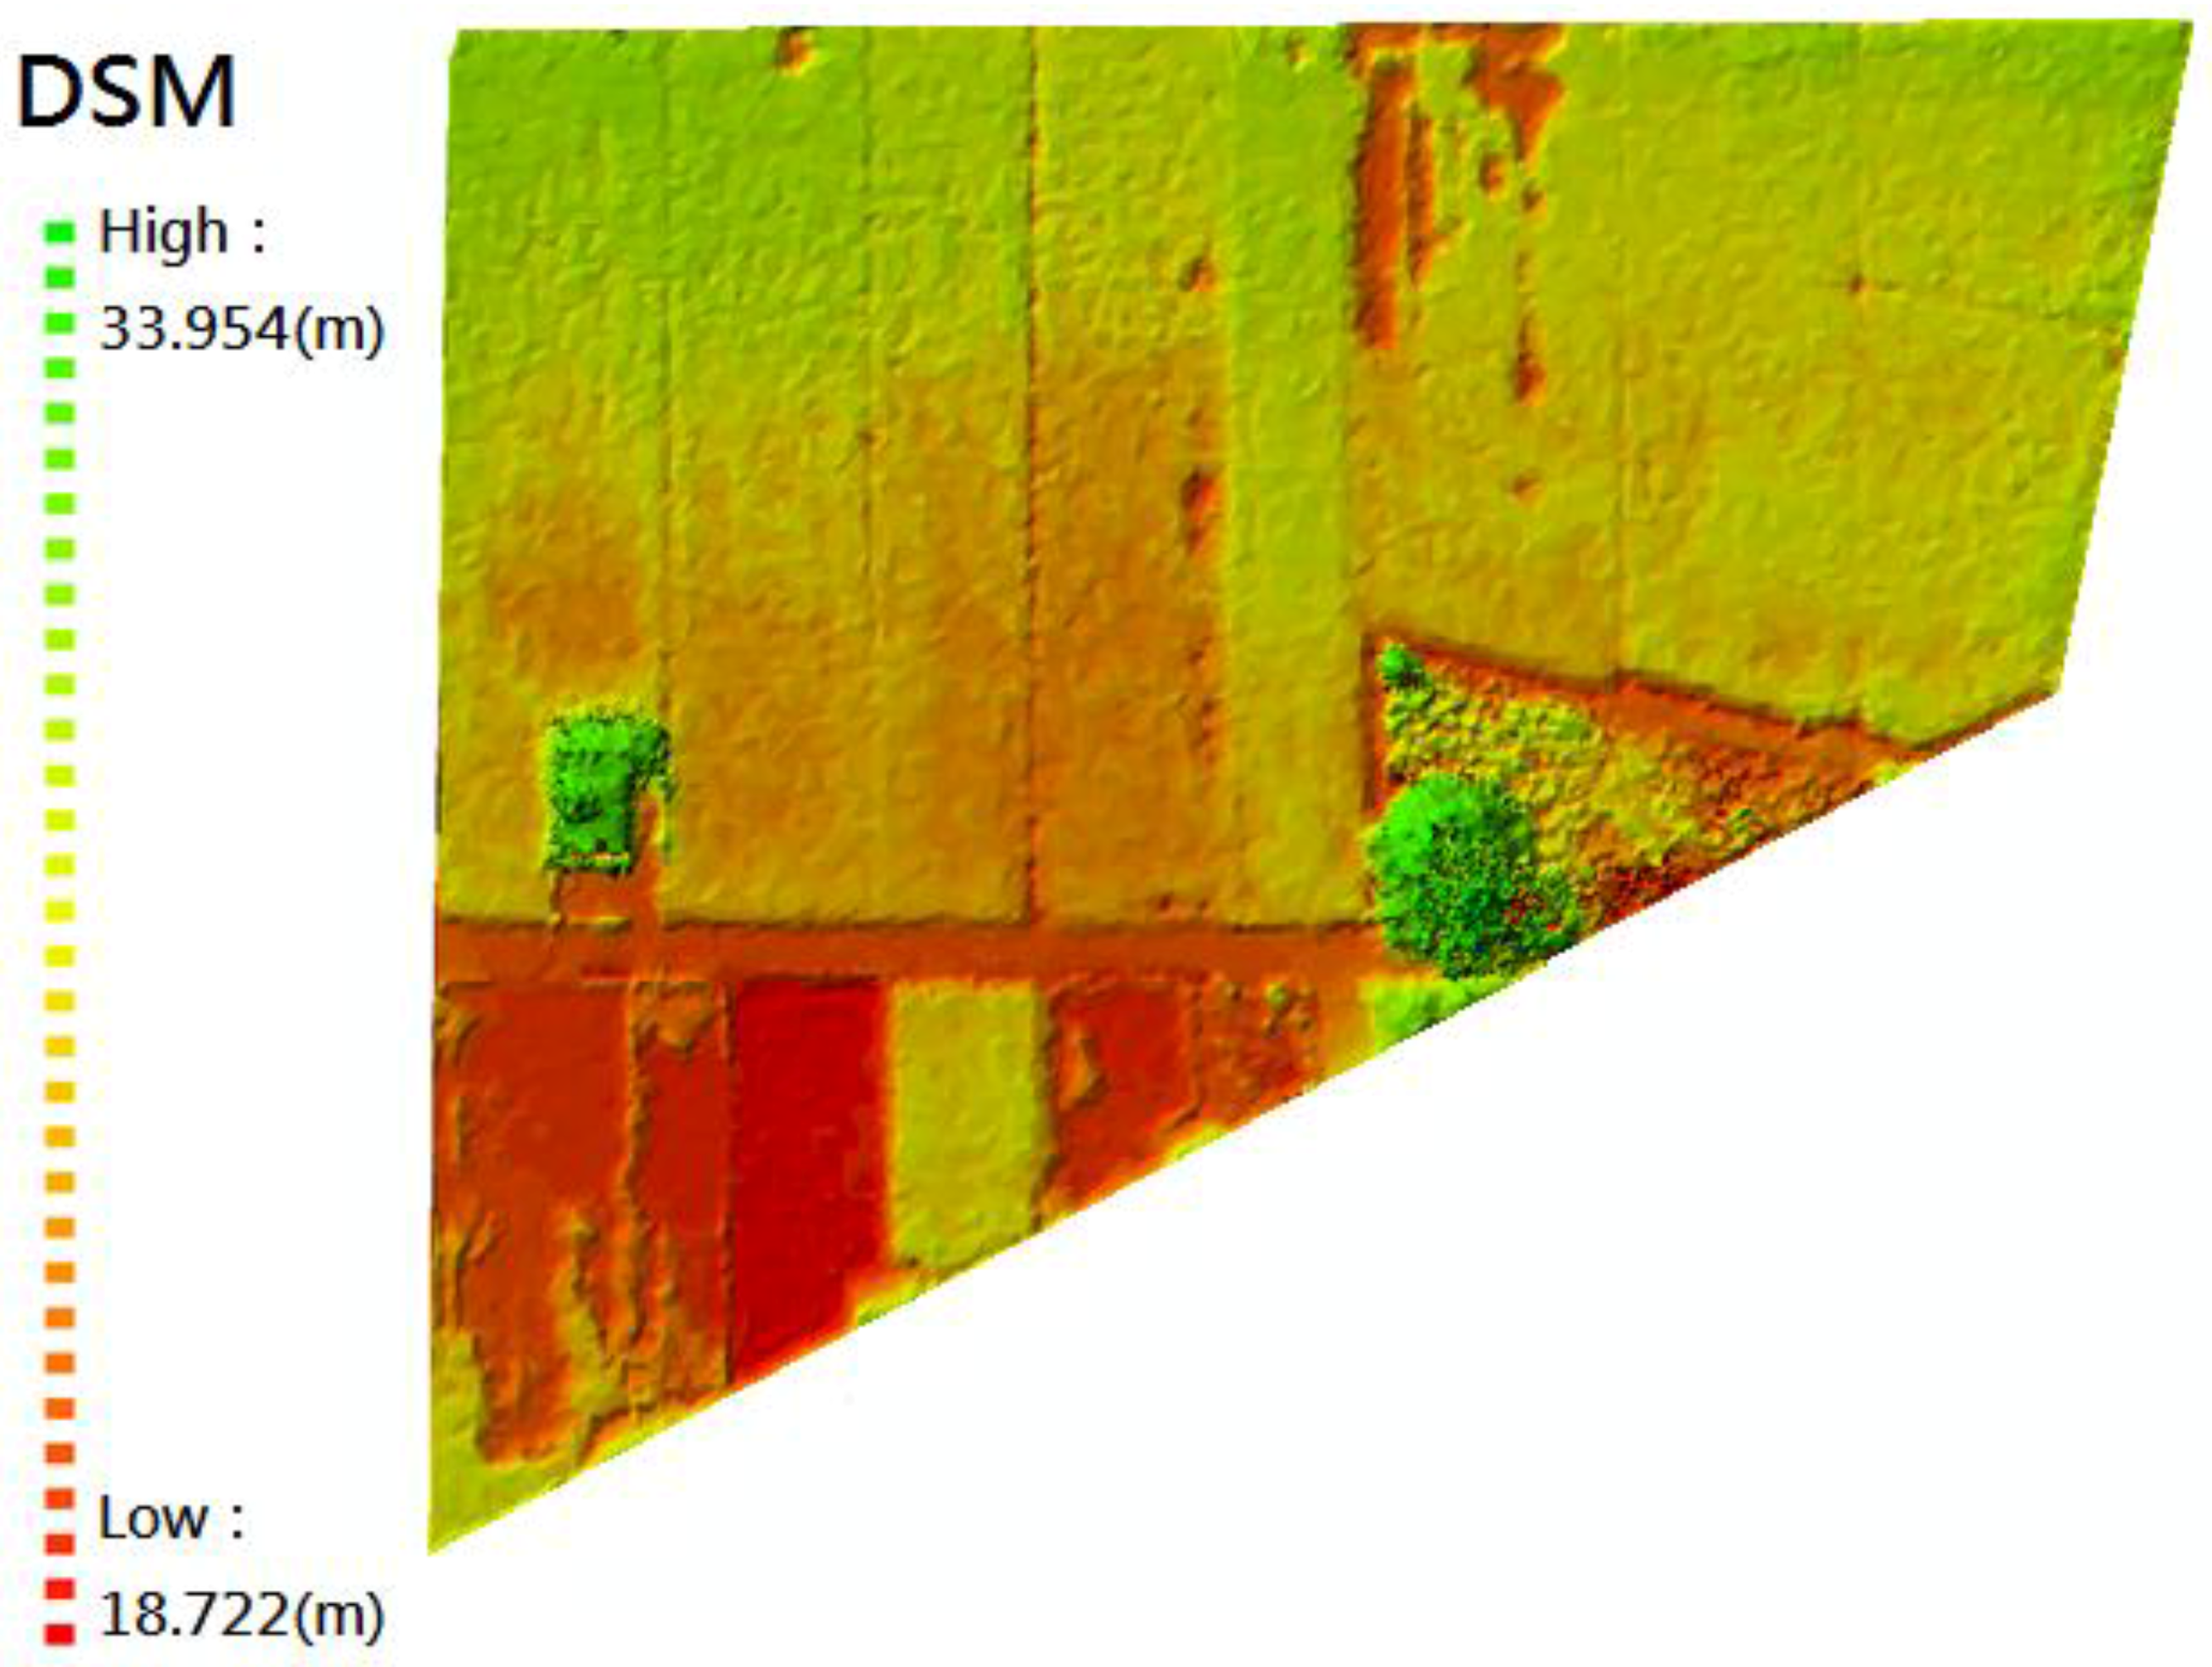
Figure 6 depicts a UAV mosaic image of the study site and the UAV flight lines. A 3D point cloud with a total of 1,048,575 points was constructed through SIFT, SfM, and CMPMVS. Subsequently, a DSM covering a total area of 306 ha in total was produced using the software PhotoScan (Pro v.1.0.1, Agisoft LLC, St. Petersburg, Russia) (Figure 7). The produced DSM had a ground sampling distance of 11 cm and point density of 81 points/m2. The DSM was resampled to a pixel size of 5.5 cm and exported into a total of 14,410,160 pixels to match the pixel size of the UAV RGB images. The elevation of the study site was determined to range from 18.7 to 33.9 m in the DSM. Comparing the GCP coordinates facilitated the estimation of the absolute error of the 3D model based on the average errors recorded in Table 1. The north–south (N–S) error was 24 cm, east–west error was 30 cm, and height error was 34 cm; hence, the N–S direction exhibited a higher accuracy level due to a high overlap of adjacent photographs in the N–S-bound flight lines.
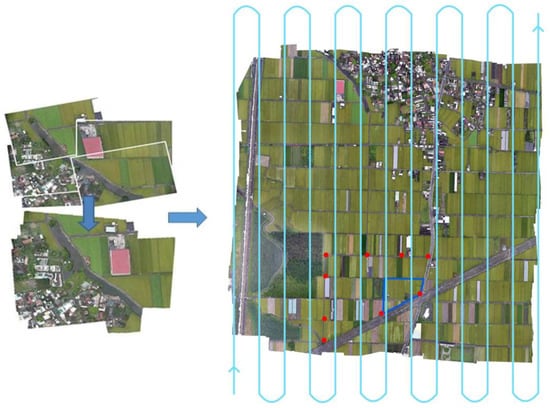
Figure 6.
UAV mosaic image with study site (blue polygon), ground control points (red dot), and flight lines (light blue line).
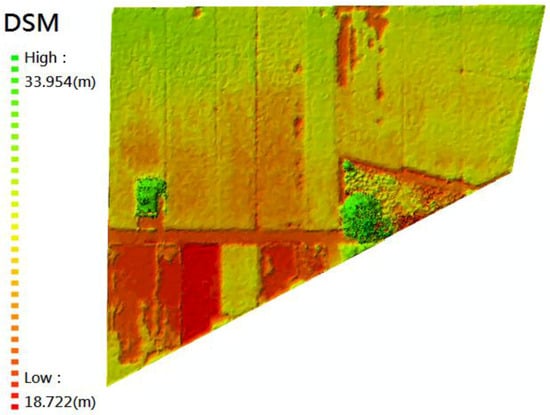
Figure 7.
UAV-derived digital surface model (DSM) for the study site.

Table 1.
Averaged error of control points.
3.2. Texture Analysis
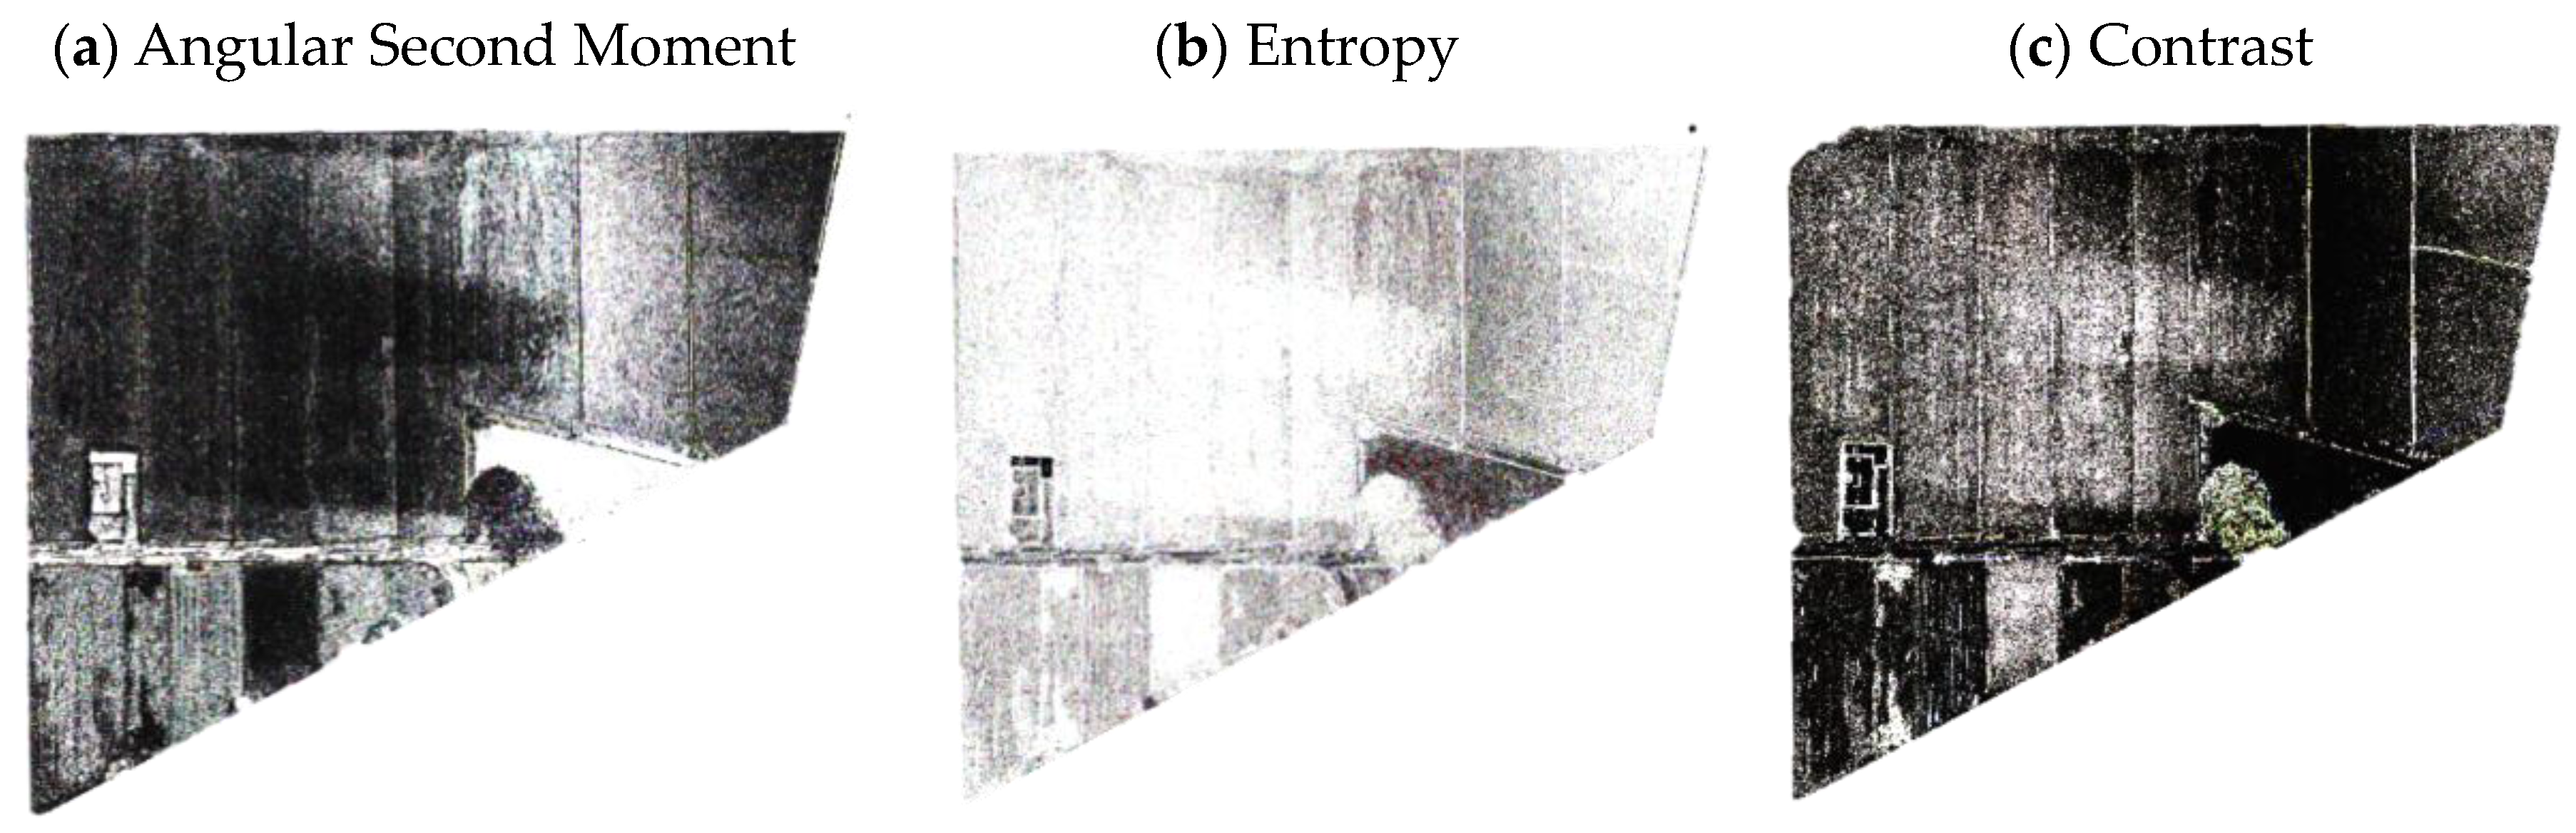
The mosaicked UAV image of the study site was used to analyze eight texture measures, namely mean, variance, ASM, entropy, contrast, correlation, dissimilarity, and homogeneity. Among these measures, ASM, entropy, and contrast exhibited superior performance (Figure 8), which is in agreement with the conclusion of Haralick et al. [55], and were further used to calculate the SFP values for each of the six land cover types. The ASM measure was associated with higher SFP values than the entropy and contrast measures for four out of the six land cover types, thus indicating the applicability of the ASM measure for texture analysis (Table 2). Therefore, this study employed ASM texture analysis (Figure 8c) for discerning the land cover types of the study site.
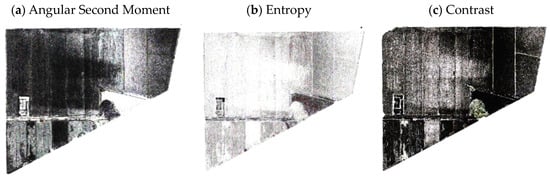
Figure 8.
Texture analysis results. (a) Angular Second Moment; (b)Entropy; and (c) Contrast.
Table 2.
SFP results of ASM, Entropy, and Contrast texture analyses for RGB + Texture and RGB + Texture + DSM image composites.
3.3. Single Feature Probability
Four image composites, namely RGB, RGB + Texture, RGB + DSM, and RGB + Texture + DSM, were used for further analysis. Table 3 presents the SFP results derived for the four image composites for the six land cover types; a high value signifies high classification accuracy.
Table 3.
SFP results for four image composites of land covers.
In general, when the texture and DSM measures were included, the SFP values derived for the six land cover types were greater than that derived using the RGB image alone. The SFP value obtained for rice increased when either the DSM or texture information was added. Moreover, the SFP values derived for lodging and tree were the highest in the RGB + DSM composite, but they were reduced in the RGB + Texture + DSM composite (by 0.11 and 0.30, respectively). This is attributable to the similar textures of both the lodging and tree classes; therefore, adding texture information to the RGB image did not improve the interpretation accuracy.
The SFP value for water body was the highest (0.903) in the RGB + Texture composite but the lowest (0.802) in the RGB + DSM composite. Water reflection could interfere with the DSM generated using IBM, which provides a possible explanation of the negative influence of the DSM on water body identification. In the future, additional near-infrared band information may have the potential to overcome this water body misidentification. When texture and DSM information was included, a noticeable increase was observed in the SFP values for artificial surface and bare land, with the highest SFP values occurring in the RGB + Texture + DSM composite (0.833 and 0.901, respectively). The SFP results evidenced the contribution of texture and DSM information to classification accuracy. Therefore, the SFP results were employed in subsequent analyses as the decision rule for each internal node in the DTC process.
3.4. Image Classification
The classification accuracy was evaluated through an error matrix with four commonly used accuracy measures, namely producer’s accuracy (PA), user’s accuracy (UA), overall accuracy (OA), and Kappa statistic (Kappa). PA is defined as the number of correctly classified pixels in each category divided by the total number of pixels in the corresponding ground truth category. Specifically, PA indicates the probability of a reference pixel being correctly classified, and it is thus a measure of omission error. UA is computed by dividing the number of correctly classified pixels in each category by the total number of pixels classified in that category. Specifically, UA indicates the probability that a pixel classified into a given category actually represents that category on the ground, and it is thus a measure of commission error [64]. OA is determined by dividing the total correct pixels by the total number of pixels in the error matrix, whereas Kappa is a measure of agreement or accuracy between the remote sensing-derived classification map and the ground truth data.
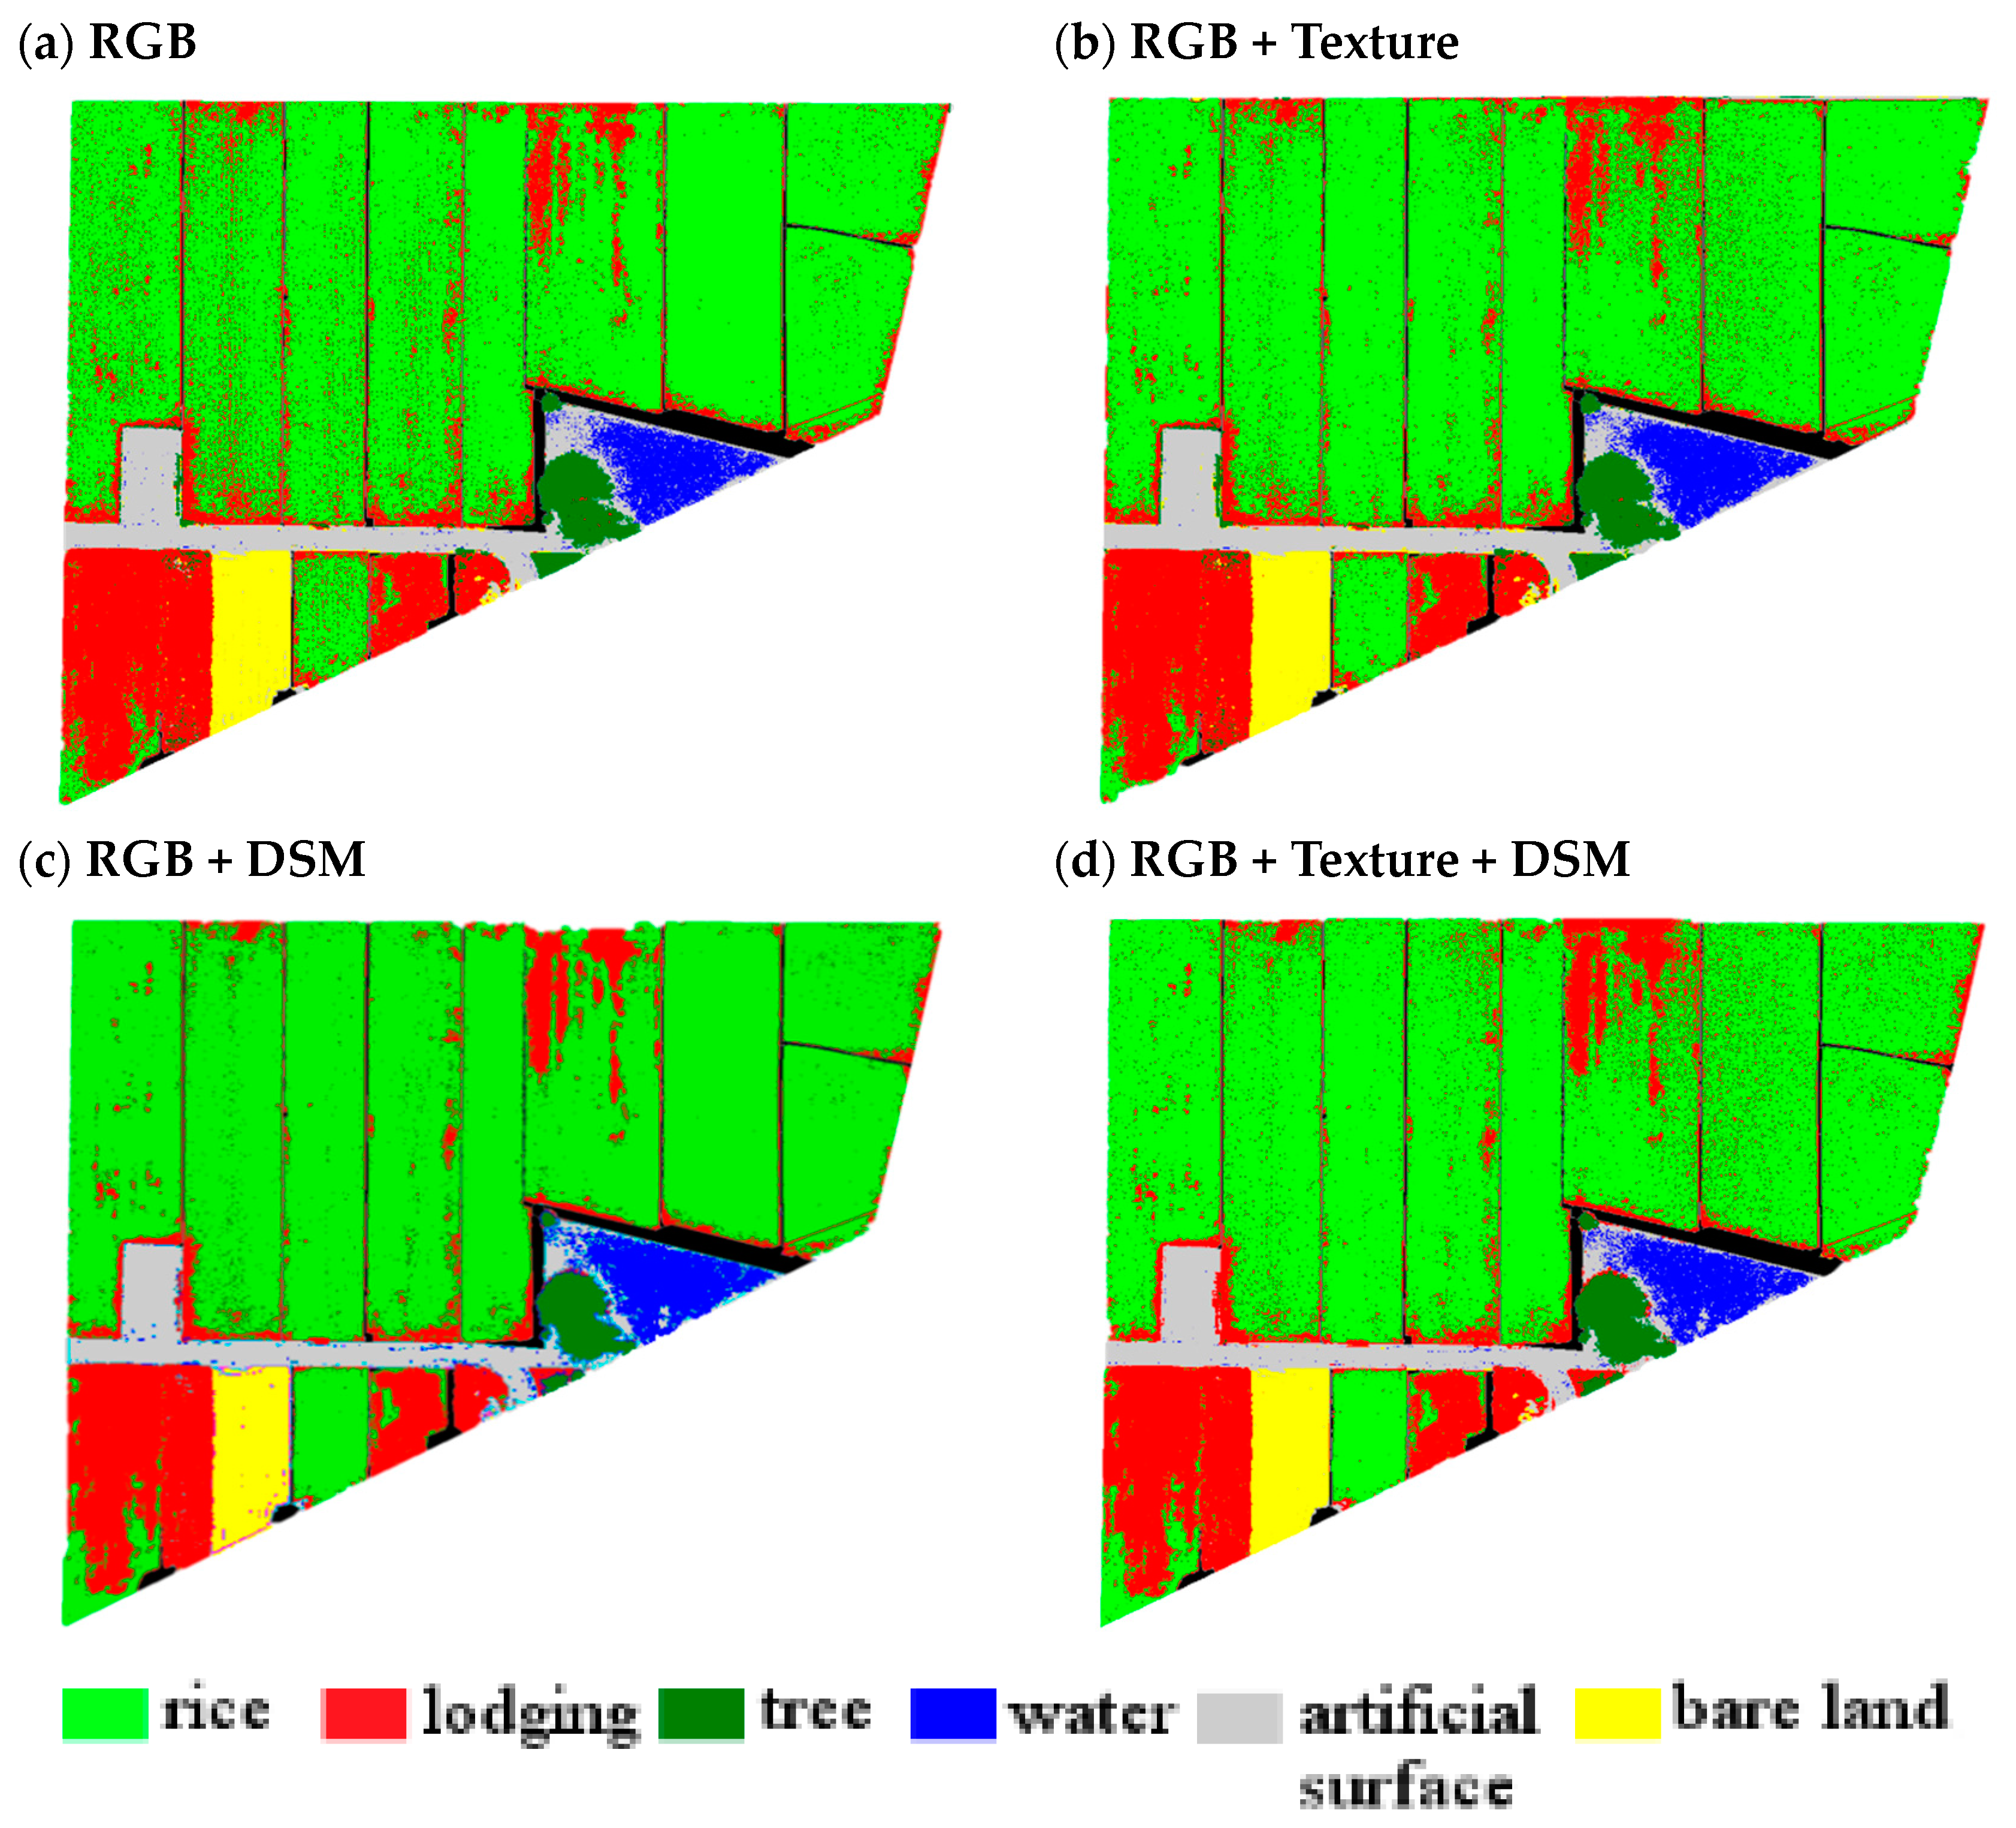
A performance comparison between MLC and DTC revealed that the highest OA was achieved when DTC was used with the SFP result as the decision threshold value (OA, 96.17%; Kappa, 0.941). The MLC result derived for the four image composites is illustrated in Figure 9. The RGB image had a classification accuracy of 86.24% (Table 4). The addition of the DSM and texture information increased the accuracy to 93.84% and 88.14%, respectively. Simultaneously adding the DSM and texture information to the RGB image increased the accuracy to 90.76%, indicating a significant improvement of the classification accuracy.
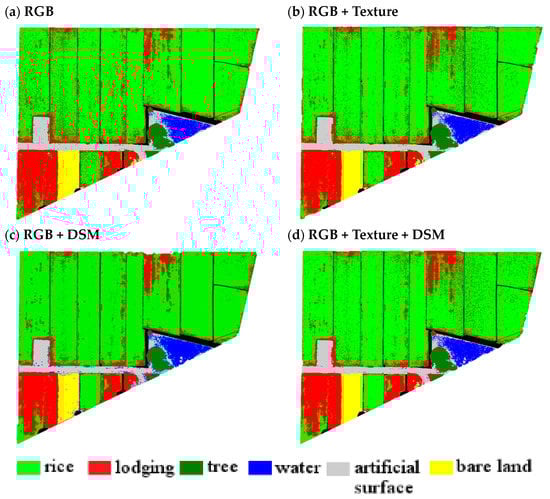
Figure 9.
Maximum likelihood classification results for four image composites: (a) RGB; (b) RGB + Texture; (c) RGB + DSM, and (d)RGB + Texture + DSM.
Table 4.
Accuracy assessment of MLC and DTC.
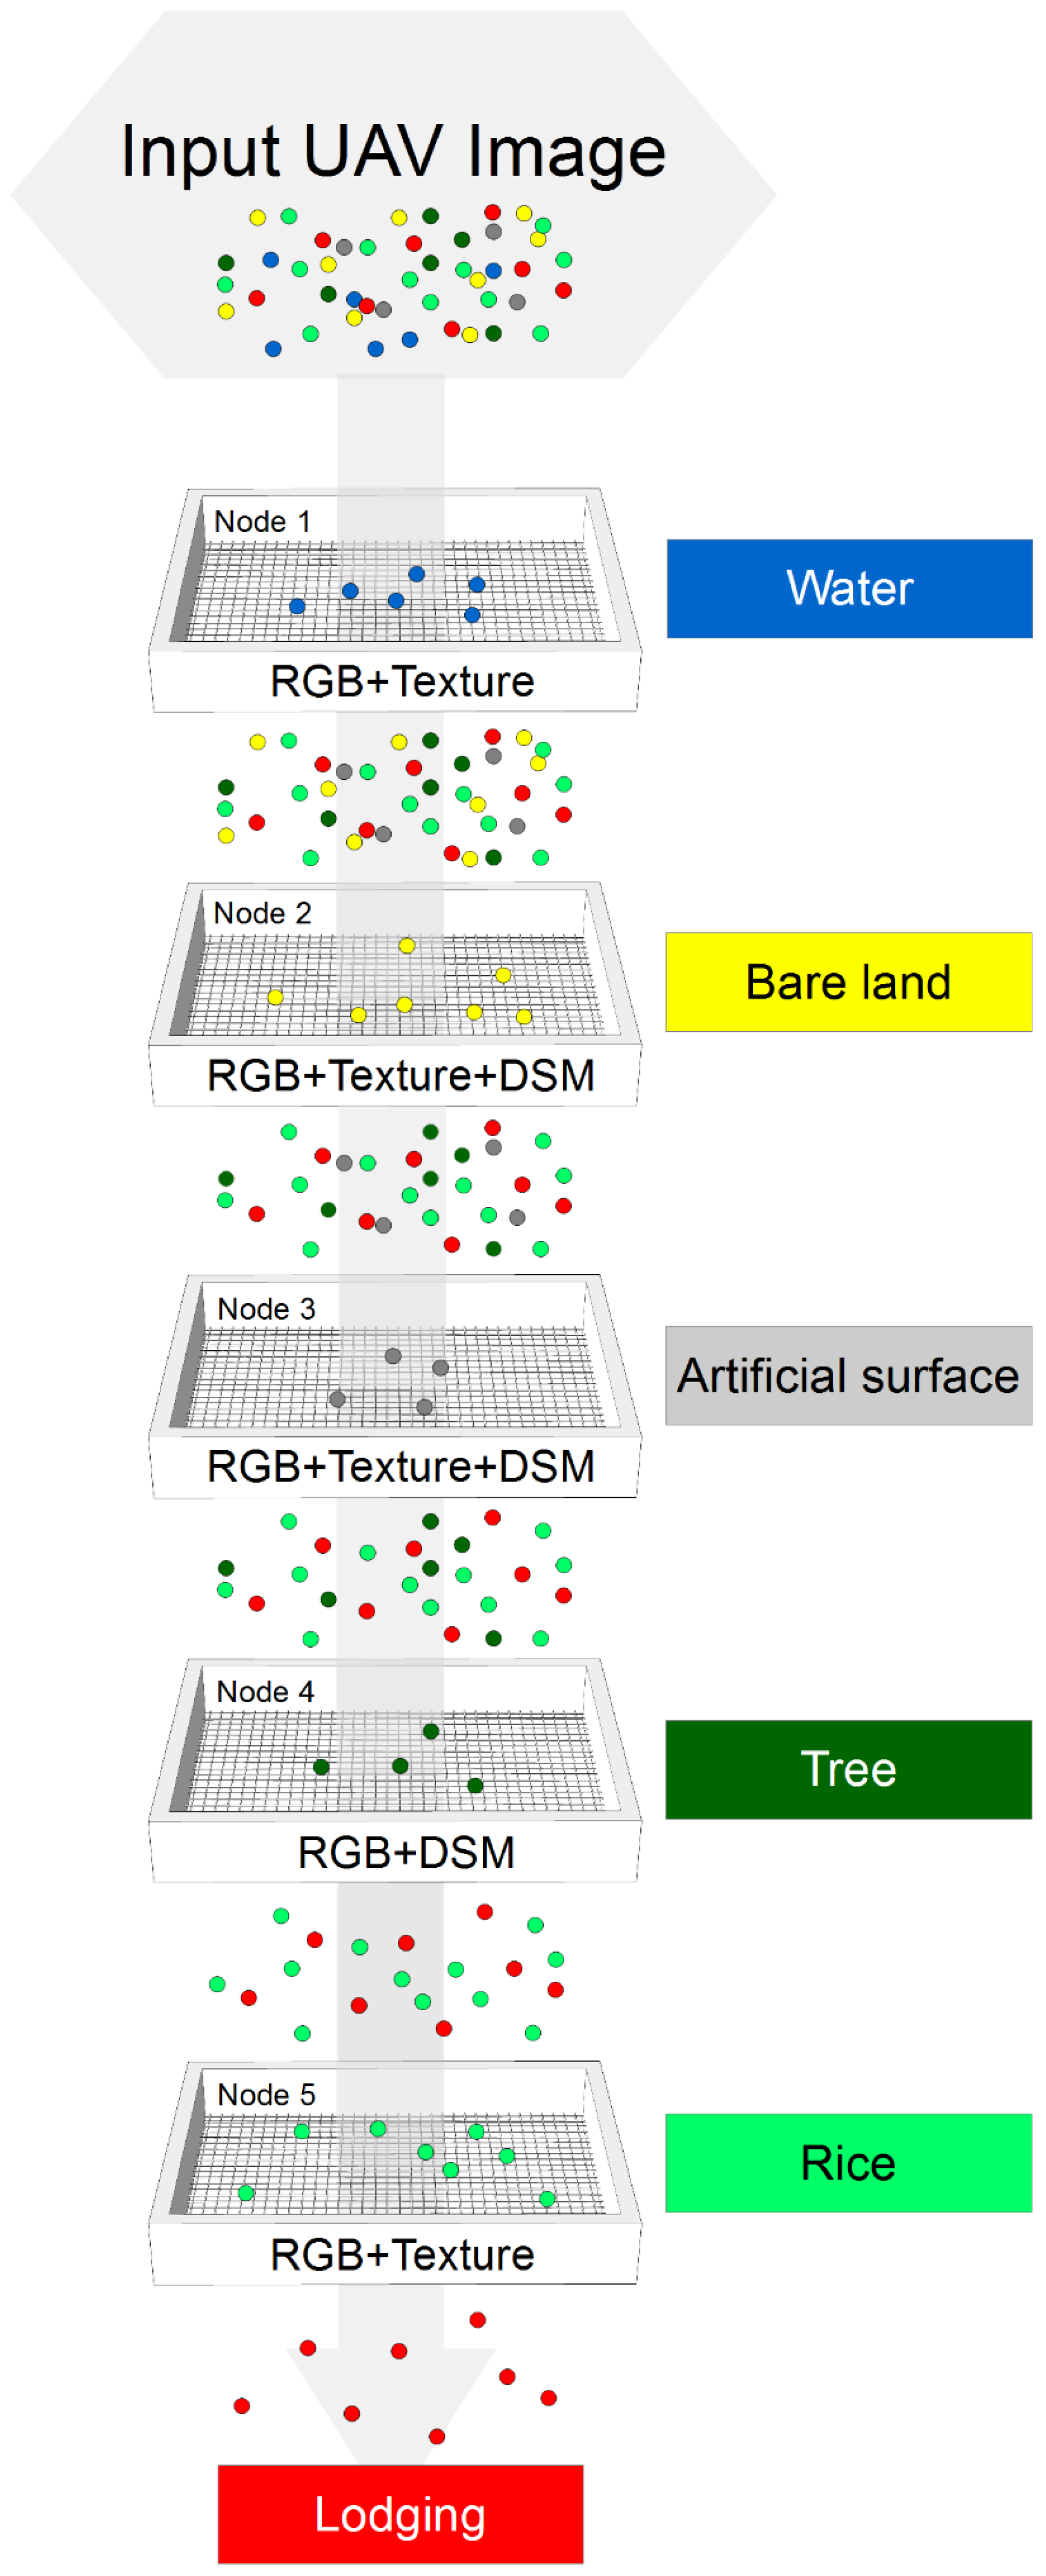
The internal nodes with the associated decision rules in DTC identified the land cover types in the external nodes in the following order objectively: water body, bare land, artificial surface, tree, rice, and lodging (Figure 10). Because identifying lodged rice was the primary target of this study, lodging was the last external node in DTC. In addition, the optimal SFP image composite for each class was determined using SFP analysis and was used as the decision rule for each internal node. The optimal SFP image composite for each class is outlined as follows: RGB + Texture for water body, RGB + Texture + DSM for bare land and artificial surface, RGB + DSM for tree, and RGB + Texture for rice and lodging.
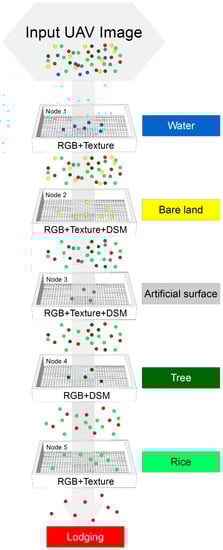
Figure 10.
Decision tree process diagram with classification criteria for each node.
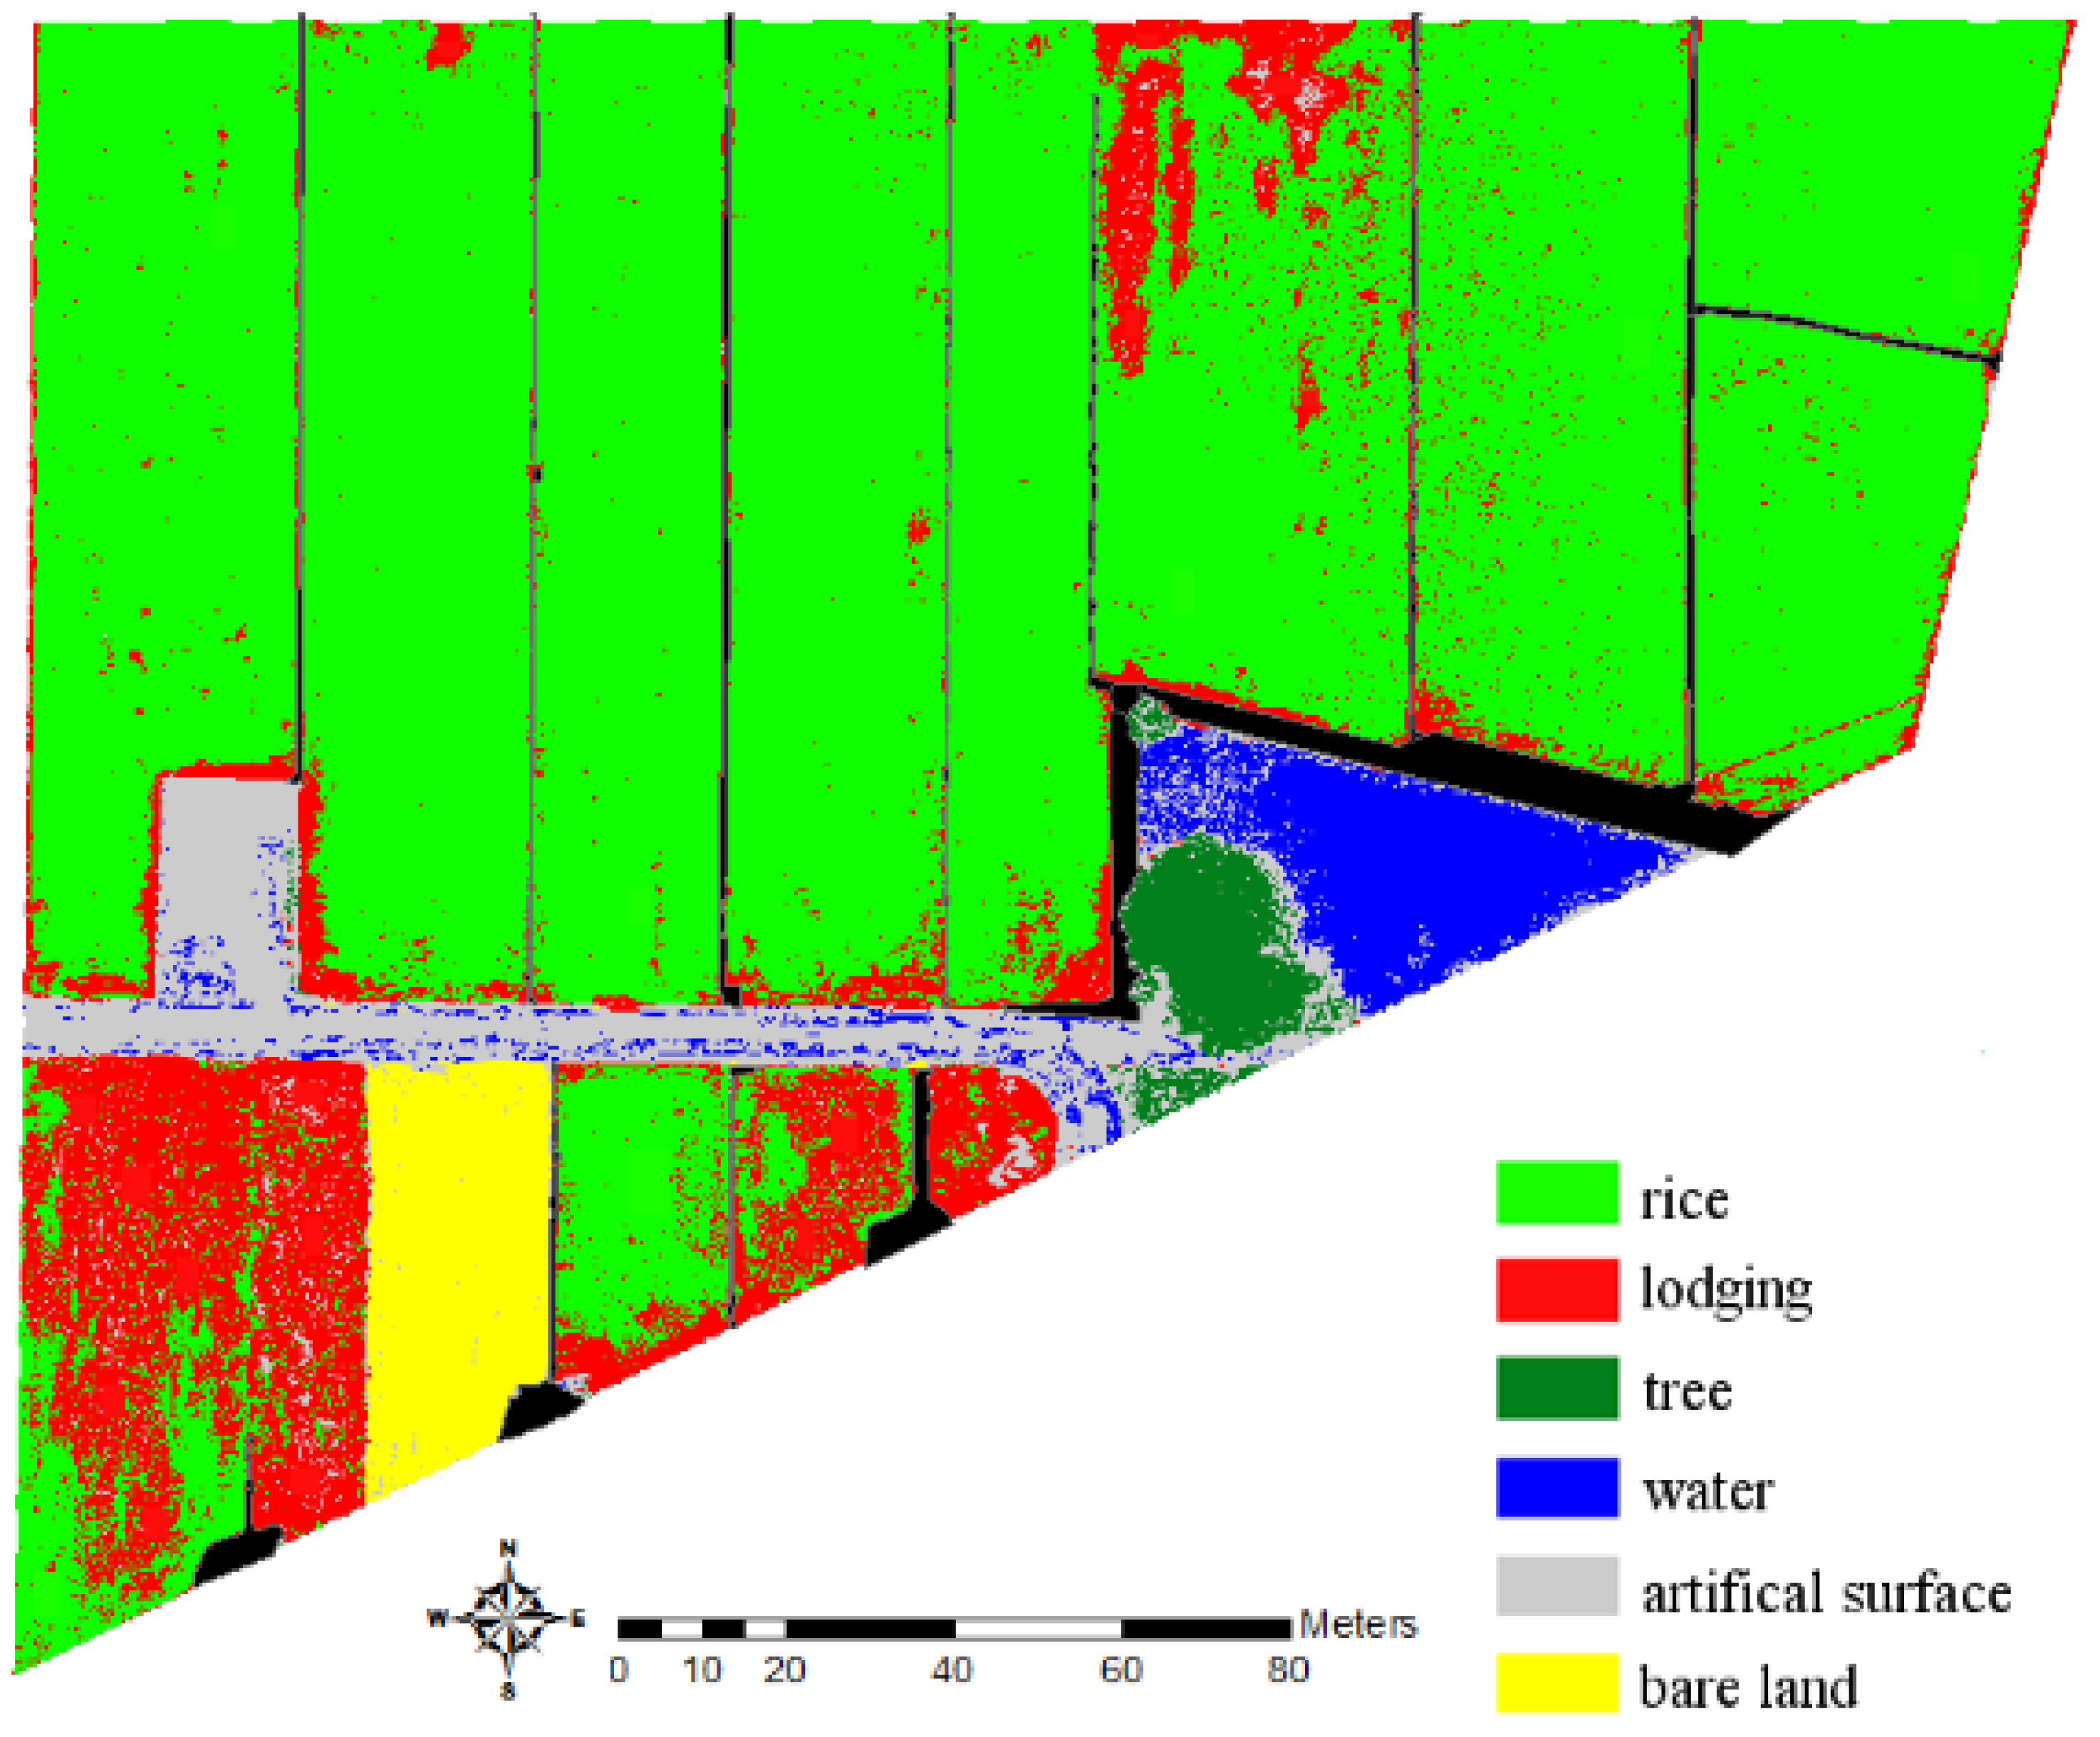
The DTC classification results (Figure 11) revealed a PA of more than 95% for five land cover types, namely rice, lodging, tree, water body, and bare land (Table 5). Artificial surface had the lowest PA of 75.1%, which can be explained by the similar heights of the artificial surface, lodging, and water (Figure 5 and Figure 7). For comparison, an additional approach was implemented by using the average spectral values obtained from the ground truth for each land cover type as the decision rules of internal nodes in DTC (details not shown). However, the OA of this approach was 77.51% (Kappa, 0.637), which is considerably lower than the classification accuracy levels of MLC and DTC that used SFP values as the decision threshold values.
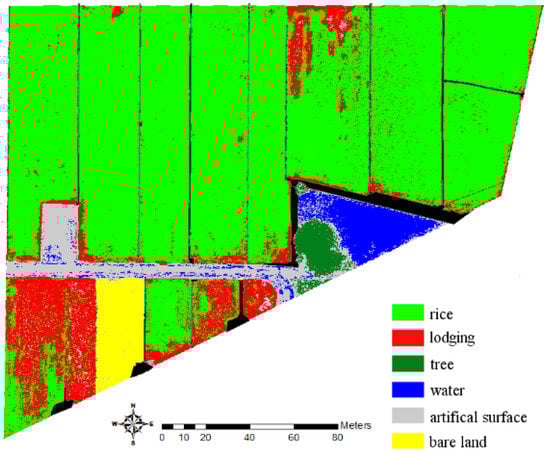
Figure 11.
Decision tree classification result.
Table 5.
Error matrix of DTC using SFP as decision rules.
3.5. Rice Lodging Interpretation
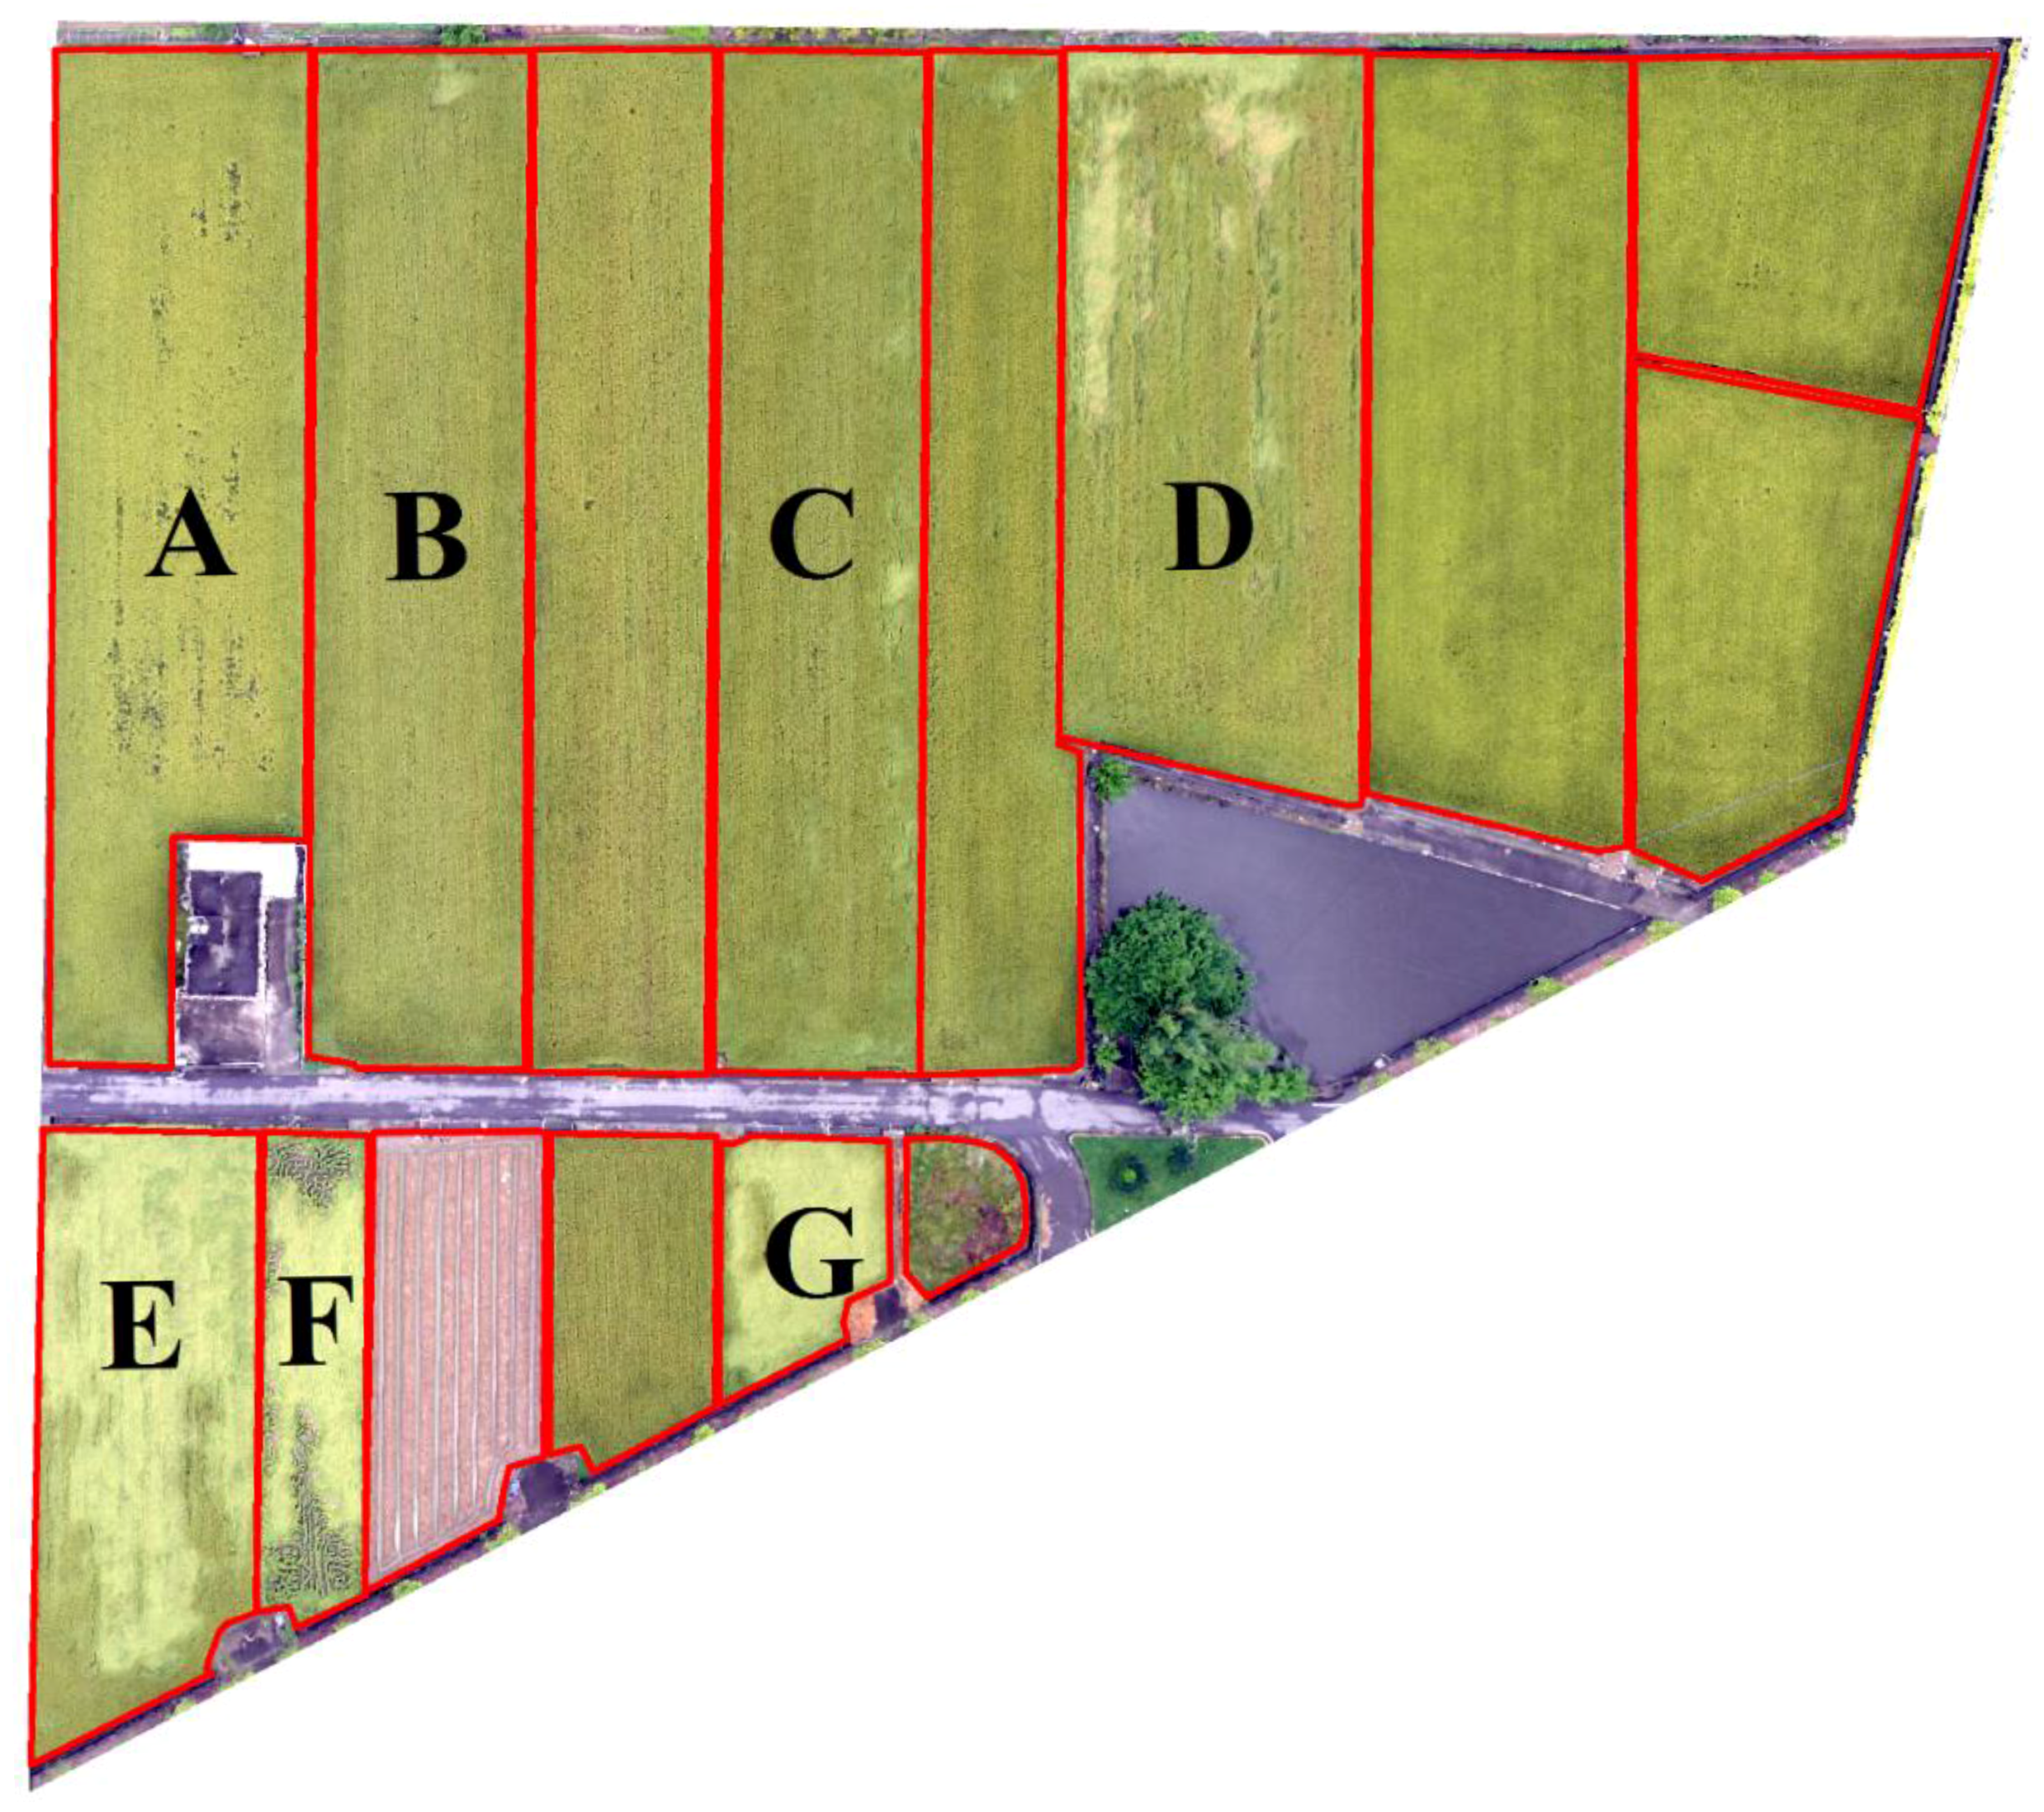
Figure 12 illustrates seven rice paddies that were reported for agricultural disaster relief compensation in the study site. The lodging ratio of each paddy was analyzed using DTC (Table 6). Paddies E, F, and G had a > 20% lodging rate (67.09%, 75.23%, and 50.50%, respectively) and were thus eligible for agricultural disaster relief compensation. Accordingly, the quantitative results obtained from the proposed classification technique can effectively interpret the percentage of lodging and provide essential compensation reference information for the government.

Figure 12.
Boundary map of study site with reported rice paddies.
Table 6.
Lodging proportion of the reported rice paddies.
4. Discussion
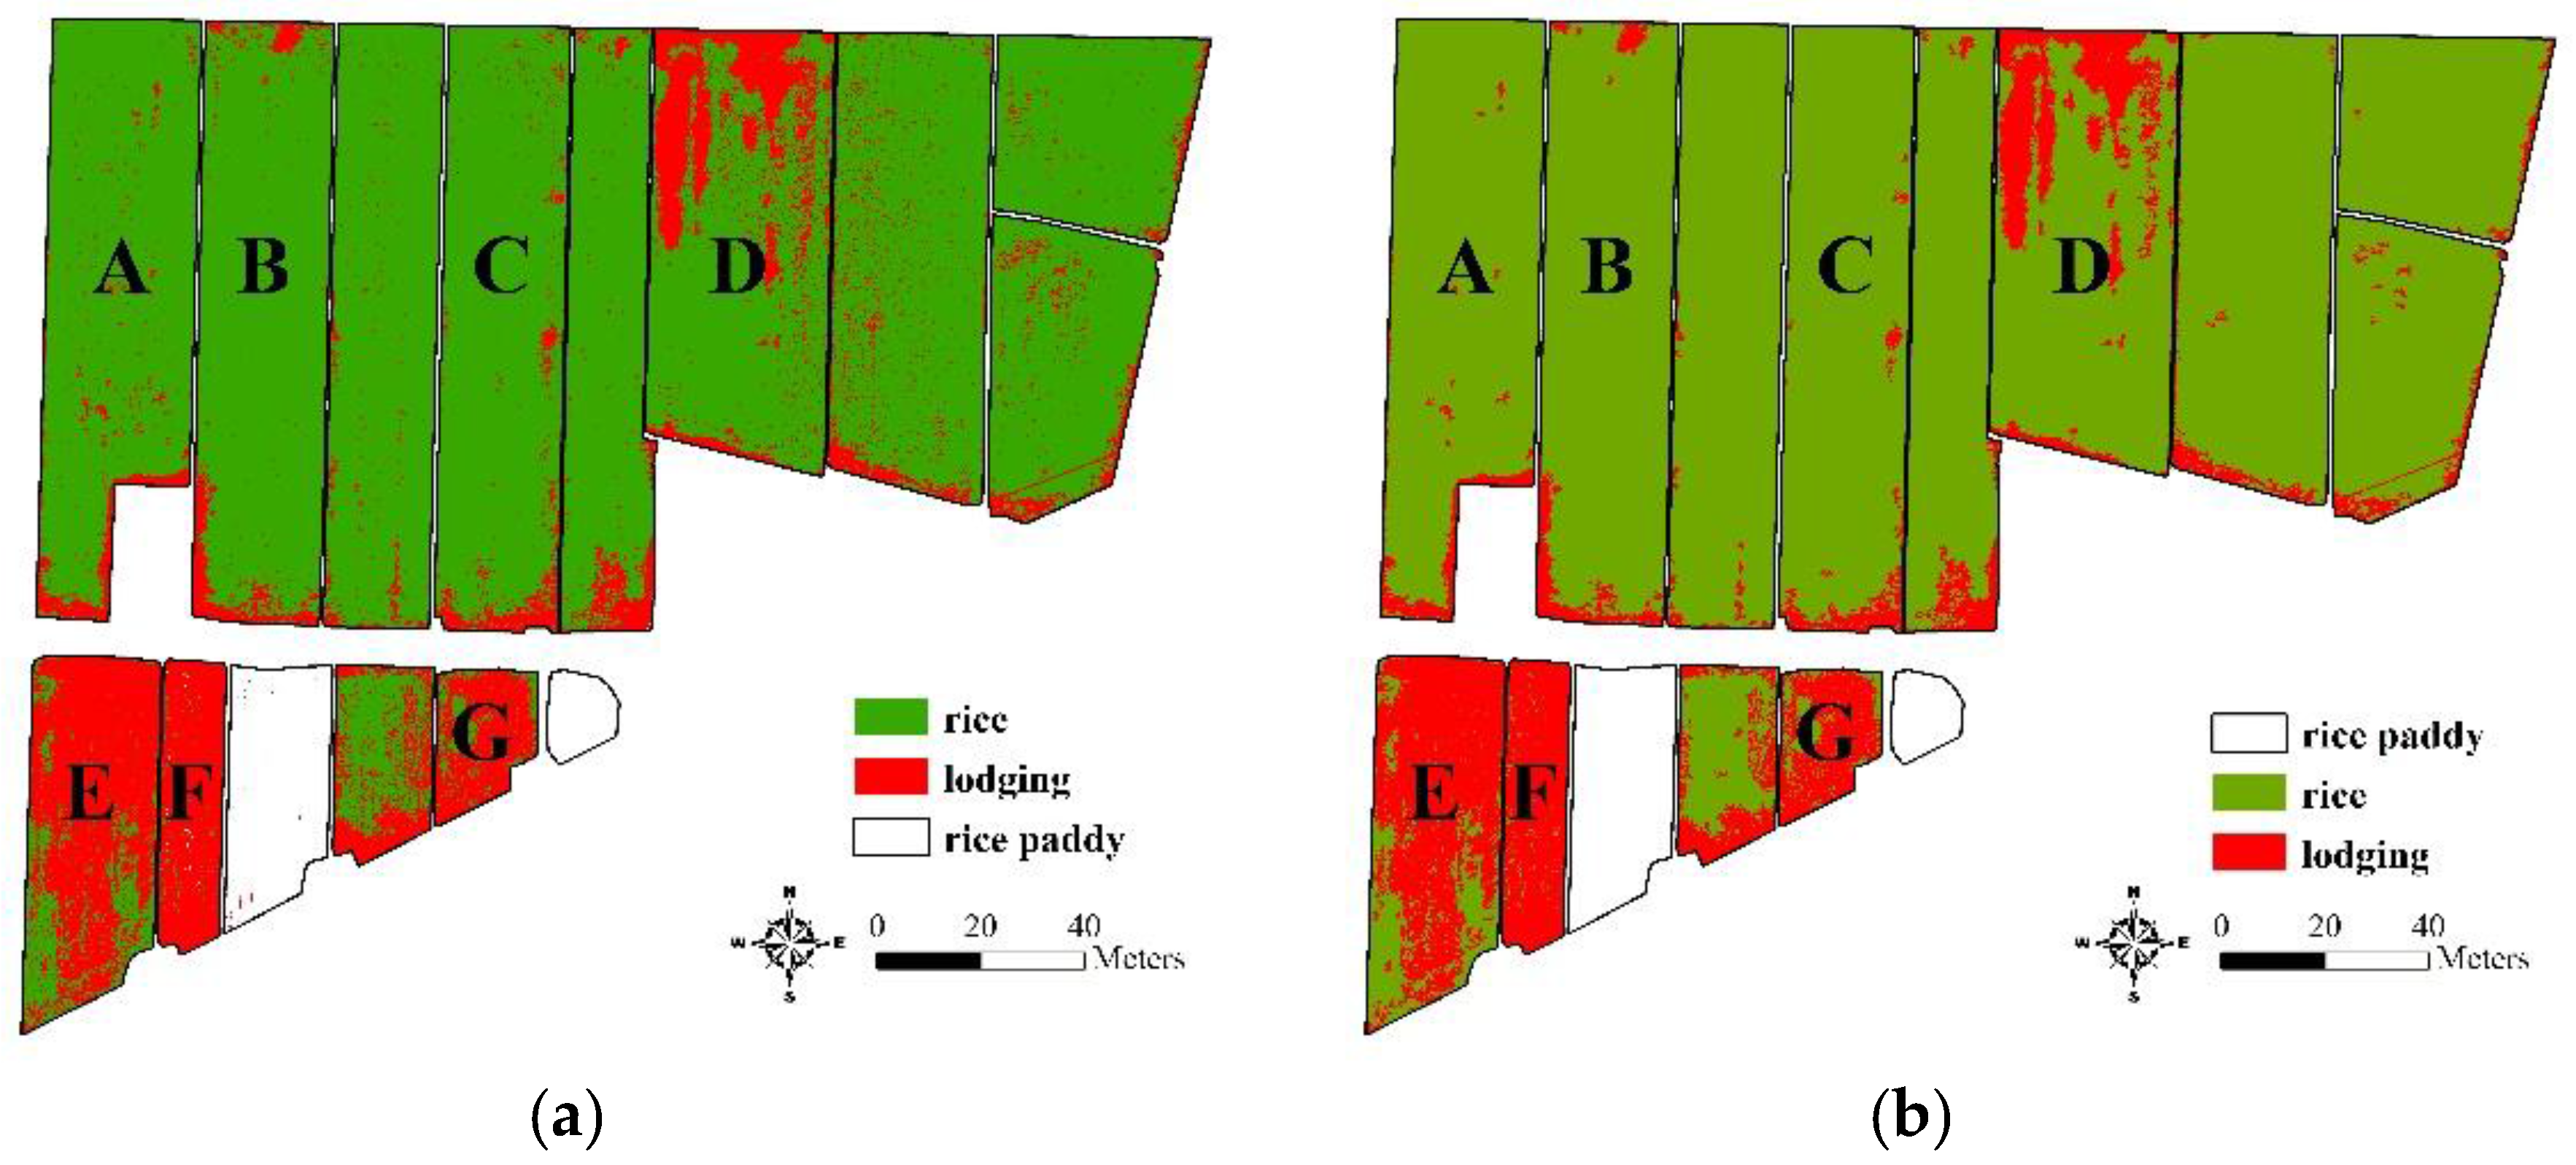
In practice, the identification of healthy and lodged rice within paddy fields is the most critical task for disaster relief compensation schemes, which are based on the precise evaluation of the proportion of lodged rice. Because strict decision criteria were adopted in DTC and lodged rice was the last external node and target object in the decision tree, lodged rice had a comparatively high commission error in this study. To minimize the commission error in rice/lodging identification, two additional image processing steps, extracting and thresholding, were employed to enhance the proposed approach under realistic conditions.
First, paddy fields were extracted from the whole image by using a cadastral boundary map. The boundaries of the paddy fields were distinguished, and the area outside the paddy fields was excluded by a mask layer and exempted from further classification and analysis. Second, considering that the healthy TK2 rice crop typically has a height of 1.1 m and considering the domino effect of lodging [4], the lodging area should be larger than 1 m2. Therefore, a threshold of 1 m2 was adopted to exclude scattering noise, a common effect of pixel-based classification on fine spatial resolution imagery, from the lodging area. Under these two practical constraints, the rice paddy fields were extracted, and the scattering noise of lodged rice was reduced (Figure 13).
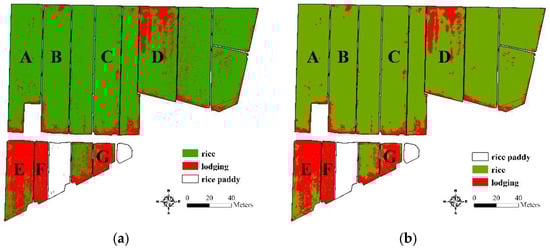
Figure 13.
Distribution of lodged rice: (a) DTC results with cadastral boundary constraint and (b) DTC results further with a threshold of 1 m2 minimum area.
In the future, establishing photo-identifiable GCPs and checkpoints (CPs) at locations with invariant properties is essential to providing calibration information for geometrically rectifying UAV images. Invariant locations such as an edge of a concrete facility, a manhole cover along public roads, or central separation islands of public roads can be adequate candidates for GCPs and CPs. With a priori establishment of GCPs and CPs at invariant locations, the geometric correction of UAV images can be improved so to further enhance image applications. Moreover, establishing an agricultural UAV monitoring system to provide regular inventories and environmental surveying on crops can be beneficial to farmers and government agencies for agricultural disaster relief compensation.
5. Conclusions
This study developed a comprehensive and efficient agricultural land classification technique incorporating UAV-image-derived DSM and texture information; the proposed technique can be used to improve the current manual rice lodging assessment techniques. The main outcomes are detailed as follows:
- The results reveal that UAVs are viable platforms for agricultural land classification because of their ability to be deployed quickly and to rapidly generate comprehensive high-resolution images. The resulting high-resolution UAV images can serve as scientific evidence of the impacts of agricultural disasters. With appropriate image classification techniques, UAV images have great potential to improve the current manual rice lodging assessment techniques.
- Based on the SFP results, the contribution of DSM and texture information to the classification accuracy can be estimated for each land cover type. Texture information could significantly improve the classification accuracy of rice and water. The DSM was more suitable for lodging and tree classification. The simultaneous addition of DSM and texture information exerted positive effects on the classification accuracy of artificial surface and bare land.
- For accuracy assessment, DTC using SFP values as the decision threshold values outperformed MLC, with a classification OA of 96.17% and Kappa value of 0.94.
- The inclusion of DSM information alone, texture information alone, and both DSM and texture information had varied positive effects on the classification accuracy of MLC (from 86.24% to 93.84%, 88.14%, and 90.76%, respectively).
- This study incorporated seven rice paddies in the study site that were reported for agricultural disaster relief compensation. Through the proposed classification technique, paddies E, F, and G had a >20% lodging rate (67.09%, 75.23%, and 50.50%, respectively); therefore, these paddies were eligible for disaster relief compensation. The proposed classification technique can effectively interpret lodging and provide the government with quantitative and objective data to be used as a reference for compensation. In addition, these data may serve as a valuable reference for various applications such as agricultural mapping/monitoring, agricultural insurance, yield estimation, and biomass estimation.
- To fulfill realistic conditions and accelerate the disaster relief compensation process, two additional image processing steps, extracting paddy field boundaries and thresholding a minimum lodging area of 1 m2, were executed to identify lodged rice within cadastral units. These steps minimized the commission error associated with rice/lodging identification and reduced scattering noise in paddy fields.
- In addition to rice lodging interpretation, future research can further examine the disaster-related loss of rice according to its growth stages (e.g., yellow leaves caused by cold damage and loss or mildew of rice straws caused by heavy rain or the Asian monsoon rainy season). Moreover, disaster assessment of other crops can be incorporated into future research.
Acknowledgments
The authors would like to thank the Ministry of Science and Technology Taiwan for the partial financial support of this research under projects: MOST 105-2625-M-005-006 and 103RB06. PI: Ming-Der Yang.
Author Contributions
Ming-Der Yang conceived the research, oversaw the research process, and supervised the finished manuscript; Kai-Shiang Huang and Yi-Hsuan Kuo performed the data analysis; Liang-Mao Lin initiated the research and provided agricultural expertise suggestions; Hui Ping Tsai was responsible for the results interpretation and large portions of the text.
Conflicts of Interest
The authors declare no conflict of interest. The founding sponsors had no role in the design of the study; in the collection, analyses, or interpretation of data; in the writing of the manuscript, and in the decision to publish the results.
References
- Juliano, B.O. Rice in Human Nutrition; FAO Food Nutrition Series No.26; Food and Agriculture Organization of the United Nations: Rome, Italy, 1993; pp. 20–38. [Google Scholar]
- Vignola, R.; Harvey, C.A.; Bautista-Solis, P.; Avelino, J.; Rapidel, B.; Donatti, C.; Martinez, R. Ecosystem-based adaptation for smallholder farmers: Definitions, opportunities and constraints. Agric. Ecosyst. Environ. 2015, 211, 126–132. [Google Scholar] [CrossRef]
- Shimono, H.; Okada, M.; Yamakawa, Y.; Nakamura, H.; Kobayashi, K.; Hasegawa, T. Lodging in rice can be alleviated by atmospheric CO2 enrichment. Agric. Ecosyst. Environ. 2007, 118, 223–230. [Google Scholar] [CrossRef]
- Ishimaru, K.; Togawa, E.; Ookawa, T.; Kashiwagi, T.; Madoka, Y.; Hirotsu, N. New target for rice lodging resistance and its effect in a typhoon. Planta 2008, 227, 601–609. [Google Scholar] [CrossRef] [PubMed]
- Setter, T.; Laureles, E.; Mazaredo, A. Lodging reduces yield of rice by self-shading and reductions in canopy photosynthesis. Field Crops Res. 1997, 49, 95–106. [Google Scholar] [CrossRef]
- Chang, H.; Zilberman, D. On the political economy of allocation of agricultural disaster relief payments: Application to Taiwan. Eur. Rev. Agric. Econ. 2014, 41, 657–680. [Google Scholar] [CrossRef]
- Jia, Y.; Su, Z.; Shen, W.; Yuan, J.; Xu, Z. UAV remote sensing image mosaic and its application in agriculture. Int. J. Smart Home 2016, 10, 159–170. [Google Scholar] [CrossRef]
- Yang, M.; Yang, Y.; Hsu, S. Application of remotely sensed data to the assessment of terrain factors affecting the Tsao-Ling landslide. Can. J. Remote Sens. 2004, 30, 593–603. [Google Scholar] [CrossRef]
- Yang, M.; Lin, J.; Yao, C.; Chen, J.; Su, T.; Jan, C. Landslide-induced levee failure by high concentrated sediment flow—A case of Shan-An levee at Chenyulan River, Taiwan. Eng. Geol. 2011, 123, 91–99. [Google Scholar] [CrossRef]
- Yang, M.; Su, T.; Hsu, C.; Chang, K.; Wu, A. Mapping of the 26 December 2004 tsunami disaster by using FORMOSAT-2 images. Int. J. Remote Sens. 2007, 28, 3071–3091. [Google Scholar] [CrossRef]
- Lin, J.; Yang, M.; Lin, B.; Lin, P. Risk assessment of debris flows in Songhe Stream, Taiwan. Eng. Geol. 2011, 123, 100–112. [Google Scholar] [CrossRef]
- Atzberger, C. Advances in remote sensing of agriculture: Context description, existing operational monitoring systems and major information needs. Remote Sens. 2013, 5, 949–981. [Google Scholar] [CrossRef]
- Sanders, K.T.; Masri, S.F. The energy-water agriculture nexus: The past, present and future of holistic resource management via remote sensing technologies. J. Clean. Prod. 2016, 117, 73–88. [Google Scholar] [CrossRef]
- Li, Z.; Chen, Z.; Wang, L.; Liu, J.; Zhou, Q. Area extraction of maize lodging based on remote sensing by small unmanned aerial vehicle. Trans. Chin. Soc. Agric. Eng. 2014, 30, 207–213. [Google Scholar]
- Zhang, H.; Lin, H.; Li, Y.; Zhang, Y.; Fang, C. Mapping urban impervious surface with dual-polarimetric SAR data: An improved method. Landsc. Urban Plann. 2016, 151, 55–63. [Google Scholar] [CrossRef]
- Zhang, C.; Kovacs, J.M. The application of small unmanned aerial systems for precision agriculture: A review. Precis. Agric. 2012, 13, 693–712. [Google Scholar] [CrossRef]
- Laliberte, A.S.; Rango, A. Texture and scale in object-based analysis of subdecimeter resolution unmanned aerial vehicle (UAV) imagery. IEEE Trans. Geosci. Remote Sens. 2009, 47, 761–770. [Google Scholar] [CrossRef]
- Honkavaara, E.; Saari, H.; Kaivosoja, J.; Pölönen, I.; Hakala, T.; Litkey, P.; Mäkynen, J.; Pesonen, L. Processing and Assessment of Spectrometric, Stereoscopic Imagery Collected using a Lightweight UAV Spectral Camera for Precision Agriculture. Remote Sens. 2013, 5, 5006–5039. [Google Scholar] [CrossRef]
- Kedzierski, M.; Wierzbicki, D. Methodology of Improvement of Radiometric Quality of Images Acquired from Low Altitudes. Measurement 2016, 92, 70–78. [Google Scholar] [CrossRef]
- Kedzierski, M.; Wilinska, M.; Wierzbicki, D.; Fryskowska, A.; Delis, P. Image Data Fusion for Flood Plain Mapping. In Proceedings of the International Conference on Environmental Engineering, Vilnius, Lithuania, 22–23 May 2014; p. 1. [Google Scholar]
- Dandois, J.P.; Ellis, E.C. High spatial resolution three-dimensional mapping of vegetation spectral dynamics using computer vision. Remote Sens. Environ. 2013, 136, 259–276. [Google Scholar] [CrossRef]
- Turner, D.; Lucieer, A.; Watson, C. An automated technique for generating georectified mosaics from ultra-high resolution unmanned aerial vehicle (UAV) imagery, based on structure from motion (SfM) point clouds. Remote Sens. 2012, 4, 1392–1410. [Google Scholar] [CrossRef]
- Li, K.; Yang, J.; Jiang, J. Nonrigid structure from motion via sparse representation. IEEE Trans. Cybern. 2015, 45, 1401–1413. [Google Scholar] [PubMed]
- Yahyanejad, S.; Rinner, B. A fast and mobile system for registration of low-altitude visual and thermal aerial images using multiple small-scale UAVs. ISPRS J. Photogramm. Remote Sens. 2015, 104, 189–202. [Google Scholar] [CrossRef]
- Lelong, C.C.; Burger, P.; Jubelin, G.; Roux, B.; Labbé, S.; Baret, F. Assessment of unmanned aerial vehicles imagery for quantitative monitoring of wheat crop in small plots. Sensors 2008, 8, 3557–3585. [Google Scholar] [CrossRef] [PubMed]
- Baluja, J.; Diago, M.P.; Balda, P.; Zorer, R.; Meggio, F.; Morales, F.; Tardaguila, J. Assessment of vineyard water status variability by thermal and multispectral imagery using an unmanned aerial vehicle (UAV). Irrig. Sci. 2012, 30, 511–522. [Google Scholar] [CrossRef]
- Uto, K.; Seki, H.; Saito, G.; Kosugi, Y. Characterization of rice paddies by a UAV-mounted miniature hyperspectral sensor system. IEEE J. Sel. Topics Appl. Earth Observ. 2013, 6, 851–860. [Google Scholar] [CrossRef]
- Yang, H.; Chen, E.; Li, Z.; Zhao, C.; Yang, G.; Pignatti, S.; Casa, R.; Zhao, L. Wheat lodging monitoring using polarimetric index from RADARSAT-2 data. Int. J. Appl. Earth Obs. Geoinf. 2015, 34, 157–166. [Google Scholar] [CrossRef]
- Bendig, J.; Bolten, A.; Bennertz, S.; Broscheit, J.; Eichfuss, S.; Bareth, G. Estimating biomass of barley using crop surface models (CSMs) derived from UAV-based RGB imaging. Remote Sens. 2014, 6, 10395–10412. [Google Scholar] [CrossRef]
- Dandois, J.P.; Ellis, E.C. Remote sensing of vegetation structure using computer vision. Remote Sens. 2010, 2, 1157–1176. [Google Scholar] [CrossRef]
- Rokhmana, C.A. The potential of UAV-based remote sensing for supporting precision agriculture in Indonesia. Procedia Environ. Sci. 2015, 24, 245–253. [Google Scholar] [CrossRef]
- Polo, J.; Hornero, G.; Duijneveld, C.; García, A.; Casas, O. Design of a low-cost Wireless Sensor Network with UAV mobile node for agricultural applications. Comput. Electron. Agric. 2015, 119, 19–32. [Google Scholar] [CrossRef]
- Bhardwaj, A.; Sam, L.; Martín-Torres, F.J.; Kumar, R. UAVs as remote sensing platform in glaciology: Present applications and future prospects. Remote Sens. Environ. 2016, 175, 196–204. [Google Scholar] [CrossRef]
- Pérez-Ortiz, M.; Peña, J.M.; Gutiérrez, P.A.; Torres-Sánchez, J.; Hervás-Martínez, C.; López-Granados, F. Selecting patterns and features for between-and within-crop-row weed mapping using UAV-imagery. Expert Syst. Appl. 2016, 47, 85–94. [Google Scholar] [CrossRef]
- Rango, A.; Laliberte, A.; Herrick, J.E.; Winters, C.; Havstad, K.; Steele, C.; Browning, D. Unmanned aerial vehicle-based remote sensing for rangeland assessment, monitoring, and management. J. Appl. Remote Sens. 2009, 3, 033542. [Google Scholar]
- Kuria, D.N.; Menz, G.; Misana, S.; Mwita, E.; Thamm, H.; Alvarez, M.; Mogha, N.; Becker, M.; Oyieke, H. Seasonal vegetation changes in the Malinda Wetland using bi-temporal, multi-sensor, very high resolution remote sensing data sets. Adv. Remote Sens. 2014, 3, 33. [Google Scholar] [CrossRef]
- Tamminga, A.; Hugenholtz, C.; Eaton, B.; Lapointe, M. Hyperspatial remote sensing of channel reach morphology and hydraulic fish habitat using an unmanned aerial vehicle (UAV): A first assessment in the context of river research and management. River Res. Appl. 2015, 31, 379–391. [Google Scholar] [CrossRef]
- Hubert-Moy, L.; Cotonnec, A.; Le Du, L.; Chardin, A.; Pérez, P. A comparison of parametric classification procedures of remotely sensed data applied on different landscape units. Remote Sens. Environ. 2001, 75, 174–187. [Google Scholar] [CrossRef]
- Peña-Barragán, J.M.; López-Granados, F.; García-Torres, L.; Jurado-Expósito, M.; Sánchez de La Orden, M.; García-Ferrer, A. Discriminating cropping systems and agro-environmental measures by remote sensing. Agron. Sustain. Dev. 2008, 28, 355–362. [Google Scholar] [CrossRef]
- Peña, J.M.; Gutiérrez, P.A.; Hervás-Martínez, C.; Six, J.; Plant, R.E.; López-Granados, F. Object-based image classification of summer crops with machine learning methods. Remote Sens. 2014, 6, 5019–5041. [Google Scholar] [CrossRef]
- Chuang, H.; Lur, H.; Hwu, K.; Chang, M. Authentication of domestic Taiwan rice varieties based on fingerprinting analysis of microsatellite DNA markers. Botanical Stud. 2011, 52, 393–405. [Google Scholar]
- Yang, M.; Chao, C.; Huang, K.; Lu, L.; Chen, Y. Image-based 3D scene reconstruction and exploration in augmented reality. Autom. Constr. 2013, 33, 48–60. [Google Scholar] [CrossRef]
- Lowe, D.G. Object recognition from local scale-invariant features. In Proceedings of the Seventh IEEE International Conference on Computer Vision, Kerkyra, Greece, 20–27 September 1999; Volume 2, pp. 1150–1157. [Google Scholar]
- Lowe, D.G. Distinctive image features from scale-invariant keypoints. Int. J. Comput. Vis. 2004, 60, 91–110. [Google Scholar] [CrossRef]
- Lindeberg, T. Scale-space theory: A basic tool for analyzing structures at different scales. J. Appl. Stat. 1994, 21, 225–270. [Google Scholar] [CrossRef]
- Mikolajczyk, K.; Schmid, C. An affine invariant interest point detector. In Proceedings of the European Conference on Computer Vision, Copenhagen, Denmark, 28–31 May 2002; pp. 128–142. [Google Scholar]
- Westoby, M.; Brasington, J.; Glasser, N.; Hambrey, M.; Reynolds, J. ‘Structure-from-Motion’ photogrammetry: A low-cost, effective tool for geoscience applications. Geomorphology 2012, 179, 300–314. [Google Scholar] [CrossRef]
- Tonkin, T.N.; Midgley, N.G. Ground-control networks for image based surface reconstruction: An investigation of optimum survey designs using UAV derived imagery and Structure-from-Motion photogrammetry. Remote Sens. 2016, 8, 786. [Google Scholar] [CrossRef]
- Matusik, W.; Buehler, C.; Raskar, R.; Gortler, S.J.; McMillan, L. Image-based visual hulls. In Proceedings of the 27th Annual Conference on Computer Graphics and Interactive Techniques, New Orleans, LA, USA, 23–28 July 2000; pp. 369–374. [Google Scholar]
- Jancosek, M.; Pajdla, T. Multi-view reconstruction preserving weakly-supported surfaces. In Proceedings of the IEEE Conference on Computer Vision and Pattern Recognition (CVPR), Colorado Springs, CO, USA, 20–25 June 2011; pp. 3121–3128. [Google Scholar]
- Coburn, C.; Roberts, A.C. A multiscale texture analysis procedure for improved forest stand classification. Int. J. Remote Sens. 2004, 25, 4287–4308. [Google Scholar] [CrossRef]
- Feng, Q.; Liu, J.; Gong, J. UAV remote sensing for urban vegetation mapping using random forest and texture analysis. Remote Sens. 2015, 7, 1074–1094. [Google Scholar] [CrossRef]
- Su, T.C.; Yang, M.D.; Wu, T.C.; Lin, J.Y. Morphological segmentation based on edge detection for sewer pipe defects on CCTV images. Expert Syst. Appl. 2011, 38, 13094–13114. [Google Scholar] [CrossRef]
- Materka, A.; Strzelecki, M. Texture Analysis Methods–A Review; COST B11 report; Technical university of lodz, institute of electronics: Brussels, Belgium, 1998; pp. 9–11. [Google Scholar]
- Haralick, R.M.; Shanmugam, K. Textural features for image classification. IEEE Trans. Syst. Man Cybern. 1973, SMC-3, 610–621. [Google Scholar] [CrossRef]
- Yang, M.D.; Su, T.C. Automated diagnosis of sewer pipe defects based on machine learning approaches. Expert Syst. Appl. 2008, 35, 1327–1337. [Google Scholar] [CrossRef]
- Culbert, P.D.; Pidgeon, A.M.; Louis, V.S.; Bash, D.; Radeloff, V.C. The impact of phenological variation on texture measures of remotely sensed imagery. IEEE J. Sel. Topics Appl. Earth Observ. Remote Sens. 2009, 2, 299–309. [Google Scholar] [CrossRef]
- Yang, M.D.; Su, T.C.; Pan, N.F.; Liu, P. Feature extraction of sewer pipe defects using wavelet transform and co-occurrence matrix. Int. J. Wavelets Multi. 2011, 9, 211–225. [Google Scholar] [CrossRef]
- Yang, Y.; Song, M.; Li, N.; Bu, J.; Chen, C. What is the chance of happening: A new way to predict where people look. In Proceedings of the 11th European Conference on Computer Vision, ECCV, Heraklion, Crete, Greece, 5–11 September 2010; pp. 631–643. [Google Scholar]
- Chepkochei, L.C. Object-oriented image classification of individual trees using Erdas Imagine objective: Case study of Wanjohi area, Lake Naivasha Basin, Kenya. In Proceedings of the Kenya Geothermal Conference, Nairobi, Kenya, 21–22 November 2011. [Google Scholar]
- Jovanovic, D.; Govedarica, M.; Sabo, F.; Bugarinovic, Z.; Novovic, O.; Beker, T.; Lauter, M. Land Cover change detection by using Remote Sensing—A Case Study of Zlatibor (Serbia). Geogr. Pannonica 2015, 19, 162–173. [Google Scholar]
- Dahiya, S.; Garg, P.; Jat, M.K. Object oriented approach for building extraction from high resolution satellite images. In Proceedings of the Advance Computing Conference (IACC), Ghaziabad, India, 22-23 February 2013; pp. 1300–1305. [Google Scholar]
- Yang, M. A genetic algorithm (GA) based automated classifier for remote sensing imagery. Can. J. Remote Sens. 2007, 33, 203–213. [Google Scholar] [CrossRef]
- Lillesand, T.; Kiefer, R.W.; Chipman, J. Remote Sensing and Image Interpretation; John Wiley & Sons: Hoboken, New Jersey, USA, 2014. [Google Scholar]
- Swain, P.H. Fundamentals of pattern recognition in remote sensing. In Remote Sensing: The Quantitative Approach; McGraw-Hill International Book Co.: New York, USA, 1978; pp. 136–188. [Google Scholar]
- Richards, J.A.; Richards, J. Remote Sensing Digital Image Analysis; Springer-Verlaag: Heidelberger, Berlin, German, 1999. [Google Scholar]
- Jensen, J.R.; Lulla, K. Introductory digital image processing: A remote sensing perspective. Grocarto Int. 1987, 2, 65. [Google Scholar] [CrossRef]
- Breiman, L.; Friedman, J.; Stone, C.J.; Olshen, R.A. Classification and Regression Trees; CRC Press: Boca Raton, Florida, USA, 1984. [Google Scholar]
- Cho, J.H.; Kurup, P.U. Decision tree approach for classification and dimensionality reduction of electronic nose data. Sens. Actuators. B Chem. 2011, 160, 542–548. [Google Scholar] [CrossRef]
- Chasmer, L.; Hopkinson, C.; Veness, T.; Quinton, W.; Baltzer, J. A decision-tree classification for low-lying complex land cover types within the zone of discontinuous permafrost. Remote Sens. Environ. 2014, 143, 73–84. [Google Scholar] [CrossRef]

© 2017 by the authors. Licensee MDPI, Basel, Switzerland. This article is an open access article distributed under the terms and conditions of the Creative Commons Attribution (CC BY) license (http://creativecommons.org/licenses/by/4.0/).