Moderate Increase in Protein Intake Promotes a Small Additional Improvement in Functional Capacity, But Not in Muscle Strength and Lean Mass Quality, in Postmenopausal Women Following Resistance Exercise: A Randomized Clinical Trial

 ,
,
Abstract
:1. Introduction
2. Methods
2.1. Participants
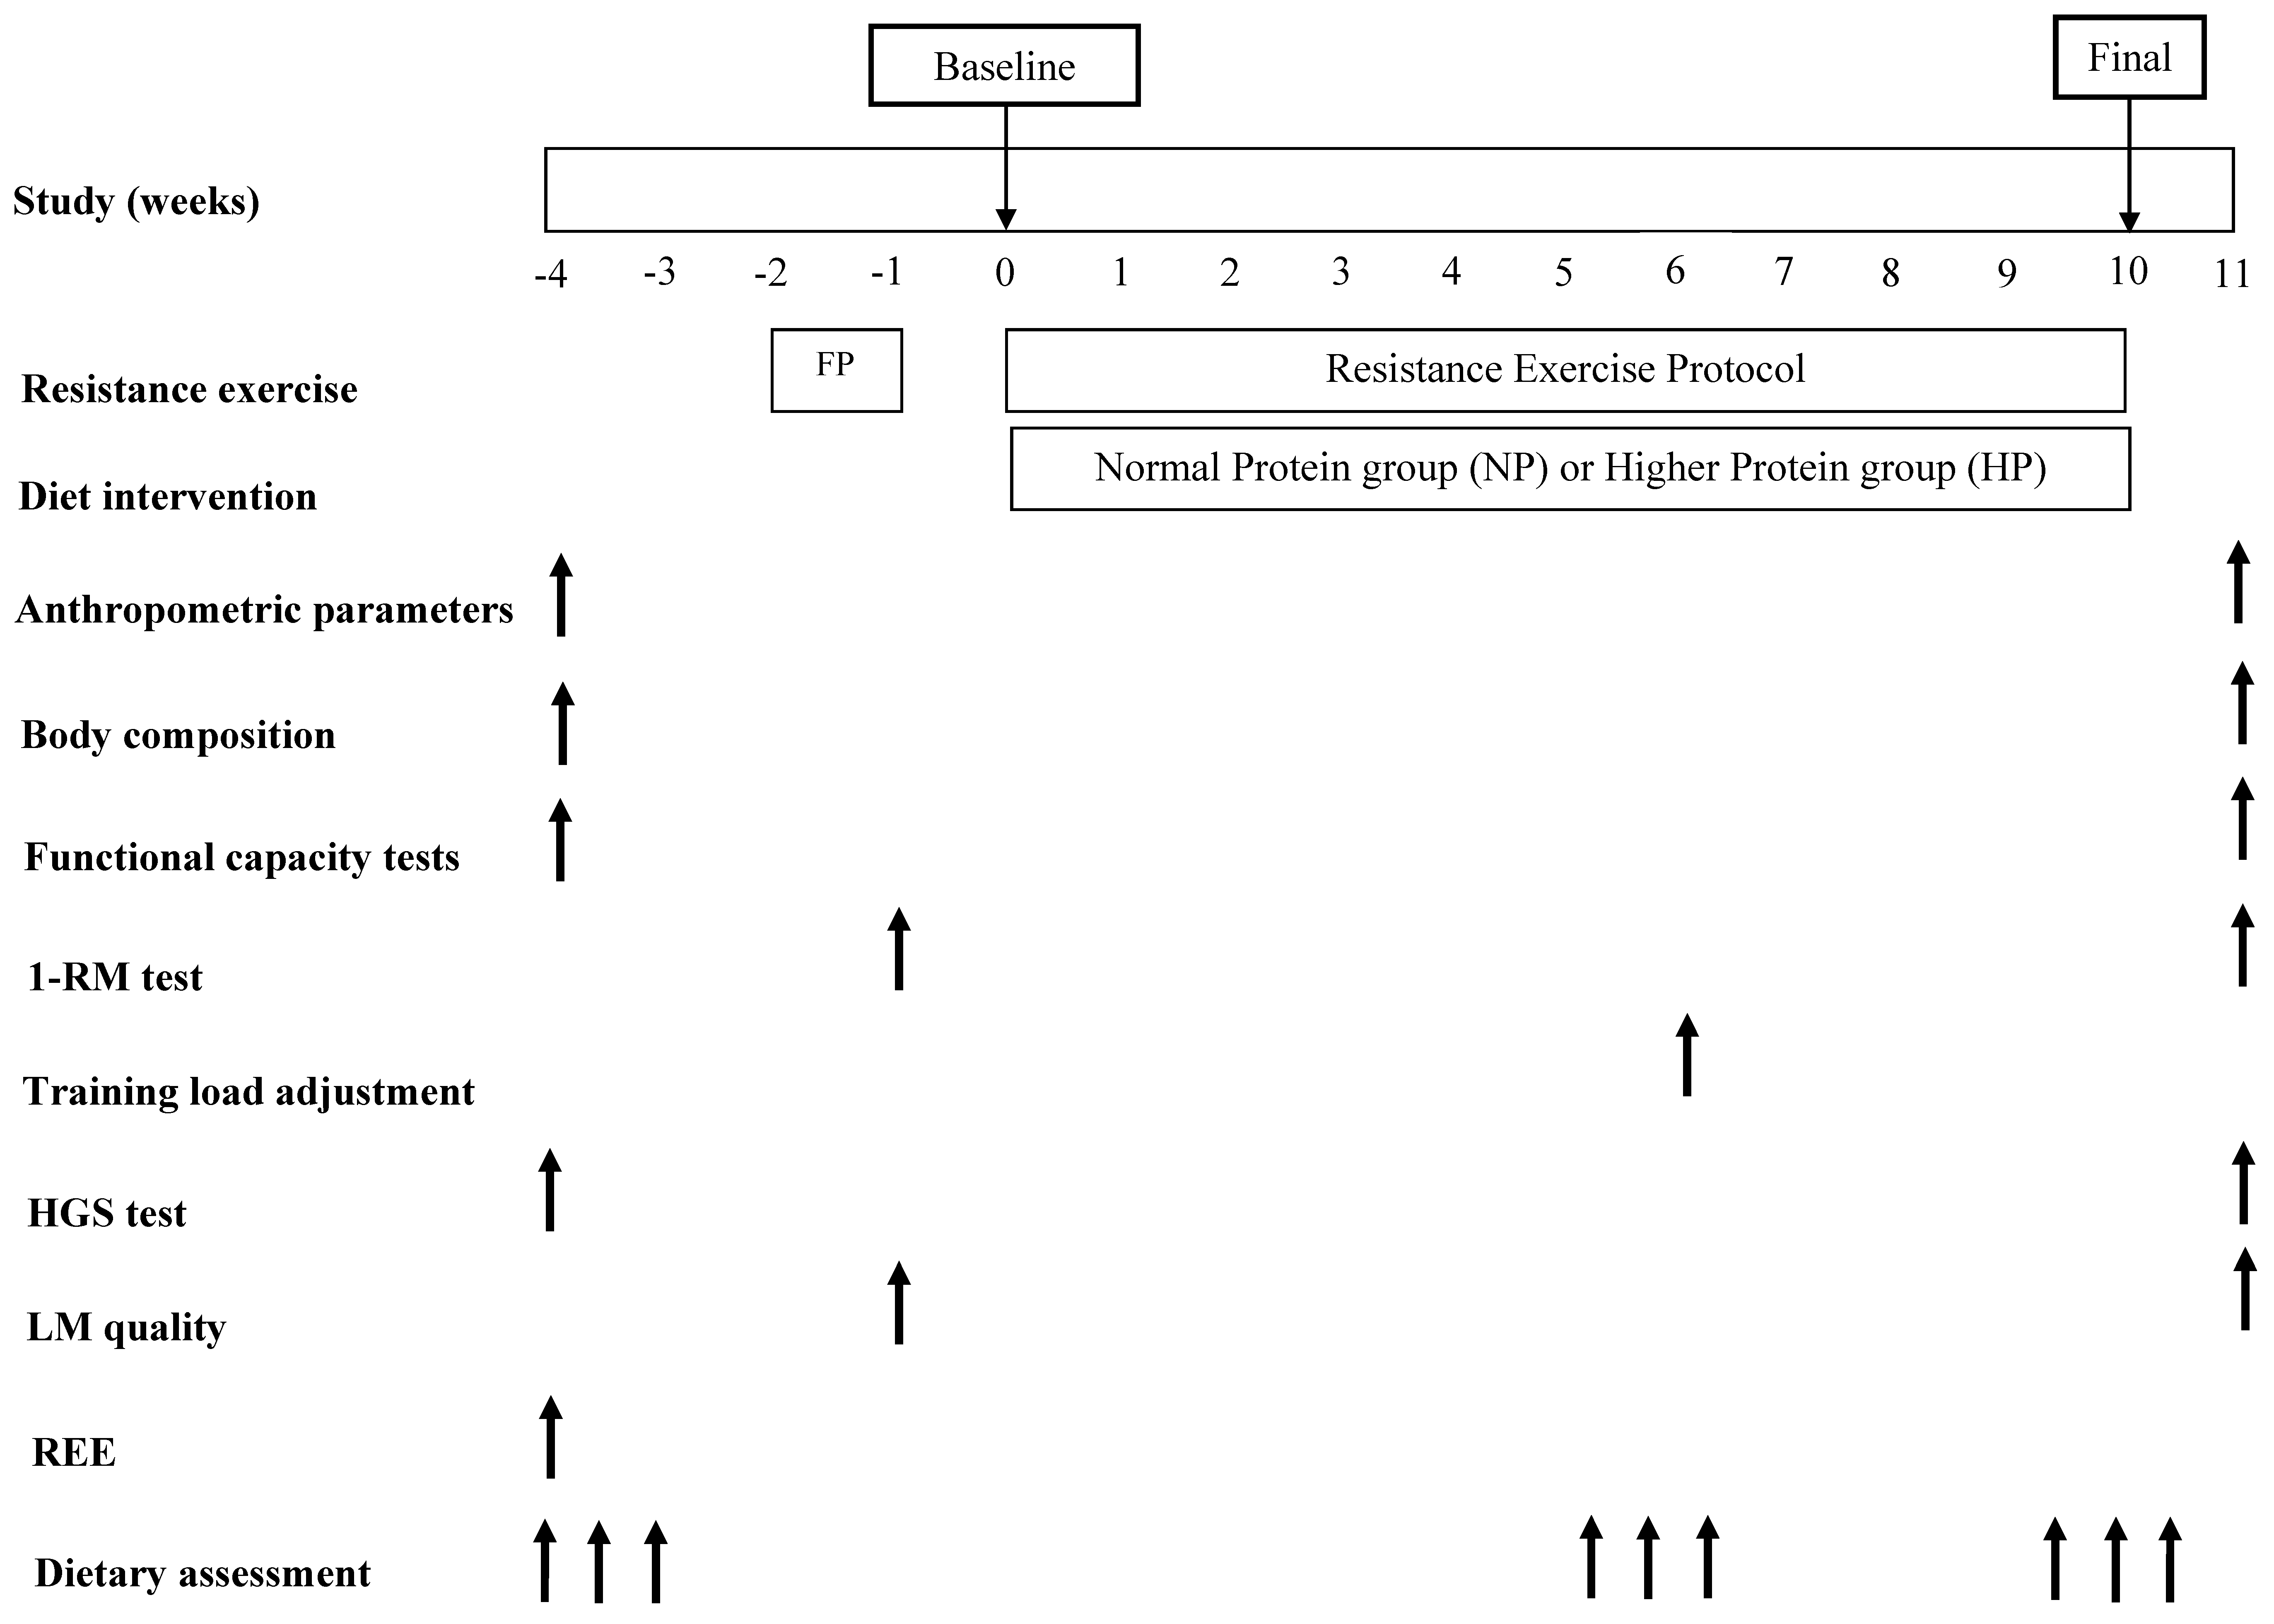
2.2. Study Design
2.3. Anthropometric Parameters
2.4. Body Composition
2.5. Functional Capacity
2.5.1. Short Physical Performance Battery (SPPB)
2.5.2. Six Minute Walk Test
2.5.3. Four Hundred Meter Walk Test
2.5.4. Ten Meter Walk Test
2.5.5. Timed Up and Go Test
2.6. Strength Measurement
2.7. Lean Mass Quality
2.8. Resting Energy Expenditure (REE) and Total Energy Expenditure (TEE)
2.9. Dietary Assessment
2.10. Experimental Protocol
2.10.1. Dietary Intervention
2.10.2. Resistance Exercise Protocol
2.11. Statistical Analysis
3. Results
3.1. Baseline Characteristics
3.2. Dietary Intake and Training Adherence
3.3. Body Composition
3.4. Strength, Functional Capacity and Lean Mass Quality
4. Discussion
5. Conclusions
Supplementary Materials
Author Contributions
Funding
Acknowledgments
Conflicts of Interest
References
- Cruz-Jentoft, A.J.; Bahat, G.; Bauer, J.; Boirie, Y.; Bruyere, O.; Cederholm, T.; Cooper, C.; Landi, F.; Rolland, Y.; Sayer, A.A.; et al. Sarcopenia: Revised European consensus on definition and diagnosis. Age Ageing 2019, 48, 16–31. [Google Scholar] [CrossRef] [PubMed]
- Moore, D.R.; Churchward-Venne, T.A.; Witard, O.; Breen, L.; Burd, N.A.; Tipton, K.D.; Phillips, S.M. Protein ingestion to stimulate myofibrillar protein synthesis requires greater relative protein intakes in healthy older versus younger men. J. Gerontol. A Biol. Sci. Med. Sci. 2015, 70, 57–62. [Google Scholar] [CrossRef] [PubMed]
- Breen, L.; Phillips, S.M. Skeletal muscle protein metabolism in the elderly: Interventions to counteract the ‘anabolic resistance’ of ageing. Nutr. Metab. 2011, 8, 68. [Google Scholar] [CrossRef] [PubMed]
- Gianoudis, J.; Bailey, C.A.; Daly, R.M. Associations between sedentary behaviour and body composition, muscle function and sarcopenia in community-dwelling older adults. Osteoporos. Int. 2015, 26, 571–579. [Google Scholar] [CrossRef] [PubMed]
- Nair, K. S Aging muscle. Am. J. Clin. Nutr. 2005, 81, 953–963. [Google Scholar] [CrossRef] [PubMed]
- Burger, H.G.; Hale, G.E.; Robertson, D.M.; Dennerstein, L. A review of hormonal changes during the menopausal transition: Focus on findings from the Melbourne Women’s Midlife Health Project. Hum. Reprod. Update 2007, 13, 559–565. [Google Scholar] [CrossRef] [PubMed]
- Messier, V.; Rabasa-Lhoret, R.; Barbat-Artigas, S.; Elisha, B.; Karelis, A.D.; Aubertin-Leheudre, M. Menopause and sarcopenia: A potential role for sex hormones. Maturitas 2011, 68, 331–336. [Google Scholar] [CrossRef] [PubMed]
- Landi, F.; Cruz-Jentoft, A.J.; Liperoti, R.; Russo, A.; Giovannini, S.; Tosato, M.; Capoluongo, E.; Bernabei, R.; Onder, G. Sarcopenia and mortality risk in frail older persons aged 80 years and older: Results from ilSIRENTE study. Age Ageing 2013, 42, 203–209. [Google Scholar] [CrossRef] [PubMed]
- Cruz-Jentoft, A.J.; Landi, F.; Schneider, S.M.; Zuniga, C.; Arai, H.; Boirie, Y.; Chen, L.K.; Fielding, R.A.; Martin, F.C.; Michel, J.P.; et al. Prevalence of and interventions for sarcopenia in ageing adults: A systematic review. Report of the International Sarcopenia Initiative (EWGSOP and IWGS). Age Ageing 2014, 43, 748–759. [Google Scholar] [CrossRef]
- Bokshan, S.L.; DePasse, J.M.; Daniels, A.H. Sarcopenia in Orthopedic Surgery. Orthopedics 2016, 39, 295–300. [Google Scholar] [CrossRef]
- Newman, A.B.; Haggerty, C.L.; Goodpaster, B.; Harris, T.; Kritchevsky, S.; Nevitt, M.; Miles, T.P.; Visser, M. Strength and muscle quality in a well-functioning cohort of older adults: The Health, Aging and Body Composition Study. J. Am. Geriatr. Soc. 2003, 51, 323–330. [Google Scholar] [CrossRef]
- Lauretani, F.; Russo, C.R.; Bandinelli, S.; Bartali, B.; Cavazzini, C.; Iorio, A.D.; Corsi, A.M.; Rantanen, T.; Guralnik, J.M.; Ferrucci, L. Age-associated changes in skeletal muscles and their effect on mobility: An operational diagnosis of sarcopenia. J. Appl. Physiol. 2003, 95, 1851–1860. [Google Scholar] [CrossRef]
- Visser, M.; Kritchevsky, S.B.; Goodpaster, B.H.; Newman, A.B.; Nevitt, M.; Stamm, E.; Harris, T.B. Leg Muscle Mass and Composition in Relation to Lower Extremity Performance in Men and Women Aged 70 to 79: The Health, Aging and Body Composition Study. J. Am. Geriatr. Soc. 2002, 50, 897–904. [Google Scholar] [CrossRef]
- Ward-Ritacco, C.L.; Adrian, A.L.; Johnson, M.A.; Rogers, L.Q.; Evans, E.M. Adiposity, physical activity, and muscle quality are independently related to physical function performance in middle-aged postmenopausal women. Menopause 2014, 21, 1114–1121. [Google Scholar] [CrossRef] [PubMed]
- Garber, C.E.; Blissmer, B.; Deschenes, M.R.; Franklin, B.A.; Lamonte, M.J.; Lee, I.M.; Nieman, D.C.; Swain, D.P. American College of Sports Medicine position stand. Quantity and quality of exercise for developing and maintaining cardiorespiratory, musculoskeletal, and neuromotor fitness in apparently healthy adults: Guidance for prescribing exercise. Med. Sci. Sports Exerc. 2011, 43, 1334–1359. [Google Scholar] [CrossRef]
- Leenders, M.; Verdijk, L.B.; van der Hoeven, L.; van Kranenburg, J.; Nilwik, R.; van Loon, L.J. Elderly men and women benefit equally from prolonged resistance-type exercise training. J. Gerontol A Biol. Sci. Med. Sci. 2013, 68, 769–779. [Google Scholar] [CrossRef]
- Nunes, P.R.; Barcelos, L.C.; Oliveira, A.A.; Furlanetto Junior, R.; Martins, F.M.; Orsatti, C.L.; Resende, E.A.; Orsatti, F.L. Effect of resistance training on muscular strength and indicators of abdominal adiposity, metabolic risk, and inflammation in postmenopausal women: Controlled and randomized clinical trial of efficacy of training volume. Age (Dordr) 2016, 38, 40. [Google Scholar] [CrossRef] [PubMed]
- De Branco, F.M.S.; Carneiro, M.A.S.; Rossato, L.T.; Nahas, P.C.; Teixeira, K.R.C.; de Oliveira, G.N.; Orsatti, F.L., Jr.; de Oliveira, E.P. Protein timing has no effect on lean mass, strength and functional capacity gains induced by resistance exercise in postmenopausal women: A randomized clinical trial. Clin. Nutr. 2019. [Google Scholar] [CrossRef] [PubMed]
- Breen, L.; Phillips, S.M. Nutrient interaction for optimal protein anabolism in resistance exercise. Curr. Opin. Clin. Nutr. Metab. Care 2012, 15, 226–232. [Google Scholar] [CrossRef]
- Morton, R.W.; Murphy, K.T.; McKellar, S.R.; Schoenfeld, B.J.; Henselmans, M.; Helms, E.; Aragon, A.A.; Devries, M.C.; Banfield, L.; Krieger, J.W.; et al. A systematic review, meta-analysis and meta-regression of the effect of protein supplementation on resistance training-induced gains in muscle mass and strength in healthy adults. Br. J. Sports Med. 2018, 52, 376–384. [Google Scholar] [CrossRef]
- Tieland, M.; Dirks, M.L.; van der Zwaluw, N.; Verdijk, L.B.; van de Rest, O.; de Groot, L.C.; van Loon, L.J. Protein supplementation increases muscle mass gain during prolonged resistance-type exercise training in frail elderly people: A randomized, double-blind, placebo-controlled trial. J. Am. Med. Dir. Assoc. 2012, 13, 713–719. [Google Scholar] [CrossRef] [PubMed]
- Finger, D.; Goltz, F.R.; Umpierre, D.; Meyer, E.; Rosa, L.H.T.; Schneider, C.D. Effects of Protein Supplementation in Older Adults Undergoing Resistance Training: A Systematic Review and Meta-Analysis. Sports Med. 2015, 45, 245–255. [Google Scholar] [CrossRef] [PubMed]
- Rossato, L.T.; Nahas, P.C.; de Branco, F.M.S.; Martins, F.M.; Souza, A.P.; Carneiro, M.A.S.; Orsatti, F.L.; de Oliveira, E.P. Higher Protein Intake Does Not Improve Lean Mass Gain When Compared with RDA Recommendation in Postmenopausal Women Following Resistance Exercise Protocol: A Randomized Clinical Trial. Nutrients 2017, 9, 1007. [Google Scholar] [CrossRef] [PubMed]
- Barbosa, C.D.; Costa, J.G.; Giolo, J.S.; Rossato, L.T.; Nahas, P.C.; Mariano, I.M.; Batista, J.P.; Puga, G.M.; de Oliveira, E.P. Isoflavone supplementation plus combined aerobic and resistance exercise do not change phase angle values in postmenopausal women: A randomized placebo-controlled clinical trial. Exp. Gerontol. 2019, 117, 31–37. [Google Scholar] [CrossRef] [PubMed]
- Food and Nutrition Board. Dietary Reference Intakes for energy, carbohydrate, fiber, fat, fatty acids, cholesterol, protein, and amino acids (Macronutrients). Wash. (DC) Nat. Acad. Press 2005. [Google Scholar] [CrossRef]
- Phillips, S.M.; Martinson, W. Nutrient-rich, high-quality, protein-containing dairy foods in combination with exercise in aging persons to mitigate sarcopenia. Nutr. Rev. 2019, 77, 216–229. [Google Scholar] [CrossRef]
- Bauer, J.; Biolo, G.; Cederholm, T.; Cesari, M.; Cruz-Jentoft, A.J.; Morley, J.E.; Phillips, S.; Sieber, C.; Stehle, P.; Teta, D.; et al. Evidence-based recommendations for optimal dietary protein intake in older people: A position paper from the PROT-AGE Study Group. J. Am. Med. Dir. Assoc. 2013, 14, 542–559. [Google Scholar] [CrossRef]
- Deutz, N.E.; Bauer, J.M.; Barazzoni, R.; Biolo, G.; Boirie, Y.; Bosy-Westphal, A.; Cederholm, T.; Cruz-Jentoft, A.; Krznaric, Z.; Nair, K.S.; et al. Protein intake and exercise for optimal muscle function with aging: Recommendations from the ESPEN Expert Group. Clin. Nutr. 2014, 33, 929–936. [Google Scholar] [CrossRef] [Green Version]
- Isanejad, M.; Mursu, J.; Sirola, J.; Kroger, H.; Rikkonen, T.; Tuppurainen, M.; Erkkila, A.T. Dietary protein intake is associated with better physical function and muscle strength among elderly women. Br. J. Nutr. 2016, 115, 1281–1291. [Google Scholar] [CrossRef] [Green Version]
- Dankel, S.J.; Buckner, S.L.; Jessee, M.B.; Grant Mouser, J.; Mattocks, K.T.; Abe, T.; Loenneke, J.P. Correlations Do Not Show Cause and Effect: Not Even for Changes in Muscle Size and Strength. Sports Med. 2017, 48, 1–6. [Google Scholar] [CrossRef]
- Loenneke, J.P.; Dankel, S.J.; Bell, Z.W.; Buckner, S.L.; Mattocks, K.T.; Jessee, M.B.; Abe, T. Is muscle growth a mechanism for increasing strength? Med. Hypotheses 2019, 125, 51–56. [Google Scholar] [CrossRef] [PubMed]
- Lohman, T.G.; Roche, A.F.; Martorell, R. Anthropometric Standardization Reference Manual, ©1988 ed.; Human Kinetics Books: Champaign, IL, USA, 1988. [Google Scholar]
- Guralnik, J.M.; Simonsick, E.M.; Ferrucci, L.; Glynn, R.J.; Berkman, L.F.; Blazer, D.G.; Scherr, P.A.; Wallace, R.B. A short physical performance battery assessing lower extremity function: Association with self-reported disability and prediction of mortality and nursing home admission. J. Gerontol. 1994, 49, 85–94. [Google Scholar] [CrossRef]
- Steffen, T.M.; Hacker, T.A.; Mollinger, L. Age- and gender-related test performance in community-dwelling elderly people: Six-Minute Walk Test, Berg Balance Scale, Timed Up & Go Test, and gait speeds. Phys. Ther. 2002, 82, 128–137. [Google Scholar] [PubMed]
- Shumway-Cook, A.; Guralnik, J.M.; Phillips, C.L.; Coppin, A.K.; Ciol, M.A.; Bandinelli, S.; Ferrucci, L. Age-associated declines in complex walking task performance: The Walking InCHIANTI toolkit. J. Am. Geriatr. Soc. 2007, 55, 58–65. [Google Scholar] [CrossRef]
- Scivoletto, G.; Tamburella, F.; Laurenza, L.; Foti, C.; Ditunno, J.F.; Molinari, M. Validity and reliability of the 10-m walk test and the 6-min walk test in spinal cord injury patients. Spinal Cord 2011, 49, 736–740. [Google Scholar] [CrossRef]
- Reis, B.C.A.; de Branco, F.M.S.; Pessoa, D.F.; Barbosa, C.D.; Dos Reis, A.S.; de Medeiros, L.A.; de Oliveira, E.P. Phase angle is positively associated with handgrip strength in hospitalized individuals. Top. Clin. Nutr. 2018, 33, 127–133. [Google Scholar] [CrossRef]
- De Oliveira, E.P.; Orsatti, F.L.; Teixeira, O.; Maesta, N.; Burini, R.C. Comparison of predictive equations for resting energy expenditure in overweight and obese adults. J. Obes. 2011, 2011, 534714. [Google Scholar] [CrossRef]
- Weir, J.B. New methods for calculating metabolic rate with special reference to protein metabolism. J. Physiol. 1949, 109, 1–9. [Google Scholar] [CrossRef]
- Volek, J.S.; Forsythe, C.E.; Kraemer, W.J. Nutritional aspects of women strength athletes. Br. J. Sports Med. 2006, 40, 742–748. [Google Scholar] [CrossRef] [Green Version]
- USDA. Food Composition Databases; Release 20 Slightly Revised; United States Department of Agriculture: Washington, DC, USA, 2007.
- Naderi, A.; de Oliveira, E.P.; Ziegenfuss, T.N.; Willems, M.T. Timing, Optimal Dose and Intake Duration of Dietary Supplements with Evidence-Based Use in Sports Nutrition. J. Exerc. Nutr. Biochem. 2016, 20, 1–12. [Google Scholar] [CrossRef]
- ACSM. American College of Sports Medicine position stand. Progression models in resistance training for healthy adults. Med. Sci. Sports Exerc. 2009, 41, 687–708. [Google Scholar] [CrossRef] [PubMed]
- Stark, M.; Lukaszuk, J.; Prawitz, A.; Salacinski, A. Protein timing and its effects on muscular hypertrophy and strength in individuals engaged in weight-training. J. Int. Soc. Sports Nutr. 2012, 9, 54. [Google Scholar] [CrossRef] [PubMed]
- Mehdy Jeleel, S.; AbbasAbdul Hussein, F. Comparison between of estimators Robust and Classical in repeated measurement experiments analysis. J. Kerbala Univ. 2016, 12, 201–215. [Google Scholar]
- Fritz, C.O.; Morris, P.E.; Richler, J.J. Effect size estimates: Current use, calculations, and interpretation. J. Exp. Psychol. Gen. 2012, 141, 2–18. [Google Scholar] [CrossRef] [PubMed]
- Shrout, P.E.; Fleiss, J.L. Intraclass correlations: Uses in assessing rater reliability. Psychol. Bull. 1979, 86, 420–428. [Google Scholar] [CrossRef] [PubMed]
- Landi, F.; Calvani, R.; Tosato, M.; Martone, A.M.; Ortolani, E.; Savera, G.; Sisto, A.; Marzetti, E. Anorexia of Aging: Risk Factors, Consequences, and Potential Treatments. Nutrients 2016, 8, 69. [Google Scholar] [CrossRef] [PubMed]
- Phillips, S.M.; Chevalier, S.; Leidy, H.J. Protein “requirements” beyond the RDA: Implications for optimizing health. Appl. Physiol. Nutr. Metab. 2016, 41, 565–572. [Google Scholar] [CrossRef] [PubMed]
- Paddon-Jones, D.; Campbell, W.W.; Jacques, P.F.; Kritchevsky, S.B.; Moore, L.L.; Rodriguez, N.R.; van Loon, L.J. Protein and healthy aging. Am. J. Clin. Nutr. 2015, 101, 1339–1345. [Google Scholar] [CrossRef]
- McDonald, C.K.; Ankarfeldt, M.Z.; Capra, S.; Bauer, J.; Raymond, K.; Heitmann, B.L. Lean body mass change over 6 years is associated with dietary leucine intake in an older Danish population. Br. J. Nutr. 2016, 115, 1556–1562. [Google Scholar] [CrossRef] [Green Version]
- Rafii, M.; Chapman, K.; Owens, J.; Elango, R.; Campbell, W.W.; Ball, R.O.; Pencharz, P.B.; Courtney-Martin, G. Dietary protein requirement of female adults >65 years determined by the indicator amino acid oxidation technique is higher than current recommendations. J. Nutr. 2015, 145, 18–24. [Google Scholar] [CrossRef]
- Tang, M.; McCabe, G.P.; Elango, R.; Pencharz, P.B.; Ball, R.O.; Campbell, W.W. Assessment of protein requirement in octogenarian women with use of the indicator amino acid oxidation technique. Am. J. Clin. Nutr. 2014, 99, 891–898. [Google Scholar] [CrossRef] [PubMed]
- Cermak, N.M.; Res, P.T.; de Groot, L.C.; Saris, W.H.; van Loon, L.J. Protein supplementation augments the adaptive response of skeletal muscle to resistance-type exercise training: A meta-analysis. Am. J. Clin. Nutr. 2012, 96, 1454–1464. [Google Scholar] [CrossRef] [PubMed]
- Hughes, V.A.; Frontera, W.R.; Wood, M.; Evans, W.J.; Dallal, G.E.; Roubenoff, R.; Fiatarone Singh, M.A. Longitudinal muscle strength changes in older adults: Influence of muscle mass, physical activity, and health. J. Gerontol. A Biol. Sci. Med. Sci. 2001, 56, 209–217. [Google Scholar] [CrossRef] [PubMed]
- Rippberger, P.L.; Emeny, R.T.; Mackenzie, T.A.; Bartels, S.J.; Batsis, J.A. The association of sarcopenia, telomere length, and mortality: Data from the NHANES 1999–2002. Eur. J. Clin. Nutr. 2018, 12, 255–263. [Google Scholar] [CrossRef] [PubMed]
- Balogun, S.; Winzenberg, T.; Wills, K.; Scott, D.; Jones, G.; Aitken, D.; Callisaya, M.L. Prospective Associations of Low Muscle Mass and Function with 10-Year Falls Risk, Incident Fracture and Mortality in Community-Dwelling Older Adults. J. Nutr. Health Aging 2017, 21, 843–848. [Google Scholar] [CrossRef]
- Stessman, J.; Rottenberg, Y.; Fischer, M.; Hammerman-Rozenberg, A.; Jacobs, J.M. Handgrip Strength in Old and Very Old Adults: Mood, Cognition, Function, and Mortality. J. Am. Geriatr. Soc. 2017, 65, 526–532. [Google Scholar] [CrossRef]
- Platte, P.; Pirke, K.M.; Wade, S.E.; Trimborn, P.; Fichter, M.M. Physical activity, total energy expenditure, and food intake in grossly obese and normal weight women. Int. J. Eat. Disord. 1995, 17, 51–57. [Google Scholar] [CrossRef]
- Lafay, L.; Mennen, L.; Basdevant, A.; Charles, M.A.; Borys, J.M.; Eschwege, E.; Romon, M. Does energy intake underreporting involve all kinds of food or only specific food items? Results from the Fleurbaix Laventie Ville Sante (FLVS) study. Int. J. Obes. Relat. Metab. Disord. 2000, 24, 1500–1506. [Google Scholar] [CrossRef]
- Rossato, L.T.; Barbosa, C.D.; Nahas, P.C.; Orsatti, F.L.; de Oliveira, E.P. Anthropometric and demographic predictors of handgrip strength and lean mass quality in hospitalized individuals. Clin. Nutri. ESPEN 2018, 24, 58–61. [Google Scholar] [CrossRef]
- Lees, M.J.; Wilson, O.J.; Hind, K.; Ispoglou, T. Muscle quality as a complementary prognostic tool in conjunction with sarcopenia assessment in younger and older individuals. Eur. J. Appl. Physiol. 2019, 119, 1171–1181. [Google Scholar] [CrossRef]
- Poggiogalle, E.; Lubrano, C.; Gnessi, L.; Mariani, S.; Di Martino, M.; Catalano, C.; Lenzi, A.; Donini, L.M. The decline in muscle strength and muscle quality in relation to metabolic derangements in adult women with obesity. Clin. Nutr. 2019. [Google Scholar] [CrossRef] [PubMed]


| NP (n = 25) | HP (n = 22) | p-value | |
|---|---|---|---|
| Demographic and Anthropometrics | |||
| Age, y | 62.0 ± 2.6 | 64.7 ±2.8 | 0.741 |
| Weight, kg | 67.5 ± 5.7 | 67.1 ± 5.0 | 0.908 |
| Height, m | 1.55 ± 0.02 | 1.55 ± 0.01 | 0.879 |
| Body Mass Index, kg/m² | 28.2 ± 2.0 | 27.5 ± 1.8 | 0.678 |
| Energy Expenditure | |||
| Resting Energy Expenditure, kcal | 1580 ± 74.1 | 1431 ± 88.3 | 0.402 |
| Total Energy Expenditure, kcal | 2074 ± 80.4 | 1969 ± 79.7 | 0.338 |
| Body Composition | |||
| Total lean mass, kg | 35.7 ± 1.1 | 36.5 ± 1.1 | 0.794 |
| Arms lean mass, kg | 4.0 ± 0.78 | 4.0 ± 0.81 | 0.883 |
| Trunk lean mass, kg | 17.3 ± 2.4 | 17.3 ± 2.3 | 0.821 |
| Arms + trunk lean mass, kg | 21.2 ± 3.1 | 21.3 ± 2.9 | 0.888 |
| Leg lean mass, kg | 12.5 ± 2.5 | 12.5 ± 2.6 | 0.847 |
| Total fat mass, kg | 28.9 ± 2.2 | 27.6 ± 1.7 | 0.931 |
| Strength | |||
| Bench press 1-RM, kg | 31.0 ± 1.3 | 32.2 ± 1.9 | 0.373 |
| Leg extension 1-RM, kg | 64.2 ± 3.0 | 70.3 ± 4.0 | 0.492 |
| Right HGS, kg | 25.1 ± 1.0 | 26.5 ± 1.0 | 0.387 |
| Left HGS, kg | 23.5 ± 0.9 | 23.6 ± 1.2 | 0.800 |
| Functional Capacity | |||
| Balance test—SPPB, score | 3.7 ± 0.14 | 3.4 ± 0.21 | 0.816 |
| 4 m walk test—SPPS, s | 3.4 ± 0.13 | 3.4 ± 013 | 0.788 |
| Five time sit-to-stand test—SPPB, s | 11.0 ± 0.5 | 10.0 ± 0.6 | 0.167 |
| Total SPPB, score | 11.1 ± 0.2 | 10.9 ± 0.3 | 0.794 |
| 6 min walk test, m/s | 1.7 ± 0.06 | 1.6 ± 0.04 | 0.322 |
| 400 m walk test, m/s | 1.7 ± 0.05 | 1.7 ± 0.04 | 0.557 |
| 10 m walk test, m/s | 1.3 ± 0.05 | 1.2 ± 0.04 | 0.845 |
| Timed Up and Go test, s | 7.9 ± 0.4 | 7.4 ± 0.3 | 0.294 |
| Lean Mass Quality | |||
| Bench press 1-RM/Arms + trunk LM | 1.50 ± 0.05 | 1.51 ± 0.07 | 0.395 |
| Leg extension 1-RM/Legs LM | 5.35 ± 0.22 | 5.65 ± 0.31 | 0.839 |
| NP (n = 25) | HP (n = 22) | p-value | |||||
|---|---|---|---|---|---|---|---|
| Pre | During | Pre | During | Time | Group | Time × Group | |
| Calories, kcal | 1327 ± 76.6 | 1375 ± 33.0 | 1273 ± 89.0 | 1463 ± 33.4 | 0.062 | 0.835 | 0.266 |
| Carbohydrate, g | 159.6 ± 9.4 | 163.0 ± 5.4 | 159.8 ± 12.7 | 170.3 ± 5.7 | 0.401 | 0.694 | 0.672 |
| Carbohydrate, % | 48.4 ± 1.3 | 48.1 ± 1.1 | 49.9 ± 1.0 | 47.9 ± 1.0 | 0.198 | 0.638 | 0.350 |
| Lipids, g | 53.7 ± 3.4 | 53.0 ± 2.0 | 50.7 ± 3.5 | 53.6 ± 1.7 | 0.731 | 0.631 | 0.548 |
| Lipids, % | 36.5 ± 1.2 | 35.2 ± 1.1 | 36.1 ± 0.9 | 33.3 ± 0.7 | 0.059 | 0.277 | 0.365 |
| Protein, g | 49.1 ± 2.8 a | 57.4 ± 1.9 a | 49.2 ± 2.9 a | 72.0 ± 3.0 b | <0.001 | 0.029 | 0.012 |
| Protein, % | 14.9 ± 0.5 a | 17.0 ± 0.5 a | 15.9 ± 0.5 a | 19.6 ± 0.6 b | <0.001 | 0.003 | 0.003 |
| Protein, g/kg | 0.76 ± 0.06 a | 0.85 ± 0.04 a | 0.76 ± 0.05 a | 1.17 ± 0.06 b | <0.001 | 0.017 | 0.009 |
| NP (n = 25) | HP (n = 22) | p-value | |||||||
|---|---|---|---|---|---|---|---|---|---|
| Pre | Post | Pre | Post | Time | ES (r) | Group | Time × Group | ES (r) | |
| Strength | |||||||||
| Bench press 1-RM, kg | 31.2 ± 1.2 | 33.5 ± 1.4 | 32.5 ± 1.6 | 32.8 ± 1.3 | 0.219 | - | 0.859 | 0.308 | - |
| Leg extension 1-RM, kg | 65.8 ± 2.8 | 72.2 ± 3.6 | 70.5 ± 3.5 | 75.1 ± 3.6 | 0.007 | 0.03 | 0.371 | 0.608 | - |
| Right HGS, kg | 25.5 ± 1.0 | 27.3 ± 1.0 | 26.6 ± 1.0 | 30.3 ± 0.9 | <0.001 | 0.07 | 0.086 | 0.256 | - |
| Left HGS, kg | 23.7 ± 0.9 | 25.3 ± 1.0 | 24.0 ± 1.1 | 26.2 ± 0.9 | 0.010 | 0.04 | 0.637 | 0.700 | - |
| Functional Capacity | |||||||||
| Balance test—SPPB, score | 3.7 ± 0.14 | 4.0 ± 0.12 | 3.5 ± 0.20 | 4.0 ± 0.13 | 0.002 | 0.68 | 0.380 | 0.485 | - |
| 4 m walk test— SPPB, s | 3.4 ± 0.12 | 3.3 ± 0.14 | 3.3 ± 0.13 | 2.9 ± 0.17 | 0.039 | 0.02 | 0.212 | 0.114 | - |
| Five time sit-to-stand test—SPPB, s | 10.9 ± 0.5 | 11.4 ± 0.6 | 9.9 ± 0.5 | 11.0 ± 0.7 | 0.106 | - | 0.294 | 0.597 | - |
| Total SPPB, score | 11.1 ± 0.2 | 11.1 ± 0.2 | 11.0 ± 0.3 | 11.5 ± 0.2 | 0.294 | - | 0.443 | 0.320 | - |
| 6 min walk test, m/s | 1.7 ± 0.06 | 1.7 ± 0.06 | 1.6 ± 0.04 | 1.9 ± 0.06 | 0.002 | 0.04 | 0.778 | 0.007 | 0.07 |
| 400 m walk test, m/s | 1.7 ± 0.06 | 1.7 ± 0.06 | 1.7 ± 0.04 | 1.9 ± 0.06 | 0.005 | 0.03 | 0.260 | 0.004 | 0.08 |
| 10 m walk test, m/s | 1.3 ± 0.04 | 1.4 ± 0.04 | 1.3 ± 0.04 | 1.4 ± 0.04 | 0.002 | 0.07 | 0.943 | 0.360 | - |
| Timed Up and Go test, s | 8.0 ± 0.4 | 8.1 ± 0.3 | 7.3 ± 0.3 | 7.5 ± 0.3 | 0.520 | - | 0.099 | 0.890 | - |
| Lean mass quality | |||||||||
| Bench press 1-RM/Arms + trunk LM | 1.5 ± 0.06 | 1.5 ± 0.06 | 1.5 ± 0.06 | 1.4 ± 0.06 | 0.377 | - | 0.520 | 0.092 | - |
| Leg extension 1-RM/Leg LM | 5.4 ± 0.22 | 5.5 ± 0.24 | 5.8 ± 0.30 | 6.4 ± 0.36 | 0.050 | - | 0.059 | 0.279 | - |
© 2019 by the authors. Licensee MDPI, Basel, Switzerland. This article is an open access article distributed under the terms and conditions of the Creative Commons Attribution (CC BY) license (http://creativecommons.org/licenses/by/4.0/).
Share and Cite
Nahas, P.C.; Rossato, L.T.; Martins, F.M.; Souza, A.P.; de Branco, F.M.S.; Carneiro, M.A.S.; Teixeira, K.R.C.; Orsatti, F.L.; de Oliveira, E.P. Moderate Increase in Protein Intake Promotes a Small Additional Improvement in Functional Capacity, But Not in Muscle Strength and Lean Mass Quality, in Postmenopausal Women Following Resistance Exercise: A Randomized Clinical Trial. Nutrients 2019, 11, 1323. https://doi.org/10.3390/nu11061323
Nahas PC, Rossato LT, Martins FM, Souza AP, de Branco FMS, Carneiro MAS, Teixeira KRC, Orsatti FL, de Oliveira EP. Moderate Increase in Protein Intake Promotes a Small Additional Improvement in Functional Capacity, But Not in Muscle Strength and Lean Mass Quality, in Postmenopausal Women Following Resistance Exercise: A Randomized Clinical Trial. Nutrients. 2019; 11(6):1323. https://doi.org/10.3390/nu11061323
Chicago/Turabian StyleNahas, Paula C., Luana T. Rossato, Fernanda M. Martins, Aletéia P. Souza, Flávia M. S. de Branco, Marcelo A. S. Carneiro, Kely R. C. Teixeira, Fábio L. Orsatti, and Erick P. de Oliveira. 2019. "Moderate Increase in Protein Intake Promotes a Small Additional Improvement in Functional Capacity, But Not in Muscle Strength and Lean Mass Quality, in Postmenopausal Women Following Resistance Exercise: A Randomized Clinical Trial" Nutrients 11, no. 6: 1323. https://doi.org/10.3390/nu11061323