High Fat Rodent Models of Type 2 Diabetes: From Rodent to Human


Laboratory of Systems Physiology, Department of Kinesiology, The University of North Carolina at Charlotte, Charlotte, NC 28223, USA
*
Author to whom correspondence should be addressed.
Nutrients 2020, 12(12), 3650; https://doi.org/10.3390/nu12123650
Submission received: 26 October 2020
/
Revised: 20 November 2020
/
Accepted: 23 November 2020
/
Published: 27 November 2020
(This article belongs to the Special Issue High-Fat High-Saturated Diet)
Abstract
:Poor dietary habits contribute to increased incidences of obesity and related co-morbidities, such as type 2 diabetes (T2D). The biological, genetic, and pathological implications of T2D, are commonly investigated using animal models induced by a dietary intervention. In spite of significant research contributions, animal models have limitations regarding the translation to human pathology, which leads to questioning their clinical relevance. Important considerations include diet-specific effects on whole organism energy balance and glucose and insulin homeostasis, as well as tissue-specific changes in insulin and glucose tolerance. This review will examine the T2D-like phenotype in rodents resulting from common diet-induced models and their relevance to the human disease state. Emphasis will be placed on the disparity in percentages and type of dietary fat, the duration of intervention, and whole organism and tissue-specific changes in rodents. An evaluation of these models will help to identify a diet-induced rodent model with the greatest clinical relevance to the human T2D pathology. We propose that a 45% high-fat diet composed of approximately one-third saturated fats and two-thirds unsaturated fats may provide a diet composition that aligns closely to average Western diet macronutrient composition, and induces metabolic alterations mirrored by clinical populations.
1. Introduction
High fat diet (HFD) animal models utilize a variety of fat sources to mimic the typical Western diet, which in the U.S. population consists of ~70% more saturated fat than the recommended dietary guidelines [1]. A twelve-year National Health and Nutrition Examination Study (NHANES) study demonstrated that individuals consuming high amounts of carbohydrates, cholesterol, saturated fatty acids, polyunsaturated fats, monounsaturated fats, and protein have a greater propensity to develop glucose intolerance when compared to individuals with dietary patterns high in vitamin, mineral, and fiber content [2]. Saturated fatty acids (SFA), which are stored more readily in rodents and humans compared to monounsaturated and polyunsaturated fats, increase the risk of obesity [3]. Therefore, it is important to work towards the uniform formulation of a rodent diet that best represents human consumption, while promoting a similar type 2 diabetes (T2D) phenotype.
HFD consumed ab libitum results in rodents exceeding typical daily caloric intake [4], and animal-based fats promote diet-induced obesity and insulin resistance better than vegetable-based fats in rats [5]. Commonly used saturated fatty acid sources include hydrogenated coconut oil, corn oil, lard, palmitic acid, and stearic acid [6,7]. Unsaturated fats, such as oleic acid and linoleic acid, are also utilized in some nutritional animal models [8]. HFD, even when isocalorically matched with a standard purified control diet, induces obesity in rodents through alterations in metabolic homeostasis and reduced physical activity levels [9]. HFD-induced phenotypes of T2D in rodents and humans share weight gain, hyperglycemia, hyperinsulinemia, insulin resistance, inflammatory cytokine secretion, and ectopic lipid accumulation [10]. However, diet-induced animal models employ marked differences in micronutrient and macronutrient composition, including a variety of saturated fats, resulting in significant inter-study variability [11,12,13].
Despite these variables, the chronic consumption of a HFD by rodents alters a variety of genes and/or receptors involved in metabolism, inflammation, oxidative stress, substrate transport, protein synthesis and modification, and transcriptional regulation [6,7,14,15,16]. Notably, the modification of such genes is tissue-specific [6]. A better understanding of tissue specific effects in response to dietary composition will provide guidance into the most appropriate HFD-induced animal model(s) to study the pathogenesis of T2D and associated phenotypic changes.
Thorough review articles addressing the value and limitations of T2D animal models have been published [10,17,18]. Variable diet composition, rodent strain, intervention time-points, and duration of protocols further complicate the translatability of animal-based findings to the human disease state. Here, we summarize how the combination of percentage and type of fat with varying durations of intervention, affect the major insulin responsive tissues. These are important considerations to get closer to an animal model with high clinical relevance to the human disease.
2. Tissue-Specific Effects of HFD Models
2.1. Liver
Mice. The composition of saturated fatty acids in a HFD differentially affects adipose deposition within the liver and subsequently cellular and molecular signaling. Examples of saturated fats that adversely affect the liver of C57BL/6 male mice include corn oil, lard, and hydrogenated coconut oil (Table 1). The composition of HFD is responsible for the different effects in hepatic lipid storage. For example, a 45% HFD containing palm oil (high in saturated fat) or olive oil (low in saturated fat) increased hepatic triacylglycerol (TAG) content following an 8-week intervention in C57BL/6 mice [19]. In male and female C57BL/6 mice, 18 to 20 weeks of a 60% lard-based diet increased lipid accumulation and steatosis in the liver [20,21,22]. Other studies showed hepatic inflammation and fibrosis following only 8 weeks of a similar diet [23].
On a whole organism level, male and female mice developed insulin resistance and glucose intolerance in response to 45% [19] and 60% HFD [20,21,22]. However, the source of the fat must be considered [19] (Table 1).
Inflammatory responses and β-oxidation gene changes in mice have been reported, particularly as a result of a HFD containing more than 45% fat. Inflammatory responses are a known etiology of T2D development in rodents and humans [16,28]. However, establishing similarities between species is difficult when models vary in the percentage of fat, 59% to 82%, and duration, 12 to 36 weeks [6,29]. Eighteen to 20 weeks of a 60% lard-based diet increased cellular and biochemical markers of hepatic inflammation in male [20,21], but not female mice [22]. As the percentage of saturated fat increases, so does liver dysfunction. Interestingly an extremely HFD, 82% lard, caused hepatic lipid deposition accompanied by a transient increase in the expression of genes regulating fatty acid oxidation and synthesis after just 2 weeks [29]. By 4 weeks of consuming such a diet, gene expression patterns changed to reflect 2 to 4-fold increases adipogenesis (PPARγ and fatty acid binding protein) and lipid deposition (CD36) [29]. Not surprisingly, as the percentage of HFD increased, the inflammatory response followed the same trend. These studies suggest that excessive high fat content may cause a rapid transient pattern in hepatic fatty acid metabolism. Due to the rapid changes, it is plausible that many of the cellular and molecular events that alter hepatic lipid accumulation may be missed by studies focusing on prolonged consumption, especially when employing very high fat content. Due to the more progressive phenotype of lipid accumulation in human liver, such studies may contribute little to the understanding of the human phenotype.
Rats. Four weeks of a 45% lard-based diet caused hepatic steatosis, increased liver mass and increased hepatic TAG content in Wister rats [25] (Table 1). Changes in liver characteristics were accompanied by obesity and reduced insulin sensitivity, despite no evidence of hyperglycemia [25]. This more mild phenotype may be the result of a short diet intervention period and/or modest concentration of fat. In response to diets containing higher concentrations of SFA, a more severe phenotype emerges. Sprague–Dawley rats developed hepatic insulin resistance, fatty liver, inflammation, and necrosis following consumption of a 58% butter [27] or 65% lard-based diet [30]. Under both dietary conditions, a severer whole body T2D phenotype emerged [27,30] (Table 1).
The composition of fat within a diet may be just as important as the percentage and treatment duration. While a 45.5% HFD composed of SFA, monounsaturated fatty acids (MUFA), and polyunsaturated fatty acids (PUFA) did not cause an increase in body mass compared to control fed animals, liver mass and blood glucose were elevated after 15 weeks [31]. Such findings are similar to those reported in mice, such that higher concentrations of MUFA and PUFA mixtures produce a more mild phenotype [19] (Table 1).
2.2. Adipose
Mice. Insulin promotes lipogenesis in adipose tissue, reducing glycerol and fatty acid availability. Insulin resistant adipose tissue impairs glucose disposal and increases lipolysis, promoting fatty acid and glycerol availability for hepatic gluconeogenesis [32]. When unable to regulate hepatic glucose production properly, hyperglycemia coincides with lipid accumulation in adipose depots and peripheral tissues.
Saturated and unsaturated fat differentially effect the metabolic and immune responses in adipose tissue. A 45% HFD enriched with palmitic acid (SFA) induced adipose tissue hypertrophy, but a 45% HFD, enriched with oleic acid (MUFA), caused adipose tissue hyperplasia [33] (Table 2). Insulin sensitivity was improved, but not normalized, in mice fed monounsaturated fat [34]. Improved insulin sensitivity was partially a result of adipose-mediated inflammatory signaling. Adipose tissue macrophages secrete pro-inflammatory mediators, such as tumor necrosis factor-alpha (TNF-α), interleukin-6 (IL-6), and monocyte chemoattractant protein-1 (MCP-1), which correlate with adipocyte cell death [35] (Table 2). A 45% HFD enriched with saturated fats exacerbated the inflammatory response within adipose tissue, evidenced by increased TNF-α and IL-6 gene expression and reduced insulin sensitivity [36]. Furthermore, 31 weeks of a 42% HFD composed of SFA and MUFA caused white adipose tissue inflammation, reduced insulin signaling, and reduced the capacity for mitochondrial biogenesis and function in male mice [34]. However, when the fat source was based on mono or polyunsaturated fats, the inflammatory response was mitigated, and insulin responsiveness restored [36].
An HFD of 60% caused a more severe inflammatory response [35]. Progressive increases in adipocyte size were followed by cell death with increased fat pad weight through 20 weeks [35]. This phase of adipose tissue remolding was largely driven by macrophage infiltration [35] and may be associated with adipose hyperplasia to account for adipocyte death. Following as little as 1 week of a 60% lard-based HFD, pro-inflammatory macrophages (M1-like macrophages) were significantly increased and remained elevated through 7 weeks [37]. However, consumption of a 45% HFD for 12 weeks led to a similar phenotype [38] (Table 2).
Rats. Diets ranging from 45% to 62% fat caused adipocyte dysfunction and a T2D-like phenotype [41,43,44] (Table 2). Thirteen weeks of a 45% lard-based diet increased fat pad mass, adipocyte size and inflammation, but markers of T2D were not reported [41]. Diets of ~60% fat induced similar characteristics of adipose dysfunction with insulin and glucose intolerance, despite different fat sources [43,44]. Specifically, 62% mixed unsaturated fat caused significant adipose inflammation, accompanied by increased fasting glucose and homeostatic model assessment of insulin resistance (HOMA-IR) [44]. Diets composed of lower [41] and similar [43] percentages of fat from lard, reported comparable cellular and phenotypic changes in adipose. However, the duration of HFD consumption varied greatly in such studies, making it difficult to distinguish the importance of the fat concentration or source, from the duration of consumption (Table 2).
Changes in adipose integrity are influenced by sex, supporting the necessity for inclusion of female subjects. Following 11 weeks of a 57% HFD, only male rats developed oxidative stress and inflammation in subcutaneous adipose [42]. In female rats, increased subcutaneous and retroperitoneal fat mass was not associated with increased inflammatory cytokines or evidence of immune cell accumulation [42]. Notably, the source of fat and markers of T2D were not reported. However, in female mice, a similar diet increased adiposity without a change in glucose tolerance [40].
2.3. Pancreas
Mice. The pancreas serves as a critical regulator of insulin and glucose homeostasis. Under low energy availability, glucagon could stimulate hepatic glucose production, while under energy surplus, insulin could facilitate glucose uptake. A better understanding of how different dietary models affect the pancreas will facilitate the development of a model that aligns with alterations in pancreatic function in the progression of human T2D.
Six weeks of a 45% lard-based diet increased β-cell proliferation and mass, in the splenic region, contributing to the onset of insulin resistance in C57BL/6 male mice [45]. Following 12 weeks of the same diet, β-cell expression of adipose differentiation-related protein (ADFP) was increased, and pancreatic lipid accumulation was evident [46]. As a result, mice were hyperglycemic and hyperinsulinic. Human pancreatic β-cells treated with fatty acids showed a similar trend in ADFP expression [46].
In response to a 60% lard-based diet, reduced glucose tolerance and hyperinsulinemia were evident within 1 week, but insulin resistance did not manifest until 11 weeks [47]. At the onset, pancreatic cells compensated for increased glucose levels by doubling insulin secretion (detectable within 2 weeks), but insulin secretion became significantly impaired as insulin resistance developed and β-cell mass continued to increase [47]. Genes associated with hyperinsulinemia and β-cell proliferation were significantly elevated by week 8, which was 3 weeks prior to measurable insulin resistance [47]. More recently, a 60% HFD for 8 weeks, caused obesity, hyperglycemia, hyperlipidemia, and pancreatic β-cell hypertrophy in C57BL/6 mice [48] (Table 3). Metabolic profiling revealed that global metabolite changes of bioactive lipids associated with β-cell expansion and β-cell proliferation increased 1.75-fold [49].
Rats. Pancreatic inflammation in 60% HFD fed male Sprague–Dawley rats was associated with pancreatic atrophy, hyperinsulinemia, hyperglycemia, increased HOMA-IR, and pancreatic triglyceride (TG) accumulation following 24 weeks [50]. A similar dietary composition (66% fat), increased β-cell autophagy and glucagon production after 16 weeks [51] (Table 3). Elevated glucagon production is likely the cause for hyperglycemia reported at 16 weeks and at later time points in other studies [51,52]. However, 46% HFD for 12 weeks reduced glucose tolerance, indicating progression of the diabetic phenotype with a lower fat load [53]. Taken together, 46% and 66% HFD elicit β and α cell expansion, hyperinsulinemia, and reduced glucose tolerance [51,53]. Importantly, the source of fat in the aforementioned studies was not reported. Nonetheless, these similarities suggest that a fat content closer to a Western-based diet provides a sufficient stimulus to study HFD-induced pancreatic dysfunction.
Identifying the concentration and composition that best relates to pancreatic alterations in the human T2D population should be the priority, rather than adjusting the percentage of fat for the greatest tissue insult. Indeed, species-specific differences exist, such as primarily β-cell proliferation in rodents and β-cell apoptosis in humans prior to insulin resistance [49,54]. Therefore, if the pancreas is the tissue of interest, it may be beneficial to combine a moderate HFD model with low dose streptozotocin to reduce β-cell mass and allow for insulin levels to decline throughout T2D progression [55].
2.4. Brain
Mice. Chronic consumption of a HFD significantly impairs cognitive function by altering neuronal activity in the hippocampus of humans and rodents [57,58,59]. Altered hippocampal function is likely a result of chronic inflammation associated with obesity, with more severe outcomes from saturated fatty acids [59,60,61]. Furthermore, peripheral insulin and glucose homeostasis is largely regulated by hypothalamic insulin responsiveness [62]. Therefore, HFD-induced neuroinflammation, mitochondrial dysfunction, cognitive impairment, and whole-body glucose and insulin resistance highlight the brain as a critical organ in the pathogenesis of the T2D phenotype.
Lard-based diets of 45% and 60% increased the microglial and astrocyte activity in the hypothalamus, the primary regulatory region of energy balance [63,64]. Furthermore, both fat concentrations caused hyperinsulinemia, hyperglycemia, and reduced glucose tolerance, though this was more severe in response to 60% fat [63] (Table 4). Only the 60% HFD altered the hypothalamic, hippocampal, and cortex metabolite profile, showing a shift in cellular energy and metabolism. Similar metabolic dysfunction was reported following 4 weeks of HFD, accompanied by reduced insulin signaling in hypothalamic and hippocampal neurons [65] (Table 4). HFD also induces changes in the neuropeptide milieu to account for high nutrient density. In response to 60% HFD, the population of anorexigenic proopiomelanocortin (POMC) increased [64], and the expression of orexigenic neuropeptide-Y (NPY) decreased [66] (Table 4).
Rats. Impaired hypothalamic insulin signaling occurred following just three days of a low saturated fat diet (10% lard) in male Sprague–Dawley rats [67] (Table 4). The ability for hypothalamic insulin signaling to suppress white adipose lipolysis and hepatic glucose production was significantly impaired. Such hypothalamic insulin resistance was likely the cause of acute increases in plasma free fatty acids [67]. Diets slightly higher in saturated fats (20%) impaired learning and memory function when compared to standard diet (~4.5% fat) and diets higher in polyunsaturated fat (soybean oil) [70]. Following 18 weeks of a 39% HFD, Wistar rats developed glucose intolerance and increased body weight without hyperglycemia, hyperinsulinemia, or insulin resistance [71]. These rats displayed distinct neurometabolic alterations in the hippocampus and caudate-putamen, including glutamine and N-acetlylaspartate (NAA), two prominent amino acids in the brain that play a role in energy metabolism via lipid turnover and the citric acid cycle [52,71,72]. These data do contradict previous studies that showed no alterations in hippocampus metabolic profiles, particularly in genetically modified obese rats [73]. Male Wistar–Han rats fed a 40% HFD for 20 weeks demonstrated reductions in glucose tolerance in both plasma and cerebrospinal fluid following glucose challenge, suggesting that HFD induced changes in both central and peripheral glucose tolerance [68] (Table 4).
Six months of a 60% lard and soybean oil-based HFD impaired insulin-mediated microvascular perfusion and hippocampal cognitive function in Sprague–Dawley rats [74]. A similar response was reported in C57BL/6J mice [63,66,75].
Collectively, the literature supports moderate (45%) and high (60%) saturated fat concentrations as perturbing central and peripheral glucose and insulin sensitivity. While a 60% diet produces a more severe phenotype [63], we must consider whether the increased severity in a rodent model recapitulates the pathogenesis of T2D in humans. A 45% HFD, more in line with a Western-based diet, produces similar central and peripheral metabolic dysfunction, and may align more with the progressive development of human T2D.
2.5. Skeletal Muscle
Mice. Chronic HFD consumption results in intramyocellular lipid storage in skeletal muscle, one of the largest contributors to glucose disposal in the body [24,74,76]. Excess intramyocellular lipid storage, particularly in sedentary populations promotes DAG accretion, protein kinase C activity, AMP-activated protein kinase (AMPK) inhibition, and attenuated glucose uptake [77,78]. The amount of saturated fatty acid in HFD differentially effects lipid deposition within skeletal muscle, potentially promoting differences in metabolism and oxidative capacity.
When consumed for 8 weeks, a 45% cocoa butter (saturated fat), olive oil (monounsaturated fat), or palm oil (a combination of fats), but not safflower oil (polyunsaturated fat)-based HFD, increased TAG and DAG content in skeletal muscle of C57BL/6J mice [19] (Table 5). All cohorts, except the 45% olive oil, demonstrated similar reductions in systemic glucose clearance, despite no changes in insulin-glucose transporter type 4 (GLUT4) expression [19]. β-oxidative remained unchanged, suggesting lipid accumulation occurred without a compensatory increase in oxidation [19].
One week of a 60% lard-based HFD reduced carbohydrate metabolism within skeletal muscle without insulin resistance [49]. When consumed for 15 to 20 weeks, a 60% lard-based diet causes significant dysfunction within skeletal muscle [6,14,30]. Such a diet caused skeletal muscle lipid accumulation, increased fasting glucose levels, and increased peroxisome proliferator-activated receptor gramma coactivator 1alpha (PGC-1α) protein expression [24]. Elevated PGC-1α expression is a characteristic of lipid accumulation in human muscle cells [79]. Furthermore, 191 skeletal muscle genes were altered following 20 weeks of the 60% lard-based HFD, favoring adipogenesis [6]. In agreement, 8 weeks of a similar diet reduced fatty acid oxidation and mitochondrial function [80] (Table 5). In human skeletal muscle, ectopic lipid accumulation, led to insulin resistance [81,82], similarly to that observed in rodent studies [19,24,83]. Subcellular localization of DAG in human skeletal muscle suggests that mitochondrial DAG is elevated in individuals with low insulin sensitivity and may be contributing to alterations in mitochondrial function [84].
Female mice are seldom studied in metabolic research; however, it is naive to assume that male and female rodents respond similarly to HFD models. A 58% coconut oil-based diet caused obesity only in male mice [85]. While muscle insulin sensitivity was reduced in both sexes, only males showed reduced whole-body glucose and insulin tolerance [85] (Table 5).
Rats. Within a short exposure to 60% HFD, skeletal muscle metabolism and function are altered. These effects are fiber-type specific with increased lipid accumulation in type I and II intermediate fibers and reduced insulin-stimulated glucose uptake in a spectrum of type II fibers [88,89,90,91] (Table 5). Increased lipid accumulation in the soleus is associated with increase inflammatory signaling, evidenced by changes in IL-6 mRNA, and decreased control of oxidative stress [88].
A moderate 45% HFD also increased soleus lipid accumulation, as determined after 15 weeks [87]. Lipid accumulation was supported by increases in plasma membrane fatty acid binding protein (FABPpm), fatty acid transporter protein 1 (FATP1), fatty acid transporter protein 4 (FATP4), and CD36 [87] (Table 5). This diet was also associated with significant changes in whole-body insulin and glucose homeostasis. Hyperglycemia, hyperinsulinemia, and increased HOMA-IR were evident by 8 weeks of dietary consumption and persisted for 15 weeks [87]. Therefore, these data support the suitability of a macronutrient composition more closely aligned to a Western-based diet for studying the effects of HFD on skeletal muscle metabolism.
3. Choosing the Most Appropriate Model
As the percentage of fat in a diet increases, the metabolic changes become more significant, demonstrated by a 60% HFD animal model decreasing glucose sensitivity more rapidly (within one week) than a 45% HFD [92]. Furthermore, using a fat percentage that is 1.7-fold greater than a typical Western diet (~35% HFD) may induce pathology that is not characteristic of the T2D-like phenotype found in humans. Challenges with data interpretation and translatability to human studies include animal strain-specific responses, dietary variation, and the metabolic differences between humans and murine models [93]. A rodent’s heart rate ranges from 350–550 beats·min−1, but a human’s resting heart is approximately 70 beats·min−1 [93]. A mouse’s basal metabolic rate is ~7.5-fold greater than a human’s, suggesting the metabolic demand on a mouse is significantly greater [94]. Hepatic glycogen storage in a mouse is depleted every 16–24 h, and gluconeogenesis provides the majority of endogenous glucose, demonstrated by over 80% of glucose supplied via gluconeogenesis following a 4-h fasting period [94,95]. In contrast, humans utilize hepatic glycogen at approximately half that rate, even after an overnight (~12 h) fasting period [94]. Due to the faster depletion of glycogen stores and increased metabolic rate, mice consumed food and water more frequently throughout a 24-h period than humans. On average, mice consumed ~4.5 g food across 36 feedings and ~5.8 mL of water across 32 drinking times per day [96]. Feeding habit variability between rodents and humans may also contribute to dissimilarities in metabolism. As nocturnal animals, rodents consume the majority of their food in the evenings, but humans primarily eat during the day [97]. Further complicating this comparison is the treatment of rodents as diurnal rather than using a reverse light cycle to create a more natural rodent living environment. Circadian clocks are involved in many biological processes, including glucose metabolism and insulin secretion, particularly within pancreatic β-cells [98,99,100]. Disruptions in circadian rhythms could alter disease pathology or data interpretation, making translatability further challenging. Obesity and insulin resistance induced by a 60% high-fat diet caused alterations in circadian rhythm patterns in the hypothalamus [101]. Exogenous dopamine administration during appropriate peaks of circadian rhythm stimulated a physiological response mirroring a non-obese and an insulin sensitive rodent [101].
The full etiology of T2D cannot be accurately assessed and entirely translated to clinical practice because rodents experience β-cell proliferation or increased β-cell mass, rather than the loss of β-cell mass or β-cell failure [54]. To most effectively translate findings to the human population, an optimal animal model or a combination of a few select models may be most appropriate. Although the Western diet is known for excess fats, carbohydrates, and sugars, a longitudinal study over 17 years concluded that less than 35% of the average adult’s diet actually comes from fats [102]. According to the National Health and Nutrition Examination Survey, the mean dietary intake for adults (≥20 years) is composed of ~16% protein, ~47% carbohydrates, and ~35% fat. Nearly one-third of the total fat intake is saturated fat, demonstrating that there is a combination of fat sources in the typical Western diet. This data suggests that including a variety of fat sources (saturated, monounsaturated and polyunsaturated fats) would more accurately mimic the diet macronutrient composition seen in the average population. Based on this literature review, a 45% HFD with a combination of fat sources (monounsaturated, polyunsaturated, and saturated fats) induces pathological changes in rodents that closely resembles the T2D-like phenotype etiology in human populations. For example, adipose tissue becomes inflamed with a 45% high-fat model, but adipose tissue undergoes severe inflammation, remodulation, and adipocytosis following a 60% high-fat diet [35,103]. Commonly used 60% HFDs also contain more than nine times the amount of saturated fat (lard) when compared to unsaturated fat (soybean oil), suggesting that there are fat composition variables that need continued refinement to improve mirroring the human diet composition and translatability to target populations. Based on the literature reviewed here, we propose a 45% HFD composed of one-third saturated fats and two-thirds unsaturated fat closely aligns with the typical human Western diet and disease progression (Figure 1). Utilizing such a composition may provide better alignment between rodent and human T2D phenotypes and more inter-study agreement.
It is important to acknowledge limitations to this review. While we attempted to use an un-biased review of the literature that used non-genetically altered rodents, we were not able to include all relevant publications. Those chosen provided sufficient methodological detail regarding dietary composition, intervention duration, and comprehensive sets of data. Moreover, only studies that compared HFD to a standard diet groups were included. Those in which the HFD served as the control against a pharmacological treatment were excluded. Mouse studies were focused on the C57BL/6 background because it is the most common. However, because the inclusion for female mice was rare, we included studies that investigated sexual dimorphism using other strains. Sprague–Dawley and Wister strains were targeted for rat studies because of their predominance in the literature. We attempted to narrow our literature to the last 5 years, particularly for studies included in the tables; however, in some cases we had to expand our search to accommodate for our inclusion criteria. Furthermore, this review focuses exclusively on HFD composition and concentration. Other dietary concerns, such as sugar, cholesterol, fiber, vitamin, and mineral composition and their combination with pharmacological strategies should be considered but are beyond the scope of this review. Additionally, numerous transgenic models exist, such as Ob/Ob, db/db, and KKAy, which cause metabolic dysfunction. Likewise, genetic models alone and in combination with dietary and pharmacological intervention are commonly used, particularly in the study of central insulin and glucose homeostasis. Lastly, animal models often include one gender, typically males, to avoid complications with the estrous cycle in female rodents, but diet-induced animal models can exhibit sexual dimorphisms [104]. Future studies should make every effort to include male and female rodents to comprehensively enhance our understanding of HFD models of T2D and associated phenotypes.
Author Contributions
Conceptualization, N.L.S. and J.S.M.; writing—original draft preparation, N.L.S. and J.S.M.; writing—review and editing, J.S.M. All authors have read and agreed to the published version of the manuscript.
Funding
This research received no external funding.
Acknowledgments
The authors would like to thank the Laboratory of Systems Physiology group for their support and feedback during the writing of this manuscript.
Conflicts of Interest
The authors have nothing to disclose.
References
- Agriculture, USA. 2015–2020 Dietary Guidelines for Americans; U.S. Department of Health and Human Services and U.S. Department of Agriculture: Washington, DC, USA, 2015; pp. 1–144.
- Mazidi, M.; Kengne, A.-P.; Mikhailidis, D.P.; Toth, P.P.; Ray, K.K.; Banach, M. Dietary food patterns and glucose/insulin homeostasis: A cross-sectional study involving 24,182 adult Americans. Lipids Health Dis. 2017, 16, 192. [Google Scholar] [CrossRef] [Green Version]
- Hariri, N.; Gougeon, R.; Thibault, L. A highly saturated fat-rich diet is more obesogenic than diets with lower saturated fat content. Nutr. Res. 2010, 30, 632–643. [Google Scholar] [CrossRef]
- Licholai, J.A.; Nguyen, K.P.; Fobbs, W.C.; Schuster, C.J.; Ali, M.A.; Kravitz, A.V. Why Do Mice Overeat High-Fat Diets? How High-Fat Diet Alters the Regulation of Daily Caloric Intake in Mice. Obesity (Silver Spring) 2018, 26, 1026–1033. [Google Scholar] [CrossRef] [Green Version]
- Kubant, R.; Poon, A.N.; Sanchezhernandez, D.; Domenichiello, A.F.; Huot, P.S.P.; Pannia, E.; Cho, C.E.; Hunschede, S.; Bazinet, R.P.; Anderson, G.H. A comparison of effects of lard and hydrogenated vegetable shortening on the development of high-fat diet-induced obesity in rats. Nutr. Diabetes 2015, 5, e188. [Google Scholar] [CrossRef]
- Lee, R.K.; Hittel, D.S.; Nyamandi, V.Z.; Kang, L.; Soh, J.; Sensen, C.W.; Shearer, J. Unconventional microarray design reveals the response to obesity is largely tissue specific: Analysis of common and divergent responses to diet-induced obesity in insulin-sensitive tissues. Appl. Physiol. Nutr. Metab. 2012, 37, 257–268. [Google Scholar] [CrossRef]
- De Fourmestraux, V.; Neubauer, H.; Poussin, C.; Farmer, P.; Falquet, L.; Burcelin, R.; Delorenzi, M.; Thorens, B. Transcript Profiling Suggests That Differential Metabolic Adaptation of Mice to a High Fat Diet Is Associated with Changes in Liver to Muscle Lipid Fluxes. J. Biol. Chem. 2004, 279, 50743–50753. [Google Scholar] [CrossRef] [Green Version]
- Tajima, K.; Shirakawa, J.; Okuyama, T.; Kyohara, M.; Yamazaki, S.; Togashi, Y.; Terauchi, Y. Effects of metformin on compensatory pancreatic β-cell hyperplasia in mice fed a high-fat diet. Am. J. Physiol. Endocrinol. Metab. 2017, 313, E367–E380. [Google Scholar] [CrossRef] [Green Version]
- Moretto, T.L.; Benfato, I.D.; De Carvalho, F.P.; Barthichoto, M.; Le Sueur-Maluf, L.; De Oliveira, C.A.M. The effects of calorie-matched high-fat diet consumption on spontaneous physical activity and development of obesity. Life Sci. 2017, 179, 30–36. [Google Scholar] [CrossRef]
- Kleinert, M.; Clemmensen, C.; Hofmann, S.M.; Moore, M.C.; Renner, S.; Woods, S.C.; Huypens, P.; Beckers, J.; De Angelis, M.H.; Schürmann, A.; et al. Animal models of obesity and diabetes mellitus. Nat. Rev. Endocrinol. 2018, 14, 140–162. [Google Scholar] [CrossRef] [Green Version]
- Islam, S.; Wilson, R.D. Experimentally Induced Rodent Models of Type 2 Diabetes. Animal Models Diabetes Res. 2012, 933, 161–174. [Google Scholar] [CrossRef]
- Kanuri, G.; Bergheim, I. In Vitro and in Vivo Models of Non-Alcoholic Fatty Liver Disease (NAFLD). Int. J. Mol. Sci. 2013, 14, 11963–11980. [Google Scholar] [CrossRef] [Green Version]
- Warden, C.H.; Fisler, J.S. Comparisons of Diets Used in Animal Models of High-Fat Feeding. Cell Metab. 2008, 7, 277. [Google Scholar] [CrossRef] [Green Version]
- Bullen, J.W.; Bluher, S.; Kelesidis, T.; Mantzoros, C.S. Regulation of adiponectin and its receptors in response to development of diet-induced obesity in mice. Am. J. Physiol. Endocrinol. Metab. 2007, 292, E1079–E1086. [Google Scholar] [CrossRef]
- Kim, S.; Sohn, I.; Ahn, J.-I.; Lee, K.-H.; Lee, Y.S.; Lee, Y.S. Hepatic gene expression profiles in a long-term high-fat diet-induced obesity mouse model. Gene 2004, 340, 99–109. [Google Scholar] [CrossRef]
- Flanagan, A.M.; Brown, J.L.; Santiago, C.A.; Aad, P.Y.; Spicer, L.J.; Spicer, M.T. High-fat diets promote insulin resistance through cytokine gene expression in growing female rats. J. Nutr. Biochem. 2008, 19, 505–513. [Google Scholar] [CrossRef]
- Xavier, G.D.S.; Hodson, D.J. Mouse models of peripheral metabolic disease. Best Pr. Res. Clin. Endocrinol. Metab. 2018, 32, 299–315. [Google Scholar] [CrossRef]
- Hintze, K.J.; Benninghoff, A.D.; Cho, C.E.; Ward, R.E. Modeling the Western Diet for Preclinical Investigations. Adv. Nutr. 2018, 9, 263–271. [Google Scholar] [CrossRef] [Green Version]
- Timmers, S.; Bosch, J.D.V.-V.D.; De Wit, N.; Schaart, G.; Van Beurden, D.; Hesselink, M.K.C.; Van Der Meer, R.; Schrauwen, P. Differential effects of saturated versus unsaturated dietary fatty acids on weight gain and myocellular lipid profiles in mice. Nutr. Diabetes 2011, 1, e11. [Google Scholar] [CrossRef] [Green Version]
- An, X.; Liu, J.; Li, Y.; Dou, Z.; Li, N.; Suo, Y.; Ma, Y.; Sun, M.; Tian, Z.; Xu, L. Chemerin/CMKLR1 ameliorates nonalcoholic steatohepatitis by promoting autophagy and alleviating oxidative stress through the JAK2-STAT3 pathway. Peptides 2020, 135, 170422. [Google Scholar] [CrossRef]
- Lu, Z.; Li, Y.; Syn, W.-K.; Li, A.-J.; Ritter, S.; Wank, S.A.; Lopes-Virella, M.F.; Huang, Y. GPR40-Deficiency Is Associated with Hepatic FAT/CD36 Upregulation, Steatosis, Inflammation and Cell Injury in C57BL/6 Mice. Am. J. Physiol. Endocrinol. Metab. 2020. [Google Scholar] [CrossRef]
- Sardi, C.; Martini, E.; Mello, T.; Camelliti, S.; Sfondrini, L.; Marcucci, F.; Kallikourdis, M.; Sommariva, M.; Rumio, C. Effect of acetylsalicylic acid on inflamed adipose tissue. Insulin resistance and hepatic steatosis in a mouse model of diet-induced obesity. Life Sci. 2020, 118618. [Google Scholar] [CrossRef]
- Shen, H.H.; Alex, R.; Bellner, L.; Raffaele, M.; Licari, M.; Vanella, L.; Stec, D.E.; Abraham, N.G. Milk thistle seed cold press oil attenuates markers of the metabolic syndrome in a mouse model of dietary-induced obesity. J. Food Biochem. 2020, e13522. [Google Scholar] [CrossRef] [PubMed]
- Peck, B.; Huot, J.; Renzi, T.; Arthur, S.; Turner, M.J.; Marino, J.S. Mice Lacking PKCtheta in Skeletal Muscle Have Reduced Intramyocellular Lipid Accumulation and Increased Insulin Responsiveness in Skeletal Muscle. Am. J. Physiol. Regul. Integr. Comp. Physiol. 2017, 314, 468–477. [Google Scholar] [CrossRef] [Green Version]
- Bezan, P.; Holland, H.; De Castro, G.S.; Cardoso, J.; Ovidio, P.; Calder, P.C.; Jordão, A. High Dose of A Conjugated Linoleic Acid Mixture Increases Insulin Resistance in Rats Fed Either A Low Fat or A High Fat Diet. Exp. Clin. Endocrinol. Diabetes 2018, 126, 379–386. [Google Scholar] [CrossRef] [Green Version]
- Baek, K.-W.; Gim, J.-A.; Park, J.-J. Regular moderate aerobic exercise improves high-fat diet-induced nonalcoholic fatty liver disease via monoacylglycerol O-acyltransferase 1 pathway suppression. J. Sport Health Sci. 2020, 9, 472–478. [Google Scholar] [CrossRef]
- Abdulmalek, S.A.; Fessal, M.; El-Sayed, M. Effective amelioration of hepatic inflammation and insulin response in high fat diet-fed rats via regulating AKT/mTOR signaling: Role of Lepidium sativum seed extracts. J. Ethnopharmacol. 2021, 266, 113439. [Google Scholar] [CrossRef] [PubMed]
- Saltiel, A.R.; Olefsky, J.M. Inflammatory mechanisms linking obesity and metabolic disease. J. Clin. Investig. 2017, 127, 1–4. [Google Scholar] [CrossRef]
- Inoue, M.; Ohtake, T.; Motomura, W.; Takahashi, N.; Hosoki, Y.; Miyoshi, S.; Suzuki, Y.; Saito, H.; Kohgo, Y.; Okumura, T. Increased expression of PPARgamma in high fat diet-induced liver steatosis in mice. Biochem. Biophys. Res. Commun. 2005, 336, 215–222. [Google Scholar] [CrossRef] [Green Version]
- Wikan, N.; Tocharus, J.; Sivasinprasasn, S.; Kongkaew, A.; Chaichompoo, W.; Suksamrarn, A.; Tocharus, C. Capsaicinoid nonivamide improves nonalcoholic fatty liver disease in rats fed a high-fat diet. J. Pharmacol. Sci. 2020, 143, 188–198. [Google Scholar] [CrossRef]
- Ramalho, L.; Da Jornada, M.N.; Antunes, L.D.C.; Hidalgo, M.P.L. Metabolic disturbances due to a high-fat diet in a non-insulin-resistant animal model. Nutr. Diabetes 2017, 7, e245. [Google Scholar] [CrossRef] [Green Version]
- Erion, D.M.; Park, H.-J.; Lee, H.-Y. The role of lipids in the pathogenesis and treatment of type 2 diabetes and associated co-morbidities. BMB Rep. 2016, 49, 139–148. [Google Scholar] [CrossRef] [PubMed] [Green Version]
- Finucane, O.M.; Lyons, C.L.; Murphy, A.M.; Reynolds, C.M.; Klinger, R.; Healy, N.P.; Cooke, A.A.; Coll, R.C.; McAllan, L.; Nilaweera, K.N.; et al. Monounsaturated Fatty Acid–Enriched High-Fat Diets Impede Adipose NLRP3 Inflammasome–Mediated IL-1β Secretion and Insulin Resistance Despite Obesity. Diabetes 2015, 64, 2116–2128. [Google Scholar] [CrossRef] [PubMed] [Green Version]
- Shen, H.H.; Peterson, S.J.; Bellner, L.; Choudhary, A.; Levy, L.; Gancz, L.; Sasson, A.; Trainer, J.; Rezzani, R.; Resnick, A.; et al. Cold-Pressed Nigella Sativa Oil Standardized to 3% Thymoquinone Potentiates Omega-3 Protection against Obesity-Induced Oxidative Stress, Inflammation, and Markers of Insulin Resistance Accompanied with Conversion of White to Beige Fat in Mice. Antioxidants 2020, 9, 489. [Google Scholar] [CrossRef]
- Strissel, K.J.; Stancheva, Z.; Miyoshi, H.; Perfield, J.W.; DeFuria, J.; Jick, Z.; Greenberg, A.S.; Obin, M.S. Adipocyte death, adipose tissue remodeling, and obesity complications. Diabetes 2007, 56, 2910–2918. [Google Scholar] [CrossRef] [PubMed] [Green Version]
- Lyons, C.L.; Kennedy, E.B.; Roche, H.M. Metabolic Inflammation-Differential Modulation by Dietary Constituents. Nutrition 2016, 8, 247. [Google Scholar] [CrossRef] [PubMed]
- Liu, Y.; Lu, X.; Li, X.; Du, P.; Qin, G. High-fat diet triggers obesity-related early infiltration of macrophages into adipose tissue and transient reduction of blood monocyte count. Mol. Immunol. 2020, 117, 139–146. [Google Scholar] [CrossRef] [PubMed]
- Hu, Q.; Lu, Y.; Hu, F.; He, S.; Xu, X.; Niu, Y.; Zhang, H.; Li, X.; Su, Q. Resistant dextrin reduces obesity and attenuates adipose tissue inflammation in high-fat diet-fed mice. Int. J. Med Sci. 2020, 17, 2611–2621. [Google Scholar] [CrossRef]
- Eom, J.; Thomas, S.S.; Sung, N.-Y.; Kim, D.-S.; Cha, Y.-S.; Kim, K.-A. Abeliophyllum distichum Ameliorates High-Fat Diet-Induced Obesity in C57BL/6J Mice by Upregulating the AMPK Pathway. Nutrients 2020, 12, 3320. [Google Scholar] [CrossRef]
- Liang, H.; Jiang, F.; Cheng, R.; Luo, Y.; Wang, J.; Luo, Z.; Li, M.; Shen, X.; He, F. A high-fat diet and high-fat and high-cholesterol diet may affect glucose and lipid metabolism differentially through gut microbiota in mice. Exp. Anim. 2020, 20. [Google Scholar] [CrossRef]
- Kim, S.-Y.; Lee, M.-S.; Chang, E.; Jung, S.; Ko, H.; Lee, E.; Lee, S.; Kim, C.-T.; Kim, I.-H.; Kim, Y. Tartary Buckwheat Extract Attenuated the Obesity-Induced Inflammation and Increased Muscle PGC-1a/SIRT1 Expression in High Fat Diet-Induced Obese Rats. Nutrition 2019, 11, 654. [Google Scholar] [CrossRef] [Green Version]
- Vasconcelos, R.P.; Peixoto, M.S.; De Oliveira, K.A.; Ferreira, A.C.F.; Coelho-De-Souza, A.N.; Carvalho, D.P.; De Oliveira, A.C.; Fortunato, R.S. Sex differences in subcutaneous adipose tissue redox homeostasis and inflammation markers in control and high-fat diet fed rats. Appl. Physiol. Nutr. Metab. 2019, 44, 720–726. [Google Scholar] [CrossRef] [PubMed]
- Grycel, S.; Markowski, A.R.; Hady, H.R.; Zabielski, P.; Kojta, I.; Imierska, M.; Górski, J.; Błachnio-Zabielska, A. Metformin treatment affects adipocytokine secretion and lipid composition in adipose tissues of diet-induced insulin-resistant rats. Nutrition 2019, 63, 126–133. [Google Scholar] [CrossRef] [PubMed]
- Kolahdouzi, S.; Talebi-Garakani, E.; Hamidian, G.; Safarzade, A. Exercise training prevents high-fat diet-induced adipose tissue remodeling by promoting capillary density and macrophage polarization. Life Sci. 2019, 220, 32–43. [Google Scholar] [CrossRef]
- Ellenbroek, J.H.; Töns, H.A.; De Graaf, N.; Loomans, C.J.; Engelse, M.A.; Vrolijk, H.; Voshol, P.J.; Rabelink, T.J.; Carlotti, F.; De Koning, E.J.P. Topologically Heterogeneous Beta Cell Adaptation in Response to High-Fat Diet in Mice. PLoS ONE 2013, 8, e56922. [Google Scholar] [CrossRef] [Green Version]
- Faleck, D.M.; Ali, K.; Roat, R.; Graham, M.J.; Crooke, R.M.; Battisti, R.; Garcia, E.; Ahima, R.S.; Imai, Y. Adipose differentiation-related protein regulates lipids and insulin in pancreatic islets. Am. J. Physiol. Endocrinol. Metab. 2010, 299, E249–E257. [Google Scholar] [CrossRef] [PubMed] [Green Version]
- Gupta, D.; Jetton, T.L.; LaRock, K.; Monga, N.; Satish, B.; Lausier, J.; Peshavaria, M.; Leahy, J.L. Temporal characterization of beta cell-adaptive and -maladaptive mechanisms during chronic high-fat feeding in C57BL/6NTac mice. J. Biol. Chem. 2017, 292, 12449–12459. [Google Scholar] [CrossRef] [Green Version]
- Li, H.; Park, H.-M.; Ji, H.-S.; Han, J.; Kim, S.K.; Park, H.-Y.; Jeong, T.-S. Phenolic-enriched blueberry-leaf extract attenuates glucose homeostasis, pancreatic β-cell function, and insulin sensitivity in high-fat diet–induced diabetic mice. Nutr. Res. 2020, 73, 83–96. [Google Scholar] [CrossRef]
- Seferovic, M.D.; Beamish, C.A.; Mosser, R.E.; Townsend, S.; Pappan, K.; Poitout, V.; Aagaard, K.M.; Gannon, M.A. Increases in bioactive lipids accompany early metabolic changes associated with β-cell expansion in response to short-term high-fat diet. Am. J. Physiol. Endocrinol. Metab. 2018, 315, E1251–E1263. [Google Scholar] [CrossRef]
- Ye, T.; Chen, Y.-H.; Gao, J.-H.; Wang, X.-X.; Qiang, O.; Tang, C.-W.; Liu, R. Effect of octreotide on pancreatic fibrosis in rats with high-fat diet-induced obesity. Int. J. Clin. Exp. Pathol. 2018, 11, 4784–4794. [Google Scholar] [CrossRef]
- Sun, Q.; Nie, S.; Wang, L.; Yang, F.; Meng, Z.; Xiao, H.; Xiang, B.; Li, X.; Fu, X.; Wang, S. Factors that Affect Pancreatic Islet Cell Autophagy in Adult Rats: Evaluation of a Calorie-Restricted Diet and a High-Fat Diet. PLoS ONE 2016, 11, e0151104. [Google Scholar] [CrossRef] [Green Version]
- Teleman, A. Faculty Opinions recommendation of Glutamine oxidation maintains the TCA cycle and cell survival during impaired mitochondrial pyruvate transport. Fac. Opin. 2015, 56, 414–424. [Google Scholar] [CrossRef] [Green Version]
- Abdel-Hamid, A.A.M.; Firgany, A.E.-D.L. Correlation between pancreatic mast cells and the low grade inflammation in adipose tissue of experimental prediabetes. Acta Histochem. 2019, 121, 35–42. [Google Scholar] [CrossRef] [PubMed]
- Butler, A.E.; Janson, J.; Bonner-Weir, S.; Ritzel, R.A.; Rizza, R.A.; Butler, P.C. Cell Deficit and Increased -Cell Apoptosis in Humans With Type 2 Diabetes. Diabetes 2003, 52, 102–110. [Google Scholar] [CrossRef] [PubMed] [Green Version]
- Parilla, J.H.; Willard, J.R.; Barrow, B.M.; Zraika, S. A Mouse Model of Beta-Cell Dysfunction as Seen in Human Type 2 Diabetes. J. Diabetes Res. 2018, 2018, 6106051. [Google Scholar] [CrossRef] [Green Version]
- Lu, B.; Wu, H.; Gu, P.; Du, H.; Shao, J.; Wang, J.; Zou, D. Improved glucose-stimulated insulin secretion by intra-islet inhibition of protein-tyrosine phosphatase 1B expression in rats fed a high-fat diet. J. Endocrinol. Investig. 2011, 35, 63–70. [Google Scholar]
- Cordner, Z.A.; Tamashiro, K.L. Effects of high-fat diet exposure on learning & memory. Physiol. Behav. 2015, 152 Pt B, 363–371. [Google Scholar] [CrossRef] [Green Version]
- Kanoski, S.E.; Davidson, T.L. Western diet consumption and cognitive impairment: Links to hippocampal dysfunction and obesity. Physiol. Behav. 2011, 103, 59–68. [Google Scholar] [CrossRef] [Green Version]
- Beilharz, J.E.; Maniam, J.; Morris, M.J. Diet-Induced Cognitive Deficits: The Role of Fat and Sugar, Potential Mechanisms and Nutritional Interventions. Nutrients 2015, 7, 6719–6738. [Google Scholar] [CrossRef] [Green Version]
- Chesnokova, V.; Pechnick, R.N.; Wawrowsky, K. Chronic peripheral inflammation, hippocampal neurogenesis, and behavior. Brain Behav. Immun. 2016, 58, 1–8. [Google Scholar] [CrossRef] [Green Version]
- Kowiański, P.; Lietzau, G.; Czuba, E.; Waśkow, M.; Steliga, A.; Moryś, J. BDNF: A Key Factor with Multipotent Impact on Brain Signaling and Synaptic Plasticity. Cell. Mol. Neurobiol. 2018, 38, 579–593. [Google Scholar] [CrossRef]
- Marino, J.S.; Xu, Y.; Hill, J.W. Central insulin and leptin-mediated autonomic control of glucose homeostasis. Trends Endocrinol. Metab. 2011, 22, 275–285. [Google Scholar] [CrossRef] [PubMed] [Green Version]
- Lizarbe, B.; Soares, A.F.; Larsson, S.; Duarte, J.M.N.; Lizarbe, B.; Soares, A.F.; Larsson, S.; Duarte, J.M.N. Neurochemical Modifications in the Hippocampus, Cortex and Hypothalamus of Mice Exposed to Long-Term High-Fat Diet. Front. Neurosci. 2019, 12, 985. [Google Scholar] [CrossRef] [PubMed]
- Klein, C.; Jonas, W.; Wiedmer, P.; Schreyer, S.; Akyüz, L.; Spranger, J.; Hellweg, R.; Steiner, B. High-fat Diet and Physical Exercise Differentially Modulate Adult Neurogenesis in the Mouse Hypothalamus. Neuroscience 2019, 400, 146–156. [Google Scholar] [CrossRef]
- Ruegsegger, G.N.; Vanderboom, P.M.; Dasari, S.; Klaus, K.A.; Kabiraj, P.; McCarthy, C.B.; Lucchinetti, C.F.; Nair, K.S. Exercise and metformin counteract altered mitochondrial function in the insulin-resistant brain. JCI Insight 2019, 4. [Google Scholar] [CrossRef] [PubMed]
- Hassan, A.M.; Mancano, G.; Kashofer, K.; Fröhlich, E.E.; Matak, A.; Mayerhofer, R.; Reichmann, F.; Olivares, M.; Neyrinck, A.M.; Delzenne, N.M.; et al. High-fat diet induces depression-like behaviour in mice associated with changes in microbiome, neuropeptide Y, and brain metabolome. Nutr. Neurosci. 2019, 22, 877–893. [Google Scholar] [CrossRef] [Green Version]
- Scherer, T.; Lindtner, C.; Zielinski, E.; O’Hare, J.; Filatova, N.; Buettner, C. Short Term Voluntary Overfeeding Disrupts Brain Insulin Control of Adipose Tissue Lipolysis*. J. Biol. Chem. 2012, 287, 33061–33069. [Google Scholar] [CrossRef] [Green Version]
- Top, M.V.D.; Zhao, F.-Y.; Viriyapong, R.; Michael, N.J.; Munder, A.C.; Pryor, J.T.; Renaud, L.P.; Spanswick, D. The impact of ageing, fasting and high-fat diet on central and peripheral glucose tolerance and glucose-sensing neural networks in the arcuate nucleus. J. Neuroendocr. 2017, 29, e12528. [Google Scholar] [CrossRef]
- Fu, Z.; Wu, J.; Nesil, T.; Li, M.D.; Aylor, K.W.; Liu, Z. Long-term high-fat diet induces hippocampal microvascular insulin resistance and cognitive dysfunction. Am. J. Physiol. Endocrinol. Metab. 2017, 312, E89–E97. [Google Scholar] [CrossRef]
- Greenwood, E.C.; Winocur, G. Cognitive impairment in rats fed high-fat diets: A specific effect of saturated fatty-acid intake. Behav. Neurosci. 1996, 110, 451–459. [Google Scholar] [CrossRef]
- Ribeiro, M.; Castelhano, J.; Petrella, L.; Sereno, J.; Rodrigues, T.; Neves, C.; Letra, L.; Baptista, F.I.; Seiça, R.; Matafome, P.; et al. High-fat diet induces a neurometabolic state characterized by changes in glutamate and N-acetylaspartate pools associated with early glucose intolerance: An in vivo multimodal MRI study. J. Magn. Reson. Imaging 2018, 48, 757–766. [Google Scholar] [CrossRef]
- Moffett, J.R.; Arun, P.; Ariyannur, P.S.; Namboodiri, A.M.A. N-Acetylaspartate reductions in brain injury: Impact on post-injury neuroenergetics, lipid synthesis, and protein acetylation. Front. Neuroenerg. 2013, 5, 11. [Google Scholar] [CrossRef] [PubMed] [Green Version]
- van der Graaf, M.; Janssen, S.W.; van Asten, J.J.; Hermus, A.R.; Sweep, C.G.; Pikkemaat, J.A.; Martens, G.J.; Heerschap, A. Metabolic profile of the hippocampus of Zucker Diabetic Fatty rats assessed by in vivo 1H magnetic resonance spectroscopy. NMR Biomed. 2004, 17, 405–410. [Google Scholar] [CrossRef] [PubMed]
- Bouchard-Mercier, A.; Rudkowska, I.; Lemieux, S.; Couture, P.; Vohl, M.-C. The metabolic signature associated with the Western dietary pattern: A cross-sectional study. Nutr. J. 2013, 12, 158. [Google Scholar] [CrossRef] [PubMed] [Green Version]
- Tsai, S.-F.; Chen, Y.-W.; Kuo, Y.-M. High-fat diet reduces the hippocampal content level of lactate which is correlated with the expression of glial glutamate transporters. Neurosci. Lett. 2018, 662, 142–146. [Google Scholar] [CrossRef]
- Krssak, M.; Petersen, K.F.; Dresner, A.; DiPietro, L.; Vogel, S.M.; Rothman, D.L.; Shulman, G.I.; Roden, M. Intramyocellular lipid concentrations are correlated with insulin sensitivity in humans: A 1 H NMR spectroscopy study. Diabetology 1999, 42, 113–116. [Google Scholar] [CrossRef] [Green Version]
- Jiang, L.Q.; de Castro Barbosa, T.; Massart, J.; Deshmukh, A.S.; Löfgren, L.; Duque-Guimaraes, D.E.; Ozilgen, A.; Osler, M.E.; Chibalin, A.V.; Zierath, J.R. Diacylglycerol kinase-delta regulates AMPK signaling, lipid metabolism, and skeletal muscle energetics. Am. J. Physiol. Endocrinol. Metab. 2016, 310, E51–E60. [Google Scholar] [CrossRef] [Green Version]
- Gao, Z.; Wang, Z.; Zhang, X.; Butler, A.A.; Zuberi, A.; Gawronska-Kozak, B.; Lefevre, M.; York, D.; Ravussin, E.; Berthoud, H.R.; et al. Inactivation of PKCtheta leads to increased susceptibility to obesity and dietary insulin resistance in mice. Am. J. Physiol. Endocrinol. Metab. 2007, 292, E84–E91. [Google Scholar] [CrossRef]
- Mormeneo, E.; Jimenez-Mallebrera, C.; Palomer, X.; De Nigris, V.; Vázquez-Carrera, M.; Orozco, A.; Nascimento, A.; Colomer, J.; Lerin, C.; Gómez-Foix, A.M. PGC-1α Induces Mitochondrial and Myokine Transcriptional Programs and Lipid Droplet and Glycogen Accumulation in Cultured Human Skeletal Muscle Cells. PLoS ONE 2012, 7, e29985. [Google Scholar] [CrossRef]
- De Mendonça, M.; De Sousa, É.; Da Paixão, A.O.; Dos Santos, B.A.; Spagnol, A.R.; Murata, G.M.; Araújo, H.N.; De Lima, T.I.; Guimarães, D.S.P.S.F.; Silveira, L.R.; et al. MicroRNA miR-222 mediates pioglitazone beneficial effects on skeletal muscle of diet-induced obese mice. Mol. Cell. Endocrinol. 2019, 501, 110661. [Google Scholar] [CrossRef]
- Gao, Z.; Wang, Z.; Zhang, X.; Butler, A.A.; Zuberi, A.; Gawronska-Kozak, B.; Lefevre, M.; York, D.; Ravussin, E.; Berthoud, H.R.; et al. Role of diacylglycerol activation of PKCtheta in lipid-induced muscle insulin resistance in humans. Proc. Natl. Acad. Sci. USA 2014, 111, 9597–9602. [Google Scholar]
- Bergman, B.C.; Hunerdosse, D.M.; Kerege, A.; Playdon, M.C.; Perreault, L. Localisation and composition of skeletal muscle diacylglycerol predicts insulin resistance in humans. Diabetology 2012, 55, 1140–1150. [Google Scholar] [CrossRef] [PubMed] [Green Version]
- Kim, J.K.; Fillmore, J.J.; Sunshine, M.J.; Albrecht, B.; Higashimori, T.; Kim, D.-W.; Liu, Z.-X.; Soos, T.J.; Cline, G.W.; O’Brien, W.R.; et al. PKC knockout mice are protected from fat-induced insulin resistance. J. Clin. Investig. 2004, 114, 823–827. [Google Scholar] [CrossRef] [PubMed] [Green Version]
- Perreault, L.; Newsom, S.A.; Strauss, A.; Kerege, A.; Kahn, D.E.; Harrison, K.A.; Snell-Bergeon, J.K.; Nemkov, T.; D’Alessandro, A.; Jackman, M.R.; et al. Intracellular localization of diacylglycerols and sphingolipids influences insulin sensitivity and mitochondrial function in human skeletal muscle. JCI Insight 2018, 3. [Google Scholar] [CrossRef] [PubMed] [Green Version]
- Rudnicki, M.; Abdifarkosh, G.; Rezvan, O.; Nwadozi, E.; Roudier, E.; Haas, T.L. Female Mice Have Higher Angiogenesis in Perigonadal Adipose Tissue Than Males in Response to High-Fat Diet. Front. Physiol. 2018, 9, 1452. [Google Scholar] [CrossRef] [PubMed] [Green Version]
- Kim, B.; Kwon, J.; Kim, M.-S.; Park, H.; Ji, Y.; Holzapfel, W.; Hyun, C.-K. Protective effects of Bacillus probiotics against high-fat diet-induced metabolic disorders in mice. PLoS ONE 2018, 13, e0210120. [Google Scholar] [CrossRef] [PubMed] [Green Version]
- Cao, Y.; Chang, S.; Dong, J.; Zhu, S.; Zheng, X.; Li, J.; Long, R.; Zhou, Y.; Cui, J.; Zhang, Y. Emodin ameliorates high-fat-diet induced insulin resistance in rats by reducing lipid accumulation in skeletal muscle. Eur. J. Pharmacol. 2016, 780, 194–201. [Google Scholar] [CrossRef]
- Andrich, D.E.; Melbouci, L.; Ou, Y.; Auclair, N.; Mercier, J.; Grenier, J.-C.; Lira, F.S.; Barreiro, L.B.; Danialou, G.; Comtois, A.-S.; et al. A Short-Term High-Fat Diet Alters Glutathione Levels and IL-6 Gene Expression in Oxidative Skeletal Muscles of Young Rats. Front. Physiol. 2019, 10, 372. [Google Scholar] [CrossRef] [Green Version]
- Andrich, D.E.; Ou, Y.; Melbouci, L.; Leduc-Gaudet, J.-P.; Auclair, N.; Mercier, J.; Secco, B.; Tomaz, L.M.; Gouspillou, G.; Danialou, G.; et al. Altered Lipid Metabolism Impairs Skeletal Muscle Force in Young Rats Submitted to a Short-Term High-Fat Diet. Front. Physiol. 2018, 9. [Google Scholar] [CrossRef]
- Pataky, M.W.; Wang, H.; Yu, C.S.; Arias, E.B.; Ploutz-Snyder, R.J.; Zheng, X.; Cartee, G.D. High-Fat Diet-Induced Insulin Resistance in Single Skeletal Muscle Fibers is Fiber Type Selective. Sci. Rep. 2017, 7, 13642. [Google Scholar] [CrossRef] [Green Version]
- Pataky, M.W.; Yu, C.S.; Nie, Y.; Arias, E.B.; Singh, M.; Mendias, C.L.; Ploutz-Snyder, R.J.; Cartee, G.D. Skeletal muscle fiber type-selective effects of acute exercise on insulin-stimulated glucose uptake in insulin-resistant, high-fat-fed rats. Am. J. Physiol. Endocrinol. Metab. 2019, 316, E695–E706. [Google Scholar] [CrossRef]
- Soares, A.F.; Duarte, J.M.N.; Gruetter, R. Increased hepatic fatty acid polyunsaturation precedes ectopic lipid deposition in the liver in adaptation to high-fat diets in mice. MAGMA 2017, 31, 341–354. [Google Scholar] [CrossRef] [Green Version]
- Lai, M.; Chandrasekera, P.C.; Barnard, N.D. You are what you eat, or are you? The challenges of translating high-fat-fed rodents to human obesity and diabetes. Nutr. Diabetes 2014, 4, e135. [Google Scholar] [CrossRef] [PubMed] [Green Version]
- Kowalski, G.M.; Bruce, C.R. The regulation of glucose metabolism: Implications and considerations for the assessment of glucose homeostasis in rodents. Am. J. Physiol. Endocrinol. Metab. 2014, 307, E859–E871. [Google Scholar] [CrossRef] [PubMed] [Green Version]
- Burgess, S.M.; Jeffrey, F.M.H.; Storey, C.; Milde, A.; Hausler, N.; Merritt, M.E.; Mulder, H.; Holm, C.; Sherry, A.D.; Malloy, C.R. Effect of murine strain on metabolic pathways of glucose production after brief or prolonged fasting. Am. J. Physiol. Endocrinol. Metab. 2005, 289, E53–E61. [Google Scholar] [CrossRef] [PubMed] [Green Version]
- Gannon, K.S.; Smith, J.C.; Henderson, R.; Hendrick, P. A system for studying the microstructure of ingestive behavior in mice. Physiol. Behav. 1992, 51, 515–521. [Google Scholar] [CrossRef]
- Ellacott, K.L.; Morton, G.J.; Woods, S.C.; Tso, P.; Schwartz, M.W. Assessment of Feeding Behavior in Laboratory Mice. Cell Metab. 2010, 12, 10–17. [Google Scholar] [CrossRef] [Green Version]
- Perelis, M.; Ramsey, K.M.; Marcheva, B.; Bass, J. Circadian Transcription from Beta Cell Function to Diabetes Pathophysiology. J. Biol. Rhythm. 2016, 31, 323–336. [Google Scholar] [CrossRef]
- Qian, J.; Yeh, B.; Rakshit, K.; Colwell, C.S.; Matveyenko, A.V. Circadian Disruption and Diet-Induced Obesity Synergize to Promote Development of β-Cell Failure and Diabetes in Male Rats. Endocrinology 2015, 156, 4426–4436. [Google Scholar] [CrossRef] [Green Version]
- Johnston, J.D.; Ordovás, J.M.; Scheer, F.A.; Turek, F.W. Circadian Rhythms, Metabolism, and Chrononutrition in Rodents and Humans. Adv. Nutr. 2016, 7, 399–406. [Google Scholar] [CrossRef] [Green Version]
- Luo, S.; Zhang, Y.; Ezrokhi, M.; Li, Y.; Tsai, T.-H.; Cincotta, A.H. Circadian peak dopaminergic activity response at the biological clock pacemaker (suprachiasmatic nucleus) area mediates the metabolic responsiveness to a high-fat diet. J. Neuroendocr. 2018, 30, e12563. [Google Scholar] [CrossRef] [Green Version]
- Vadiveloo, M.; Scott, M.; Quatromoni, P.; Jacques, P.; Parekh, N. Trends in dietary fat and high-fat food intakes from 1991 to 2008 in the Framingham Heart Study participants. Br. J. Nutr. 2014, 111, 724–734. [Google Scholar] [CrossRef] [PubMed] [Green Version]
- Kalupahana, N.S.; Voy, B.H.; Saxton, A.M.; Moustaid-Moussa, N. Energy-Restricted High-Fat Diets Only Partially Improve Markers of Systemic and Adipose Tissue Inflammation. Obesity (Silver Spring) 2011, 19, 245–254. [Google Scholar] [CrossRef] [PubMed]
- Salinero, A.E.; Anderson, B.M.; Zuloaga, K.L. Sex differences in the metabolic effects of diet-induced obesity vary by age of onset. Int. J. Obes. 2018, 42, 1088–1091. [Google Scholar] [CrossRef] [PubMed]
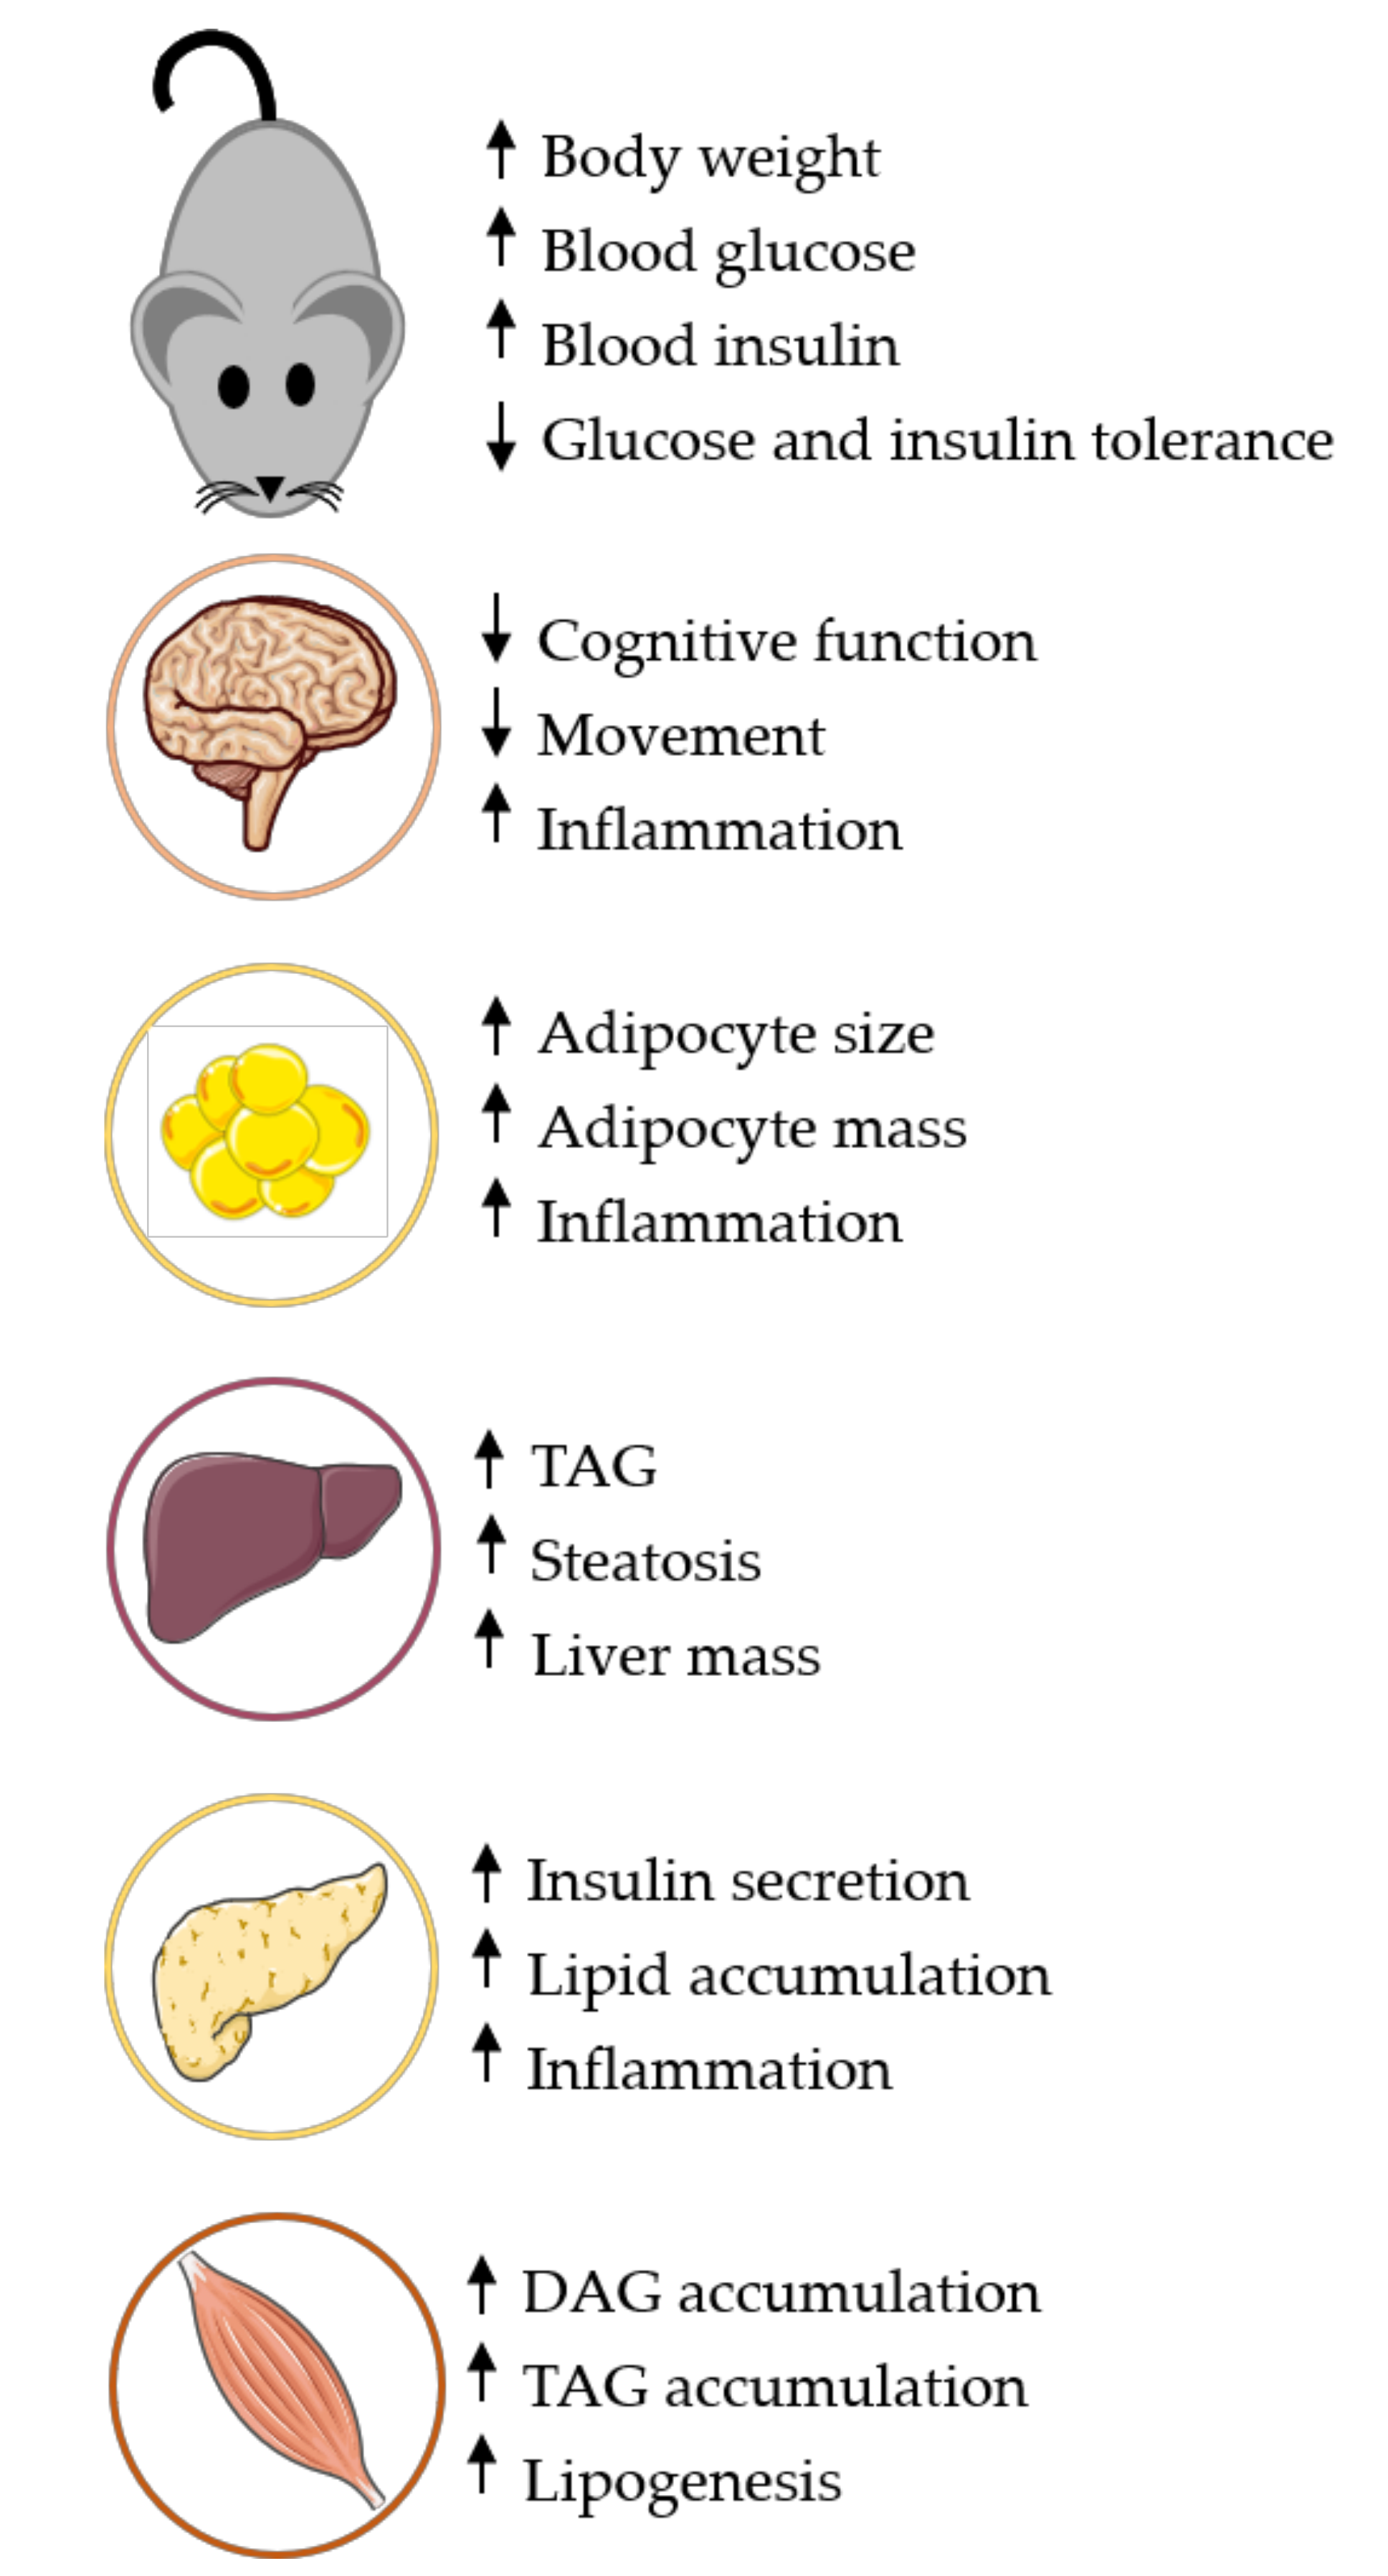
Figure 1.
Rodent tissue responses to Western-like diet. A 45% HFD provides a progressive development of tissue and whole-body changes consistent with the T2D-like phenotype. Using higher fat percentages may create a greater magnitude of tissue dysfunction or accelerate the process, resulting in missed opportunity to study key aspects of disease progression. Detailed tissue responses could be found in Table 1 through Table 5. High-fat diet (HFD), Type 2 Diabetes (T2D), Triacylglycerol (TAG) and Diacylglycerol (DAG).

Table 1.
Liver.
| Source | Fat Source | Macronutrients (% kcal) | Duration | Strain; Sex | Tissue Findings | T2D Status |
|---|---|---|---|---|---|---|
| [19] | (a) Cocoa butter (b) Palm oil (c) Olive oil (d) Safflower oil | 45% fat 20% protein 35% carbohydrate All diet formulations maintained same ratio | 8 weeks | C57BL/6 mice; Male | ↑ Liver TAG in palm and olive oil groups | ↑ Body weight in palm oil compared to cocoa butter. ↓ Glucose tolerance: cocoa, palm and safflower oils |
| [6] | Hydrogenated coconut oil | 59% fat 15% protein 26% carbohydrate | 20 weeks | C57BL/6 mice; Male | ↑ FABP mRNA ↑ Inflammation ↑ Increased BTNL2 | ↑ Fat mass ↓ Insulin sensitivity ↑ Plasma insulin |
| [22] | Lard and Soybean oil | 60% fat 20% protein 20% carbohydrate | 20 weeks | C57BL/6 mice; Female | ↑ Lipid accumulation ↑ Hepatic steatosis | ↑ Body weight ↓ Glucose tolerance ↑Serum insulin ↑ Serum glucose |
| [20,21,23,24] | Lard and Soybean oil | 60% fat ~20% protein ~20% carbohydrate | 8 weeks [23] 15 weeks [24] 18 weeks [20] 20 weeks [21] | C57BL/6 mice; Male | ↑ Inflammation ↑ Lipid accumulation ↑ Fibrosis | ↑ Body weight ↑ Serum glucose ↑ Serum insulin ↑ HOMA-IR |
| [25] | Lard | 45% fat 30% protein 25% carbohydrate | 4 weeks | Wister rats; Male | ↑ Liver mass ↑ Liver TAG ↑ Hepatic steatosis | ↑ Body weight ↓Insulin sensitivity ←→ Plasma glucose |
| [26] | Lard and Soybean oil | 45% fat 20% protein 35% carbohydrate | 12 weeks | Sprague-Dawley rats; Male | ↑ Lipid accumulation ↑ Lipogenic gene and protein expression | ↑ Body weight |
| [27] | Butter | 58% fat 25% protein 17% carbohydrate | 18 weeks | Sprague-Dawley rats; Male | ↑ Inflammation ↑ Lipid accumulation ↓ Insulin signaling ↑ Hepatic necrosis ↑ Oxidative stress | ↑ Body weight ↑ Serum glucose ↑ Serum insulin ↑ HOMA-IR |
Studies cited in this table were limited to those that included macronutrient composition. The direction of arrows indicate change when compared to a standard diet control group within that study. Triacylglycerol (TAG), butyrophilin-like Protein 2 (BTNL2), fatty acid binding protein (FABP), major histocompatibility complex I and II (MHC I and II), and homeostatic model assessment of insulin resistance (HOMA-IR).
Table 2.
Adipose.
| Source | Fat Source | Macronutrients (% kcal) | Duration | Strain; Sex | Findings | T2D Status |
|---|---|---|---|---|---|---|
| [38] | Lard and Soybean oil | 45% fat 20% protein 35% carbohydrate | 12 weeks | C57BL/6; Male | ↑ Body weight ↑ Epididymal fat mass and adipocyte size ↑ Inflammation | ↑ Body weight ↑ Blood glucose |
| [33] | (1) Palm oil (2) Sunflower oil | (1) 45% fat 20% protein 35% carbohydrate (2) 45% fat 20% protein35% carbohydrate | 24 weeks | C57BL/6; Male | ↓ SFA: Adipose insulin signaling ↑ SFA: Inflammation ↑ SFA: Adipocyte size ↑ SFA and MUFA: Epididymal, visceral, subcutaneous, and perirenal fat pad mass | ↓ Palm and sunflower oils: Glucose tolerance ↑ Sunflower oil: Hyperinsulinemia ↑ Palm oil: Hyperinsulinemia above sunflower oil |
| [37,39] | Lard and Soybean oil | 60% fat 20% protein 20% carbohydrate | 7 to 8 weeks | C57BL/6; Male | ↑ Subcutaneous fat ↑ Visceral fat ↑ Adipocyte size ↑ Lipogenic gene expression | ↑ Body weight ↑ Serum glucose |
| [40] | Lard and Soybean oil | 60% fat 20% protein 20% carbohydrate | 12 weeks | C57BL/6; female | ↑ Perirenal fat ↑ Gonadal fat ↑ Mesenteric fat | ↑ Body weight ←→ Glucose tolerance |
| [35] | Lard and Soybean oil | 60% fat 20% protein20% carbohydrate | 20 weeks | C57BL/6; Male | ↑ Adipose weight ↑ Adipocyte size peaks at 12 weeks ↑ Adipocyte death peaks at 16 weeks ↑ Inflammation | ↑ Body weight ↑ Serum insulin by 8 weeks ↑ Insulin resistance by 8 weeks ↑ HOMA-IR by 8 weeks |
| [41] | Lard and Soybean oil | 45% fat 20% protein 35% carbohydrate | 13 weeks | Sprague-Dawley rats; Male | ↑ Retroperitoneal and epididymal fat mass ↑ Adipocyte size ↑ Adipogenic gene expression ↑ Macrophage accumulation ↑ Inflammation | ↑ Body weight |
| [42] | Unknown | 57% fat 10% protein 31% carbohydrate | 11 weeks | Wister rats; Male and Female | ↑ Subcutaneous and retroperitoneal fat mass and adipocyte diameter in males and females ↑ Oxidative stress in males only ↑ Subcutaneous fat inflammation in males only | ↑ Body weight males only |
| [43] | Lard and Soybean oil | 60% fat 20% protein 20% carbohydrate | 8 weeks | Wister rats; Male | ↑ Ceramide content ↑ DAG content ↑ Plasma free fatty acids | ←→ Body weight ↑ Plasma glucose ↑ Plasma insulin ↑ HOMA-IR |
| [44] | UFA Mix: Sheep rump fat | 62.1% fat 16% protein 28.2% fat | 20 weeks | Wister rats; Males | ↑ Inguinal, mesenteric, epididymal, retroperitoneal, and perirenal fat mass ↓ Capillary density ↑ Increased macrophage crown-like structures | ↑ Body weight ↑ Blood glucose ↑ HOMA-IR ←→ Insulin |
Studies cited in this table were limited to those that included macronutrient composition. The direction of arrows indicate change when compared to a standard diet control group within that study. Homeostatic model assessment of insulin resistance (HOMA-IR), saturated fatty acid (SFA), monounsaturated fatty acid (MUFA, and diacylglycerol (DAG).
Table 3.
Pancreas.
| Source | Fat Source | Macronutrients (% kcal) | Duration | Strain; Sex | Findings | T2D Status |
|---|---|---|---|---|---|---|
| [45] | Lard and Soybean oil | 45% fat 20% protein 35% carbohydrate | 6 weeks | C57BL/6; Male | ↑ Beta cell proliferation in splenic region ↑ Increased insulin secretion from isolated islets | ↑ Body weight ↑ Plasma insulin ↓ Glucose tolerance ↓ Insulin tolerance |
| [46] | Lard and Soybean oil | 45% fat 20% protein 35% carbohydrate | 12 weeks | C57BL/6; Male | ↑ Lipid accumulation in acinar cells ↑ Adipose differentiation-related protein (ADFP) | ↑ Body weight ↑ Serum insulin ↑ Blood glucose |
| [48] | Lard and Soybean oil | 60% fat 20% protein 20% carbohydrate | 8 weeks | C57BL/6; Male | ↑ Islet size ↑ Islet Insulin | ↑ Body weight ↑ Blood glucose ↑ HbA1c ↑ Serum Insulin ↑ HOMA-IR |
| [53] | Not reported | 46% fat 20.3% protein 24% carbohydrate | 12 weeks | Sprague-Dawley rats; Male | ↑ Mast cell accumulation ↑ Islet area and proliferation ↑ β and α cell area | ↑ Plasma insulin ↓ Glucose tolerance |
| [56] | Not reported | 60% fat 18% protein 22% carbohydrate | 8 weeks | Sprague-Dawley rats; Male | Glucose-stimulated islet insulin secretion | Glucose tolerance |
| [51] | Not reported | 66.43% fat 18.08% protein 15.48% carbohydrate | 8 and 16 weeks | Sprague-Dawley rats; Male | ↑ Islet cell insulin at 8 and 16 weeks ↑ Glucagon at 16 weeks ↑ β and α cell area at 16 weeks ↑ β cell autophagy at 16 weeks | ↑ Body weight at 16 weeks ↑ Plasma glucose at 16 weeks ↑ Serum insulin at 8 and 16 weeks ↑ HOMA-IR at 8 and 16 weeks |
Studies cited in the table were limited to those that included macronutrient composition. The direction of arrows indicate change when compared to a standard diet control group within that study. Homeostatic model assessment of insulin resistance (HOMA-IR) and hemoglobin A1c (HbA1c).
Table 4.
Brain.
| Source | Fat Source | Macronutrients (% kcal) | Duration | Strain; Sex | Findings | T2D Status |
|---|---|---|---|---|---|---|
| [63] | Lard and soybean oil | 10, 45, or 60% fat 20% protein 70, 35, or 20 % carbohydrates | 24 weeks | C57BL/6; Male | 45% and 60% fat ↓ Spontaneous activity ↓ Locomotion ↑ Neuroinflammation 60% fatAltered metabolite profile | 45% and 60% fat ↑ Body weight: 60% > 45% ↑ Plasma glucose: 60% > 45% ↑ Plasma insulin ↑ Plasma Leptin ↓ Glucose tolerance: 60% > 45% at 2 h |
| [65] | Lard and soybean oil | 60% fat 20% protein 20% carbohydrates | 4 weeks | C57BL/6; Male | ↓ Insulin signaling in isolated hypothalamic and hippocampal neurons ↓ Mitochondrial function ↑ Oxidative stress | ↑ Body weight ↑ Fat mass ↑ Plasma glucose ↑ Plasma insulin ↑ HOMA-IR |
| [66] | Palm oil | 60% fat 16% protein 24% carbohydrates | 8 weeks | C57BL/6; Male | ↓ Socialization behavior ↑ Disruption of normal circadian feeding Hypothalamic NPY expression | ↑ Body weight |
| [64] | Lard and soybean oil | 60% fat 20% protein 20% carbohydrates | 12 weeks | C57BL/6; Female | ↑ Microglia in hypothalamic arcuate nucleus ↑ Trend in neurogenesis of POMC neurons | ↑ Body weight ↑ Fat mass |
| [67] | Lard | 10 % added to standard diet | 3 days | Sprague-Dawley Rats; Male | ↓ Hypothalamic insulin sensitivity ↓ Hypothalamic insulin-stimulated adipose lipolysis ↓ Hypothalamic insulin-stimulated hepatic glucose production | ←→ Body weight ←→ Plasma glucose ←→ Plasma insulin |
| [68] | Not reported | 45% fat 20% protein 35% carbohydrates | 20 weeks | Wistar-Han Rats; Male | ←→ CSF glucose ↓ CSF glucose tolerance | ↑ Body weight Plasma glucose ↓ Glucose tolerance |
| [69] | Lard and soybean oil | 60% fat 20% protein 20% carbohydrates | 24 weeks | Sprague-Dawley Rats; Male | ↓ Cognitive function ↓ Insulin-stimulated hippocampal perfusion ↓ Hippocampal insulin signaling ↓ Hippocampal eNOS | ↓ Whole body glucose disposal ↑ Plasma insulin |
Studies cited in the table were limited to those that included macronutrient composition. The direction of arrows indicate change when compared to a standard diet control group within that study. Cerebrospinal fluid (CSF), proopiomelanocortin (POMC), endothelial nitric oxide synthase (eNOS), and homeostatic model assessment of insulin resistance (HOMA-IR).
Table 5.
Skeletal Muscle.
| Source | Fat Source | Macronutrients (%kcal) | Duration | Strain; Sex | Findings | T2D Status |
|---|---|---|---|---|---|---|
| [19] | (a) Cocoa butter (b) Palm oil (c) Olive oil (d) Safflower oil | 45% fat 20% protein 35% carbohydrateAll diet formulations maintained same ratio | 8 weeks | C57BL/6; Male | ↑ Gastrocnemius TAG and DAG: cocoa butter, palm oil, and olive oil | ↑ Body weight in palm oil compared to cocoa butter. ↑ Glucose tolerance: cocoa, palm and safflower oils |
| [85] | Coconut oil and soybean oil | 58% fat 17% protein 25% carbohydrate | 16 weeks | FVB; B6;Male and Female | ↓ Muscle insulin sensitivity: Males and Females | ↑ Body weight: Males only ↑ Plasma glucose: Males only ↓ Glucose and insulin tolerance: Males only |
| [6,80] | Hydrogenated coconut oil | 59% fat 15% protein 26% carbohydrate | 8 weeks [83] 20 weeks [6] | C57BL/6; Male | ↑ Fatty acid transport ↑ Lipogenesis ↑ Muscle Adipocyte differentiation ↓ Fatty acid oxidation ↓ Mitochondrial function | ↑ Body weight ↑ Blood glucose ↑ Plasma insulin ↓ Insulin sensitivity |
| [86] | Lard and soybean oil | 60% fat 20% protein 20% carbohydrate | 15 weeks | C57BL/6; Male | ↓ Insulin sensitivity ↑ Muscle weight ↑ Inflammatory mRNA profile | ↑ Body weight ↑ Serum insulin ↕ Glucose tolerance |
| [87] | Lard | 45% fat 20% protein 35% carbohydrate | 15 weeks | Sprague-Dawley rats; Male | ↑ Soleus lipid accumulation ↑ Protein and mRNA supporting fatty acid transport and lipogenesis | ↑ Body weight ↑ Plasma glucose ↑ Serum insulin ↑ HOMA-IR ↓ Insulin sensitivity |
| [88,89] | Lard and soybean oil | 60% fat 20% protein 20% carbohydrate | 2 weeks | Wister rats; Male | ←→ Soleus and extensor digitorum longus weight ←→ Soleus and extensor digitorum longus insulin signaling ↓ Soleus force production ↓ Soleus glutathione ↑ Soleus IL-6 mRNA ↑ Lipid droplet size in soleus ↑ Percentage of large lipid droplets in soleus ↑ Lipogenic mRNA in soleus | ←→ Body weight |
| [90,91] | Lard and soybean oil | 60% fat 20% protein 20% carbohydrate | 2 weeks | Wister rats; Male | ↓ Glucose uptake by isolated type IIAX, IIX, IIBX, and IIB fibers ↑ Lipid droplet density in type I, IIA, and IIAX fibers ↑ Lipid droplet size in type I and IIA fibers ↓ Insulin-stimulated glucose uptake in whole muscle ↓ Insulin-stimulated glucose uptake in isolated type IIA, IIAX, and IIB fibers | ←→ Body weight |
Studies cited in the table were limited to those that included macronutrient composition. The direction of arrows indicate change when compared to a standard diet control group within that study. Diacylglycerol (DAG), triacylglycerol (TAG), interleukin 6 (IL-6), and homeostatic model assessment of insulin resistance (HOMA-IR).
Publisher’s Note: MDPI stays neutral with regard to jurisdictional claims in published maps and institutional affiliations. |
© 2020 by the authors. Licensee MDPI, Basel, Switzerland. This article is an open access article distributed under the terms and conditions of the Creative Commons Attribution (CC BY) license (http://creativecommons.org/licenses/by/4.0/).
Share and Cite
MDPI and ACS Style
Stott, N.L.; Marino, J.S. High Fat Rodent Models of Type 2 Diabetes: From Rodent to Human. Nutrients 2020, 12, 3650. https://doi.org/10.3390/nu12123650
AMA Style
Stott NL, Marino JS. High Fat Rodent Models of Type 2 Diabetes: From Rodent to Human. Nutrients. 2020; 12(12):3650. https://doi.org/10.3390/nu12123650
Chicago/Turabian StyleStott, Nicole L., and Joseph S. Marino. 2020. "High Fat Rodent Models of Type 2 Diabetes: From Rodent to Human" Nutrients 12, no. 12: 3650. https://doi.org/10.3390/nu12123650
Note that from the first issue of 2016, this journal uses article numbers instead of page numbers. See further details here.