Abstract
Data on proteomic and metabolomic signatures of healthy dietary patterns are limited. We evaluated the cross-sectional association of serum proteomic and metabolomic markers with three dietary patterns: the Alternative Healthy Eating Index (AHEI), the Dietary Approaches to Stop Hypertension (DASH) diet; and a Mediterranean-style (MDS) diet. We examined participants from the Framingham Offspring Study (mean age; 55 years; 52% women) who had complete proteomic (n = 1713) and metabolomic (n = 2284) data; using food frequency questionnaires to derive dietary pattern indices. Proteins and metabolites were quantified using the SomaScan platform and liquid chromatography/tandem mass spectrometry; respectively. We used multivariable-adjusted linear regression models to relate each dietary pattern index (independent variables) to each proteomic and metabolomic marker (dependent variables). Of the 1373 proteins; 103 were associated with at least one dietary pattern (48 with AHEI; 83 with DASH; and 8 with MDS; all false discovery rate [FDR] ≤ 0.05). We identified unique associations between dietary patterns and proteins (17 with AHEI; 52 with DASH; and 3 with MDS; all FDR ≤ 0.05). Significant proteins enriched biological pathways involved in cellular metabolism/proliferation and immune response/inflammation. Of the 216 metabolites; 65 were associated with at least one dietary pattern (38 with AHEI; 43 with DASH; and 50 with MDS; all FDR ≤ 0.05). All three dietary patterns were associated with a common signature of 24 metabolites (63% lipids). Proteins and metabolites associated with dietary patterns may help characterize intermediate phenotypes that provide insights into the molecular mechanisms mediating diet-related disease. Our findings warrant replication in independent populations
1. Introduction
Sub-optimal diet quality is a leading cause of death in the United States and is estimated to contribute to approximately 44% of coronary heart disease deaths and 51% of stroke related deaths [1]. Data from clinical trials and prospective cohort studies indicate that healthy dietary patterns are associated with better metabolic health, lower risk of major chronic diseases, and lower mortality [2,3,4,5]. These studies indicate that diet quality may be a key factor in the prevention and mitigation of chronic disease. Yet, the molecular mechanisms [2,3] underlying the beneficial effects of healthy diet are not completely understood.
The identification of molecular biomarkers (proteins and metabolites) related to dietary patterns holds promise to elucidate biological pathways underlying the diet-related risk of chronic disease. Molecular biomarkers related to dietary intake may also relate to risk factors for chronic disease, or overt chronic disease per se. Such molecular markers reflecting dietary patterns have the potential to help inform risk assessment and allow for targeted preventive measures prior to the onset of chronic disease states. Population-based high-throughput proteomic studies of dietary patterns are lacking even though proteomic profiling may identify molecular biomarkers reflective of the biological functions/dysfunctions associated with an exposure (such as diet) or chronic disease states. In contrast, the use of untargeted metabolomics in nutrition research has increased in past years with the primary goal of biomarker discovery for the objective assessment of dietary intake [6]. Fewer studies have sought to relate dietary metabolomic profiles to disease outcomes; some studies have suggested that certain circulating metabolites may contribute to the biological underpinnings of diet–disease relations [7,8,9].
Multi-level omics analyses that combine high-dimensional molecular data from high throughput platforms can provide a comprehensive assessment of intermediate phenotypes (e.g., molecular endophenotypes) that may help link diet (or other exposures) to more distal chronic disease phenotypes. We hypothesized that proteomic and metabolic signatures of habitual dietary patterns encompass the respective functional states and metabolic consequences of unique dietary patterns including the sequelae of chronic disease. The objective of the present investigation was to determine the associations of the Alternative Healthy Eating Index (AHEI), Dietary Approaches to Stop Hypertension (DASH) diet, and a Mediterranean-style diet (MDS) with 1373 plasma proteins and 216 circulating metabolites in a sample of community-dwelling middle-aged adults.
2. Materials and Methods
2.1. Study Sample
The description of the Framingham Offspring Study is located elsewhere [10]. For the present investigation, we evaluated data from participants who attended the fifth examination cycle (1991–1995) of the Framingham Offspring Study. Details of participant inclusion are displayed in Supplementary Figure S1. For our analyses of diet–protein relations, 1913 participants who had proteomic profiling completed on the SOMAscan platform were eligible. Participants were excluded from analysis if they did not have complete dietary data (n = 200) or had missing covariate data (n = 51). This resulted in a final analytical sample of 1662. For analyses of diet–metabolite relations, 2526 participants who had metabolites assayed were eligible. Participants were excluded from analysis if they did not have complete dietary data (n = 242) or if they were missing covariate data (n = 76). This resulted in a second analytical sample of 2208 for diet–metabolite relations.
2.2. Protein Quantification
Proteomics profiling in the Framingham Offspring Study has been described previously [11,12]. Blood samples were collected from participants at the fifth exam Heart Study visit using standard phlebotomy procedures. Using the SOMAscan platform, a total of 1373 proteins were quantified using single-stranded DNA-based aptamers. Samples were assayed in two batches (n = 821 and n = 1092). For each respective batch, age and sex adjusted protein values were loge transformed and standardized to a mean = 0 and standard deviation (SD) = 1. The inter- and intra-assay reproducibility of proteins quantified on the SOMAscan platform in the Framingham Offspring Study has previously been reported [11].
2.3. Metabolite Quantification
Measurements of 216 metabolites in the Framingham Offspring Study has been previously described in detail [13,14,15]. Blood samples were collected at the fifth exam Heart Study visit. Positively charged polar, negatively charged polar, and lipid metabolites were quantified using liquid chromatography with tandem mass spectrometry (LC/MS/MS). Known standards were used to identify metabolites and internal standards were used for quality control [13]. Nomenclature for lipid metabolites includes the total lipid acyl chain-length followed by the total number of double bonds (e.g., twenty-two carbon acyl chain and six double bonds is indicated by = C22:6).
2.4. Dietary Assessment
Dietary intake at examination cycle five was assessed using the Harvard semi-quantitative food frequency questionnaire (FFQ). The Harvard FFQ measures usual frequency of consumption of 126 dietary items over the year preceding the Heart Study visit. Food frequency categories range from none or <1 serving per month to ≥ 6 servings per day. Use of the Harvard FFQ has previously been validated for the assessment of dietary intake using 7-day dietary records [16]. We only used FFQs that were considered valid (<13 blank items and estimated daily caloric intake was ≥600 kcal/d and <4000 kcal/d for women or <4200 kcal/d for men) [17].
2.5. Dietary Pattern Indices
The AHEI, DASH diet score, and MDS were constructed using dietary intake data from the aforementioned FFQ. Components and scoring criteria for each score were based on prior studies and have been described in detail elsewhere [18,19,20].
AHEI components include vegetables, fruits, nuts and legumes, sugar-sweetened beverages and fruit juice, whole grains, red and processed meat, eicosapentaenoic acid and docosahexaenoic acid, polyunsaturated fatty acids (PUFA), trans fatty acids, sodium, and alcohol [20]. For each component, a maximum score of 10 points was possible. Reverse scores (lower consumption receives a higher score) were assigned to sugar-sweetened beverages, trans fatty acids, and sodium. Individual components were summed to a maximum total score of 110 points.
The DASH diet score has 8 components, which includes fruits and fruit juices, vegetables, nuts and legumes, whole grains, low-fat dairy, sodium, red and processed meats, and sugar-sweetened beverages. For each component, scoring was based on quintiles of intake with the first quintile (Q1) receiving a score of 1 and the fifth quintile (Q5) receiving the maximum score of 5 points [19]. Reverse scores were assigned to sodium, red and processed meats, and sugar-sweetened beverages. All components were summed to a maximum DASH diet score of 40.
Lastly, the MDS components included vegetables, fruits, nuts, legumes, whole grains, fish, red meat, ratio of monounsaturated fatty acids (MUFA) to saturated fatty acids (SFA), and alcohol. Except for alcohol, all component scores are based on sex-specific quartiles of intake for our respective sample, with participants in the first quartile (Q1) receiving a score of 0 and the fourth quartile (Q4) having the maximum score of 3 [21]. Reverse scores were assigned to red and processed meat component. Participants received a score of 1 for sex-specific moderate alcohol consumption or a score of 0 for over- or under-consumption [18]. Component scores were summed to a maximum final MDS score of 25.
2.6. Covariate Assessment
We included the following covariates in our analysis: age, sex, total caloric intake, current smoking status, physical activity index, use of lipid lowering medication, use of anti-hypertensive medication, and body mass index (BMI). All covariates were assessed at the fifth examination cycle of the Framingham Offspring Study (1991–1995). We classified participants who smoked regularly in the year preceding the Heart Study visit as current smokers. Use of anti-hypertensive and lipid-lowering medications in the past year was based on self-report. BMI was calculated as measured weight in kilograms divided by the square of height in meters (kg/m2). The physical activity index was calculated based on time and intensity of activities in a day [22]. Lastly, total energy was calculated from the aforementioned semi-quantitative FFQ.
2.7. Statistical Analysis
We used multivariable linear regression models to determine the cross-sectional associations of each dietary pattern index (AHEI, DASH, and MDS; independent variables, a separate model for each) with each protein and metabolite (dependent variables, a separate model for each). We standardized all three dietary pattern indices (mean = 0, SD = 1) and modeled the standardized scores as continuous variable to maximize our statistical power. Results are reported as increments in proteins or metabolite concentrations for each SD-unit increase in the standardized dietary pattern indices (AHEI, DASH or MDS). Multivariable linear regression models included adjustment for age, sex, total caloric intake, current smoking status, physical activity index, use of lipid lowering medication, use of anti-hypertensive medication, and BMI. We calculated age- and sex-adjusted Spearman’s correlation coefficients among proteins and metabolites (separately) identified as statistically significant in our second multivariable regression model.
For all analyses we considered the Benjamini–Hochberg false discover rate (FDR) q value of ≤0.05 to define statistical significance. A Bonferroni adjustment (0.05/1373 proteins and 0.05/216 metabolites) was used to display a condensed list of top significant proteins and metabolites. Statistical analyses were completed using SAS statistical software (version 9.4; SAS Institute, Cary, NC, USA) and R (version 3.6.1) run on RStudio (RStudio: Integrated Development for R. RStudio, Inc., Boston, MA, USA).
2.8. Enrichment Analysis
We completed an enrichment analysis to determine underlying biological significance of proteins that have statistically significant associations with dietary patterns. A pathway over-representation analysis was conducted on significant (FDR q ≤ 0.05) proteins using Web-based Gene Set Analysis Toolkit (WebGestalt) [23]. Proteins were mapped to the Kyoto Encyclopedia of Genes and Genomes (KEGG) functional database [24]. KEGG pathways with less than 5 proteins or more than 2000 proteins were excluded from the analysis. Enriched pathways with an FDR q ≤ 0.05 were considered statistically significant. Significant metabolites were mapped to the KEGG functional database for descriptive annotation.
Overlap between Dietary Protein and Metabolite Quantitative Trait Loci and Prior Genome-Wide Association Study Risk Loci
Previous work in the Framingham Offspring Study has identified genetic loci (protein and metabolite quantitative trait loci [p/mQTL]) of 156 of the proteins and all of the 216 metabolites assayed at examination cycle five [25,26]. Genotyping and the identification of p/mQTLs in the Framingham Offspring Study have been described elsewhere [25,26]. In the present study, we present p/mQTL that were previously identified in the Framingham Offspring Study to be associated with proteins and/or metabolites that we observed to be significantly associated with at least one of the respective dietary patterns. We searched the NHGRI-EBI Catalogue of Published genome-wide association studies (GWAS) [27] to determine overlap between dietary p/mQTL and risk loci identified in prior GWAS.
3. Results
3.1. Sample Characteristics
Our overall study sample had an average age of 55 years and 52 percent were women. Sex-specific participant characteristics, represented as mean (SD) or frequency (proportion), are displayed in Table 1. On average, women had a lower BMI and a small proportion reported use of lipid-lowering and anti-hypertensive medications, compared to men. Additionally, women reported a lower average energy intake and had higher average AHEI and DASH dietary pattern scores.

Table 1.
Sample characteristics at examination five of the Framingham Offspring Study.1
3.2. Associations of Dietary Patterns with Plasma Protein Concentrations
Overall, 103 unique proteins were significantly associated with at least one dietary pattern index (48 with AHEI, 83 with DASH, and 8 with MDS; Figure 1A). Forty-six proteins were directly associated with at least one dietary pattern index and 57 proteins had inverse associations with at least one dietary pattern index (Figure 2A). The top significant results by a Bonferroni adjustment are listed in Table 2. Beta coefficients representing the difference in concentrations of each of the 103 proteins per SD increase in the AHEI, DASH and MDS indices are listed in Supplemental Table S1. Five proteins (epidermal growth factor receptor [ERBB1], kynureninase [KYNU], stanniocalcin 1, macrophage migration inhibitory factor [MIF], and WAP, kazal, immunoglobulin, kunitz and NTR domain-containing protein 2 [WFKN2]) were significantly associated with all three dietary pattern indices. We observed that 52 proteins were uniquely associated with the DASH diet score (19 direct and 33 inverse associations; all FDR q ≤ 0.05) and 17 proteins were uniquely associated with the AHEI (7 direct and 10 inverse associations; all FDR q ≤ 0.05). Additionally, 26 proteins were significantly associated with the DASH diet score and the AHEI but not the MDS (15 direct and 11 inverse associations; all FDR q ≤ 0.05). Unlike the DASH diet score and the AHEI, associations of the MDS with plasma proteins were less evident. The MDS was significantly associated with just 8 proteins, 3 of which (p-selectin, intercellular adhesion molecular 5 [ICAM-5], and cathepsin S) uniquely related to the MDS (all FDR q ≤ 0.05). Among the 103 unique proteins, we observed two groupings of positively correlated proteins (34 proteins and 40 proteins; Figure 3). The first grouping consists of 34 proteins that primarily had inverse associations with dietary patterns and the second grouping consists of 40 proteins that primarily had positive associations with dietary patterns.
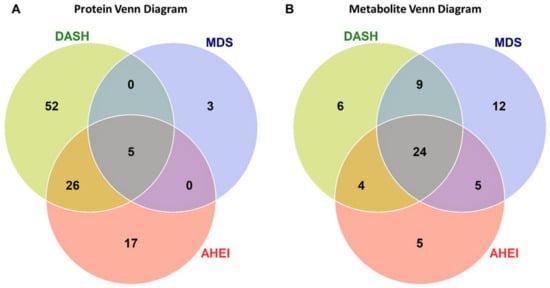
Figure 1.
The number of protein (A) and metabolite (B) markers associated with dietary pattern indices. Venn diagrams illustrate the overlap of significant proteins (FDR q ≤ 0.05) and metabolites across the AHEI, DASH, and MDS dietary patterns. Significant proteins and metabolites were based on a false discovery rate threshold ≤ 0.05 from multivariable models adjusted for age, sex, total caloric intake, current smoking, physical activity index, lipid lowering medication, anti-hypertensive medication, and body mass index. Abbreviations: AHEI, Alternative Healthy Eating Index; DASH, Dietary Approaches to Stop Hypertension; FDR, false discovery rate; MDS, Mediterranean-style Diet Score.
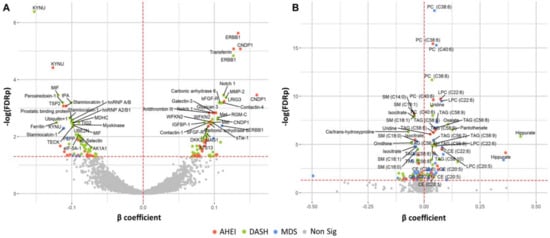
Figure 2.
Protein (A) and metabolite (B) markers associated with dietary pattern indices. Colored points (red, green, blue) indicate statistical significance (FDR q ≤ 0.05) by the respective dietary pattern indices. Multivariable regression models are adjusted for age, sex, total caloric intake, current smoking, physical activity index, lipid lowering medication, anti-hypertensive medication, and body mass index. β estimates represent the change in marker per one-unit increase in the respective dietary pattern indices. Eleven metabolites with β coefficients < −0.50 or >0.50 are excluded from the figure. Abbreviations: AHEI, Alternative Healthy Eating Index; CE, cholesterol ester; DASH, Dietary Approaches to Stop Hypertension; FDR, false discovery rate; LPC, lysophosphatidylcholine; LPE, lysophosphatidylethanolamine; MDS, Mediterranean-style Diet Score. PC, phosphatidylcholine; SM, sphingomyelin; TAG, triacylglycerol.
Table 2.
Top significant associations of dietary patterns with plasma protein concentrations 1.

Figure 3.
Heatmap depicting Spearman’s partial correlation coefficients adjusted for age and sex between proteins that were statistically significant (FDR p ≤ 0.05) in multivariable models adjusting for age, sex, total caloric intake, current smoking, physical activity index, lipid lowering medication, anti-hypertensive medication, and body mass index.
3.3. Associations of Dietary Patterns with Plasma Metabolite Concentrations
Of the 216 plasma metabolites, 65 were associated with at least one dietary pattern index (38 with AHEI, 43 with DASH, 50 with MDS; all FDR q ≤ 0.05; Figure 1B and Figure 2B). Of these, 27 metabolites had direct associations and 38 metabolites had inverse associations with a dietary pattern. The top statistically significant results after a Bonferroni correction are listed in Table 3. Beta coefficients representing the difference in concentrations of each of the 65 proteins per one-unit increase in the AHEI, DASH and MDS indices are listed in Supplemental Table S2. The majority of statistically significant metabolites associated with the three dietary patterns were lipids (55%). Additional notable classes of molecules associated with the three dietary patterns included amino acids (11%), bile acids and derivatives (5%), nucleotide metabolism (5%), and tricarboxylic acid and derivatives (5%). We observed that 24 metabolites were significantly associated (15 directly and 9 inversely) with all three dietary pattern indices (all FDR q ≤ 0.05). Half of the 24 metabolites were highly-unsaturated lipid species directly associated with the respective diet indices. Overall, we observed fewer significant unique associations of the three dietary pattern indices with metabolites than with proteins. The MDS was uniquely associated with 11 lipid species and the nucleotide metabolite adenosine monophosphate (AMP, all FDR q ≤ 0.05). The AHEI and DASH indices had fewer unique associations (5 and 6 respectively), all of which were with non-lipid metabolites (all FDR q ≤ 0.05). Of the 65 metabolites, we observed that concentrations of lipid species with a similar degree of saturation had direct correlations with each other (Figure 4).
Table 3.
Top significant associations of dietary patterns with plasma metabolite concentrations 1.

Figure 4.
Heatmap depicting Spearman’s partial correlation coefficients adjusted for age and sex between metabolites that were statistically significant (FDR p ≤ 0.05) in multivariable models adjusting for age, sex, total caloric intake, current smoking, physical activity index, lipid lowering medication, anti-hypertensive medication, and body mass index. CE, cholesterol ester; FDR, false discovery rate; LPC, lysophosphatidylcholine; LPE, lysophosphatidylethanolamine; PC, phosphatidylcholine; SM, sphingomyelin; TAG, triacylglycerol.
3.4. Protein Enrichment Analysis
We completed a pathway over-representation analysis of the 103 proteins significantly associated with the AHEI, DASH, or MDS diet indices. Sixty-eight proteins successfully mapped to KEGG pathways. The top ten enriched pathways for these 68 proteins are displayed in Table 4. Seven pathways were significantly enriched by protein related to dietary patterns: complement and coagulation cascades, staphylococcus aureus infection, endocrine resistance, HIF-1 signaling pathway, central carbon metabolism in cancer, PI3K-Akt signaling pathway, and malaria (all FDR q ≤ 0.05). Additionally, three pathways had FDR q < 0.07, including fluid shear stress and atherosclerosis, Prostate cancer, and cell adhesion molecules (CAMs). Pathways were broadly involved in biological processes such as cellular proliferation, cellular metabolism, immune response, and inflammation. We completed separate analyses on the 48 proteins significantly associated with the AHEI and the 83 proteins significantly associated with the DASH diet score (Supplementary Table S3). Thirty-seven of the 48 proteins associated with the AHEI and 49 of the 83 protein associated with the DASH diet score successfully mapped to KEGG pathways. This secondary enrichment analysis suggested that proteins associated with the DASH diet score predominately enriched the HIF-1 signaling pathway, PI3K-Akt signaling pathway, malaria, fluid shear stress and atherosclerosis, and prostate cancer pathways.
Table 4.
Pathway over representation analysis of protein markers associated with dietary pattern 1.
3.5. Metabolite Enrichment
In a descriptive assessment, we mapped metabolites to pathways in the KEGG functional database (Supplemental Table S4). Metabolites mapped to notable pathways including bile secretion, cholesterol metabolism, and ABC transporters. Additional pathways include choline metabolism, glycerophospholipid metabolism, and vitamin digestion and absorption.
3.6. Overlap between Dietary Protein and Metabolite Quantitative Trait Loci and Prior Genome-Wide Association Study Risk Loci
Of the previously identified genetic loci associated with 156 proteins from the SOMAscan platform, 39 were related with concentrations of 25 plasma proteins that we identified as having a significant association with at least one respective dietary pattern index (Table 5). Four of these dietary pQTL were associated with clinical traits in prior GWAS analyses. In particular, a variant (rs2519093) of the ABO gene, which is directly associated with concentrations of E-selectin, has direct associations with coronary artery disease [28], venous thromboembolism [29], and cardiometabolic risk factors. Additionally, 19 mQTL were associated with concentrations of 18 metabolites, 15 of which are lipid metabolites (Table 6). Many lipid metabolites were associated with genetic variants of the of the fatty acid desaturase gene family [FADS1-2]. Genetic variants of the FADS gene cluster are associated with plasma concentrations of omega-3 and -6 fatty acids [30,31], and cardiometabolic risk factors (blood lipids, insulin, and glycemic markers) [32,33]. Further, a genetic variant of the APOA gene cluster was associated with concentrations of TAG (C52:4) and has been linked to increased susceptibility of CVD [34].
Table 5.
Overlap among dietary protein quantitative trait loci and prior genome-wide association study risk loci.1.
Table 6.
Overlap among dietary metabolite quantitative trait loci and prior genome-wide association study risk loci.1
4. Discussion
Proteomic and metabolomic correlates of dietary patterns (sometimes referred to as ‘signatures’) may collectively represent an intermediate phenotype of the underlying metabolic state and provide insight into the molecular mechanisms mediating diet and chronic disease associations. In the present investigation we identified high-throughput proteomic and metabolomic signatures of dietary patterns that have been previously associated with reduced risk of chronic disease mortality from all causes [4,5]. Our main findings are four-fold; first, we identified unique proteomic correlates of the DASH and AHEI dietary patterns. Second, we identified a shared ‘signature’ of 24 metabolites associated with all three healthy dietary patterns. Third, downstream enrichment analysis indicated that proteins associated with dietary patterns are involved in biological pathways that may underlie associations between dietary patterns and metabolic health. Fourth, overlap between dietary p/mQTL and prior GWAS risk loci suggest the potential utility of dietary pattern-related proteins and metabolites as endophenotypes that may link diet to cardiometabolic health and risk of chronic disease.
Our investigation adds to the literature by relating a broad array of over 1300 plasma proteins to dietary patterns using multiplexed high-throughput single-stranded DNA aptamer technology that allows for efficient and deep profiling of the plasma proteome [35]. Of the 103 dietary pattern-related proteins in our investigation, 16 were associated with various metabolic traits (BMI, visceral adiposity, triglycerides, insulin resistance, and fasting glucose) in the Diet, Obesity, and Genes interventional trial [36,37] and 45 proteins were associated with cardiometabolic risk and/or incidence CVD in the Framingham Offspring Study [11]. In addition, our over representation analysis indicated that diet related proteins enriched biological pathways involved in cellular proliferation/metabolism and immune response/inflammation. However, we observed considerable overlap of proteins among the identified pathways. The relatively modest number of proteins that successfully mapped to KEGG pathways may have hindered a thorough enrichment analysis. Lastly, our observation that concentrations of E selectin were related to a poorer DASH diet score and a variant of the ABO gene that is directly associated with CAD may delineate a functional link between diet and metabolic health.
To the best of our knowledge, only two prior studies have examined proteomic profiles of dietary patterns [38,39]. A recent investigation by Warensjo Lemming et al. examined a panel of 184 proteins and identified 59 proteins associated with Swedish population empirically derived dietary patterns; 21 of which were validated in an independent cohort [39]. We observed significant positive associations with five of the 21 proteins (ERBB1 [EGFR], insulin like growth factor binding protein 1 [IGFBP1], programmed death ligand 2 [PDL2], galectin-3 [Gal3], and contactin 1 [CNTN1]) that are involved in processes including cellular metabolism, cellular proliferation, immune response, and cellular adhesion. Prior experimental studies indicate that gene and/or protein expression of ERBB1, PDL2, and CNTN1 is atheroprotective [40,41,42]. Further, multiple studies have reported that low concentrations of IGEBP1 are directly associated with glucose intolerance and risk of diabetes mellitus [43,44]. Notably, ERBB1 and CNTN1 were found to be inversely associated with cardiometabolic risk and/or incidence CVD [11,45]. In contrast, prior work has identified direct associations between Gal3 and heart failure [46]. Thus, the direct association of Gal3 with healthy dietary patterns warrants further investigation.
Perhaps our most intriguing finding is the unique proteomic signatures, or lack thereof, we observed across dietary patterns. Notably, the DASH diet score was associated with a unique signature of 52 proteins, which enriched pathways involved in cellular metabolism, hypoxia, inflammation, and atherosclerosis. Clinical trials have demonstrated the efficacy of the DASH diet in lowering blood pressure [3] and epidemiological studies have found that adherence to the DASH diet is associated with reduced risk of hypertension, CVD, and mortality [19,47,48]. Additional studies are needed to determine if proteins in this unique signature are associated with blood pressure lowering and other cardio-protective qualities of the DASH diet.
Similar to our investigation, two prior studies comparing hypothesis-driven dietary patterns reported just a modest number of unique dietary pattern and metabolite associations [49,50]. A higher degree of similarities across metabolomic signatures of healthy dietary patterns might indicate a generalized metabolic response of an overall healthy dietary pattern. Prior studies have reported that a large proportion of the metabolites associated with dietary patterns are lipids [49,50,51]. Lipids represented 63% of the metabolites associated with all three dietary patterns. We observed that lipids directly associated with a higher diet quality tended to have ≥5 carbon double bonds. Further, we observed that genetic variants (rs174548 and rs174550) associated with distinct highly-unsaturated lipid species had concordant associations with blood triglycerides and high-density lipoprotein metabolism [52,53]. Previous studies have found that highly-unsaturated lipids, with a longer acyl-chain length have inverse associations with risk of CVD and diabetes mellitus [54,55,56,57]. Hence, lipid correlates of dietary patterns, particularly highly-unsaturated lipids, may serve as markers of overall diet quality and may be directly related to pathogenesis of cardiometabolic and other chronic disease risks.
Lastly, we note that concentrations of several metabolites associated with the respective dietary patterns could be influenced by composition of the gut microbiome. This includes metabolites involved in choline metabolism (phosphotidylcholine, choline, and betaine), bile acid metabolism (glycocholate, deoxycholate, and deoxyglycholoate), and amino acid metabolism (tryptophan, indoxylsufate, proline, and hydroxyproline). Such metabolites have previously been linked to inflammation, chronic kidney disease, and CVD [58,59,60,61]. Metabolites related to dietary patterns and the gut microbiome may represent the functional response of diet—microbial interactions that influence metabolic health, a premise that warrants further evaluation.
The present study has several strengths. The Framingham Offspring Study is a well-established cohort with a comprehensive assessment of phenotypic, lifestyle, and dietary data on participants. We used a multiplexed aptamer-based high-throughput assay to identify and quantify a large number of plasma proteins. Lastly, we assessed three complementary dietary pattern indices that are extensively reviewed in the literature and can be readily reproduced in other study populations. Limitations of our investigation include the use of self-reported dietary data, which is prone to measurement error that may lead to misclassification and attenuation of observed associations. A more comprehensive metabolomic profile would aid in direct comparisons across studies. A large proportion of the metabolites associated with dietary patterns were lipid species that do not map to the KEGG functional database. This precluded a thorough enrichment analysis of metabolites related to dietary patterns. Participants from the Framingham Offspring Study are predominantly white and of European ancestry. Hence, our results may not be generalizable across populations that are more racially/ethnically diverse. We conducted a cross-sectional analysis and, therefore, cannot determine causality of any of the observed associations, and cannot exclude the possibility of uncontrolled or residual confounding.
In summary, the present investigation identified proteomic and metabolomic correlates of three dietary patterns. The DASH and AHEI were associated with unique proteomic signatures; whereas the largest metabolomic ‘signature’ was associated with all three dietary patterns. Proteins and metabolites related to dietary patterns may have prognostic value and inform future clinical interventions. Additional work, in in vitro and in vivo settings, is warranted to identify genetic determinants of dietary correlates and examine how they may relate to the progression of modifiable chronic disease. Findings from this investigation will require replication in independent and ethnically diverse populations.
Supplementary Materials
The following are available online at https://www.mdpi.com/2072-6643/12/5/1476/s1, Supplementary Figure S1. Participant flow diagram, Supplementary Table S1. Statistically significant associations of dietary patterns with plasma protein concentrations, Supplementary Table S2. Statistically significant associations of dietary patterns with plasma metabolite concentrations, Supplementary Table S3. Pathway over representation analysis of protein markers associated with the AHEI and DASH dietary pattern indices, Supplementary Table S4. KEGG pathway mapping of metabolites associated with dietary pattern indices.
Author Contributions
Formal analysis, M.E.W., R.J.S. and X.X.; Funding acquisition, R.E.G. and R.S.V.; Methodology, D.N., C.B.C. and V.X.; Writing—original draft, M.E.W.; Writing—review & editing, R.J.S., X.X., R.E.G., D.N., C.B.C., L.C., J.M., V.X., P.F.J. and R.S.V. All authors have read and agreed to the published version of the manuscript.
Funding
This work was supported by the NIH Multidisciplinary Training Program in Cardiovascular Epidemiology (5T32HL125232), the NIH National Heart Lung and Blood Institute (NHLBI) Framingham Heart Study (Contract Nos. NO1-HC-25195 and HHSN268201500001I and 75N92019D00031; and P20 HL113444 and P30 DK020579), NIH R01 DK108159, NIH R01 HL132320, NIH R01 DK081572, NIH R01 HL133870, and NIH R01 AG063507. Dr. Jacques is supported in part by the U.S. Department of Agriculture, Agricultural Research Service (ARS, Agreement No. #58-1950-4-003). Dr. Ma is supported in part by the NHLBI K22 (K22 HL135075-01) award. Dr. Vasan is supported in part by the Evans Medical Foundation and the Jay and Louis Coffman Endowment from the Department of Medicine, Boston University School of Medicine. Any opinions, findings, conclusions or recommendations expressed in this publication are those of the author(s) and do not necessarily reflect the view of the NIH or the ARS.
Acknowledgments
We thank and acknowledge employees and participants of the Framingham Heart Study, without whom this research would not be possible.
Conflicts of Interest
All authors declare no conflict of interest.
References
- Micha, R.; Peñalvo, J.L.; Cudhea, F.; Imamura, F.; Rehm, C.D.; Mozaffarian, D. Association Between Dietary Factors and Mortality From Heart Disease, Stroke, and Type 2 Diabetes in the United States. JAMA 2017, 317, 912–924. [Google Scholar] [CrossRef] [PubMed]
- Estruch, R.; Ros, E.; Salas-Salvadó, J.; Covas, M.-I.; Corella, D.; Arós, F.; Gómez-Gracia, E.; Ruiz-Gutiérrez, V.; Fiol, M.; Lapetra, J.; et al. Primary Prevention of Cardiovascular Disease with a Mediterranean Diet Supplemented with Extra-Virgin Olive Oil or Nuts. N. Engl. J. Med. 2018, 378, e34. [Google Scholar] [CrossRef] [PubMed]
- Appel, L.J.; Moore, T.J.; Obarzanek, E.; Vollmer, W.M.; Svetkey, L.P.; Sacks, F.M.; Bray, G.A.; Vogt, T.M.; Cutler, J.A.; Windhauser, M.M.; et al. A Clinical Trial of the Effects of Dietary Patterns on Blood Pressure. N. Engl. J. Med. 1997, 336, 1117–1124. [Google Scholar] [CrossRef] [PubMed]
- Reedy, J.; Krebs-Smith, S.M.; Miller, P.E.; Liese, A.D.; Kahle, L.L.; Park, Y.; Subar, A.F. Higher diet quality is associated with decreased risk of all-cause, cardiovascular disease, and cancer mortality among older adults. J. Nutr. 2014, 144, 881–889. [Google Scholar] [CrossRef]
- Harmon, B.E.; Boushey, C.J.; Shvetsov, Y.B.; Ettienne, R.; Reedy, J.; Wilkens, L.R.; Le Marchand, L.; Henderson, B.E.; Kolonel, L.N. Associations of key diet-quality indexes with mortality in the Multiethnic Cohort: The Dietary Patterns Methods Project. Am. J. Clin. Nutr. 2015, 101, 587–597. [Google Scholar] [CrossRef]
- Brennan, L.; Hu, F.B. Metabolomics-Based Dietary Biomarkers in Nutritional Epidemiology-Current Status and Future Opportunities. Mol. Nutr. Food Res. 2019, 63, e1701064. [Google Scholar] [CrossRef]
- Playdon, M.C.; Ziegler, R.G.; Sampson, J.N.; Stolzenberg-Solomon, R.; Thompson, H.J.; Irwin, M.L.; Mayne, S.T.; Hoover, R.N.; Moore, S.C. Nutritional metabolomics and breast cancer risk in a prospective study. Am. J. Clin. Nutr. 2017, 106, 637–649. [Google Scholar] [CrossRef]
- Guertin, K.A.; Loftfield, E.; Boca, S.M.; Sampson, J.N.; Moore, S.C.; Xiao, Q.; Huang, W.-Y.; Xiong, X.; Freedman, N.D.; Cross, A.J.; et al. Serum biomarkers of habitual coffee consumption may provide insight into the mechanism underlying the association between coffee consumption and colorectal cancer. Am. J. Clin. Nutr. 2015, 101, 1000–1011. [Google Scholar] [CrossRef]
- Akbaraly, T.; Würtz, P.; Singh-Manoux, A.; Shipley, M.J.; Haapakoski, R.; Lehto, M.; Desrumaux, C.; Kähönen, M.; Lehtimäki, T.; Mikkilä, V.; et al. Association of circulating metabolites with healthy diet and risk of cardiovascular disease: Analysis of two cohort studies. Sci. Rep. 2018, 8, 1–14. [Google Scholar] [CrossRef]
- Kannel, W.B.; Feinleib, M.; McNamara, P.M.; Garrison, R.J.; Castelli, W.P. An investigation of coronary heart disease in families. The Framingham offspring study. Am. J. Epidemiol. 1979, 110, 281–290. [Google Scholar] [CrossRef]
- Ngo, D.; Sinha, S.; Shen, D.; Kuhn, E.W.; Keyes, M.J.; Shi, X.; Benson, M.D.; O’Sullivan, J.F.; Keshishian, H.; Farrell, L.A.; et al. Aptamer-Based Proteomic Profiling Reveals Novel Candidate Biomarkers and Pathways in Cardiovascular Disease. Circulation 2016, 134, 270–285. [Google Scholar] [CrossRef] [PubMed]
- Ko, D.; Benson, M.D.; Ngo, D.; Yang, Q.; Larson, M.G.; Wang, T.J.; Trinquart, L.; McManus, D.D.; Lubitz, S.A.; Ellinor, P.T.; et al. Proteomics Profiling and Risk of New-Onset Atrial Fibrillation: Framingham Heart Study. J. Am. Heart Assoc. 2019, 8, e010976. [Google Scholar] [CrossRef] [PubMed]
- Wang, T.J.; Larson, M.G.; Vasan, R.S.; Cheng, S.; Rhee, E.P.; McCabe, E.; Lewis, G.D.; Fox, C.S.; Jacques, P.F.; Fernandez, C.; et al. Metabolite profiles and the risk of developing diabetes. Nat. Med. 2011, 17, 448–453. [Google Scholar] [CrossRef] [PubMed]
- Rhee, E.P.; Cheng, S.; Larson, M.G.; Walford, G.A.; Lewis, G.D.; McCabe, E.; Yang, E.; Farrell, L.; Fox, C.S.; O’Donnell, C.J.; et al. Lipid profiling identifies a triacylglycerol signature of insulin resistance and improves diabetes prediction in humans. J. Clin. Investig. 2011, 121, 1402–1411. [Google Scholar] [CrossRef]
- Wang, T.J.; Ngo, D.; Psychogios, N.; Dejam, A.; Larson, M.G.; Vasan, R.S.; Ghorbani, A.; O’Sullivan, J.; Cheng, S.; Rhee, E.P.; et al. 2-Aminoadipic acid is a biomarker for diabetes risk. J. Clin. Investig. 2013, 123, 4309–4317. [Google Scholar] [CrossRef]
- Feskanich, D.; Rimm, E.B.; Giovannucci, E.L.; Colditz, G.A.; Stampfer, M.J.; Litin, L.B.; Willett, W.C. Reproducibility and validity of food intake measurements from a semiquantitative food frequency questionnaire. J. Am. Diet. Assoc. 1993, 93, 790–796. [Google Scholar] [CrossRef]
- Willett, W. Nutritional Epidemiology; Oxford University Press: Oxford, UK, 2012; ISBN 978-0-19-024084-4. [Google Scholar]
- Fung, T.T.; Rexrode, K.M.; Mantzoros, C.S.; Manson, J.E.; Willett, W.C.; Hu, F.B. Mediterranean Diet and Incidence of and Mortality From Coronary Heart Disease and Stroke in Women. Circulation 2009, 119, 1093–1100. [Google Scholar] [CrossRef]
- Fung, T.T.; Chiuve, S.E.; McCullough, M.L.; Rexrode, K.M.; Logroscino, G.; Hu, F.B. Adherence to a DASH-style diet and risk of coronary heart disease and stroke in women. Arch. Intern. Med. 2008, 168, 713–720. [Google Scholar] [CrossRef]
- Chiuve, S.E.; Fung, T.T.; Rimm, E.B.; Hu, F.B.; McCullough, M.L.; Wang, M.; Stampfer, M.J.; Willett, W.C. Alternative dietary indices both strongly predict risk of chronic disease. J. Nutr. 2012, 142, 1009–1018. [Google Scholar] [CrossRef]
- Ma, J.; Hennein, R.; Liu, C.; Long, M.T.; Hoffmann, U.; Jacques, P.F.; Lichtenstein, A.H.; Hu, F.B.; Levy, D. Improved Diet Quality Associates With Reduction in Liver Fat, Particularly in Individuals With High Genetic Risk Scores for Nonalcoholic Fatty Liver Disease. Gastroenterology 2018, 155, 107–117. [Google Scholar] [CrossRef]
- Kannel, W.B.; Sorlie, P. Some health benefits of physical activity. The Framingham Study. Arch. Intern. Med. 1979, 139, 857–861. [Google Scholar] [CrossRef] [PubMed]
- Liao, Y.; Wang, J.; Jaehnig, E.J.; Shi, Z.; Zhang, B. WebGestalt 2019: Gene set analysis toolkit with revamped UIs and APIs. Nucleic Acids Res. 2019, 47, W199–W205. [Google Scholar] [CrossRef] [PubMed]
- Kanehisa, M.; Goto, S. KEGG: Kyoto encyclopedia of genes and genomes. Nucleic Acids Res. 2000, 28, 27–30. [Google Scholar] [CrossRef] [PubMed]
- Rhee, E.P.; Ho, J.E.; Chen, M.-H.; Shen, D.; Cheng, S.; Larson, M.G.; Ghorbani, A.; Shi, X.; Helenius, I.T.; O’Donnell, C.J.; et al. A Genome-Wide Association Study of the Human Metabolome in a Community-Based Cohort. Cell Metab. 2013, 18, 130–143. [Google Scholar] [CrossRef]
- Benson, M.D.; Yang, Q.; Ngo, D.; Zhu, Y.; Shen, D.; Farrell, L.A.; Sinha, S.; Keyes, M.J.; Vasan, R.S.; Larson, M.G.; et al. Genetic Architecture of the Cardiovascular Risk Proteome. Circulation 2018, 137, 1158–1172. [Google Scholar] [CrossRef]
- MacArthur, J.; Bowler, E.; Cerezo, M.; Gil, L.; Hall, P.; Hastings, E.; Junkins, H.; McMahon, A.; Milano, A.; Morales, J.; et al. The new NHGRI-EBI Catalog of published genome-wide association studies (GWAS Catalog). Nucleic Acids Res. 2017, 45, D896–D901. [Google Scholar] [CrossRef]
- Van der Harst, P.; Verweij, N. Identification of 64 Novel Genetic Loci Provides an Expanded View on the Genetic Architecture of Coronary Artery Disease. Circ. Res. 2018, 122, 433–443. [Google Scholar] [CrossRef]
- Lindström, S.; Wang, L.; Smith, E.N.; Gordon, W.; van Hylckama Vlieg, A.; de Andrade, M.; Brody, J.A.; Pattee, J.W.; Haessler, J.; Brumpton, B.M.; et al. Genomic and transcriptomic association studies identify 16 novel susceptibility loci for venous thromboembolism. Blood 2019, 134, 1645–1657. [Google Scholar] [CrossRef]
- Lemaitre, R.N.; Tanaka, T.; Tang, W.; Manichaikul, A.; Foy, M.; Kabagambe, E.K.; Nettleton, J.A.; King, I.B.; Weng, L.-C.; Bhattacharya, S.; et al. Genetic loci associated with plasma phospholipid n-3 fatty acids: A meta-analysis of genome-wide association studies from the CHARGE Consortium. PLoS Genet. 2011, 7, e1002193. [Google Scholar] [CrossRef]
- Guan, W.; Steffen, B.T.; Lemaitre, R.N.; Wu, J.H.Y.; Tanaka, T.; Manichaikul, A.; Foy, M.; Rich, S.S.; Wang, L.; Nettleton, J.A.; et al. Genome-wide association study of plasma N6 polyunsaturated fatty acids within the cohorts for heart and aging research in genomic epidemiology consortium. Circ. Cardiovasc. Genet. 2014, 7, 321–331. [Google Scholar] [CrossRef]
- Dupuis, J.; Langenberg, C.; Prokopenko, I.; Saxena, R.; Soranzo, N.; Jackson, A.U.; Wheeler, E.; Glazer, N.L.; Bouatia-Naji, N.; Gloyn, A.L.; et al. New genetic loci implicated in fasting glucose homeostasis and their impact on type 2 diabetes risk. Nat. Genet. 2010, 42, 105–116. [Google Scholar] [CrossRef] [PubMed]
- Wojcik, G.L.; Graff, M.; Nishimura, K.K.; Tao, R.; Haessler, J.; Gignoux, C.R.; Highland, H.M.; Patel, Y.M.; Sorokin, E.P.; Avery, C.L.; et al. Genetic analyses of diverse populations improves discovery for complex traits. Nature 2019, 570, 514–518. [Google Scholar] [CrossRef] [PubMed]
- Nelson, C.P.; Goel, A.; Butterworth, A.S.; Kanoni, S.; Webb, T.R.; Marouli, E.; Zeng, L.; Ntalla, I.; Lai, F.Y.; Hopewell, J.C.; et al. Association analyses based on false discovery rate implicate new loci for coronary artery disease. Nat. Genet. 2017, 49, 1385–1391. [Google Scholar] [CrossRef] [PubMed]
- Gold, L.; Ayers, D.; Bertino, J.; Bock, C.; Bock, A.; Brody, E.N.; Carter, J.; Dalby, A.B.; Eaton, B.E.; Fitzwater, T.; et al. Aptamer-based multiplexed proteomic technology for biomarker discovery. PLoS ONE 2010, 5, e15004. [Google Scholar] [CrossRef] [PubMed]
- Carayol, J.; Chabert, C.; Cara, A.D.; Armenise, C.; Lefebvre, G.; Langin, D.; Viguerie, N.; Metairon, S.; Saris, W.H.M.; Astrup, A.; et al. Protein quantitative trait locus study in obesity during weight-loss identifies a leptin regulator. Nat. Commun. 2017, 8, 1–14. [Google Scholar] [CrossRef]
- Ruffieux, H.; Carayol, J.; Harper, M.E.; Dent, R.; Saris, W.H.M.; Astrup, A.; Davison, A.C.; Hager, J.; Valsesia, A. A large-scale multivariate pQTL study sheds light on the genetic architecture of obesity. bioRxiv 2019, 524405. [Google Scholar] [CrossRef]
- García-Bailo, B.; Brenner, D.R.; Nielsen, D.; Lee, H.-J.; Domanski, D.; Kuzyk, M.; Borchers, C.H.; Badawi, A.; Karmali, M.A.; El-Sohemy, A. Dietary patterns and ethnicity are associated with distinct plasma proteomic groups. Am. J. Clin. Nutr. 2012, 95, 352–361. [Google Scholar] [CrossRef]
- Warensjö Lemming, E.; Byberg, L.; Stattin, K.; Ahmad, S.; Lind, L.; Elmståhl, S.; Larsson, S.C.; Wolk, A.; Michaëlsson, K. Dietary Pattern Specific Protein Biomarkers for Cardiovascular Disease: A Cross-Sectional Study in 2 Independent Cohorts. J. Am. Heart Assoc. 2019, 8, e011860. [Google Scholar] [CrossRef]
- Wang, L.; Huang, Z.; Huang, W.; Chen, X.; Shan, P.; Zhong, P.; Khan, Z.; Wang, J.; Fang, Q.; Liang, G.; et al. Inhibition of epidermal growth factor receptor attenuates atherosclerosis via decreasing inflammation and oxidative stress. Sci. Rep. 2017, 7, 1–14. [Google Scholar] [CrossRef]
- Simons, K.H.; de Jong, A.; Jukema, J.W.; de Vries, M.R.; Arens, R.; Quax, P.H.A. T cell co-stimulation and co-inhibition in cardiovascular disease: A double-edged sword. Nat. Rev. Cardiol. 2019, 16, 325–343. [Google Scholar] [CrossRef]
- Nai, W.; Threapleton, D.; Lu, J.; Zhang, K.; Wu, H.; Fu, Y.; Wang, Y.; Ou, Z.; Shan, L.; Ding, Y.; et al. Identification of novel genes and pathways in carotid atheroma using integrated bioinformatic methods. Sci. Rep. 2016, 6, 1–11. [Google Scholar] [CrossRef] [PubMed]
- Sandhu, M.S.; Heald, A.H.; Gibson, J.M.; Cruickshank, J.K.; Dunger, D.B.; Wareham, N.J. Circulating concentrations of insulin-like growth factor-I and development of glucose intolerance: A prospective observational study. Lancet 2002, 359, 1740–1745. [Google Scholar] [CrossRef]
- Lewitt, M.S.; Hilding, A.; Ostenson, C.-G.; Efendic, S.; Brismar, K.; Hall, K. Insulin-like growth factor-binding protein-1 in the prediction and development of type 2 diabetes in middle-aged Swedish men. Diabetologia 2008, 51, 1135–1145. [Google Scholar] [CrossRef] [PubMed]
- Ho Jennifer, E.; Lyass, A.; Courchesne, P.; Chen, G.; Liu, C.; Yin, X.; Hwang, S.-J.; Massaro, J.M.; Larson, M.G.; Levy, D. Protein Biomarkers of Cardiovascular Disease and Mortality in the Community. J. Am. Heart Assoc. 2018, 7, e008108. [Google Scholar] [CrossRef]
- Ho, J.E.; Liu, C.; Lyass, A.; Courchesne, P.; Pencina, M.J.; Vasan, R.S.; Larson, M.G.; Levy, D. Galectin-3, a Marker of Cardiac Fibrosis, Predicts Incident Heart Failure in the Community. J. Am. Coll. Cardiol. 2012, 60, 1249–1256. [Google Scholar] [CrossRef] [PubMed]
- Forman, J.P.; Stampfer, M.J.; Curhan, G.C. Diet and lifestyle risk factors associated with incident hypertension in women. JAMA 2009, 302, 401–411. [Google Scholar] [CrossRef] [PubMed]
- Schwingshackl, L.; Hoffmann, G. Diet quality as assessed by the Healthy Eating Index, the Alternate Healthy Eating Index, the Dietary Approaches to Stop Hypertension score, and health outcomes: A systematic review and meta-analysis of cohort studies. J. Acad. Nutr. Diet. 2015, 115, 780–800.e5. [Google Scholar] [CrossRef]
- Playdon, M.C.; Moore, S.C.; Derkach, A.; Reedy, J.; Subar, A.F.; Sampson, J.N.; Albanes, D.; Gu, F.; Kontto, J.; Lassale, C.; et al. Identifying biomarkers of dietary patterns by using metabolomics. Am. J. Clin. Nutr. 2017, 105, 450–465. [Google Scholar] [CrossRef]
- McCullough, M.L.; Maliniak, M.L.; Stevens, V.L.; Carter, B.D.; Hodge, R.A.; Wang, Y. Metabolomic markers of healthy dietary patterns in US postmenopausal women. Am. J. Clin. Nutr. 2019, 109, 1439–1451. [Google Scholar] [CrossRef]
- Rebholz, C.M.; Lichtenstein, A.H.; Zheng, Z.; Appel, L.J.; Coresh, J. Serum untargeted metabolomic profile of the Dietary Approaches to Stop Hypertension (DASH) dietary pattern. Am. J. Clin. Nutr. 2018, 108, 243–255. [Google Scholar] [CrossRef]
- Waterworth, D.M.; Ricketts, S.L.; Song, K.; Chen, L.; Zhao, J.H.; Ripatti, S.; Aulchenko, Y.S.; Zhang, W.; Yuan, X.; Lim, N.; et al. Genetic variants influencing circulating lipid levels and risk of coronary artery disease. Arterioscler. Thromb. Vasc. Biol. 2010, 30, 2264–2276. [Google Scholar] [CrossRef]
- Hoffmann, T.J.; Theusch, E.; Haldar, T.; Ranatunga, D.K.; Jorgenson, E.; Medina, M.W.; Kvale, M.N.; Kwok, P.-Y.; Schaefer, C.; Krauss, R.M.; et al. A large electronic health record-based genome-wide study of serum lipids. Nat. Genet. 2018, 50, 401–413. [Google Scholar] [CrossRef] [PubMed]
- Stegemann, C.; Pechlaner, R.; Willeit, P.; Langley, S.R.; Mangino, M.; Mayr, U.; Menni, C.; Moayyeri, A.; Santer, P.; Rungger, G.; et al. Lipidomics Profiling and Risk of Cardiovascular Disease in the Prospective Population-Based Bruneck Study. Circulation 2014, 129, 1821–1831. [Google Scholar] [CrossRef]
- Rhee, E.P.; Yang, Q.; Yu, B.; Liu, X.; Cheng, S.; Deik, A.; Pierce, K.A.; Bullock, K.; Ho, J.E.; Levy, D.; et al. An exome array study of the plasma metabolome. Nat. Commun. 2016, 7, 12360. [Google Scholar] [CrossRef] [PubMed]
- Wang, D.D.; Zheng, Y.; Toledo, E.; Razquin, C.; Ruiz-Canela, M.; Guasch-Ferré, M.; Yu, E.; Corella, D.; Gómez-Gracia, E.; Fiol, M.; et al. Lipid metabolic networks, Mediterranean diet and cardiovascular disease in the PREDIMED trial. Int. J. Epidemiol. 2018, 47, 1830–1845. [Google Scholar] [CrossRef] [PubMed]
- Toledo, E.; Wang, D.D.; Ruiz-Canela, M.; Clish, C.B.; Razquin, C.; Zheng, Y.; Guasch-Ferré, M.; Hruby, A.; Corella, D.; Gómez-Gracia, E.; et al. Plasma lipidomic profiles and cardiovascular events in a randomized intervention trial with the Mediterranean diet. Am. J. Clin. Nutr. 2017, 106, 973–983. [Google Scholar] [CrossRef]
- Ridlon, J.M.; Kang, D.J.; Hylemon, P.B.; Bajaj, J.S. Bile Acids and the Gut Microbiome. Curr. Opin. Gastroenterol. 2014, 30, 332–338. [Google Scholar] [CrossRef]
- Roager, H.M.; Licht, T.R. Microbial tryptophan catabolites in health and disease. Nat. Commun. 2018, 9, 1–10. [Google Scholar] [CrossRef]
- Yang, C.-Y.; Tarng, D.-C. Diet, gut microbiome and indoxyl sulphate in chronic kidney disease patients. Nephrology (Carlton) 2018, 23, 16–20. [Google Scholar] [CrossRef]
- Tang, W.H.W.; Wang, Z.; Levison, B.S.; Koeth, R.A.; Britt, E.B.; Fu, X.; Wu, Y.; Hazen, S.L. Intestinal Microbial Metabolism of Phosphatidylcholine and Cardiovascular Risk. N. Engl. J. Med. 2013, 368, 1575–1584. [Google Scholar] [CrossRef]


© 2020 by the authors. Licensee MDPI, Basel, Switzerland. This article is an open access article distributed under the terms and conditions of the Creative Commons Attribution (CC BY) license (http://creativecommons.org/licenses/by/4.0/).