2.1. Data
In Denmark, several types of food labels are in use, but for this study, the following two types have been selected: Description of Content and nutritional labels. (The data for the current analysis contains information on the use of three label groups: Description of Content, health claims and nutritional labels. Health claims are excluded in this analysis due to a small share of label users (15 to 17% of households) and because Danish consumers are skeptical of the health claims [
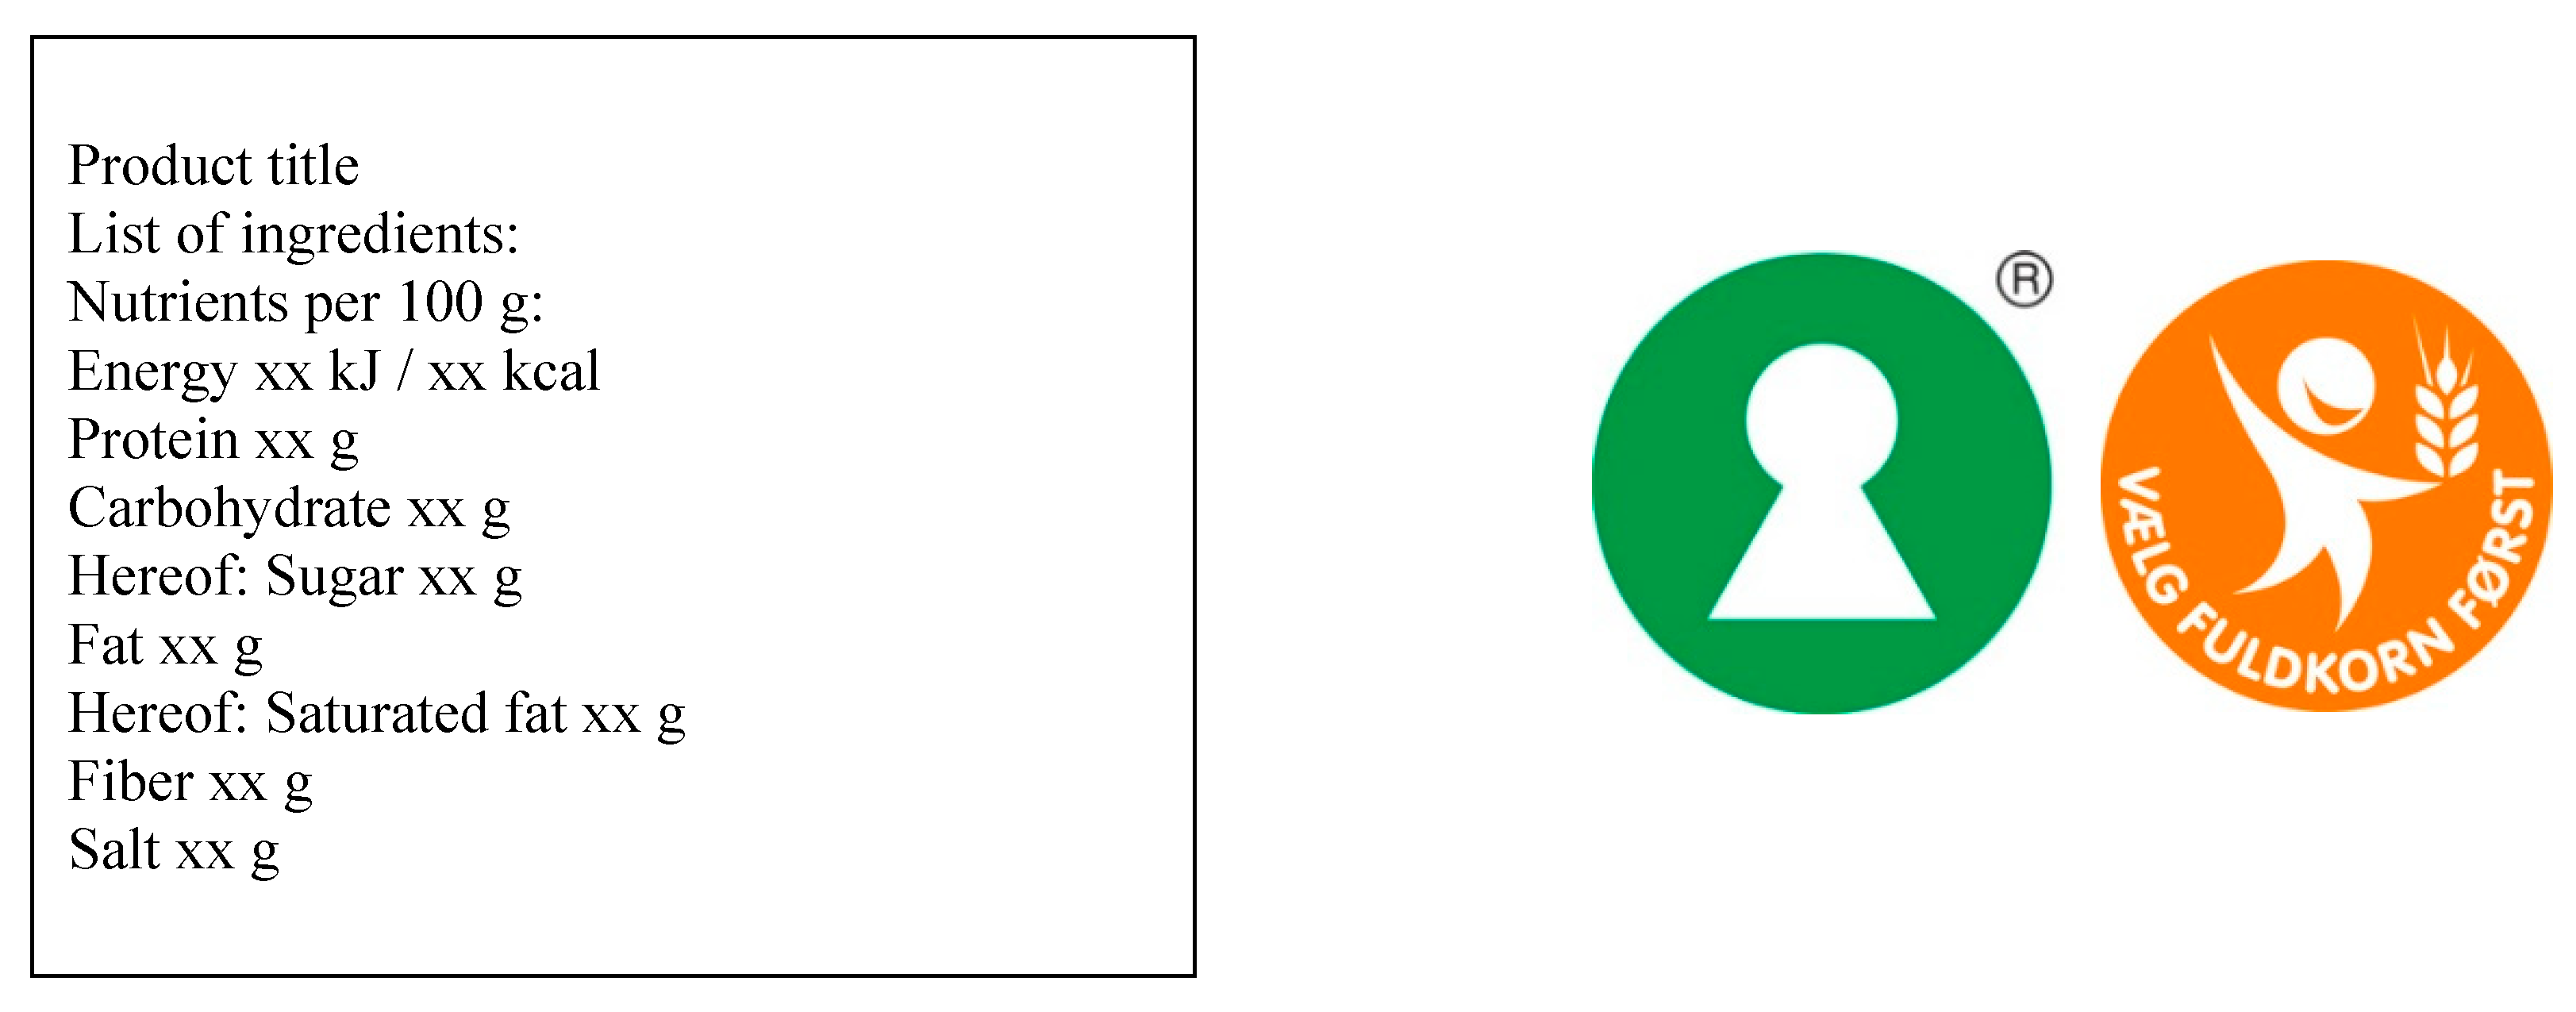
44]. Furthermore, health claims differ from the other labels because they do not necessarily help consumers to distinguish healthy alternatives within a product group, which is feasible with the Description of Content or the two selected nutritional labels.) The Description of Content (DoC) is an extensive BOP nutrition table, which is similar in format to the American Nutritional Facts (see
Figure 1). The label displays the content of carbohydrates, fat and protein in the product as well as the ingredients it contains. This label is mandatory for all prepackaged food products.
Nutritional labels (NL) consist of graphical FOP labels, which indicate whether the product is a healthy option within its product group. In Denmark, two FOP nutritional labels are in use: the Keyhole (Nøglehulsmærket) and the Whole Grain logo (Fuldkornsmærket).
The Keyhole label is used in the Scandinavian countries and Lithuania [
11]. In Denmark, the label is managed by the Danish Veterinary and Food Administration. The Keyhole label is used to identify healthy alternatives within a given product group and can be printed on pre-packed food products as well as fish, seafood, fruit, vegetables, cheese, bread, and unprocessed meat. The label is voluntary for the producers to print. A product is eligible for the Keyhole label when it complies with product group-specific criteria with respect to fat, sugar, salt and dietary fibers [
45].
The Whole Grain label is managed by the Danish Whole Grain Partnership, which aims to increase the intake of whole grain products in Denmark. Members of the partnership can print the logo on their product if the product complies with product-specific standards on whole grain. Members include supermarket chains as well as producers of flour, bread, etc. The Whole Grain logo is printed on grain products only (rye bread, pasta, etc.) [
46].
Both of the FOP nutritional labels provide an indication that the product is a healthy alternative within its product group, but do not provide a nutrition score or summary statistics of nutrients within the product. That is, they are evaluate labels indicating healthiness [
11]. In that sense, they are similar to the Smart Choice and Great for You labels used in the US [
19].
To investigate the effect of food labels on dietary quality, home-scan data from GfK Panel Services Scandinavia (hereafter abbreviated to GfK) was combined with two additional questionnaires and nutritional data from the National Food Institute (Technical University of Denmark) [
47]. The GfK data consists of grocery shopping data, where a consumer panel of approximately 2500 distinct households regularly report their grocery shopping. The members are recruited when they respond to market surveys from GfK and GfK aims to sustain a representative panel (see comparison for the subset of GfK panel used in this analysis versus general population in
Table A11). The panel members are incentivized to report their grocery shopping data with points, which they can use in a GfK-operated store. The selected data covers the years 2009–2016. The scanner data contains detailed information about the household’s purchases down to the brand level, and even the EAN level for some products, which makes it possible to merge it with nutritional data to evaluate the dietary quality of each purchase. The nutritional data contains information on calories, macronutrients (protein, fat, carbohydrates) and added sugar per 100 g, etc. The nutritional content is then multiplied by the volume of the purchased products to calculate the total consumption of each nutrient. The purchases are made at the household level, which means that it is not possible to access the consumption of individual household members. It is also not possible to observe how much of the purchased food is consumed or wasted. Therefore, I use consumption and purchase interchangeably in the remainder of this paper. The home-scan data provides the advantage that it covers all supermarkets compared to scanner data from a single supermarket chain. The home-scan data covers only food items bought in supermarkets and not food consumed at cafeterias or restaurants. However, since the selected food labels are only provided on packaged items in supermarket, the data is adequate for the purpose. The participating households annually report their background information such as age and gender of main shopper, household size, occupation, but also attitudes to cooking and shopping. These background variables are used as controls in the analysis.
Furthermore, two almost identical questionnaires were sent to the panel at the end of 2013 and 2015. The questionnaires contained questions about health habits, health attitudes, and health behavior including label use. In 2013, 1879 households answered the questionnaire, while 1774 households answered in 2015, which results in a balanced panel of 1210 households who answered both questionnaires (of the 1210 households, not all of them answered both questions on label use, which is why the total number of households differs when each label is evaluated separately (
Table 1) and jointly (
Table 2)). The use of food labels was measured by asking the respondents about their use of each of the two food labels during their most recent shopping trip. The questions were as follows:
“Did you read the Description of Content label on the products you bought?”
“Did you search for products with nutritional labels? (e.g., the Keyhole or Whole Grain label)”
For the first question, the response options were “Yes, for all items”, “For almost all items”, “For some items”, “No” and “Do not remember”. If the respondents answered the first three options, they are defined as users of the DoC. For the latter question, the respondents could answer either “Not at all”, “A bit”, “Some”, “A lot” or “Do not remember”. If the respondents answered “A bit”, “Some” or “A lot”, they are defined as users of NL. Respondents who answered “Do not remember” are coded as missing.
It is assumed that the use of food labels during the most recent shopping trip can be used to generalize whether a household uses food labels. I assume this for the following four reasons: first, the most recent shopping trip is easy for respondents to recall and, thus, they are less likely to avoid misstating use. Second, it is unlikely that households who rarely or never use labels will report label use during their most recent shopping trip. Therefore, they will be correctly identified as non-users when applying the most recent shopping trip. Another type of non-users consist of those who obtained the information in the past and, therefore, do not search for the information again. These can also be treated as non-users, since they do not search for new information in order to update their nutritional knowledge. Third, households who sometimes or often use labels are likely to search for food labels during their most recent shopping trip. If the household indicates that they used food labels during their most recent shopping trip, we know that they obtained new information in the observed period. Lastly, only 11% of the sample reported that their most recent shopping trip was unusual, which suggests that the most recent shopping trip is a good proxy for general shopping behavior. (The respondents are asked to describe their latest shopping trip using the statement “The shopping trip was as it usually is”. They can either answer “Agree”, “Partly agree”, “Neither agree or disagree”, “Partly disagree”, “disagree”. Their shopping trip is defined as unusual if they disagree or partly disagree with the statement. In that sense, it is not clear how it is different from their usual shopping trip.)
Approximately 25–27% of the households searched for products with NL, while 30–32% read the DoC. This is slightly higher than the share of users found in European countries by using in store observations (16.8%) [
38], but lower than the share of users in the US using self-reported general use (75.8%) [
14]. Because households are free to decide whether they use labels or not, some households use one label, while others choose to use both NL and DoC. Additionally, since there are two years where the households report their label use behavior, their behavior can be categorized as in
Table 1 and
Table 2.
Table 1 (left side) shows the number of households grouped according to their NL use status in 2013 and 2015. The use is abbreviated, where U stands for user of the label and N for non-user. For example, the UU refers to households that report using the given label in both years, while NU refers to households that do not report label use in the first year, but report label use in the second. The largest group consists of households that do not use labels in both years (
n = 676). The second largest group consists of households that use the labels in both years (
n = 158), while fewer switch behavior from use to non-use or vice versa.
Table 1 (right side) shows the number of households grouped according to their use of the DoC in 2013 and 2015. Most households do not use the DoC in both years (
n = 626), while fewer use DoC in both years (
n = 210).
Table 2 shows the label use status in each year where the use of each label is combined. As seen from
Table 2, the largest group consists of households that do not use either of the labels in both years (
n = 471). The second largest group is households that use both labels in both years (
n = 96).
These different groups facilitate an examination of whether the dietary quality of users differs from that of non-users before label use by comparing the dietary quality of switchers to that of non-users. Furthermore, by comparing the change in dietary quality of those that switch behavior, it is possible to examine whether the use of food labels improves dietary quality. The methodology is described in detail in
Section 3.
Dietary Quality
To measure dietary quality, I use a Healthy Eating Index (HEI) developed by Smed [
48]. The Healthy Eating Index is calculated based on the household’s compliance with six of the official Danish dietary guidelines:
Eat 6 pieces (600 g) of fruit and vegetables a day (potatoes are not included as a vegetable)—Children should eat 400 g.
Eat fish several times a week (at least 200 g a week).
Eat potatoes, rice, pasta or brown bread everyday (at least 3 g of fiber per 1 mega joule (MJ) of food consumed).
Reduce consumption of sugar—especially from soft drinks, sweets and cakes (a maximum of 10% of total energy intake should come from added sugar).
Reduce the amount of fats—especially from dairy products and meat (a maximum of 30% of total energy intake should come from fat).
A maximum of 10% of total energy intake should come from saturated fat.
A score is calculated based on compliance with each of these targets. The HEI ranges from 0 to 24.5, where an index of 24.5 is assigned for compliance with all the dietary guidelines. For each dietary guideline, a score between 0 and 10 is assigned depending on how well the household complies with the guideline, where 0 is non-compliance and 10 is full compliance. The index is calculated as:
The index is calculated on a monthly basis and then averaged to yearly observations due to seasonality. Since the HEI is composed of several components that do not have food labels (e.g., vegetables and the amount of fish eaten), I also examine the following three nutrients that are relevant for both labels: total fat, added sugar and fiber. To compare households of different sizes, the energy share for each nutrient is calculated as:
where kJ per gram for fat is 37, kJ per gram for added sugar is 17, and kJ per gram for fiber is 8.
2.2. Method
To establish a causal relationship between label use and healthy food choices, the panel dimension of the data is utilized by applying a difference-in-difference setup [
49]. Several issues need to be addressed to estimate the effect of food label use on dietary quality in the case where observational data is used rather than experimental data.
First, the use of food labels differs over time. The questionnaires allow us to examine the household’s use of the two different food labels at two points in time: end of 2013 and end of 2015. In this period, there was no change in labelling policy in Denmark and, thus, some households report label use in both years, others report no use in both years, and some households change their label use behavior over time. This is unlike the standard difference-in-difference setting in which no unit is enrolled in the program in the first time period, while some units are enrolled in the second period. This variation in label use over time allows the possibility to report label use in the first year, but not in the second—in other words, “to opt out” of label use.
Second, it is possible to use one or several labels at the same time. For example, some consumers choose only to look at the FOP labels, others look for elaborate information on the back of the product, and a third group utilizes all the available information and looks at both labels.
Third, the uptake of food label use is not randomly assigned. Therefore, the households decide whether to use labels or not themselves. This can cause selection bias issues if self-selected households differ in unobserved characteristics, e.g., preference for healthy food and nutritional knowledge compared to households which do not use food labels [
13]. These differences in unobserved characteristics can influence both the propensity to use labels and dietary quality. For example, consumers with more knowledge about the link between diet and health will be more likely to search for ways to plan a better diet (use food labels) and eat healthy (dietary quality).
Fourth, there is a potential difference in start date of label use. Since there was no policy change in the observed period and there is a two-year time gap between the questionnaires, the households can either start to use food labels in the beginning of 2014 or in the end of 2015. Thus, it is unknown when during the two-year period the individual household started to use food labels.
In sum, the following four issues impose a threat to identification: defining clear treatment and control groups, multiple label use, selection, and difference in start date.
The applied identification strategy tackles the issues in the following way:
First, the change in label use status is used to identify the effect of label use in a difference-in-difference design, where a treatment group is constructed as the household that states that they do not use labels in the first year and that they use labels in the second year. I refer to these as “NL switchers” for those that start to use NL and “DoC switchers” for those that start to use the DoC. When the use of both labels is examined, I refer to the households that start to use both labels as “Both switchers”. In the baseline case, the control group consists of those households that do not report label use in both years. The households that report label use in the first year, but do not report it in the second year (the “opt-outs”), are a special case that needs attention. These households have obtained the label information previously and no longer actively search for information. The household still possesses this knowledge even though they do not continue to read food labels on a regular basis [
40]. As a sensitivity check, this group is included in an extended control group along with the households that report label use in both years.
Second, the use of multiple labels is handled by including multiple treatments that are either use of one label or both labels. First, I examine the use of each label separately, not controlling for the other one, and then I combine the use of the two labels to see whether using both labels has an additional effect. In other words, households that start to use NL, DoC or both are evaluated as three separate programs and compared to a reference group that consists of non-users. The non-users of both labels are used as a control group in the baseline regression and as a robustness check, the households which exhibit constant use of one of the labels or both are included in an extended control group as a sensitivity check.
Third, selection is handled by including controls for observables for which there is selection. Furthermore, a treatment group fixed effect allows one to control for factors that are time invariant and unobserved and potentially correlated with propensity to use labels, such as preferences. As a sensitivity check, I add individual fixed effects to the regression instead of a group fixed effects. However, it should be noted that I cannot control for unobservable factors that are time variant unless they are correlated with observables, which we must assume is the case. For example, controlling for health attitude or diet status over time will be correlated with other attitudes and lifestyle changes. Since I cannot control for all variables that influence selection into label use, the results should be interpreted as average treatment effect on the treated rather than an average treatment effect.
Fourth, to handle the problem of an unknown switching time, dietary quality is evaluated post the last questionnaire, i.e., we compare dietary quality in 2013 and 2016. It is assumed that the effect of food labels on dietary quality is constant over time such that the effect does not differ for those households that switch at an early point compared to those who switched behavior at a later point.
The expected outcome can be written as:
where
is the outcome (dietary quality) in period t; d is the treatment status, which takes the value 1 in the case of treatment and the value 0 if not treated; D is treatment, which can take four values:
, which are NL, DoC, Both and no-use, respectively, depending on the regression.
To identify the effect of using food labels, I assume common trends. In the regression framework where NL and DoC are examined, this implies:
Without treatment—in this case, label use—the switcher groups would have followed the same trend as the given control group. In the regression, where the use of both labels is included, the two above assumptions are maintained as well as the following assumption (In the regression where use of both labels is combined, NL switchers are defined as those who start to use NL in the observed period, while either not using DoC or using DoC in both years to keep the other label constant. Likewise, DoC switchers are defined as those who start to use DoC in the observed period, while either not using NL or using NL in both years.):
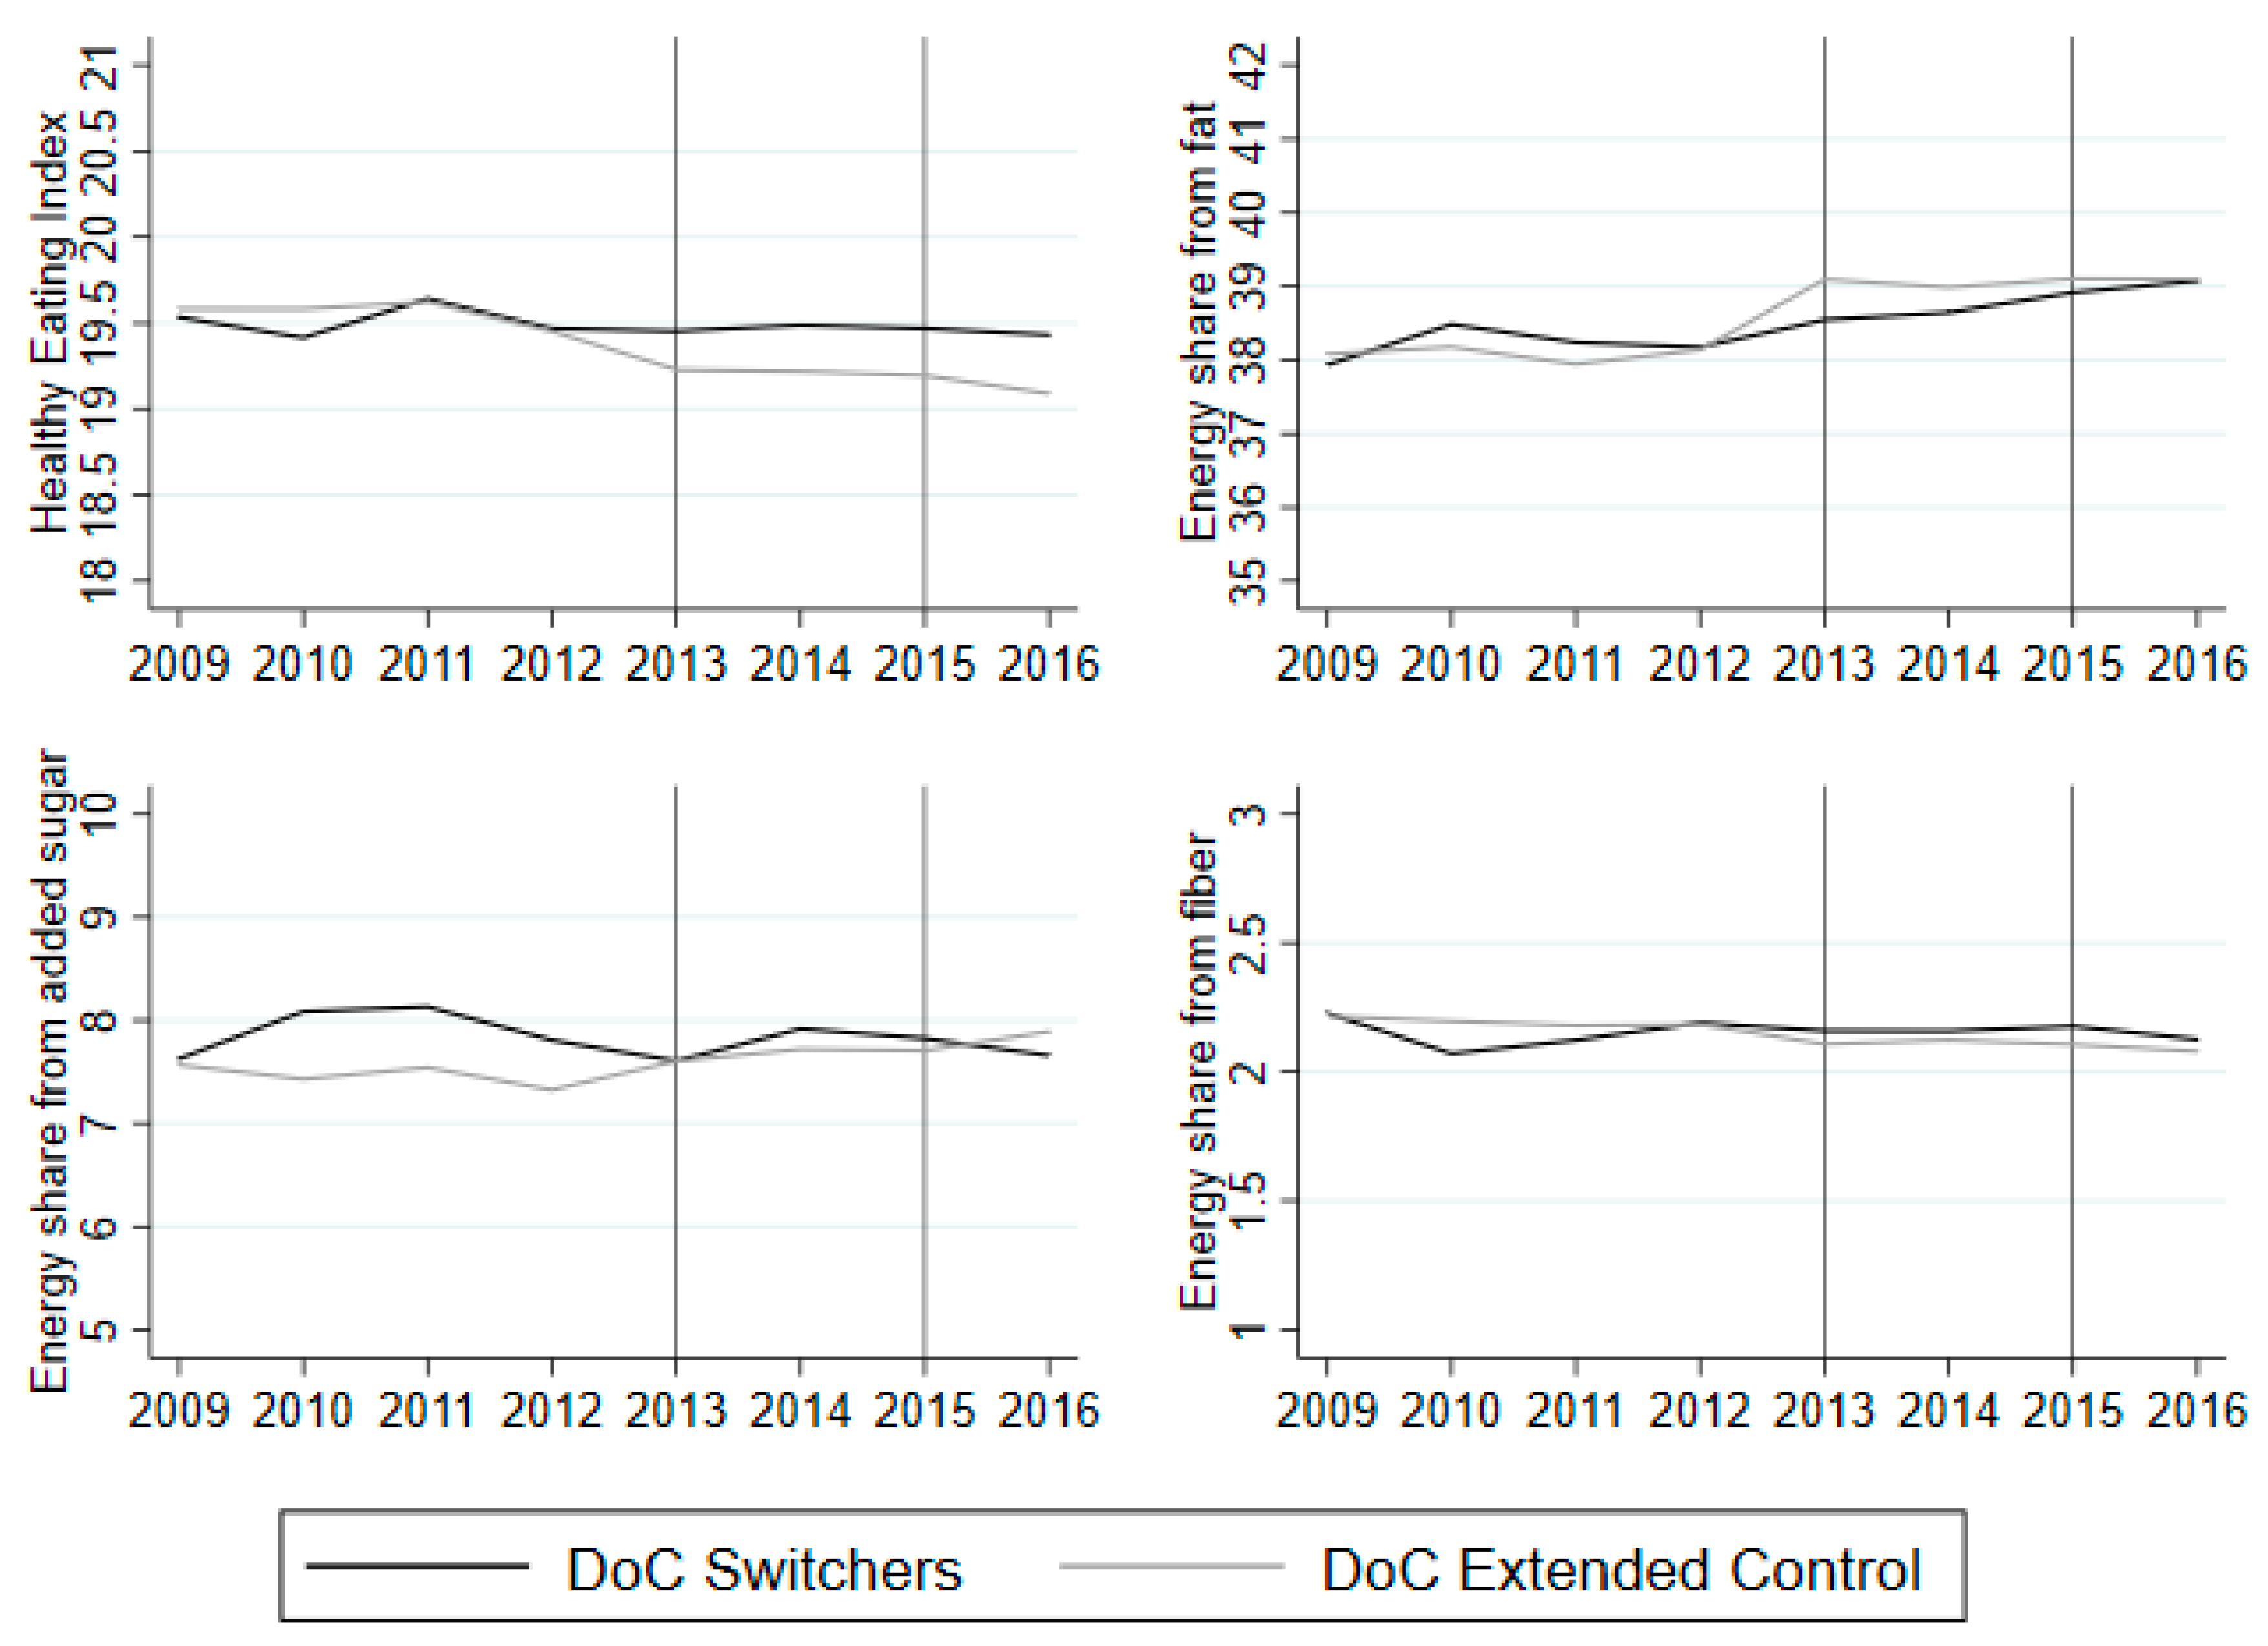
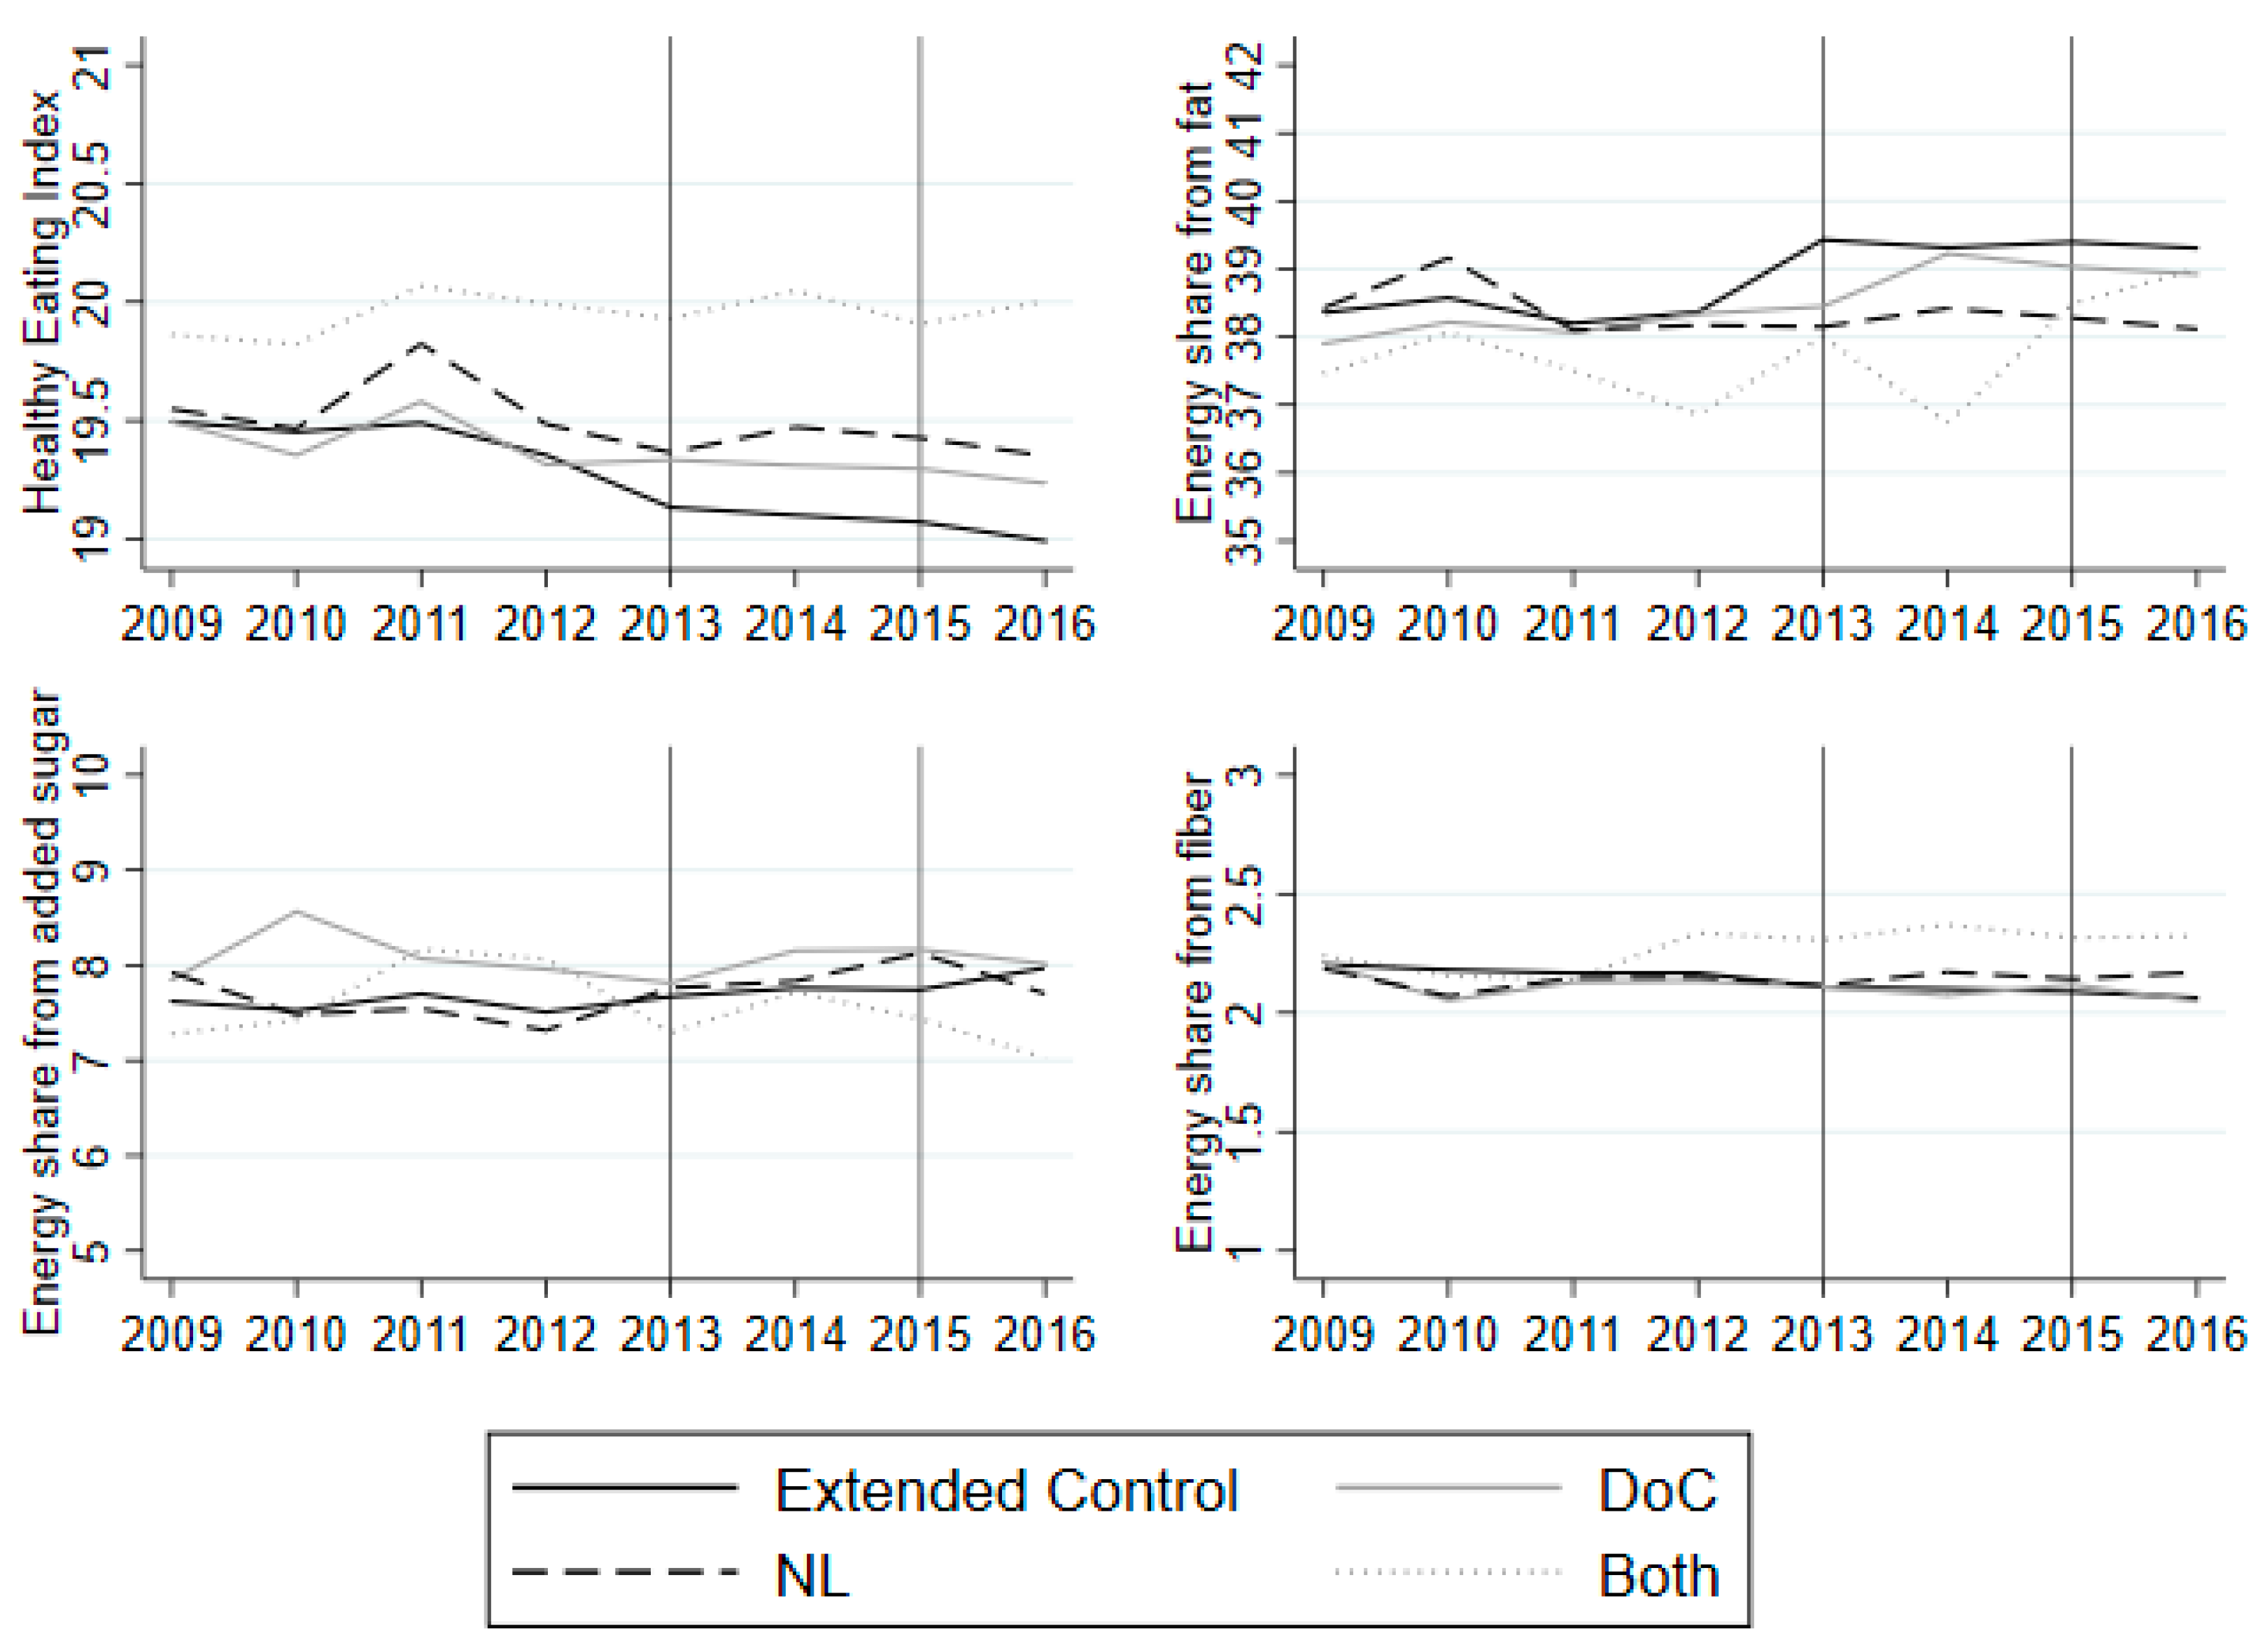
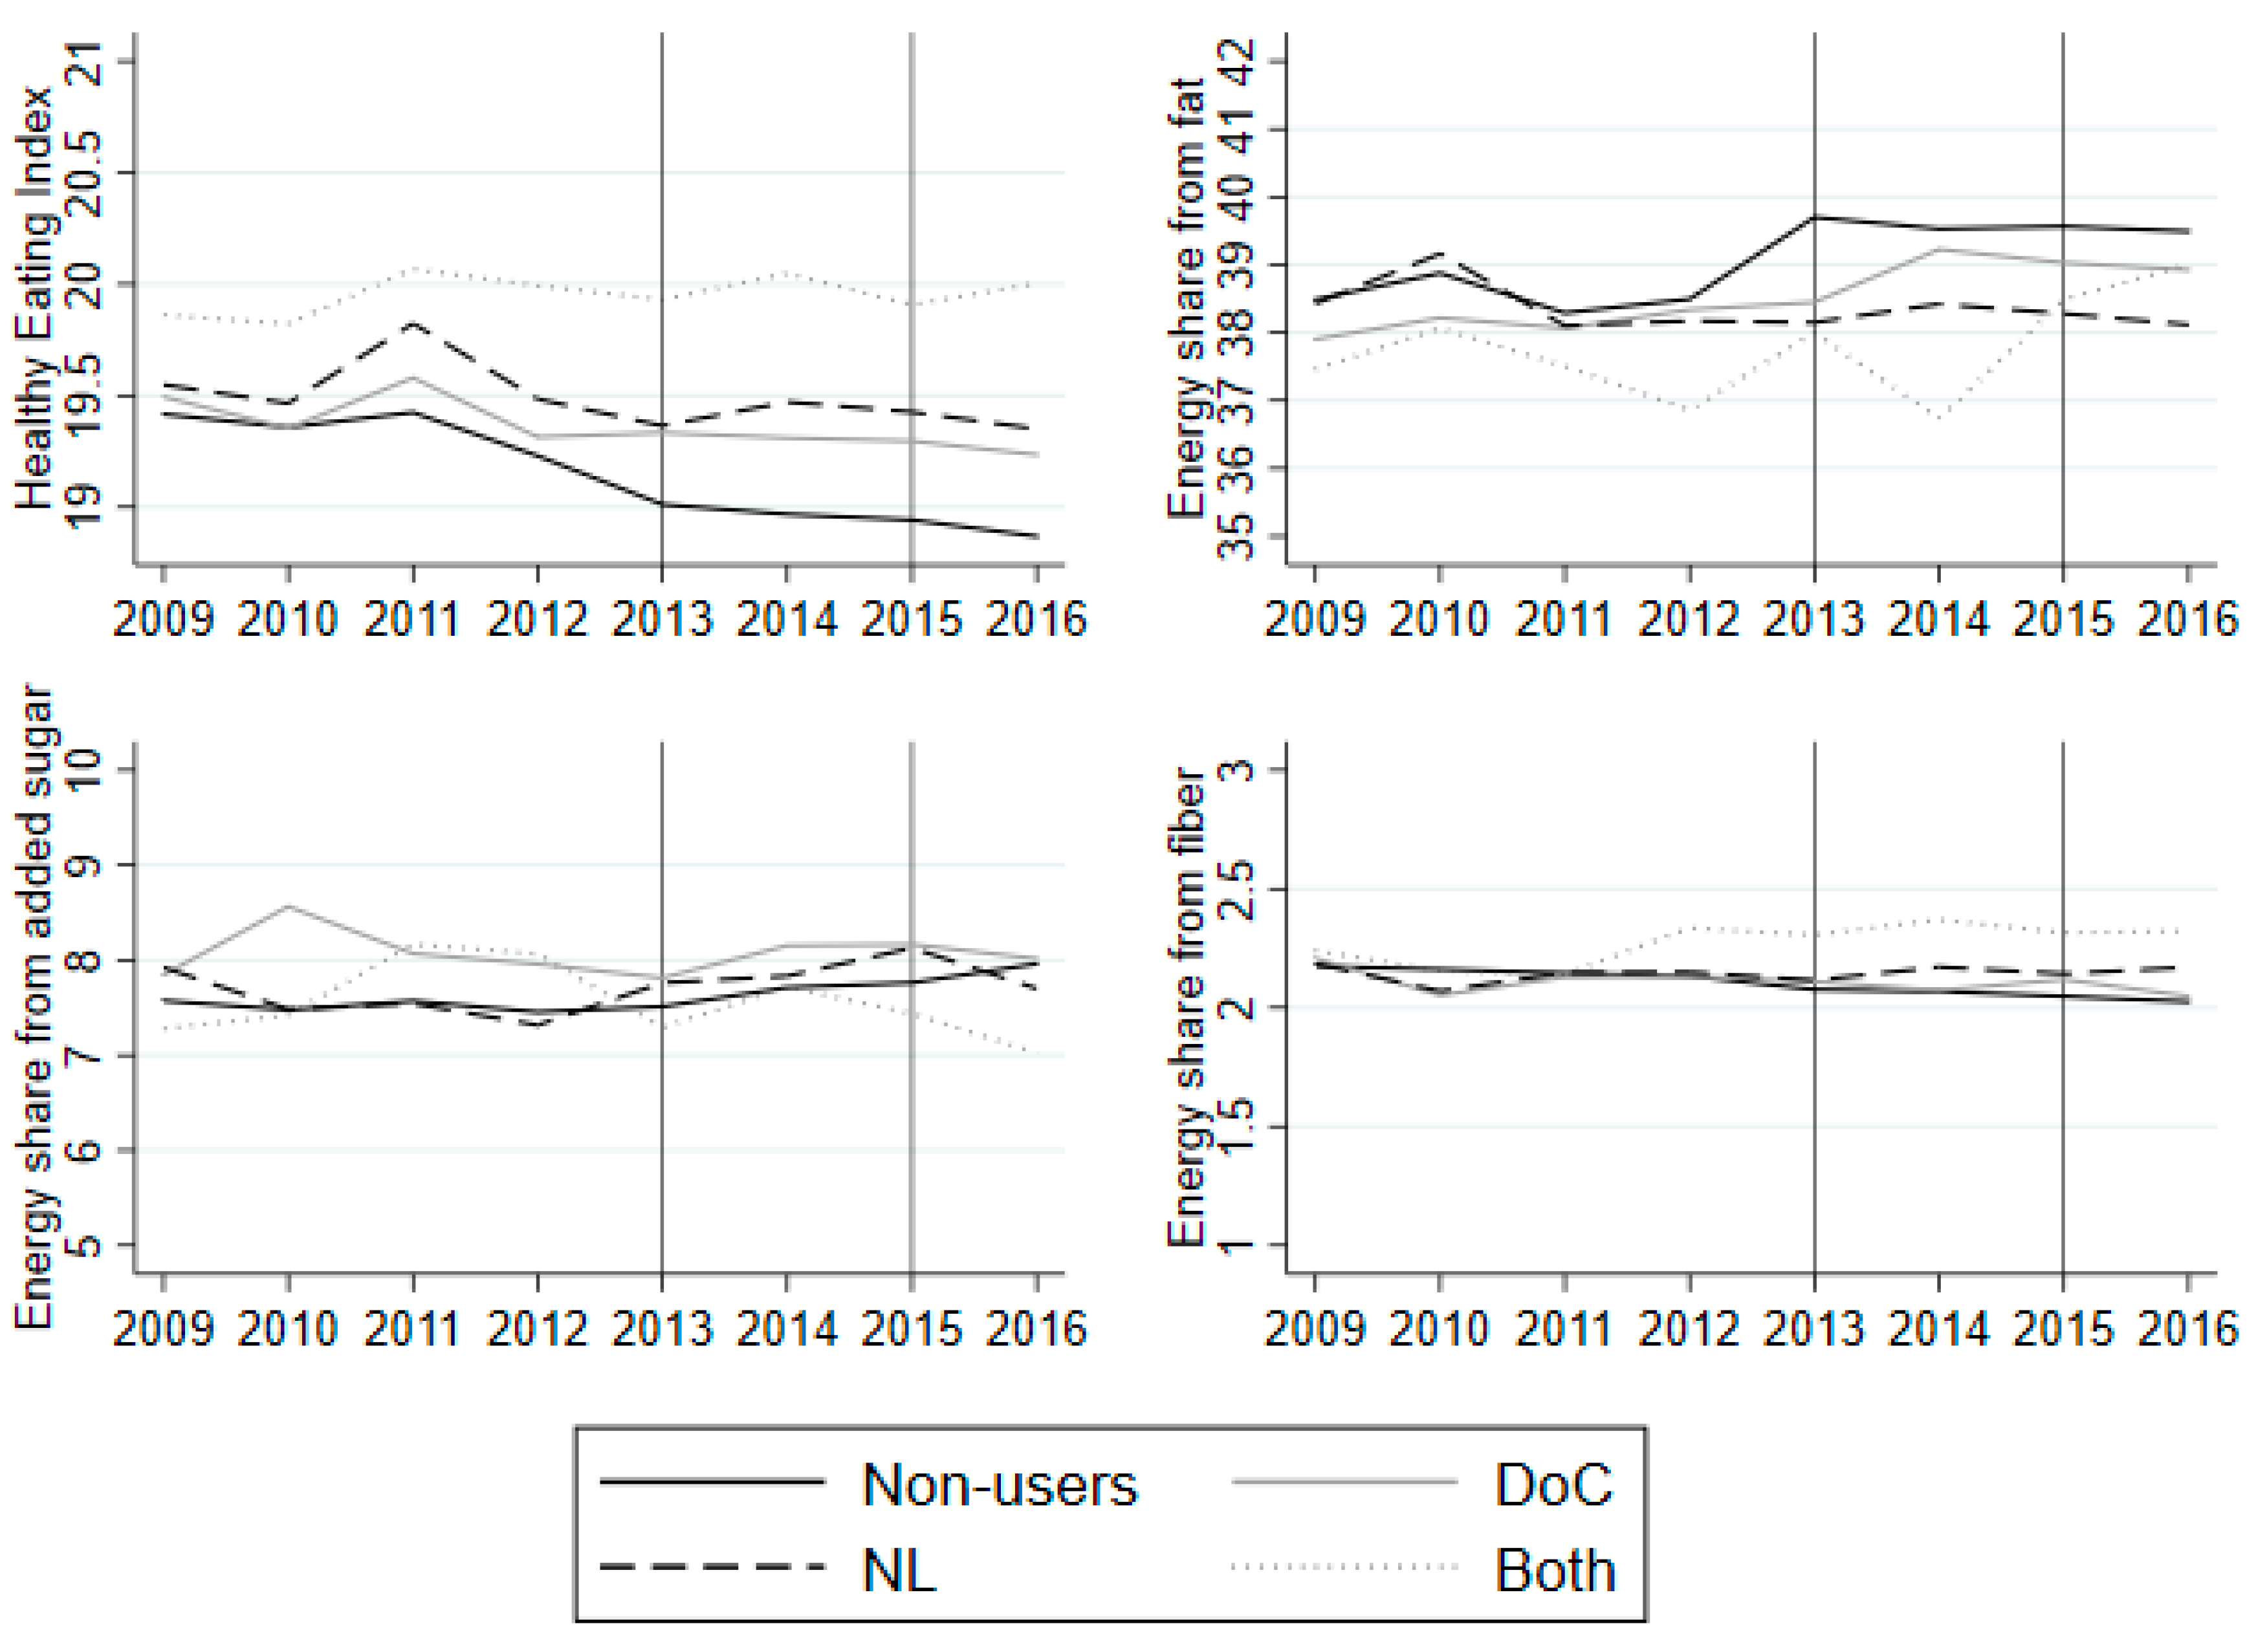
Whether these assumptions are reasonable is tested by using pre-label use periods (2009–2012) and by examining the trend for each of the label groups compared to the non-user group, graphically, and through regression analysis to check the assumption of common trends. Since we cannot test the assumption of parallel trend in the treatment period (2013–2016), the period before is used to test whether the assumption is reasonable [
49].
To test for parallel trend in the pre-treatment period, I use the following approach from Autor [
50]:
where year is year dummies; label is treatment dummy/(dummies), indicating whether the household is a switcher of the label;
is the interaction between year and label dummy/(dummies). The regression (5) is run by OLS using the years 2009–2016, where 2013 is the reference year. The significance of each coefficient in the pre-treatment year is then examined to check significance
. The standard errors is clustered at the household level.
The difference-in-difference estimation regression is written as:
where year is a time dummy, which is 1 in 2016; label is a dummy indicating whether the household is switcher of a particular label (NL, DoC, or both);
is the interaction between the treatment dummy and year; x is household characteristics; u is the error term. In this case,
is the coefficient of interest, since it will show the treatment effect of food labels. Equation (8) is run by OLS using the years 2013 and 2016, where standard errors are clustered at the household level. In a robustness check, household fixed effects are included in Equation (8).
The included controls are household characteristics, which are assumed to influence dietary quality, but also controls that are assumed to be correlated with selection into label use. Previous research has established that attitudes and special diet requirements are important for label use [
41,
51]. Therefore, dummies for health attitude, special diet and an exercise variable are included in the list of controls. Furthermore, since demographic and socio-economic variables have also been found to influence the decision of whether to use food labels as well as dietary quality, they are added as a robustness check [
16]. For an overview of the included controls, see
Table 3. Stata 15.1 is used for data analysis.


