Low-Carbohydrate High-Fat Diet and Exercise: Effect of a 10-Week Intervention on Body Composition and CVD Risk Factors in Overweight and Obese Women—A Randomized Controlled Trial

 , ,
, ,
Abstract
:1. Introduction
2. Methods, Design and Setting
2.1. Participants
2.2. Randomization
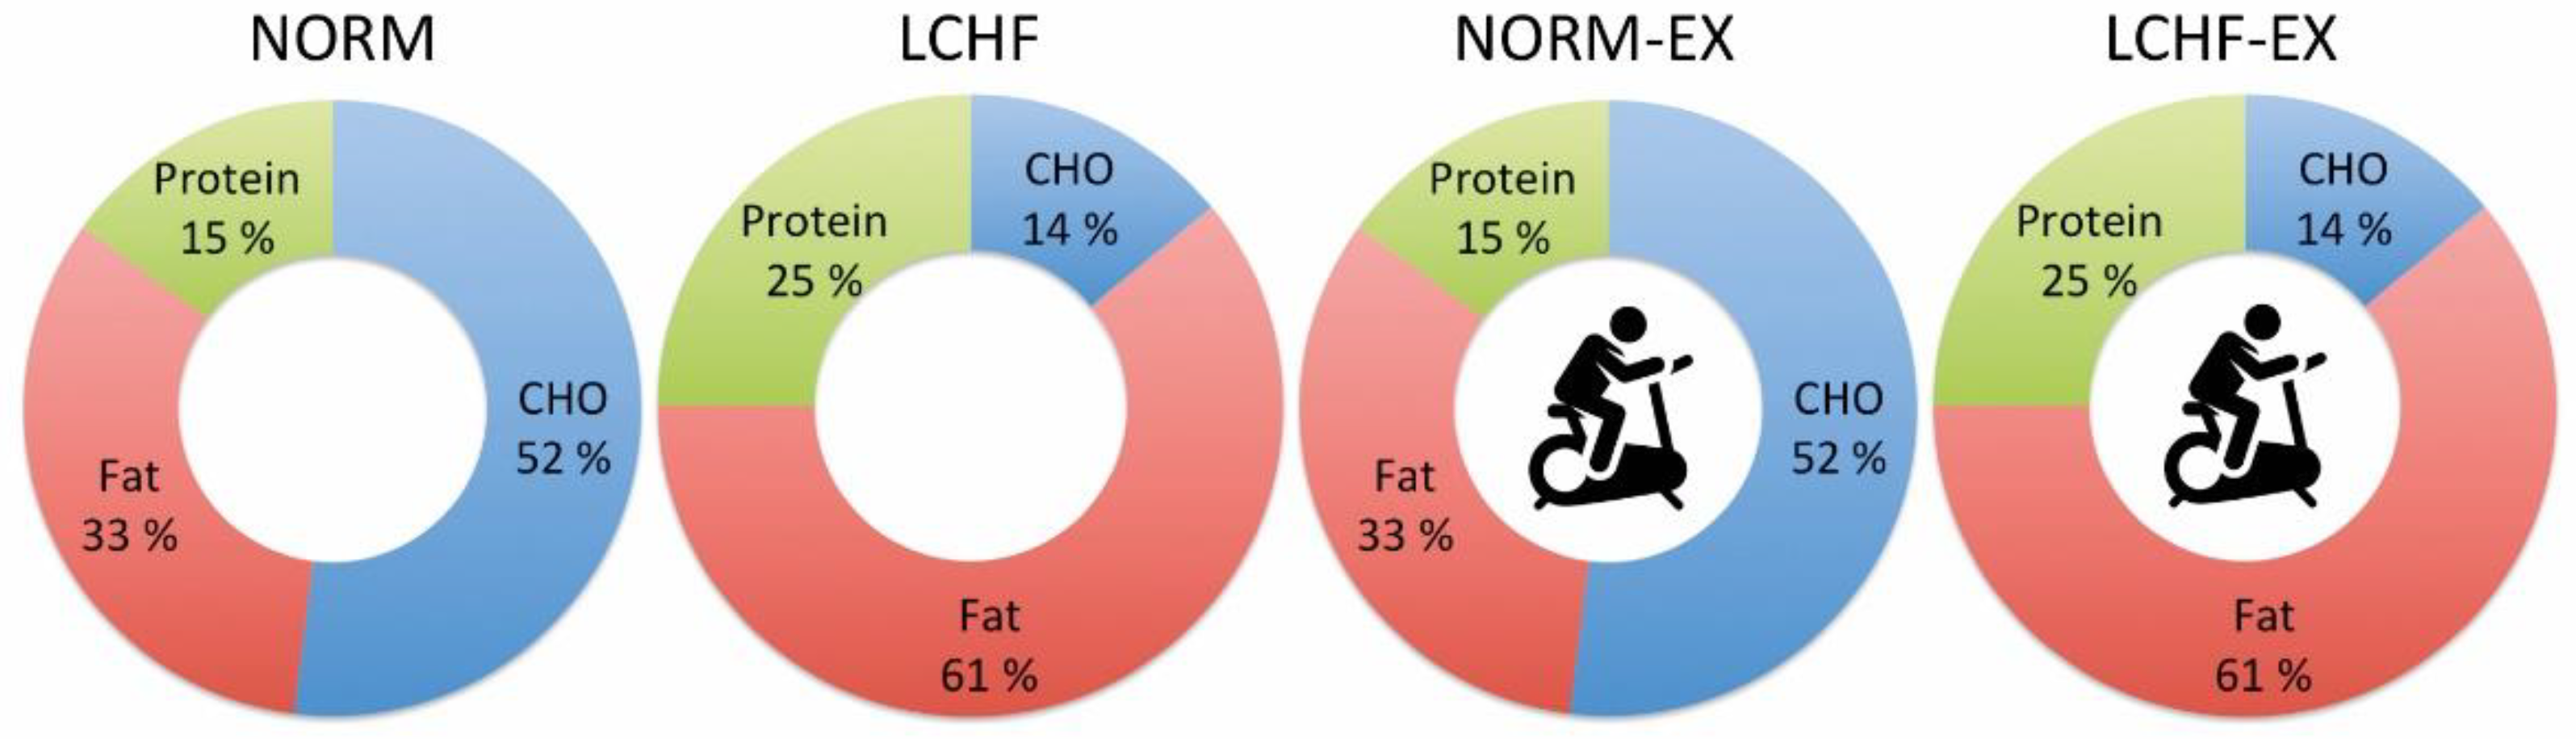
2.3. Intervention
2.4. Exercise Sessions
2.5. Normal Diet
2.6. LCHF Diet
2.7. Study Procedures
3. Outcome Measurements—Clinical and Laboratory Procedures
3.1. Anthropometric Measurements
3.2. Body Composition
3.3. O2peak and HRpeak
3.4. Lipids
3.5. Dietary Assessment
4. Sample Size Calculation and Statistical Analysis
5. Results
5.1. Study Participants
5.2. Results/Study Outcomes
5.2.1. Weight
5.2.2. Body Composition
5.2.3. Waist-to-Hip Ratio
5.2.4. Cardiorespiratory Fitness
5.2.5. Lipid Profile
6. Ancillary Analyses
6.1. Energy Deficit—Diet Only or Diet and Exercise

| NORM (n = 15) | LCHF (n = 14) | NORM-EX (n = 14) | LCHF-EX (n = 14) | NORM vs. LCHF | NORM vs. NORM-EX | LCHF vs. LCHF-EX | NROM-EX vs. LCHF-EX | |
|---|---|---|---|---|---|---|---|---|
| Nutrition | Between Group Differences at Baseline vs. Post Intervention (p-Values) ^ | |||||||
| Energy | ||||||||
| Requirement (BMR*PAL) | 2437 ± 171 | 2440 ± 192 | 2430 ± 188 | 2337 ± 153 | 0.963 | 0.926 | 0.152 | 0.199 |
| Intake (kcal) pre | 2486 ± 173 | 2489 ± 195 | 2488 ± 183 | 2400 ± 150 | 0.969 | 0.974 | 0.197 | 0.177 |
| Intake (kcal) post | 1544 ± 124 | 1539 ± 212 | 1601 ± 244 | 1541 ± 126 | 0.927 | 0.405 | 0.892 | 0.470 |
| Within-group change (p-value) | <0.001 | <0.001 | <0.001 | <0.001 | ||||
| Energy availability * | 1544 ± 124 | 1539 ± 212 | 1401 ± 237 | 1334 ± 89 | 0.942 | 0.041 | 0.006 | 0.413 |
| Macronutrients | ||||||||
| Carbohydrate (E%) pre | 48.7 ± 3.1 | 47.7 ± 3.3 | 50.2 ± 3.3 | 48.1 ± 2.3 | 0.425 | 0.205 | 0.695 | 0.067 |
| Carbohydrate (E%) week 1-10 | 48.4 ± 2.8 | 14.0 ± 2.9 | 50.0 ± 3.0 | 15.0 ± 1.2 | <0.0001 | 0.929 | 0.341 | <0.0001 |
| Within-group change (p-value) | 0.809 | <0.001 | 0.978 | <0.001 | ||||
| Protein (E%) pre | 14.9 ± 1.5 | 14.8 ± 1.1 | 15.0 ± 1.0 | 15.2 ± 2.2 | 0.845 | 0.929 | 0.547 | 0.709 |
| Protein (E%) week 1-10 | 20.2 ± 1.9 | 24.2 ± 1.4 | 19.2 ± 1.8 | 24.0 ± 0.9 | <0.0001 | 0.174 | 0.656 | <0.0001 |
| Within-group change (p-value) | <0.001 | <0.001 | <0.001 | <0.001 | ||||
| Fat (E%) pre | 36.5 ± 3.2 | 37.5 ± 3.2 | 34.8 ± 3.1 | 36.6 ± 3.2 | 0.385 | 0.164 | 0.476 | 0.133 |
| Fat (E%) week 1–10 | 31.4 ± 2.7 | 61.9 ± 3.9 | 30.8 ± 3.4 | 61.0 ± 1.2 | <0.0001 | 0.641 | 0.497 | <0.0001 |
| Within-group change (p-value) | <0.001 | <0.001 | 0.020 | <0.001 | ||||
| Saturated fat (E%) pre | 9.9 ± 2.6 | 11.0 ± 2.2 | 10.1 ± 3.1 | 11.9 ± 3.5 | 0.249 | 0.809 | 0.412 | 0.168 |
| Saturated fat (E%) week 1–10 | 7.5 ± 1.7 | 13.8 ± 3.5 | 7.6 ± 1.7 | 12.8 ± 2.8 | <0.0001 | 0.826 | 0.436 | <0.0001 |
| Within-group change (p-value) | 0.005 | 0.010 | 0.014 | 0.562 | ||||
6.2. Macronutrient Intake
6.2.1. Carbohydrate
6.2.2. Protein
6.2.3. Fat and Saturated Fat
6.3. Ketosis
6.4. Exercise Compliance, Energy Expenditure and Exercise Intensity
7. Unintended Effects
8. Discussion
8.1. Body Composition
8.2. Cardiorespriatory Fitness
8.3. LDL
8.4. HDL
8.5. Total Cholesterol/HDL Ratio
8.6. Triglycerides
8.7. Energy Deficit and Diet Compliance
9. Strength and Limitations
10. Conclusions
10.1. Body Composition
10.2. Cardiorespiratory Fitness and Cardiovascular Risk Factors
Author Contributions
Funding
Institutional Review Board Statement
Informed Consent Statement
Data Availability Statement
Acknowledgments
Conflicts of Interest
References
- Obesity and Overweight. Available online: https://www.who.int/news-room/fact-sheets/detail/obesity-and-overweight (accessed on 26 October 2020).
- Vasan, S.K.; Osmond, C.; Canoy, D.; Christodoulides, C.; Neville, M.J.; Di Gravio, C.; Fall, C.H.D.; Karpe, F. Comparison of regional fat measurements by dual-energy X-ray absorptiometry and conventional anthropometry and their association with markers of diabetes and cardiovascular disease risk. Int. J. Obes. 2018, 42, 850–857. [Google Scholar] [CrossRef] [PubMed] [Green Version]
- Elagizi, A.; Kachur, S.; Lavie, C.J.; Carbone, S.; Pandey, A.; Ortega, F.B.; Milani, R.V. An Overview and Update on Obesity and the Obesity Paradox in Cardiovascular Diseases. Prog. Cardiovasc. Dis. 2018, 61, 142–150. [Google Scholar] [CrossRef] [PubMed] [Green Version]
- Swift, D.L.; McGee, J.E.; Earnest, C.P.; Carlisle, E.; Nygard, M.; Johannsen, N.M. The Effects of Exercise and Physical Activity on Weight Loss and Maintenance. Prog. Cardiovasc. Dis. 2018, 61, 206–213. [Google Scholar] [CrossRef] [PubMed]
- Wajchenberg, B.L. Subcutaneous and visceral adipose tissue: Their relation to the metabolic syndrome. Endocr. Rev. 2000, 21, 697–738. [Google Scholar] [CrossRef]
- Wilmot, K.A.; O’Flaherty, M.; Capewell, S.; Ford, E.S.; Vaccarino, V. Coronary Heart Disease Mortality Declines in the United States From 1979 Through 2011: Evidence for Stagnation in Young Adults, Especially Women. Circulation 2015, 132, 997–1002. [Google Scholar] [CrossRef] [Green Version]
- Saeed, A.; Kampangkaew, J.; Nambi, V. Prevention of Cardiovascular Disease in Women. Methodist Debakey Cardiovasc. J. 2017, 13, 185–192. [Google Scholar] [CrossRef]
- Walli-Attaei, M.; Joseph, P.; Rosengren, A.; Chow, C.K.; Rangarajan, S.; Lear, S.A.; AlHabib, K.F.; Davletov, K.; Dans, A.; Lanas, F.; et al. Variations between women and men in risk factors, treatments, cardiovascular disease incidence, and death in 27 high-income, middle-income, and low-income countries (PURE): A prospective cohort study. Lancet 2020, 396, 97–109. [Google Scholar] [CrossRef]
- Lemstra, M.; Bird, Y.; Nwankwo, C.; Rogers, M.; Moraros, J. Weight loss intervention adherence and factors promoting adherence: A meta-analysis. Patient Prefer. Adherence 2016, 10, 1547–1559. [Google Scholar] [CrossRef] [Green Version]
- Lean, M.E.; Leslie, W.S.; Barnes, A.C.; Brosnahan, N.; Thom, G.; McCombie, L.; Peters, C.; Zhyzhneuskaya, S.; Al-Mrabeh, A.; Hollingsworth, K.G.; et al. Primary care-led weight management for remission of type 2 diabetes (DiRECT): An open-label, cluster-randomised trial. Lancet 2018, 391, 541–551. [Google Scholar] [CrossRef] [Green Version]
- Clifton, P.M.; Keogh, J.B. Effects of Different Weight Loss Approaches on CVD Risk. Curr. Atheroscler. Rep. 2018, 20, 27. [Google Scholar] [CrossRef]
- Wing, R.R.; Lang, W.; Wadden, T.A.; Safford, M.; Knowler, W.C.; Bertoni, A.G.; Hill, J.O.; Brancati, F.L.; Peters, A.; Wagenknecht, L.; et al. Benefits of modest weight loss in improving cardiovascular risk factors in overweight and obese individuals with type 2 diabetes. Diabetes Care 2011, 34, 1481–1486. [Google Scholar] [CrossRef] [PubMed] [Green Version]
- Blackburn, G. Effect of degree of weight loss on health benefits. Obes. Res. 1995, 3 (Suppl. S2), 211s–216s. [Google Scholar] [CrossRef] [PubMed]
- Bueno, N.B.; de Melo, I.S.; de Oliveira, S.L.; da Rocha Ataide, T. Very-low-carbohydrate ketogenic diet v. low-fat diet for long-term weight loss: A meta-analysis of randomised controlled trials. Br. J. Nutr. 2013, 110, 1178–1187. [Google Scholar] [CrossRef] [PubMed] [Green Version]
- Mansoor, N.; Vinknes, K.J.; Veierod, M.B.; Retterstol, K. Effects of low-carbohydrate diets v. low-fat diets on body weight and cardiovascular risk factors: A meta-analysis of randomised controlled trials. Br. J. Nutr. 2016, 115, 466–479. [Google Scholar] [CrossRef]
- Foster, G.D.; Wyatt, H.R.; Hill, J.O.; Makris, A.P.; Rosenbaum, D.L.; Brill, C.; Stein, R.I.; Mohammed, B.S.; Miller, B.; Rader, D.J.; et al. Weight and metabolic outcomes after 2 years on a low-carbohydrate versus low-fat diet: A randomized trial. Ann. Intern. Med. 2010, 153, 147–157. [Google Scholar] [CrossRef]
- Valsdottir, T.D.; Henriksen, C.; Odden, N.; Nellemann, B.; Jeppesen, P.B.; Hisdal, J.; Westerberg, A.C.; Jensen, J. Effect of a Low-Carbohydrate High-Fat Diet and a Single Bout of Exercise on Glucose Tolerance, Lipid Profile and Endothelial Function in Normal Weight Young Healthy Females. Front. Physiol. 2019, 10, 1499. [Google Scholar] [CrossRef]
- Manninen, A.H. Metabolic effects of the very-low-carbohydrate diets: Misunderstood “villains” of human metabolism. J. Int. Soc. Sports Nutr. 2004, 1, 7–11. [Google Scholar] [CrossRef] [Green Version]
- Gershuni, V.M.; Yan, S.L.; Medici, V. Nutritional Ketosis for Weight Management and Reversal of Metabolic Syndrome. Curr. Nutr. Rep. 2018, 7, 97–106. [Google Scholar] [CrossRef]
- Volek, J.S.; Sharman, M.J.; Love, D.M.; Avery, N.G.; Gomez, A.L.; Scheett, T.P.; Kraemer, W.J. Body composition and hormonal responses to a carbohydrate-restricted diet. Metab. Clin. Exp. 2002, 51, 864–870. [Google Scholar] [CrossRef]
- Swift, D.L.; Johannsen, N.M.; Lavie, C.J.; Earnest, C.P.; Church, T.S. The role of exercise and physical activity in weight loss and maintenance. Prog. Cardiovasc. Dis. 2014, 56, 441–447. [Google Scholar] [CrossRef] [Green Version]
- Losing Weight. Available online: https://www.cdc.gov/healthyweight/losing_weight/index.html (accessed on 1 December 2020).
- Norwegian Directorate of Health. Nasjonal Faglig Retningslinje for Forebygging, Utredning og Behandling av Overvekt og Fedme hos Voksne; Helsedirektoratet: Oslo, Norway, 2011; p. 86. [Google Scholar]
- Gordon, B.; Chen, S.; Durstine, J.L. The effects of exercise training on the traditional lipid profile and beyond. Curr. Sports Med. Rep. 2014, 13, 253–259. [Google Scholar] [CrossRef] [PubMed]
- Ross, R.; Janssen, I.; Dawson, J.; Kungl, A.M.; Kuk, J.L.; Wong, S.L.; Nguyen-Duy, T.B.; Lee, S.; Kilpatrick, K.; Hudson, R. Exercise-induced reduction in obesity and insulin resistance in women: A randomized controlled trial. Obes. Res. 2004, 12, 789–798. [Google Scholar] [CrossRef] [PubMed]
- Barry, V.W.; Baruth, M.; Beets, M.W.; Durstine, J.L.; Liu, J.; Blair, S.N. Fitness vs. fatness on all-cause mortality: A meta-analysis. Prog. Cardiovasc. Dis. 2014, 56, 382–390. [Google Scholar] [CrossRef] [PubMed]
- Hernandez-Reyes, A.; Camara-Martos, F.; Molina-Luque, R.; Romero-Saldana, M.; Molina-Recio, G.; Moreno-Rojas, R. Changes in body composition with a hypocaloric diet combined with sedentary, moderate and high-intense physical activity: A randomized controlled trial. BMC Womens Health 2019, 19, 167. [Google Scholar] [CrossRef] [Green Version]
- Skrypnik, D.; Bogdanski, P.; Madry, E.; Karolkiewicz, J.; Ratajczak, M.; Krysciak, J.; Pupek-Musialik, D.; Walkowiak, J. Effects of Endurance and Endurance Strength Training on Body Composition and Physical Capacity in Women with Abdominal Obesity. Obes. Facts 2015, 8, 175–187. [Google Scholar] [CrossRef]
- Wilmore, J.H.; Despres, J.P.; Stanforth, P.R.; Mandel, S.; Rice, T.; Gagnon, J.; Leon, A.S.; Rao, D.; Skinner, J.S.; Bouchard, C. Alterations in body weight and composition consequent to 20 wk of endurance training: The HERITAGE Family Study. Am. J. Clin. Nutr. 1999, 70, 346–352. [Google Scholar] [CrossRef] [Green Version]
- Hayes, M.; Chustek, M.; Wang, Z.; Gallagher, D.; Heshka, S.; Spungen, A.; Bauman, W.; Heymsfield, S.B. DXA: Potential for creating a metabolic map of organ-tissue resting energy expenditure components. Obes. Res. 2002, 10, 969–977. [Google Scholar] [CrossRef] [Green Version]
- Hunter, G.R.; Moellering, D.R.; Carter, S.J.; Gower, B.A.; Bamman, M.M.; Hornbuckle, L.M.; Plaisance, E.P.; Fisher, G. Potential Causes of Elevated REE after High-Intensity Exercise. Med. Sci. Sports Exerc. 2017, 49, 2414–2421. [Google Scholar] [CrossRef]
- Dixon, J.B.; Lambert, E.A.; Grima, M.; Rice, T.; Lambert, G.W.; Straznicky, N.E. Fat-free mass loss generated with weight loss in overweight and obese adults: What may we expect? Diabetes Obes. Metab. 2015, 17, 91–93. [Google Scholar] [CrossRef]
- Wu, T.; Gao, X.; Chen, M.; van Dam, R.M. Long-term effectiveness of diet-plus-exercise interventions vs. diet-only interventions for weight loss: A meta-analysis. Obes. Rev. Off. J. Int. Assoc. Study Obes. 2009, 10, 313–323. [Google Scholar] [CrossRef]
- Arad, A.D.; Albu, J.B.; DiMenna, F.J. Feasibility of a progressive protocol of high-intensity interval training for overweight/obese, sedentary African American women: A retrospective analysis. BMC Sports Sci. Med. Rehabil. 2020, 12, 59. [Google Scholar] [CrossRef] [PubMed]
- Oliveira, B.R.R.; Santos, T.M.; Kilpatrick, M.; Pires, F.O.; Deslandes, A.C. Affective and enjoyment responses in high intensity interval training and continuous training: A systematic review and meta-analysis. PLoS ONE 2018, 13, e0197124. [Google Scholar] [CrossRef] [PubMed] [Green Version]
- Flack, K.D.; Siders, W.A.; Johnson, L.; Roemmich, J.N. Cross-Validation of Resting Metabolic Rate Prediction Equations. J. Acad. Nutr. Diet 2016, 116, 1413–1422. [Google Scholar] [CrossRef] [PubMed] [Green Version]
- Ategbo, E.; Atkinson, S.; Baba, N.H.; Ferro-Luzzi, A.; He, Z.Q.; Jequier, E.; LKanyangwa-Luma, J.; Kennedy, E.; Kim, S.H.; King, J.; et al. Human energy requirements. Scientific background papers from the Joint FAO/WHO/UNU Expert Consultation. October 17–24, 2001. Rome, Italy. Public Health Nutr. 2005, 8, 929–1228. [Google Scholar]
- Borg, G. Psychophysical scaling with applications in physical work and the perception of exertion. Scand J. Work Environ. Health 1990, 16 (Suppl. S1), 55–58. [Google Scholar] [CrossRef] [PubMed]
- Erdogan, A.; Cetin, C.; Karatosun, H.; Baydar, M.L. Accuracy of the Polar S810i(TM) Heart Rate Monitor and the Sensewear Pro Armband(TM) to Estimate Energy Expenditure of Indoor Rowing Exercise in Overweight and Obese Individuals. J. Sports Sci. Med. 2010, 9, 508–516. [Google Scholar] [PubMed]
- Norwegian Directorate of Health. Recommendations for Diet, Nutrition and Physical Actvity; Norwegian Directorate of Health: Oslo, Norway, 2014; p. 28. [Google Scholar]
- Atkins, R.C., Dr. Atkins’ New Diet Revolution, 1st ed.; Avon Books: New York, NY, USA, 2002. [Google Scholar]
- Yancy, W.S., Jr.; Almirall, D.; Maciejewski, M.L.; Kolotkin, R.L.; McDuffie, J.R.; Westman, E.C. Effects of two weight-loss diets on health-related quality of life. Qual. Life Res. 2009, 18, 281–289. [Google Scholar] [CrossRef]
- Stern, L.; Iqbal, N.; Seshadri, P.; Chicano, K.L.; Daily, D.A.; McGrory, J.; Williams, M.; Gracely, E.J.; Samaha, F.F. The effects of low-carbohydrate versus conventional weight loss diets in severely obese adults: One-year follow-up of a randomized trial. Ann. Intern. Med. 2004, 140, 778–785. [Google Scholar] [CrossRef] [Green Version]
- Shai, I.; Schwarzfuchs, D.; Henkin, Y.; Shahar, D.R.; Witkow, S.; Greenberg, I.; Golan, R.; Fraser, D.; Bolotin, A.; Vardi, H.; et al. Weight loss with a low-carbohydrate, Mediterranean, or low-fat diet. N. Engl. J. Med. 2008, 359, 229–241. [Google Scholar] [CrossRef] [Green Version]
- Westman, E.C.; Phinney, S.D.; Volek, J.S. The New Atkins for a New You: The Ultimate Diet for Shedding Weight and Feeling Great; Simon & Schuster: New York, NY, USA, 2010. [Google Scholar]
- Wylie-Rosett, J.; Aebersold, K.; Conlon, B.; Isasi, C.R.; Ostrovsky, N.W. Health effects of low-carbohydrate diets: Where should new research go? Curr. Diabetes Rep. 2013, 13, 271–278. [Google Scholar] [CrossRef] [Green Version]
- Hettema, J.; Steele, J.; Miller, W.R. Motivational interviewing. Annu. Rev. Clin. Psychol. 2005, 1, 91–111. [Google Scholar] [CrossRef] [PubMed]
- Jelstad, S.; Ditta Valsdottir, T.; Johansen, E.I.; Jensen, J.R. Eight sessions of endurance training decrease fasting glucose and improve glucose tolerance in middle-aged overweight males. Arch. Physiol. Biochem. 2019, 1–8. [Google Scholar] [CrossRef] [PubMed] [Green Version]
- Snel, M.; Gastaldelli, A.; Ouwens, D.M.; Hesselink, M.K.; Schaart, G.; Buzzigoli, E.; Frolich, M.; Romijn, J.A.; Pijl, H.; Meinders, A.E.; et al. Effects of adding exercise to a 16-week very low-calorie diet in obese, insulin-dependent type 2 diabetes mellitus patients. J. Clin. Endocrinol. Metab. 2012, 97, 2512–2520. [Google Scholar] [CrossRef] [PubMed] [Green Version]
- DeFronzo, R.A.; Abdul-Ghani, M. Assessment and treatment of cardiovascular risk in prediabetes: Impaired glucose tolerance and impaired fasting glucose. Am. J. Cardiol. 2011, 108, 3b–24b. [Google Scholar] [CrossRef] [PubMed]
- Maillard, F.; Pereira, B.; Boisseau, N. Effect of High-Intensity Interval Training on Total, Abdominal and Visceral Fat Mass: A Meta-Analysis. Sports Med. 2018, 48, 269–288. [Google Scholar] [CrossRef] [PubMed]
- Moreno, B.; Crujeiras, A.B.; Bellido, D.; Sajoux, I.; Casanueva, F.F. Obesity treatment by very low-calorie-ketogenic diet at two years: Reduction in visceral fat and on the burden of disease. Endocrine 2016, 54, 681–690. [Google Scholar] [CrossRef]
- Wewege, M.; van den Berg, R.; Ward, R.E.; Keech, A. The effects of high-intensity interval training vs. moderate-intensity continuous training on body composition in overweight and obese adults: A systematic review and meta-analysis. Obes. Rev. Off. J. Int. Assoc. Study Obes. 2017, 18, 635–646. [Google Scholar] [CrossRef]
- Christiansen, T.; Paulsen, S.K.; Bruun, J.M.; Overgaard, K.; Ringgaard, S.; Pedersen, S.B.; Positano, V.; Richelsen, B. Comparable reduction of the visceral adipose tissue depot after a diet-induced weight loss with or without aerobic exercise in obese subjects: A 12-week randomized intervention study. Eur. J. Endocrinol. 2009, 160, 759–767. [Google Scholar] [CrossRef] [Green Version]
- Hwaung, P.; Bosy-Westphal, A.; Muller, M.J.; Geisler, C.; Heo, M.; Thomas, D.M. Obesity Tissue: Composition, Energy Expenditure, and Energy Content in Adult Humans. Obesity 2019, 27, 1472–1481. [Google Scholar] [CrossRef]
- Stiegler, P.; Cunliffe, A. The role of diet and exercise for the maintenance of fat-free mass and resting metabolic rate during weight loss. Sports Med. 2006, 36, 239–262. [Google Scholar] [CrossRef]
- Hunter, G.R.; Byrne, N.M.; Sirikul, B.; Fernandez, J.R.; Zuckerman, P.A.; Darnell, B.E.; Gower, B.A. Resistance training conserves fat-free mass and resting energy expenditure following weight loss. Obesity (Silver Spring) 2008, 16, 1045–1051. [Google Scholar] [CrossRef] [PubMed]
- Cava, E.; Yeat, N.C.; Mittendorfer, B. Preserving Healthy Muscle during Weight Loss. Adv. Nutr. 2017, 8, 511–519. [Google Scholar] [CrossRef] [PubMed] [Green Version]
- Hansen, T.T.; Hjorth, M.F.; Sandby, K.; Andersen, S.V.; Astrup, A.; Ritz, C.; Bullo, M.; Camacho-Barcia, M.L.; Garcia-Gavilan, J.F.; Salas-Salvado, J.; et al. Predictors of successful weight loss with relative maintenance of fat-free mass in individuals with overweight and obesity on an 8-week low-energy diet. Br. J. Nutr. 2019, 122, 468–479. [Google Scholar] [CrossRef] [PubMed]
- De Strijcker, D.; Lapauw, B.; Ouwens, D.M.; Van de Velde, D.; Hansen, D.; Petrovic, M.; Cuvelier, C.; Tonoli, C.; Calders, P. High intensity interval training is associated with greater impact on physical fitness, insulin sensitivity and muscle mitochondrial content in males with overweight/obesity, as opposed to continuous endurance training: A randomized controlled trial. J. Musculoskelet. Neuronal. Interact. 2018, 18, 215–226. [Google Scholar] [PubMed]
- Hatle, H.; Stobakk, P.K.; Molmen, H.E.; Bronstad, E.; Tjonna, A.E.; Steinshamn, S.; Skogvoll, E.; Wisloff, U.; Ingul, C.B.; Rognmo, O. Effect of 24 sessions of high-intensity aerobic interval training carried out at either high or moderate frequency, a randomized trial. PLoS ONE 2014, 9, e88375. [Google Scholar] [CrossRef] [PubMed] [Green Version]
- Milanovic, Z.; Sporis, G.; Weston, M. Effectiveness of High-Intensity Interval Training (HIT) and Continuous Endurance Training for VO2max Improvements: A Systematic Review and Meta-Analysis of Controlled Trials. Sports Med. 2015, 45, 1469–1481. [Google Scholar] [CrossRef]
- Hernandez, T.L.; Sutherland, J.P.; Wolfe, P.; Allian-Sauer, M.; Capell, W.H.; Talley, N.D.; Wyatt, H.R.; Foster, G.D.; Hill, J.O.; Eckel, R.H. Lack of suppression of circulating free fatty acids and hypercholesterolemia during weight loss on a high-fat, low-carbohydrate diet. Am. J. Clin. Nutr. 2010, 91, 578–585. [Google Scholar] [CrossRef] [Green Version]
- Noakes, T.D.; Windt, J. Evidence that supports the prescription of low-carbohydrate high-fat diets: A narrative review. Br. J. Sports Med. 2017, 51, 133–139. [Google Scholar] [CrossRef]
- Altena, T.S.; Michaelson, J.L.; Ball, S.D.; Guilford, B.L.; Thomas, T.R. Lipoprotein subfraction changes after continuous or intermittent exercise training. Med. Sci. Sports Exerc. 2006, 38, 367–372. [Google Scholar] [CrossRef]
- Allaire, J.; Vors, C.; Couture, P.; Lamarche, B. LDL particle number and size and cardiovascular risk: Anything new under the sun? Curr. Opin. Lipidol. 2017, 28, 261–266. [Google Scholar] [CrossRef]
- Hall, K.D.; Bemis, T.; Brychta, R.; Chen, K.Y.; Courville, A.; Crayner, E.J.; Goodwin, S.; Guo, J.; Howard, L.; Knuth, N.D.; et al. Calorie for Calorie, Dietary Fat Restriction Results in More Body Fat Loss than Carbohydrate Restriction in People with Obesity. Cell Metab. 2015, 22, 427–436. [Google Scholar] [CrossRef] [PubMed] [Green Version]
- Dattilo, A.M.; Kris-Etherton, P.M. Effects of weight reduction on blood lipids and lipoproteins: A meta-analysis. Am. J. Clin. Nutr. 1992, 56, 320–328. [Google Scholar] [CrossRef] [PubMed]
- Navab, M.; Anantharamaiah, G.M.; Reddy, S.T.; Van Lenten, B.J.; Fogelman, A.M. HDL as a biomarker, potential therapeutic target, and therapy. Diabetes 2009, 58, 2711–2717. [Google Scholar] [CrossRef] [PubMed] [Green Version]
- Zhang, Y.; Tuomilehto, J.; Jousilahti, P.; Wang, Y.; Antikainen, R.; Hu, G. Total and high-density lipoprotein cholesterol and stroke risk. Stroke J. Cereb. Circ. 2012, 43, 1768–1774. [Google Scholar] [CrossRef] [Green Version]
- Kelley, G.A.; Kelley, K.S.; Vu Tran, Z. Aerobic exercise, lipids and lipoproteins in overweight and obese adults: A meta-analysis of randomized controlled trials. Int. J. Obes. 2005, 29, 881–893. [Google Scholar] [CrossRef] [Green Version]
- Ferreira, A.P.; Ferreira, C.B.; Souza, V.C.; Cordova, C.O.; Silva, G.C.; Nobrega Ode, T.; Franca, N.M. The influence of intense intermittent versus moderate continuous exercise on postprandial lipemia. Clinics 2011, 66, 535–541. [Google Scholar] [CrossRef] [Green Version]
- Fogelholm, M.; Malmberg, J.; Suni, J.; Santtila, M.; Kyrolainen, H.; Mantysaari, M.; Oja, P. International Physical Activity Questionnaire: Validity against fitness. Med. Sci. Sports Exerc. 2006, 38, 753–760. [Google Scholar] [CrossRef]
- Hall, K.D. What is the required energy deficit per unit weight loss? Int. J. Obes. 2008, 32, 573–576. [Google Scholar] [CrossRef] [Green Version]
- Stubbs, R.J.; O’Reilly, L.M.; Whybrow, S.; Fuller, Z.; Johnstone, A.M.; Livingstone, M.B.; Ritz, P.; Horgan, G.W. Measuring the difference between actual and reported food intakes in the context of energy balance under laboratory conditions. Br. J. Nutr. 2014, 111, 2032–2043. [Google Scholar] [CrossRef] [Green Version]
- Woodward, M. Cardiovascular Disease and the Female Disadvantage. Int. J. Environ. Res. Public Health 2019, 16, 1165. [Google Scholar] [CrossRef] [Green Version]
- Williams, R.L.; Wood, L.G.; Collins, C.E.; Callister, R. Effectiveness of weight loss interventions--is there a difference between men and women: A systematic review. Obes. Rev. Off. J. Int. Assoc. Study Obes. 2015, 16, 171–186. [Google Scholar] [CrossRef] [PubMed]
- Sanal, E.; Ardic, F.; Kirac, S. Effects of aerobic or combined aerobic resistance exercise on body composition in overweight and obese adults: Gender differences. A randomized intervention study. Eur. J. Phys. Rehabil. Med. 2013, 49, 1–11. [Google Scholar] [PubMed]


| NORM (n = 15) | LCHF (n = 14) | NORM-EX (n = 14) | LCHF-EX (n = 14) | |
|---|---|---|---|---|
| Age (years) | 38.6 ± 3.7 | 40.0 ± 3.0 | 40.5 ±3.7 | 40.8 ± 3.3 |
| Weight (kg) | 89.2 ± 9.2 | 88.5 ± 7.2 | 89.4 ± 9.6 | 87.5 ± 11.2 |
| Height (cm) | 170.7 ± 5.2 | 169.2 ± 6.3 | 170.2 ± 4.5 | 166.4 ± 4.4 |
| BMI (kg∙m−2) | 30.7 ± 2.3 | 30.9 ± 2.6 | 30.8 ± 2.3 | 31.6 ± 3.0 |
| Waist circumference (cm) | 100.4 ± 6.0 | 99.1 ± 7.0 | 99.7 ± 5.2 | 101.6 ± 5.7 |
| Hip circumference (cm) | 114.3 ± 6.3 | 113.6 ± 6.5 | 114.8 ± 8.3 | 115.1 ± 8.1 |
| NORM | LCHF | NORM-EX | LCHF-EX | NORM vs. LCHF | NORM vs. NORM-EX | LCHF vs. LCHF-EX | NORM-EX vs. LCHF-EX | |
|---|---|---|---|---|---|---|---|---|
| Outcome Variables | Between Group Differences at Baseline vs. Post Intervention (p-Values) ^ | |||||||
| Body Composition | (n = 15) | (n = 14) | (n = 14) | (n = 14) | ||||
| Lean body mass (kg) pre | 47.9 ± 4.4 | 48.1 ± 3.9 | 49.0 ± 4.5 | 45.9 ± 5.3 | 0.869 | 0.471 | 0.192 | 0.082 |
| Lean body mass (kg) post | 46.1 ± 4.3 | 47.2 ± 4.3 | 48.2 ± 5.0 | 44.2 ± 4.8 | 0.546 | 0.234 | 0.201 | 0.103 |
| Within-group change (p-value) | <0.001 | <0.001 | <0.001 | 0.001 | ||||
| Fat mass (kg) pre | 38.9 ± 6.0 | 37.8 ± 5.7 | 37.5 ± 6.0 | 39.1 ± 6.5 | 0.588 | 0.551 | 0.550 | 0.519 |
| Fat mass (kg) post | 35.8 ± 6.1 | 31.5 ± 3.1 | 32.5 ± 7.2 | 33.5 ± 7.4 | 0.198 | 0.272 | 0.792 | 0.867 |
| Within-group change (p-value) | <0.001 | <0.001 | <0.001 | <0.001 | ||||
| Fat % (tissue) pre | 43.3 ± 5.0 | 42.5 ± 3.9 | 41.8 ± 3.5 | 44.5 ± 3.3 | 0.512 | 0.246 | 0.128 | 0.031 |
| Fat % (tissue) post | 43.5 ± 3.5 | 40.0 ± 3.0 | 40.0 ± 4.2 | 42.8 ± 4.6 | 0.063 | 0.024 * | 0.477 | 0.315 |
| Within-group change (p-value) | 0.606 | <0.001 | 0.001 | <0.001 | ||||
| Visceral fat (kg) pre | 1.1 ± 0.5 | 0.9 ± 0.5 | 1.0 ± 0.5 | 1.2 ± 0.3 | 0.250 | 0.391 | 0.123 | 0.275 |
| Visceral fat (kg) post | 1.0 ± 0.5 | 0.6 ± 0.3 | 0.7 ± 0.3 | 0.9 ± 0.3 | 0.182 | 0.186 | 0.512 | 0.362 |
| Within-group change (p-value) | <0.001 | <0.001 | <0.001 | <0.001 | ||||
| Waist-hip ratio (U) pre | 0.88 ± 0.07 | 0.87 ± 0.07 | 0.87 ± 0.05 | 0.89 ± 0.06 | 0.793 | 0.650 | 0.607 | 0.412 |
| Waist-hip ratio (U) post | 0.86 ± 0.07 | 0.84 ± 0.07 | 0.84 ± 0.04 | 0.87 ± 0.04 | 0.391 | 0.339 | 0.302 | 0.180 |
| Within-group change (p-value) | 0.044 * | 0.002 | 0.002 | 0.067 | ||||
| NORM | LCHF | NORM-EX | LCHF-EX | NORM vs. LCHF | NORM vs. NORM-EX | LCHF vs. LCHF-EX | NORM-EX vs. LCHF-EX | |
|---|---|---|---|---|---|---|---|---|
| Outcome Variables | Between Group Differences at Baseline vs. Post Intervention (p-Values) ^ | |||||||
| Cardiorespiratory Fitness | (n = 15) | (n = 14) | (n = 14) | (n = 14) | ||||
| O2peak (mL∙min−1) pre | 2497 ± 239 | 2490 ± 340 | 2478 ± 315 | 2259 ± 330 | 0.954 | 0.847 | 0.086 | 0.067 |
| O2peak (mL∙min−1) post | 2364 ± 273 | 2356 ± 409 | 2715 ± 310 | 2416 ± 345 | 0.864 | 0.001 | 0.311 | 0.080 |
| Within-group change (p-value) | <0.01 | <0.001 | <0.001 | <0.001 | ||||
| Lipids | (n = 15) | (n = 14) | (n = 14) | (n = 14) | ||||
| Total cholesterol (mmol∙L−1) pre | 5.2 ± 0.7 | 5.1 ± 0.8 | 5.0 ± 0.8 | 5.6 ± 1.1 | 0.798 | 0.431 | 0.179 | 0.064 |
| Total cholesterol (mmol∙L−1) post | 4.7 ± 0.7 | 4.7 ± 1.0 | 3.9 ± 0.6 | 4.9 ± 1.1 | 0.958 | 0.003 | 0.513 | 0.004 |
| Within-group change (p-value) | <0.001 | 0.016 | <0.001 | <0.001 | ||||
| LDL (mmol∙L−1) pre | 3.0 ± 0.6 | 3.1 ± 0.8 | 2.9 ± 0.8 | 3.5 ± 1.0 | 0.775 | 0.836 | 0.190 | 0.071 |
| LDL (mmol∙L−1) post | 2.7 ± 0.7 | 2.8 ± 0.8 | 2.3 ± 0.6 | 2.9 ± 0.9 | 0.698 | 0.066 | 0.544 | 0.018 * |
| Within-group change (p-value) | 0.005 | 0.103 | <0.001 | 0.001 | ||||
| HDL (mmol∙L−1) pre | 1.6 ± 0.3 | 1.5 ± 0.2 | 1.4 ± 0.4 | 1.5 ± 0.4 | 0.260 | 0.158 | 0.988 | 0.531 |
| HDL (mmol∙L−1) post | 1.3 ± 0.2 | 1.3 ± 0.2 | 1.1 ± 0.2 | 1.3 ± 0.3 | 0.527 | 0.029 * | 0.576 | 0.177 |
| Within-group change (p-value) | <0.001 | <0.001 | <0.001 | <0.001 | ||||
| TG (mmol∙L−1) pre | 1.10 ± 0.48 | 1.06 ± 0.27 | 1.37 ± 0.76 | 1.45 ± 0.52 | 0.739 | 0.238 | 0.004 | 0.728 |
| TG (mmol∙L−1) post | 1.11 ± 0.34 | 1.00 ± 0.26 | 0.87 ± 0.21 | 1.03 ± 0.36 | 0.405 | 0.030 * | 0.938 | 0.198 |
| Within-group change (p-value) | 0.952 | 0.583 | <0.001 | <0.001 | ||||
| Total cholesterol/HDL ratio pre | 3.3 ± 0.8 | 3.4 ± 0.8 | 3.7 ± 1.1 | 3.9 ± 1.0 | 0.663 | 0.202 | 0.207 | 0.748 |
| Total cholesterol/HDL ratio post | 3.6 ± 0.9 | 3.7 ± 1.0 | 3.6 ± 0.8 | 3.8 ± 0.8 | 0.640 | 0.980 | 0.962 | 0.534 |
| Within-group change (p-value) | 0.007 | 0.004 | 0.511 | 0.740 | ||||
| NORM-EX | LCHF-EX | p Value | ||||||||||
|---|---|---|---|---|---|---|---|---|---|---|---|---|
| Expenditure Kcal | % HRpeak | RPE | Attendance% | Expenditure Kcal | % HRpeak | RPE | Attendance% | Expenditure Kcal | % HRpeak | RPE | Attendance% | |
| Exercise sessions * | (n = 12) | (n = 12) | (n = 12) | (n = 12) | (n = 12) | (n = 12) | % | |||||
| Week 1–2 | 524 ± 18 | 80 ± 3 | 15 ± 1 | 89 ± 15 | 513 ± 17 | 81 ± 3 | 15 ± 1 | 90 ± 1 | 0.119 | 0.338 | 0.738 | 0.811 |
| Week 3–4 | 531 ± 22 | 79 ± 3 | 15 ± 1 | 79 ± 19 | 524 ± 24 | 80 ± 4 | 15 ± 1 | 89 ± 11 | 0.461 | 0.567 | 0.296 | 0.138 |
| Week 5–6 | 537 ± 52 | 79 ± 4 | 16 ± 1 | 88 ± 19 | 531 ± 55 | 80 ± 3 | 16 ± 1 | 94 ± 11 | 0.791 | 0.653 | 0.602 | 0.283 |
| Week 7–8 | 544 ± 35 | 78 ± 3 | 16 ± 1 | 88 ± 13 | 525 ± 60 | 79 ± 4 | 16 ± 1 | 90 ± 17 | 0.333 | 0.586 | 0.286 | 0.649 |
| Week 9–10 | 551 ± 46 | 79 ± 4 | 17 ± 1 | 100 ± 0 | 530 ± 59 | 79 ± 4 | 17 ± 1 | 100 ± 0 | 0.351 | 0.796 | 0.432 | 1.000 |
| Average | 538 ± 29 | 79 ± 3 | 16 ± 1 | 88 ± 7 | 525 ± 40 | 80 ± 3 | 16 ± 1 | 93 ± 7 | 0.373 | 0.630 | 0.940 | 0.128 |
| NORM | LCHF | NORM-EX | LCHF-EX | NORM vs. LCHF | NORM vs. NORM-EX | LCHF vs. LCHF-EX | NORM-EX vs. LCHF-EX | |
|---|---|---|---|---|---|---|---|---|
| Protein Intake | Between Group Differences (p-Values) | |||||||
| Protein g∙kg−1 | 0.9 ± 0.1 | 1.0 ± 0.1 | 0.9 ± 0.1 | 1.1 ± 0.1 | <0.001 | 0.994 | 0.803 | <0.001 |
| Protein g∙kg LBM−1 | 1.6 ± 0.2 | 1.9 ± 0.2 | 1.5 ± 0.2 | 2.0 ± 0.2 | <0.001 | 0.432 | 0.216 | <0.001 |
Publisher’s Note: MDPI stays neutral with regard to jurisdictional claims in published maps and institutional affiliations. |
© 2020 by the authors. Licensee MDPI, Basel, Switzerland. This article is an open access article distributed under the terms and conditions of the Creative Commons Attribution (CC BY) license (http://creativecommons.org/licenses/by/4.0/).
Share and Cite
Valsdottir, T.D.; Øvrebø, B.; Falck, T.M.; Litleskare, S.; Johansen, E.I.; Henriksen, C.; Jensen, J. Low-Carbohydrate High-Fat Diet and Exercise: Effect of a 10-Week Intervention on Body Composition and CVD Risk Factors in Overweight and Obese Women—A Randomized Controlled Trial. Nutrients 2021, 13, 110. https://doi.org/10.3390/nu13010110
Valsdottir TD, Øvrebø B, Falck TM, Litleskare S, Johansen EI, Henriksen C, Jensen J. Low-Carbohydrate High-Fat Diet and Exercise: Effect of a 10-Week Intervention on Body Composition and CVD Risk Factors in Overweight and Obese Women—A Randomized Controlled Trial. Nutrients. 2021; 13(1):110. https://doi.org/10.3390/nu13010110
Chicago/Turabian StyleValsdottir, Thorhildur Ditta, Bente Øvrebø, Thea Martine Falck, Sigbjørn Litleskare, Egil Ivar Johansen, Christine Henriksen, and Jørgen Jensen. 2021. "Low-Carbohydrate High-Fat Diet and Exercise: Effect of a 10-Week Intervention on Body Composition and CVD Risk Factors in Overweight and Obese Women—A Randomized Controlled Trial" Nutrients 13, no. 1: 110. https://doi.org/10.3390/nu13010110
APA StyleValsdottir, T. D., Øvrebø, B., Falck, T. M., Litleskare, S., Johansen, E. I., Henriksen, C., & Jensen, J. (2021). Low-Carbohydrate High-Fat Diet and Exercise: Effect of a 10-Week Intervention on Body Composition and CVD Risk Factors in Overweight and Obese Women—A Randomized Controlled Trial. Nutrients, 13(1), 110. https://doi.org/10.3390/nu13010110