
Assessment of Nutritional Status and Nutrition Impact Symptoms in Patients Undergoing Resection for Upper Gastrointestinal Cancer: Results from the Multi-Centre NOURISH Point Prevalence Study

 , , , and
Abstract
:1. Introduction
2. Materials and Methods
2.1. Study Design and Setting
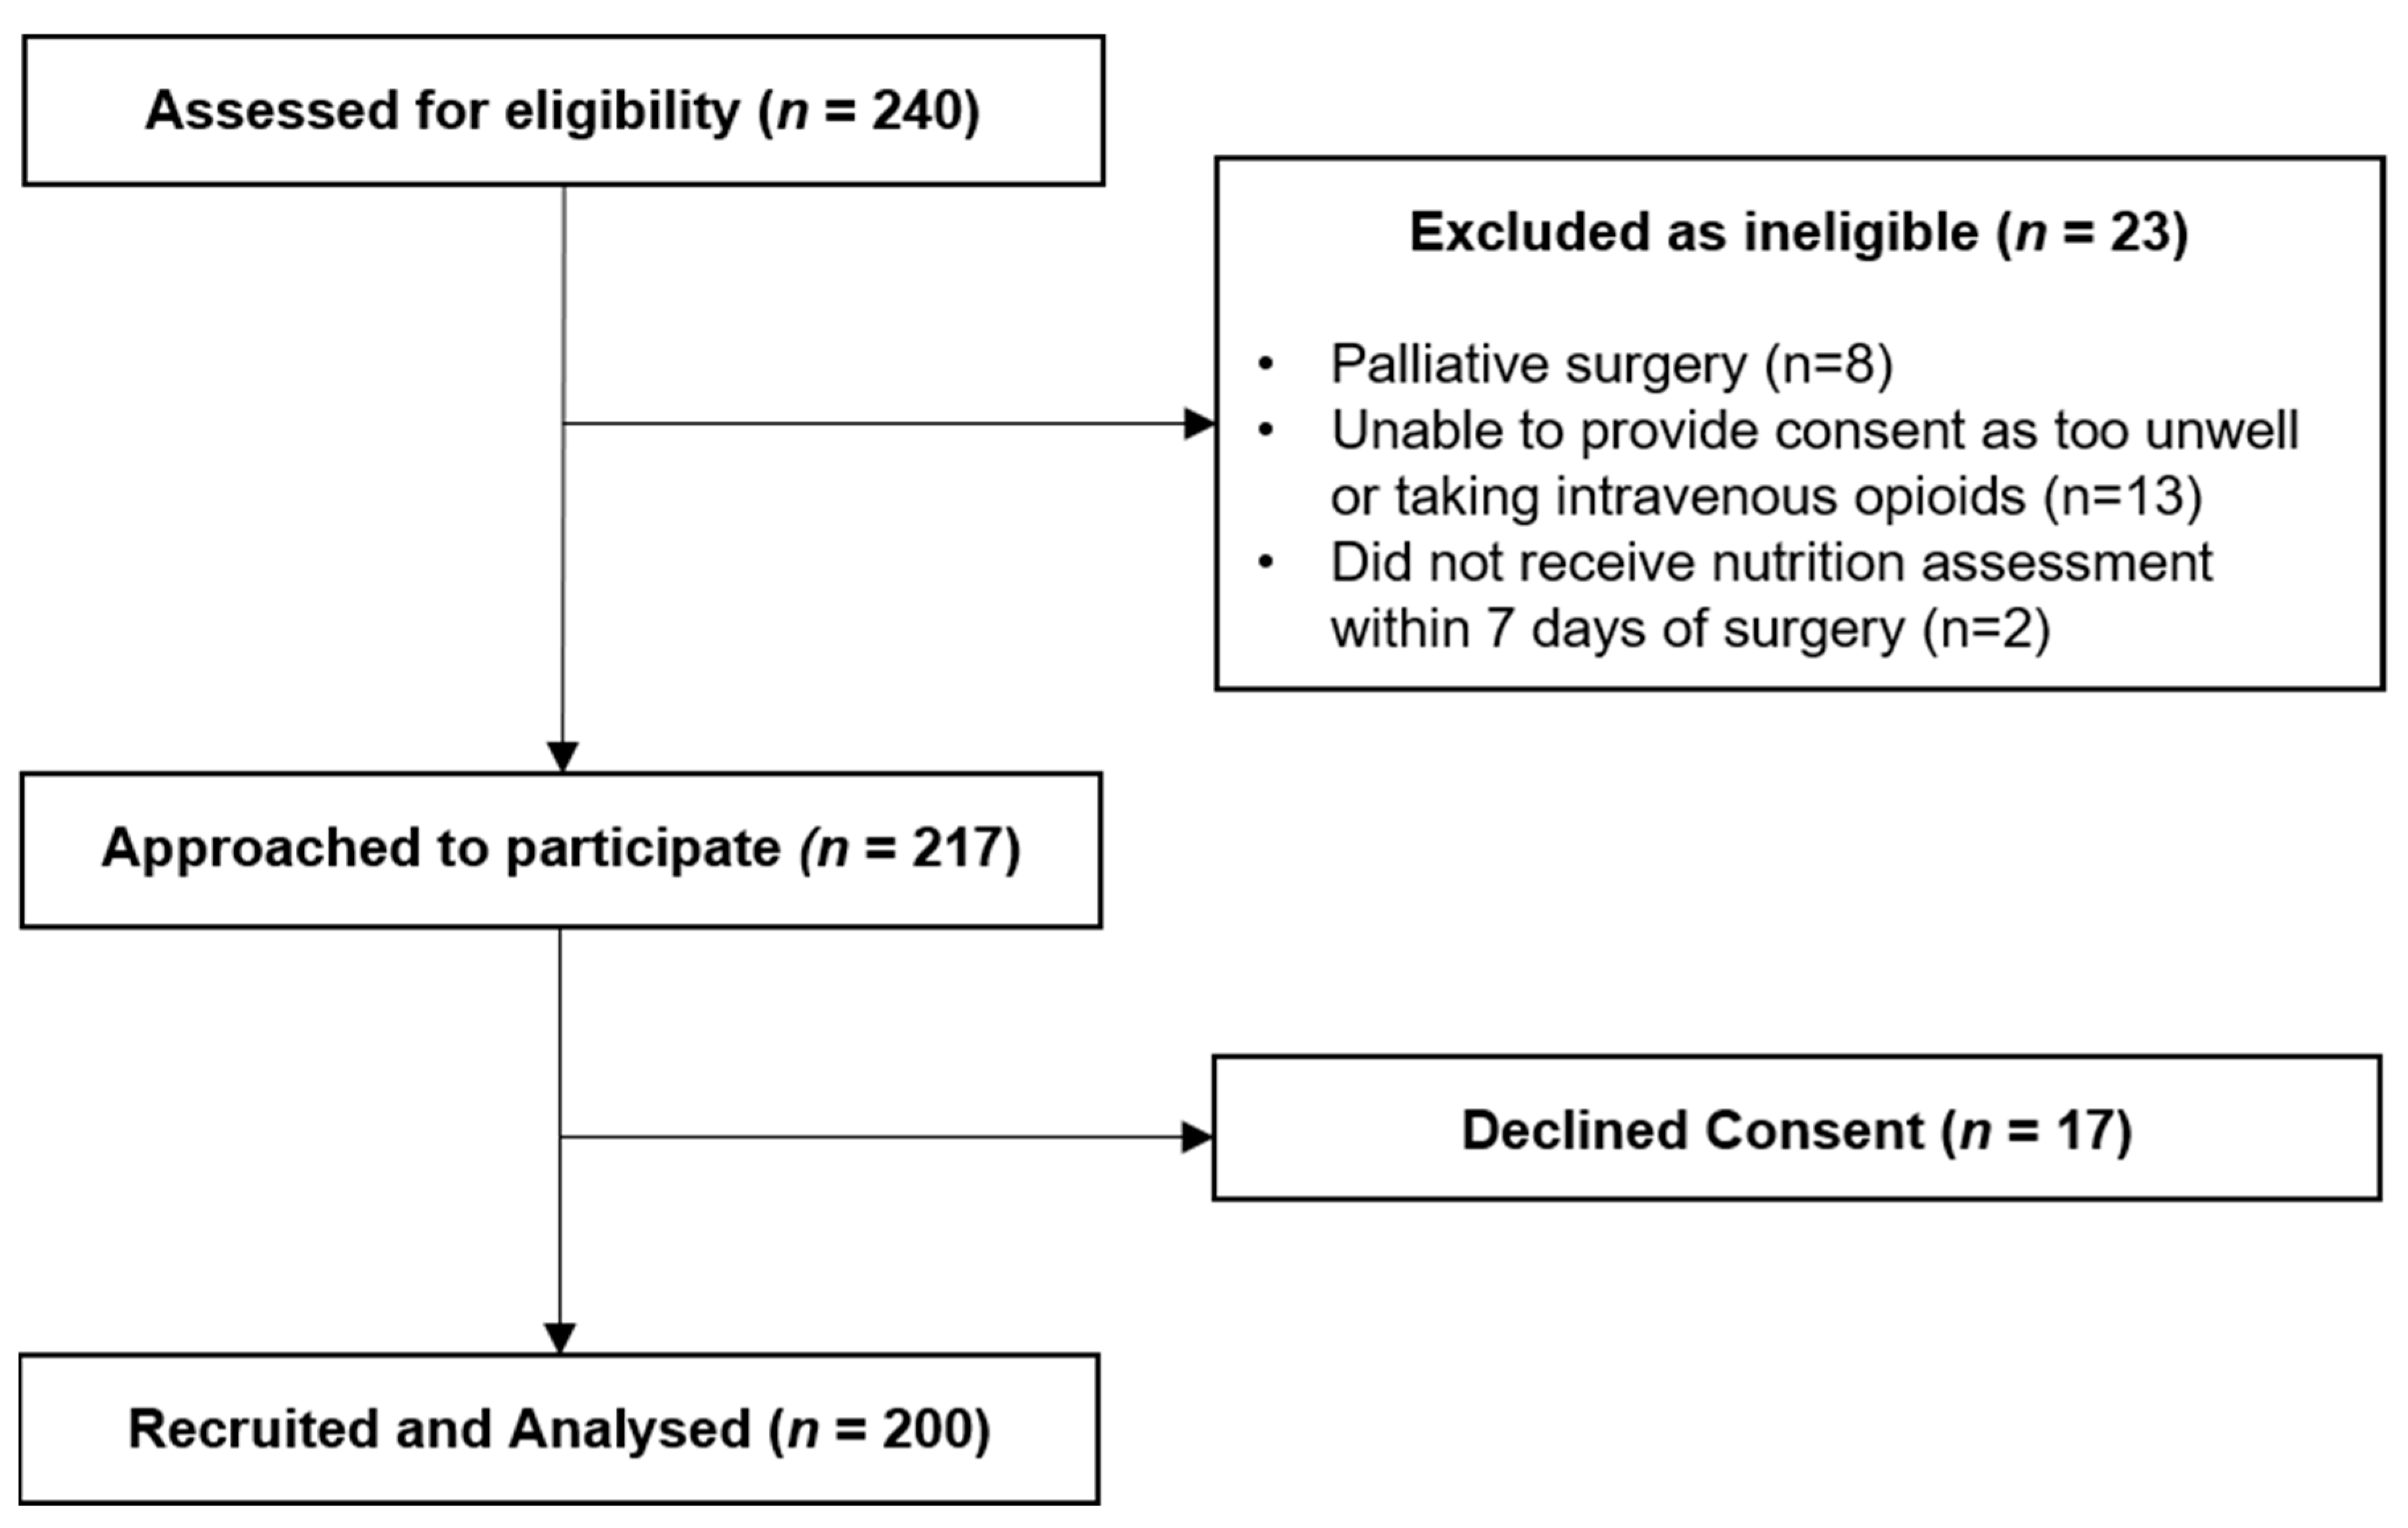
2.2. Participants
2.3. Data Collection
2.4. Outcome Measures
2.5. Statistical Analysis
3. Results
3.1. Baseline and Clinical Characteristics
3.2. Nutritional Status, Weight Loss and Muscle Strength
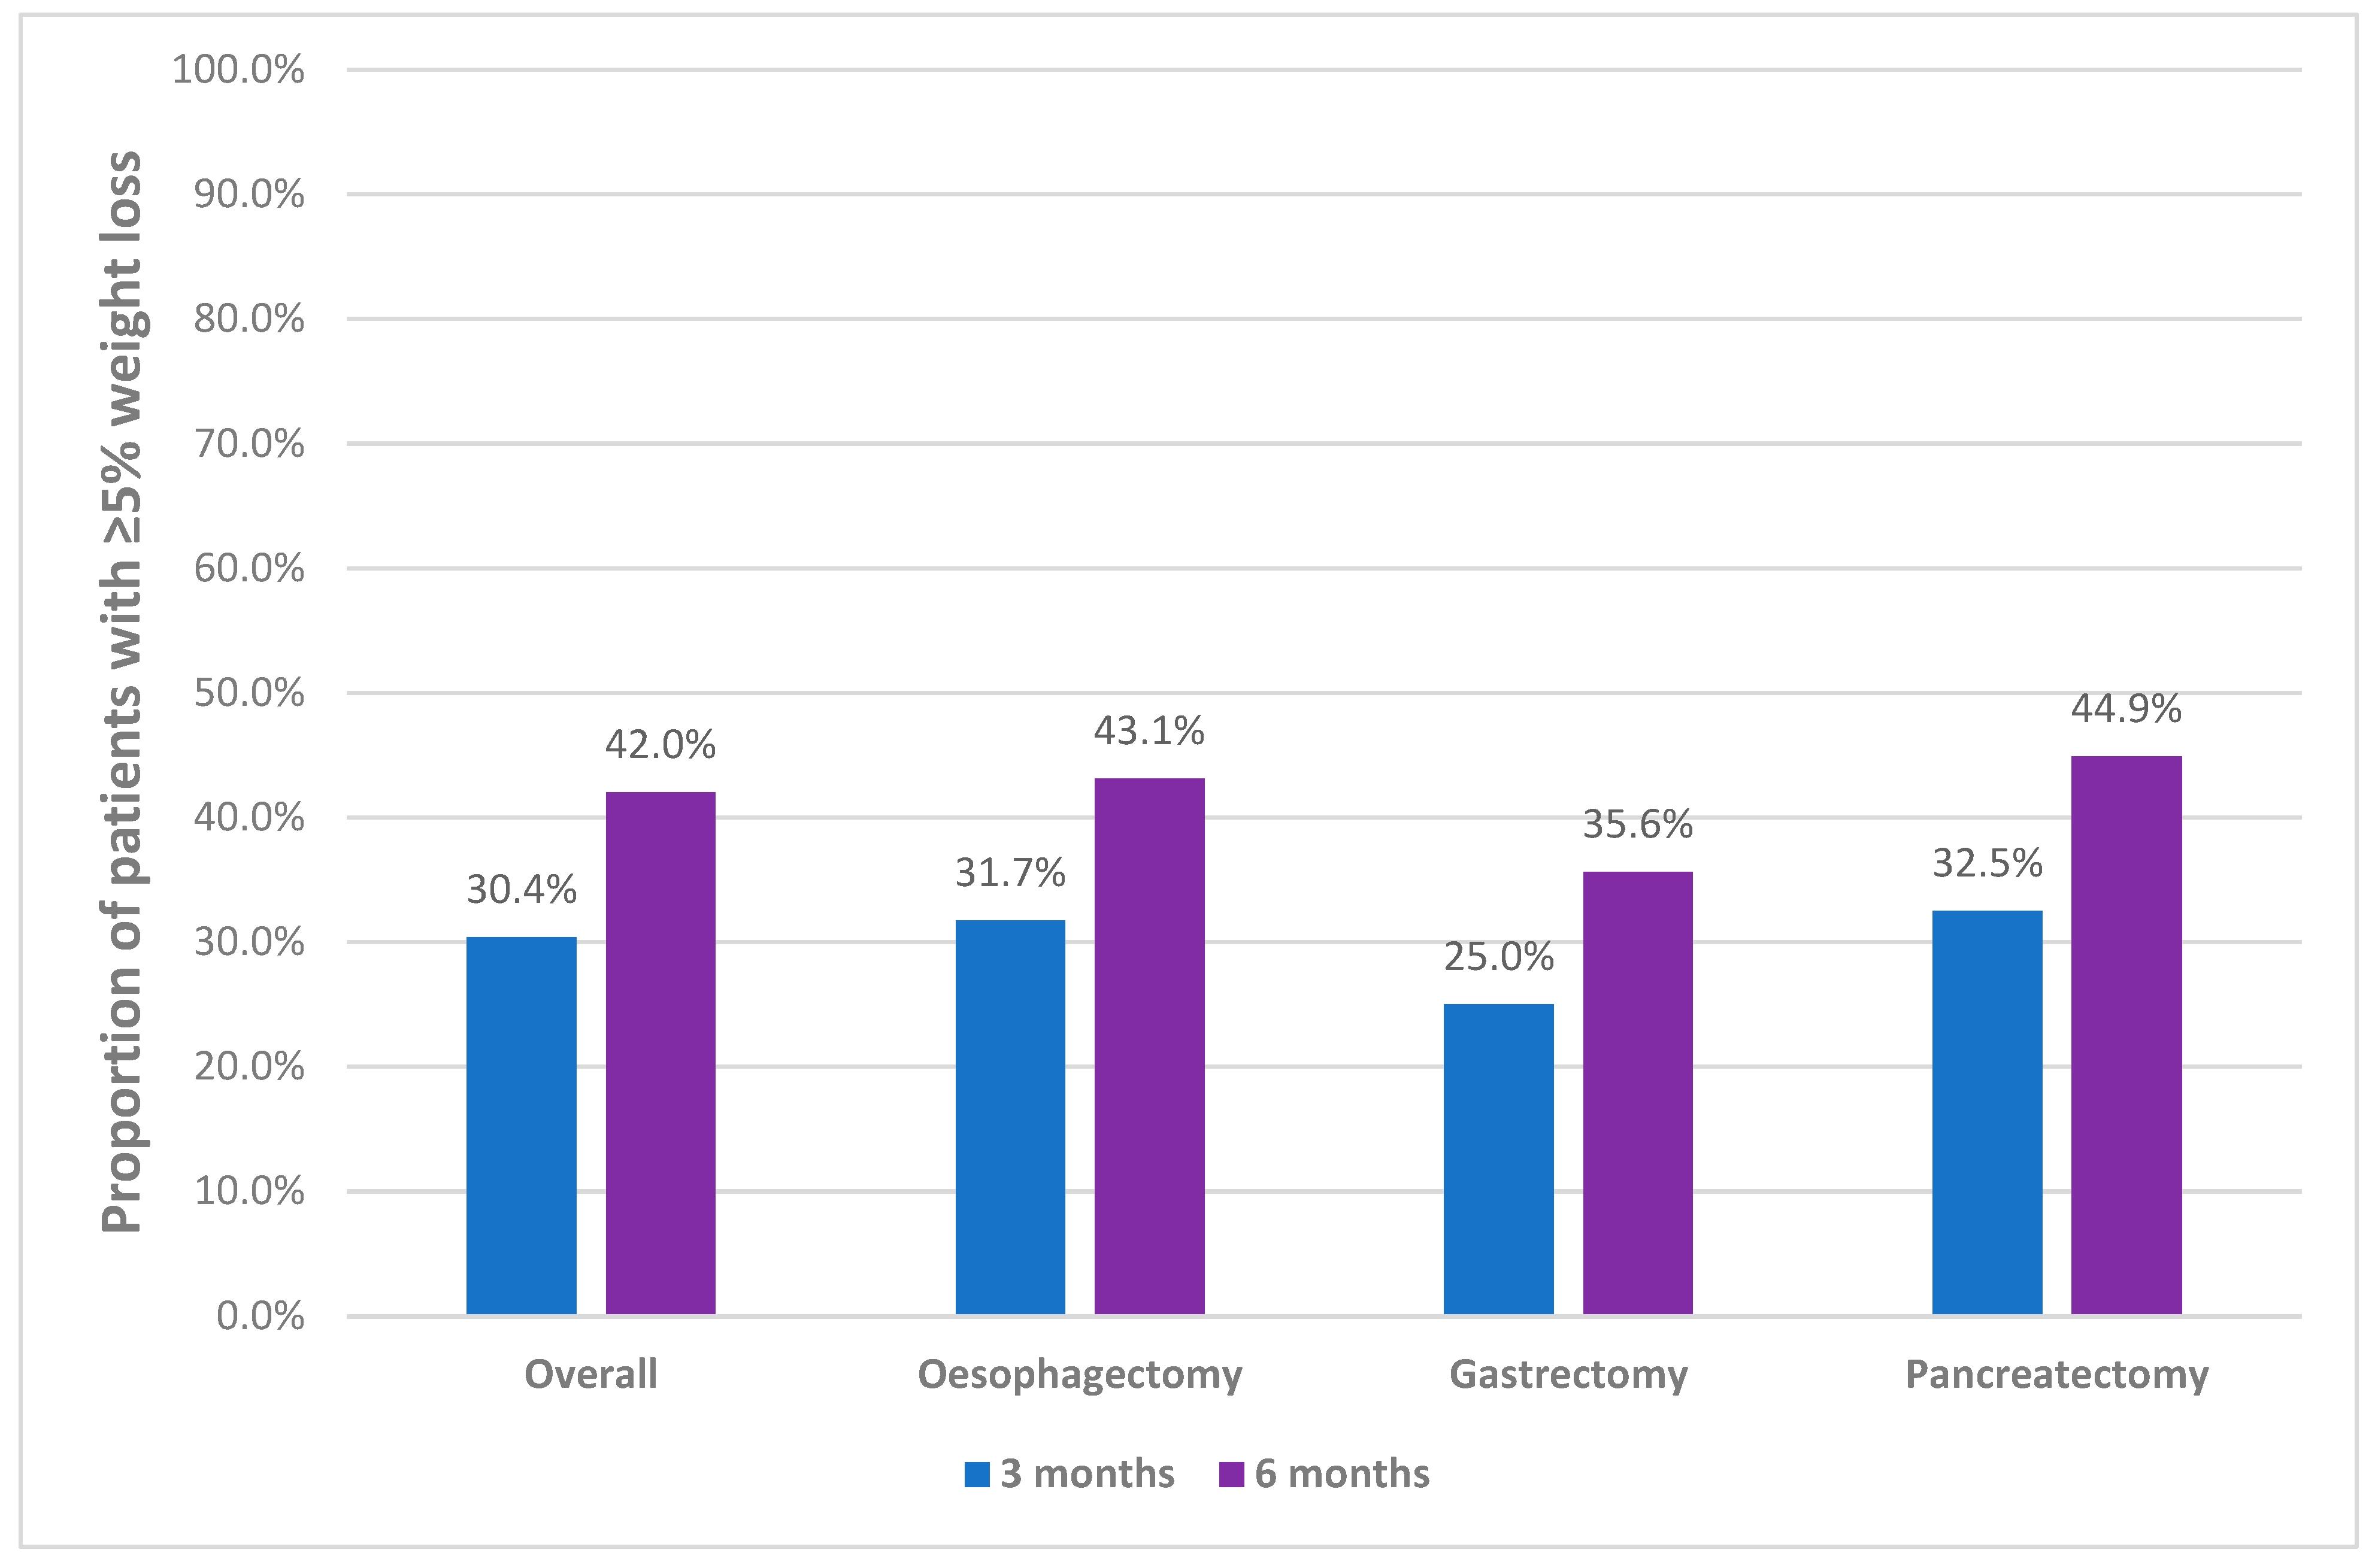
3.3. Prevalence of Clinically Significant Weight Loss
3.4. Prevalence of Preoperative Nutrition Impact Symptoms
3.5. Factors Associated with Preoperative Malnutrition and Clinically Significant Weight Loss
3.6. Associations between Preoperative Nutritional Status and Clinically Significant Weight Loss, with Surgical Length of Stay and Complications
4. Discussion
4.1. Nutritional Status, Weight Loss and Muscle Strength
4.2. Prevalence of Preoperative Nutrition Impact Symptoms
4.3. Factors Associated with Malnutrition and Unintentional Weight Loss
4.4. Associations between Nutritional Status and Surgical Outcomes
4.5. Strengths and Limitations
5. Conclusions
Supplementary Materials
Author Contributions
Funding
Institutional Review Board Statement
Informed Consent Statement
Data Availability Statement
Acknowledgments
Conflicts of Interest
References
- Bray, F.; Ferlay, J.; Soerjomataram, I.; Siegel, R.L.; Torre, L.A.; Jemal, A. Global cancer statistics 2018: GLOBOCAN estimates of incidence and mortality worldwide for 36 cancers in 185 countries. CA Cancer J. Clin. 2018, 68, 394–424. [Google Scholar] [CrossRef] [Green Version]
- Lee, J.H.; Nam, B.; Ryu, K.W.; Ryu, S.Y.; Park, Y.K.; Kim, S.; Kim, Y.-W. Comparison of outcomes after laparoscopy-assisted and open total gastrectomy for early gastric cancer. BJS 2015, 102, 1500–1505. [Google Scholar] [CrossRef] [PubMed]
- McGuigan, A.; Kelly, P.; Turkington, R.; Jones, C.; Coleman, H.G.; McCain, R.S. Pancreatic cancer: A review of clinical diagnosis, epidemiology, treatment and outcomes. World J. Gastroenterol. 2018, 24, 4846–4861. [Google Scholar] [CrossRef]
- Fransen, L.F.C.; Luyer, M.D.P. Effects of improving outcomes after esophagectomy on the short- and long-term: A review of literature. J. Thorac. Dis. 2019, 11, S845–S850. [Google Scholar] [CrossRef] [PubMed]
- Weimann, A.; Braga, M.; Carli, F.; Higashiguchi, T.; Hübner, M.; Klek, S.; Laviano, A.; Ljungqvist, O.; Lobo, D.N.; Martindale, R.; et al. ESPEN guideline: Clinical nutrition in surgery. Clin. Nutr. 2017, 36, 623–650. [Google Scholar] [CrossRef] [PubMed] [Green Version]
- Lobo, D.N.; Gianotti, L.; Adiamah, A.; Barazzoni, R.; Deutz, N.E.; Dhatariya, K.; Greenhaff, P.L.; Hiesmayr, M.; Jakobsen, D.H.; Klek, S.; et al. Perioperative nutrition: Recommendations from the ESPEN expert group. Clin. Nutr. 2020, 39, 3211–3227. [Google Scholar] [CrossRef] [PubMed]
- Arends, J.; Baracos, V.; Bertz, H.; Bozzetti, F.; Calder, P.; Deutz, N.; Erickson, N.; Laviano, A.; Lisanti, M.; Lobo, D.; et al. ESPEN expert group recommendations for action against cancer-related malnutrition. Clin. Nutr. 2017, 36, 1187–1196. [Google Scholar] [CrossRef] [Green Version]
- Muscaritoli, M.; Arends, J.; Aapro, M. From guidelines to clinical practice: A roadmap for oncologists for nutrition therapy for cancer patients. Ther. Adv. Med. Oncol. 2019, 11, 1–14. [Google Scholar] [CrossRef] [Green Version]
- Carey, S.; He, L.; Ferrie, S. Nutritional management of patients undergoing major upper gastrointestinal surgery: A survey of current practice in Australia. Nutr. Diet. 2010, 67, 219–223. [Google Scholar] [CrossRef]
- Williams, J.; Wischmeyer, P.E. Assessment of perioperative nutrition practices and attitudes—A national survey of colorectal and GI surgical oncology programs. Am. J. Surg. 2017, 213, 1010–1018. [Google Scholar] [CrossRef]
- Deftereos, I.; Kiss, N.; Isenring, E.; Carter, V.M.; Yeung, J.M. A systematic review of the effect of preoperative nutrition support on nutritional status and treatment outcomes in upper gastrointestinal cancer resection. Eur. J. Surg. Oncol. 2020, 46, 1423–1434. [Google Scholar] [CrossRef] [PubMed]
- Lu, Y.; Carey, S. Translating Evidence-Based Practice Guidelines into a Summary of Recommendations for the Nutrition Management of Upper Gastrointestinal Cancers. Nutr. Clin. Pract. 2014, 29, 518–525. [Google Scholar] [CrossRef] [PubMed]
- Bozzetti, F.; Mariani, L.; Lo Vullo, S.; Amerio, M.L.; Biffi, R.; Caccialanza, G.; Correja, I.; Cozzaglio, L.; Di Leo, A.; Di Cosmo, L.; et al. The nutritional risk in oncology: A study of 1453 cancer outpatients. Support. Care Cancer 2012, 20, 1919–1928. [Google Scholar] [CrossRef] [Green Version]
- Marshall, K.M.; Loeliger, J.; Nolte, L.; Kelaart, A.; Kiss, N.K. Prevalence of malnutrition and impact on clinical outcomes in cancer services: A comparison of two time points. Clin. Nutr. 2019, 38, 644–651. [Google Scholar] [CrossRef] [PubMed]
- Hébuterne, X.; Lemarié, E.; Michallet, M.; De Montreuil, C.B.; Schneider, S.; Goldwasser, F. Prevalence of Malnutrition and Current Use of Nutrition Support in Patients with Cancer. J. Parenter. Enter. Nutr. 2014, 38, 196–204. [Google Scholar] [CrossRef] [PubMed]
- Findlay, M.; Bauer, J.D.; Dhaliwal, R.; De Van Der Schueren, M.; Laviano, A.; Widaman, A.; Martin, L.; Day, A.G.; Gramlich, L.M. Translating Evidence-Based Guidelines into Practice—Are We Getting It Right? A Multi-Centre Prospective International Audit of Nutrition Care in Patients with Foregut Tumors (INFORM). Nutrients 2020, 12, 3808. [Google Scholar] [CrossRef]
- Deftereos, I.; Yeung, J.M.C.; Carter, V.M.; Isenring, E.; Kiss, N.K. Nutritional Outcomes of patients Undergoing Resection for upper gastroIntestinal cancer in AuStralian Hospitals (NOURISH): Protocol for a multicentre point prevalence study. BMJ Open 2020, 10, e035824. [Google Scholar] [CrossRef] [PubMed]
- Brody, T. Clinical Trials: Study Design, Endpoints and Biomarkers, Drug Safety, and FDA and ICH Guidelines; Elsevier Science & Technology: St. Louis, MO, USA, 2011. [Google Scholar]
- Detsky, A.S.; McLaughlin, J.R.; Baker, J.P.; Johnston, N.; Whittaker, S.; Mendelson, R.A.; Jeejeebhoy, K.N. What is subjective global assessment of nutritional status? JPEN J. Parenter. Enter. Nutr. 1987, 11, 8–13. [Google Scholar] [CrossRef] [Green Version]
- Jensen, G.L.; Cederholm, T.; Correia, M.; Gonzalez, M.C.; Fukushima, R.; Higashiguchi, T.; de Baptista, G.A.; Barazzoni, R.; Blaauw, R.; Coats, A.J.S.; et al. GLIM Criteria for the Diagnosis of Malnutrition: A Consensus Report from the Global Clinical Nutrition Community. JPEN J. Parenter. Enter. Nutr. 2019, 43, 32–40. [Google Scholar] [CrossRef] [Green Version]
- Roberts, H.C.; Denison, H.; Martin, H.J.; Patel, H.P.; Syddall, H.; Cooper, C.; Sayer, A.A. A review of the measurement of grip strength in clinical and epidemiological studies: Towards a standardised approach. Age Ageing 2011, 40, 423–429. [Google Scholar] [CrossRef] [Green Version]
- Narendra, K.; Kiss, N.; Margerison, C.; Johnston, B.; Chapman, B. Impact of nutritional status/risk and post-operative nutritional management on clinical outcomes in patients undergoing gastrointestinal surgery: A prospective observational study. J. Hum. Nutr. Diet. 2020, 33, 587–597. [Google Scholar] [CrossRef]
- Garth, A.K.; Newsome, C.M.; Simmance, N.; Crowe, T.C. Nutritional status, nutrition practices and post-operative complications in patients with gastrointestinal cancer. J. Hum. Nutr. Diet. 2010, 23, 393–401. [Google Scholar] [CrossRef] [PubMed]
- Hill, A.; Kiss, N.; Hodgson, B.; Crowe, T.C.; Walsh, A.D. Associations between nutritional status, weight loss, radiotherapy treatment toxicity and treatment outcomes in gastrointestinal cancer patients. Clin. Nutr. 2011, 30, 92–98. [Google Scholar] [CrossRef]
- Attar, A.; Malka, D.; Sabaté, J.M.; Bonnetain, F.; LeComte, T.; Aparicio, T.; Locher, C.; Laharie, D.; Ezenfis, J.; Taieb, J. Malnutrition Is High and Underestimated During Chemotherapy in Gastrointestinal Cancer: An AGEO Prospective Cross-Sectional Multicenter Study. Nutr. Cancer 2012, 64, 535–542. [Google Scholar] [CrossRef]
- Cao, J.; Xu, H.; Li, W.; Guo, Z.; Lin, Y.; Shi, Y.; Hu, W.; Ba, Y.; Li, S.; Li, Z.; et al. Nutritional assessment and risk factors associated to malnutrition in patients with esophageal cancer. Curr. Probl. Cancer 2021, 45, 100638. [Google Scholar] [CrossRef] [PubMed]
- Guo, Z.Q.; Yu, J.M.; Li, W.; Fu, Z.; Lin, Y.; Shi, Y.Y.; Hu, W.; Ba, Y.; Li, S.Y.; Li, Z.N.; et al. Survey and analysis of the nutritional status in hospitalized patients with malignant gastric tumors and its influence on the quality of life. Support. Care Cancer 2020, 28, 373–380. [Google Scholar] [CrossRef] [Green Version]
- Lambert, A.; Schwarz, L.; Borbath, I.; Henry, A.; Van Laethem, J.-L.; Malka, D.; Ducreux, M.; Conroy, T. An update on treatment options for pancreatic adenocarcinoma. Ther. Adv. Med. Oncol. 2019, 11, 1–43. [Google Scholar] [CrossRef] [PubMed] [Green Version]
- Byrnes, A.; Mudge, A.; Young, A.; Banks, M.; Bauer, J. Use of hand grip strength in nutrition risk screening of older patients admitted to general surgical wards. Nutr. Diet. 2018, 75, 520–526. [Google Scholar] [CrossRef] [PubMed]
- Powell-Brett, S.; Carino, N.D.L.; Roberts, K. Understanding pancreatic exocrine insufficiency and replacement therapy in pancreatic cancer. Eur. J. Surg. Oncol. 2020, 47, 539–544. [Google Scholar] [CrossRef]
- Movahed, S.; Tabrizi, F.V.; Pahlavani, N.; Toussi, M.S.; Motlagh, A.G.; Eslami, S.; Ghayour-Mobarhan, M.; Nematy, M.; Ferns, G.A.; Emadzadeh, M.; et al. Comprehensive assessment of nutritional status and nutritional-related complications in newly diagnosed esophageal cancer patients: A cross-sectional study. Clin. Nutr. 2021, in press. [Google Scholar] [CrossRef]
- Grace, E.M.; Shaw, C.; Lalji, A.; Mohammed, K.; Andreyev, H.J.N.; Whelan, K. Nutritional status, the development and persistence of malnutrition and dietary intake in oesophago-gastric cancer: A longitudinal cohort study. J. Hum. Nutr. Diet. 2018, 31, 785–792. [Google Scholar] [CrossRef] [PubMed] [Green Version]
- Bower, M.; Jones, W.; Vessels, B.; Scoggins, C.; Martin, R. Nutritional Support with Endoluminal Stenting During Neoadjuvant Therapy for Esophageal Malignancy. Ann. Surg. Oncol. 2009, 16, 3161–3168. [Google Scholar] [CrossRef] [PubMed]
- De Pinho, N.B.; Martucci, R.B.; Rodrigues, V.D.; D’Almeida, C.A.; Thuler, L.C.S.; Saunders, C.; Jager-Wittenaar, H.; Peres, W.A.F. Malnutrition associated with nutrition impact symptoms and localization of the disease: Results of a multicentric research on oncological nutrition. Clin. Nutr. 2019, 38, 1274–1279. [Google Scholar] [CrossRef] [PubMed]
- Williams, G.R.; Al-Obaidi, M.; Dai, C.; Mir, N.; Challa, S.A.; Ms, M.D.; Patel, H.; Barlow, B.; Young-Smith, C.; Gbolahan, O.; et al. Association of malnutrition with geriatric assessment impairments and health-related quality of life among older adults with gastrointestinal malignancies. Cancer 2020, 126, 5147–5155. [Google Scholar] [CrossRef]
- Arends, J.; Bachmann, P.; Baracos, V.; Barthelemy, N.; Bertz, H.; Bozzetti, F.; Fearon, K.; Hütterer, E.; Isenring, E.; Kaasa, S.; et al. ESPEN guidelines on nutrition in cancer patients. Clin. Nutr. 2017, 36, 11–48. [Google Scholar] [CrossRef] [Green Version]
- Dindo, D.; Demartines, N.; Clavien, P.A. Classification of surgical complications: A new proposal with evaluation in a cohort of 6336 patients and results of a survey. Ann. Surg. 2004, 240, 205–213. [Google Scholar] [CrossRef]


| Variables | Overall | Oesophagectomy | Gastrectomy | Pancreatectomy | p Value | ||||
|---|---|---|---|---|---|---|---|---|---|
| n = 200 | n = 66 | n = 50 a | n = 84 b | ||||||
| Age (Mean, SD) | 67 | 10 | 66 | 9 | 70 | 11 | 66 | 10 | 0.111 |
| Sex (n, %) | 0.002 | ||||||||
| Male | 117 | 58.5% | 50 | 75.8% | 27 | 54.0% | 40 | 47.6% | |
| Female | 83 | 41.5% | 16 | 24.2% | 23 | 46.0% | 44 | 52.4% | |
| Tumour Location (n, %) | NA | ||||||||
| Gastric | 50 | 25.0% | 1 | 1.5% | 48 | 96.0% | 1 | 1.2% | |
| Oesophageal | 60 | 30.0% | 60 | 90.9% | NA | NA | NA | NA | |
| Pancreatic | 55 | 27.5% | NA | NA | NA | NA | 55 | 65.5% | |
| Ampullary | 17 | 8.5% | NA | NA | NA | NA | 17 | 20% | |
| GOJ | 7 | 3.5% | 5 | 7.6% | 2 | 4.0% | NA | NA | |
| Bile Duct | 6 | 3.0% | NA | NA | NA | NA | 6 | 7.1% | |
| Duodenal | 5 | 2.5% | NA | NA | NA | NA | 5 | 6.0% | |
| Tumour Type (n, %) | NA | ||||||||
| Adenocarcinoma | 170 | 85.0% | 54 | 81.8% | 49 | 98.0% | 67 | 79.8% | |
| SCC | 11 | 5.5% | 11 | 16.7% | 0 | 0.0% | NA | NA | |
| GIST | 2 | 1.0% | NA | NA | 1 | 2.0% | 1 | 1.2% | |
| NET | 11 | 5.5% | NA | NA | 0 | 0.0% | 11 | 13.1% | |
| Other | 6 | 3.0% | 1 | 1.5% | 0 | 0.0% | 5 | 6.0% | |
| Intraoperative Tumour Stage (n, %) | <0.001 | ||||||||
| T0 | 15 | 7.5% | 12 | 18.2% | 2 | 4.0% | 1 | 1.2% | |
| T1 | 44 | 22.0% | 20 | 30.3% | 11 | 22.0% | 13 | 15.5% | |
| T2 | 49 | 24.5% | 10 | 15.2% | 8 | 16.0% | 31 | 36.9% | |
| T3 | 63 | 31.5% | 21 | 31.8% | 20 | 40.0% | 22 | 26.2% | |
| T4 | 14 | 7.0% | 0 | 0.0% | 9 | 18.0% | 5 | 6.0% | |
| TX | 2 | 1.0% | 0 | 0.0% | 0 | 0.0% | 2 | 2.4% | |
| Unknown/Unassessed c | 13 | 6.5% | 3 | 4.5% | 0 | 0.0% | 10 | 11.9% | |
| Received Neoadjuvant Therapy (n, %) | <0.001 | ||||||||
| No | 106 | 53.3% | 17 | 25.8% | 15 | 30.6% | 74 | 88.1% | |
| Yes | 93 | 46.7% | 49 | 74.2% | 34 | 69.4% | 10 | 11.9% | |
| Type of Neoadjuvant Therapy (n, %) d | <0.001 | ||||||||
| Chemotherapy | 52 | 55.9% | 10 | 20.4% | 32 | 94.1% | 10 | 100.0% | |
| Chemotherapy and Radiotherapy | 41 | 44.1% | 39 | 79.6% | 2 | 5.9% | 0 | 0.0% | |
| Completed Neoadjuvant Therapy (n, %) d | |||||||||
| No | 3 | 3.2% | 0 | 0.0% | 3 | 8.9% | 0 | 0.0% | |
| Yes | 88 | 94.6% | 49 | 100.0% | 29 | 85.3% | 10 | 100.0% | |
| Unknown | 2 | 2.2% | 0 | 0.0% | 2 | 5.8% | 0 | 0.0% | |
| Location of Residence (n, %) | 0.482 | ||||||||
| Metropolitan | 143 | 71.5% | 45 | 68.2% | 39 | 78.0% | 59 | 70.2% | |
| Rural/Regional | 57 | 28.5% | 21 | 31.8% | 11 | 22.0% | 25 | 29.8% | |
| Social Situation (n, %) | 0.872 | ||||||||
| Lives Alone | 45 | 22.5% | 13 | 19.7% | 10 | 20.0% | 22 | 26.2% | |
| Lives with Family/Carer | 152 | 76.0% | 52 | 78.8% | 39 | 78.0% | 61 | 72.6% | |
| Lives in Shared Accommodation | 0 | 0.0% | 0 | 0.0% | 0 | 0.0% | 0 | 0.0% | |
| Lives in Residential Care | 3 | 1.5% | 1 | 1.5% | 1 | 2.0% | 1 | 1.2% | |
| Surgical Technique (n, %) | <0.001 | ||||||||
| Open | 187 | 93.5% | 53 | 80.3% | 50 | 100.0% | 84 | 100.0% | |
| Laparoscopic/Minimally Invasive | 13 | 6.5% | 13 | 19.7% | 0 | 0.0% | 0 | 0.0% | |
| Variable | Overall | Oesophagectomy | Gastrectomy | Pancreatectomy | p Value | ||||
|---|---|---|---|---|---|---|---|---|---|
| n = 200 | n = 66 | n = 50 | n = 84 | ||||||
| SGA Rating (n, %) | 0.689 | ||||||||
| A No Malnutrition | 116 | 58.0% | 40 | 60.6% | 28 | 56.0% | 48 | 57.1% | |
| B Mild/Moderate Malnutrition | 79 | 39.5% | 24 | 36.4% | 22 | 44.0% | 33 | 39.3% | |
| C Severe Malnutrition | 5 | 2.5% | 2 | 3.0% | 0 | 0.0% | 3 | 3.6% | |
| Overall Nutritional Status (n, %) | 0.864 | ||||||||
| Well Nourished (SGA A) | 116 | 58.0% | 40 | 60.6% | 28 | 56.0% | 48 | 57.1% | |
| Malnourished (SGA B/C) | 84 | 42.0% | 26 | 39.4% | 22 | 44.0% | 36 | 42.9% | |
| Unintentional Weight Loss (n, %) | 0.645 | ||||||||
| No | 71 | 35.5% | 24 | 36.4% | 20 | 40.0% | 27 | 32.1% | |
| Yes | 129 | 64.5% | 42 | 63.6% | 30 | 60.0% | 57 | 67.9% | |
| Low Muscle Strength (n, %) | 0.075 | ||||||||
| No | 54 | 27.0% | 23 | 34.8% | 9 | 1.08% | 22 | 26.2% | |
| Yes | 48 | 24.0% | 12 | 18.2% | 16 | 32.0% | 20 | 23.8% | |
| Not Completed | 98 | 49.0% | 31 | 47.0% | 25 | 50.0% | 42 | 50.0% | |
| BMI (kg/m2) (Mean, SD) | 27.3 | 5.6 | 27.3 | 5.1 | 27.5 | 6.1 | 27.2 | 5.7 | 0.917 |
| BMI Categories (n, %) | 0.214 | ||||||||
| Underweight | 20 | 10.0% | 3 | 4.5% | 8 | 16.0% | 9 | 10.7% | |
| Normal Weight | 75 | 37.5% | 30 | 45.5% | 17 | 34.0% | 28 | 33.3% | |
| Overweight/Obese | 105 | 52.5% | 33 | 50.0% | 25 | 50.0% | 47 | 56.0% | |
| Reduced Dietary Intake before Surgical Admission (n, %) | 0.099 | ||||||||
| No | 101 | 50.5% | 34 | 51.5% | 31 | 62.0% | 36 | 42.9% | |
| Yes | 99 | 49.5% | 32 | 48.5% | 19 | 38.0% | 48 | 57.1% | |
| Degree of Reduction in Solid Food Intake (n, %) | 0.602 | ||||||||
| >75% of Usual Intake | 27 | 13.5% | 10 | 15.2% | 6 | 12.0% | 11 | 13.1% | |
| ≤75% of Usual Intake | 34 | 17.0% | 11 | 16.7% | 6 | 12.0% | 17 | 20.2% | |
| ≤50% of Usual Intake | 31 | 15.5% | 8 | 12.1% | 6 | 12.0% | 17 | 20.2% | |
| ≤25% of Usual Intake | 7 | 3.5% | 3 | 4.5% | 1 | 2.0% | 3 | 3.6% | |
| No Reduction in Intake | 101 | 50.5% | 34 | 51.5% | 31 | 62.0% | 36 | 42.9% | |
| Length of Time of Reduced Dietary Intake (n, %) | 0.021 | ||||||||
| <1 Week | 2 | 1.0% | 2 | 1.5% | 0 | 0.0% | 1 | 1.2% | |
| 1–2 Weeks | 11 | 5.5% | 2 | 1.5% | 3 | 6.0% | 7 | 8.3% | |
| 2–4 Weeks | 13 | 6.5% | 2 | 1.5% | 1 | 2.0% | 11 | 13.1% | |
| ≥1 Month | 69 | 34.5% | 29 | 43.9% | 14 | 28.0% | 26 | 31.0% | |
| No Reduction in Intake | 105 | 52.5% | 34 | 51.5% | 32 | 64.0% | 39 | 46.4% | |
| Symptoms Persisting >2 Weeks Prior to Surgery Impacting Ability to Eat | |||||||||
| Poor Appetite | 0.062 | ||||||||
| No | 126 | 63.0% | 49 | 74.2% | 30 | 60.0% | 47 | 56.0% | |
| Yes | 74 | 37.0% | 17 | 25.8% | 20 | 40.0% | 37 | 44.0% | |
| Nausea | 0.307 | ||||||||
| No | 172 | 86.0% | 60 | 90.9% | 43 | 86.0% | 69 | 82.1% | |
| Yes | 28 | 14.0% | 6 | 9.1% | 7 | 14.0% | 15 | 17.9% | |
| Vomiting | 0.952 | ||||||||
| No | 187 | 93.5% | 62 | 93.9% | 47 | 94.0% | 78 | 92.9% | |
| Yes | 13 | 6.5% | 4 | 6.1% | 3 | 6.0% | 6 | 7.1% | |
| Diarrhoea | 0.001 | ||||||||
| No | 181 | 90.5% | 66 | 100.0% | 46 | 92.0% | 69 | 82.1% | |
| Yes | 19 | 9.5% | 0 | 0.0% | 4 | 8.0% | 15 | 17.9% | |
| Constipation | 0.382 | ||||||||
| No | 193 | 96.5% | 62 | 93.9% | 49 | 98.0% | 82 | 97.6% | |
| Yes | 7 | 3.5% | 4 | 6.1% | 1 | 2.0% | 2 | 2.4% | |
| Pain When Eating | 0.966 | ||||||||
| No | 178 | 89.0% | 59 | 89.0% | 44 | 88.0% | 75 | 89.3% | |
| Yes | 22 | 11.0% | 7 | 11.0% | 6 | 12.0% | 9 | 10.7% | |
| Taste Changes | 0.005 | ||||||||
| No | 172 | 86.0% | 51 | 77.3% | 41 | 82.0% | 80 | 95.2% | |
| Yes | 28 | 14.0% | 15 | 22.7% | 9 | 18.0% | 4 | 4.8% | |
| Dry Mouth | 0.738 | ||||||||
| No | 191 | 95.5% | 64 | 97.0% | 47 | 94.0% | 80 | 95.2% | |
| Yes | 9 | 4.5% | 2 | 3.0% | 3 | 6.0% | 4 | 4.8% | |
| Problems Swallowing | <0.001 | ||||||||
| No | 185 | 92.5% | 53 | 80.3% | 50 | 100.0% | 82 | 97.6% | |
| Yes | 15 | 7.5% | 13 | 19.7% | 0 | 0.0% | 2 | 2.4% | |
| Early Satiety | 0.034 | ||||||||
| No | 155 | 77.5% | 57 | 86.4% | 33 | 66.0% | 65 | 77.4% | |
| Yes | 45 | 22.5% | 9 | 13.6% | 17 | 34.0% | 19 | 22.6% | |
| No Problems Reported | 0.972 | ||||||||
| No | 110 | 55.0% | 36 | 54.5% | 27 | 54.0% | 47 | 56.0% | |
| Yes | 90 | 45.0% | 30 | 45.5% | 23 | 46.0% | 37 | 44.0% | |
| Malnutrition | Unintentional Weight Loss ≥ 5% in 6 Months | |||||||||
|---|---|---|---|---|---|---|---|---|---|---|
| Bivariate Analysis (Fisher’s Exact) | Univariate Logistic Model | Bivariate Analysis (Fisher’s Exact) | Univariate Logistic Model | |||||||
| Variable | WN n (%) | MN n (%) | p Value | OR (95% CI) | p Value | No n (%) | Yes n (%) | p Value | OR (95% CI) | p Value |
| Age | 0.012 | 0.549 | ||||||||
| <65 | 54 (69.2) | 24 (30.8) | 1.0 (ref) | 45 (60.8) | 29 (39.2) | 1.0 (ref) | ||||
| ≥65 | 62 (50.8) | 60 (49.2) | 2.2 (1.2, 4.0) | 0.011 | 64 (56.1) | 50 (43.9) | 1.2 (0.7, 2.2) | 0.526 | ||
| Sex (n, %) | 0.082 | 0.654 | ||||||||
| Male | 74 (63.2) | 43 (36.8) | 1.0 (ref) | 66 (59.5) | 45 (40.5) | 1.0 (ref) | ||||
| Female | 42 (50.6) | 41 (49.4) | 1.7 (0.9, 3.0) | 0.075 | 43 (55.8) | 34 (44.2) | 1.2 (0.6, 2.1) | 0.621 | ||
| Surgery Type | 0.864 | 0.588 | ||||||||
| Oesophagectomy | 40 (60.6) | 26 (39.4) | 1.0 (ref) | 37 (56.9) | 28 (43.1) | 1.0 (ref) | ||||
| Gastrectomy | 28 (56.0) | 22 (44.0) | 1.2 (0.6, 2.5) | 0.618 | 29 (64.4) | 16 (35.6) | 0.7 (0.3, 1.6) | 0.429 | ||
| Pancreatectomy | 48 (57.1) | 36 (42.9) | 1.2 (0.6, 2.2) | 0.669 | 43 (55.1) | 35 (44.9) | 1.1 (0.6, 2.1) | 0.830 | ||
| Tumour Location | 0.926 | 0.380 | ||||||||
| Bile Duct | 4 (66.7) | 2 (33.3) | 1.0 (ref) | 4 (66.7) | 2 (33.3) | 1.0 (ref) | ||||
| Gastric | 28 (56.0) | 22 (44.0) | 1.6 (0.3, 9.4) | 0.620 | 29 (63.0) | 17 (37.0) | 1.2 (0.2, 7.1) | 0.862 | ||
| Oesophageal | 37 (61.7) | 23 (38.3) | 1.2 (0.2, 7.3) | 0.810 | 34 (56.7) | 26 (43.3) | 1.5 (0.3, 9.0) | 0.638 | ||
| Pancreatic | 32 (58.2) | 23 (41.8) | 1.4 (0.2, 8.5) | 0.689 | 29 (56.9) | 22 (43.1) | 1.5 (0.3, 9.1) | 0.657 | ||
| Ampullary | 10 (58.8) | 7 (41.2) | 1.4 (0.2, 9.9) | 0.736 | 10 (62.5) | 6 (37.5) | 1.2 (0.2, 8.7) | 0.857 | ||
| Duodenal | 2 (40.0) | 3 (60.0) | 3 (0.3, 35.3) | 0.383 | 0 (0) | 4 (100) | Empty | |||
| GOJ | 3 (42.9) | 4 (57.1) | 2.7 (0.3, 25.6) | 0.396 | 3 (60) | 2 (40) | 1.3 (0.1, 15.7) | 0.819 | ||
| Tumour Type | 0.335 | 0.912 | ||||||||
| Adenocarcinoma | 95 (55.9) | 75 (44.1) | 1.6 (0.3, 8.9) | 0.604 | 91 (57.2) | 68 (42.8) | 0.8 (0.2, 3.8) | 0.726 | ||
| SCC | 6 (54.5) | 5 (45.5) | 1.7 (0.2, 13.2) | 0.629 | 7 (63.6) | 4 (36.4) | 0.6 (0.1, 4.3) | 0.587 | ||
| GIST | 2 (100) | 0 (0) | Empty | 1 (50) | 1 (50) | 1.0 (0.1, 24.6) | 1.00 | |||
| NET | 9 (81.8) | 2 (18.2) | 0.4 (0.0, 4.4) | 0.487 | 7 (70) | 3 (30) | 0.4 (0.1, 3.5) | 0.428 | ||
| Other | 4 (66.7) | 2 (33.3) | 1.0 (ref) | 3 (50) | 3 (50) | 1.0 (ref) | ||||
| Tumour Stage | 0.022 | 0.509 | ||||||||
| T0 | 10 (66.7) | 5 (33.3) | 1.0 (ref) | 9 (64.3) | 5 (35.7) | 1.0 (ref) | ||||
| T1 | 31 (70.5) | 13 (29.5) | 0.8 (0.2, 2.9) | 0.783 | 28 (65.1) | 15 (34.9) | 1.0 (0.3, 3.4) | 0.955 | ||
| T2 | 29 (59.2) | 20 (40.8) | 1.4 (0.4, 4.7) | 0.604 | 25 (55.6) | 20 (44.4) | 1.4 (0.4, 5.0) | 0.565 | ||
| T3 | 29 (46.0) | 34 (54.0) | 2.3 (0.7, 7.6) | 0.158 | 31 (51.7) | 29 (48.3) | 1.7 (0.5, 5.6) | 0.397 | ||
| T4 | 4 (28.6) | 10 (71.4) | 5.0 (1.0, 24.3) | 0.046 | 5 (41.7) | 7 (58.3) | 2.5 (0.5, 12.3) | 0.253 | ||
| Neoadjuvant Therapy | 0.774 | 0.882 | ||||||||
| No | 60 (56.6) | 46 (43.4) | 1.0 (ref) | 57 (58.8) | 40 (41.2) | 1.0 (ref) | ||||
| Yes | 55 (59.1) | 38 (40.9) | 0.9 (0.5, 1.6) | 0.718 | 51 (56.7) | 39 (43.3) | 1.1 (0.6, 2.0) | 0.772 | ||
| Type of Neoadjuvant | 0.205 | 0.089 | ||||||||
| Chemotherapy | 34 (65.4) | 18 (34.6) | 1.0 (ref) | 32 (65.3) | 17 (34.7) | 1.0 (ref) | ||||
| Chemotherapy and Radiotherapy | 21 (51.2) | 20 (48.8) | 0.6 (−0.3, 1.4) | 0.169 | 19 (46.3) | 22 (53.7) | 2.2 (0.9, 5.1) | 0.072 | ||
| Completed Neoadjuvant | 1.000 | 1.000 | ||||||||
| No | 2 (66.7) | 1 (33.3) | 1.0 (ref) | 2 (66.7) | 1 (33.3) | 1.0 (ref) | ||||
| Yes | 51 (58.0) | 37 (42.0) | 1.5 (0.1, 16.6) | 0.765 | 47 (55.3) | 38 (44.7) | 1.6 (0.1, 18.5) | 0.699 | ||
| Location of Residence | 0.428 | 0.137 | ||||||||
| Rural/Regional | 36 (63.2) | 21 (36.8) | 1.0 (ref) | 35 (67.3) | 17 (32.7) | 1.0 (ref) | ||||
| Metropolitan | 80 (55.9) | 63 (44.1) | 1.3 (0.7, 2.5) | 0.352 | 74 (54.4) | 62 (45.6) | 1.7 (0.9, 3.4) | 0.111 | ||
| Social Situation | 0.132 | 0.863 | ||||||||
| Lives with Family or Carer | 94 (61.8) | 58 (38.2) | 1.0 (ref) | 85 (59) | 59 (41) | 1.0 (ref) | ||||
| Lives Alone | 21 (46.7) | 24 (53.3) | 1.8 (0.9, 3.6) | 0.07 | 23 (54.8) | 19 (45.2) | 1.2 (0.6, 2.4) | 0.622 | ||
| Lives in Residential Care | 1 (33.3) | 2 (66.7) | 3.2 (0.3, 36.5) | 0.341 | 1 (50) | 1 (50) | 1.4 (0.1, 23.5) | 0.798 | ||
| Malnutrition | UnintentionalNINTENTIONAL Weight Loss ≥5% in 6 Months | |||||||||
|---|---|---|---|---|---|---|---|---|---|---|
| Bivariate Analysis (Fisher’s Exact) | Univariate Logistic Model | Bivariate Analysis (Fisher’s Exact) | Univariate Logistic Model | |||||||
| Variable | No n (%) | Yes n (%) | p Value | OR (95% CI) | p Value | No n (%) | Yes n (%) | p Value | OR (95% CI) | p Value |
| BMI | <0.001 | <0.001 | ||||||||
| Normal Weight | 33 (44.0) | 42 (56.0) | 1.0 (ref) | 37 (53.6) | 32 (46.4) | 1.0 (ref) | ||||
| Underweight | 3 (85.0) | 17 (85.0) | 4.5 (1.2, 16.5) | 0.025 | 3(16.7) | 15 (83.3) | 5.8 (1.5, 21.8) | 0.010 | ||
| Overweight/Obese | 80 (76.2) | 25 (23.8) | 0.2 (0.1, 0.5) | <0.001 | 69 (68.3) | 21 (31.7) | 0.5 (0.3, 1.1) | 0.053 | ||
| GI Symptoms | ||||||||||
| Unchecked | 1.0 (ref) | 1.0 (ref) | ||||||||
| Poor Appetite | 17 (23.0) | 57 (77.0) | <0.001 | 12.3 (6.2, 24.5) | <0.001 | 18 (26.9) | 49 (73.1) | <0.001 | 8.3 (4.2, 16.3) | <0.001 |
| Nausea | 8 (28.6) | 20 (71.4) | 0.001 | 4.2 (1.8, 10.1) | 0.001 | 7 (26.9) | 19 (73.1) | 0.001 | 4.6 (1.8, 11.6) | 0.001 |
| Vomiting | 1 (7.7) | 12 (92.3) | <0.001 | 19.2 (2.4, 150.6) | 0.005 | 3(23.1) | 10 (76.9) | 0.016 | 5.1 (1.4, 19.3) | 0.016 |
| Diarrhoea | 4 (21.1) | 15 (78.9) | 0.001 | 6.1 (1.9, 19.1) | 0.002 | 6 (35.3) | 11 (54.7) | 0.069 | 2.8 (1.0, 7.9) | 0.054 |
| Constipation | 1 (14.3) | 6 (85.7) | 0.043 | 8.8 (1.0, 74.9) | 0.046 | 2 (28.6) | 5 (71.4) | 0.133 | 3.6 (0.7, 19.1) | 0.131 |
| Pain When Eating | 8 (36.4) | 14 (63.6) | 0.039 | 2.7 (1.1, 6.8) | 0.034 | 4 (21.1) | 15 (78.9) | 0.001 | 6.2 (2.0, 19.4) | 0.002 |
| Taste Changes | 10 (35.7) | 18 (63.3) | 0.013 | 2.9 (1.3, 6.6) | 0.012 | 13 (48.1) | 14 (51.9) | 0.296 | 1.6 (0.7, 3.6) | 0.266 |
| Dry Mouth | 2 (22.2) | 7 (77.8) | 0.037 | 5.2 (1.0, 25.6) | 0.044 | 4 (50) | 4 (50) | 0.722 | 1.4 (0.3, 5.8) | 0.642 |
| Problems Swallowing | 3 (20.0) | 12 (80.0) | 0.002 | 6.3 (1.7, 23.0) | 0.006 | 4 (28.6) | 10 (71.4) | 0.025 | 3.8 (1.2, 12.6) | 0.029 |
| Early Satiety | 16 (35.6) | 29 (64.4) | 0.001 | 3.3 (1.6, 6.6) | 0.001 | 17 (42.5) | 23 (57.5) | 0.031 | 2.2 (1.1, 4.5) | 0.027 |
| Any LOW | <0.001 | NA | NA | |||||||
| No | 67 (94.4) | 4 (5.6) | 1.0 (ref) | <0.001 | ||||||
| Yes | 49 (38.0) | 80 (62.0) | 27.3 (9.4, 79.7) | |||||||
| LOW ≥5% in 6 Months | <0.001 | <0.001 | NA | NA | ||||||
| No | 29 (74.4) | 10 (25.6) | 1.0 (ref) | |||||||
| Yes | 14 (21.5) | 51 (78.5) | 29.1 (13.1, 64.6) | |||||||
| LOW ≥ 10% in 6 Months | <0.001 | <0.001 | NA | NA | ||||||
| No | 40 (58.0) | 29 (42.0) | 1.0 (ref) | |||||||
| Yes | 3 (8.6) | 32 (91.4) | 40.0 (11.6, 138.1) | |||||||
| Reduced Dietary Intake | <0.001 | <0.001 | ||||||||
| No | 84 (83.2) | 17 (16.8) | 1.0 (ref) | 75 (77.3) | 22 (22.7) | 1.0 (ref) | ||||
| Yes | 32 (32.3) | 67 (67.7) | 10.3 (5.3, 20.2) | <0.001 | 34 (37.4) | 57 (62.6) | 5.7 (3.0, 10.8) | <0.001 | ||
| Degree of Reduction in Solid Food Intake | <0.001 | <0.001 | ||||||||
| No Reduction in Intake | 84 (83.2) | 17 (16.8) | 1.0 (ref) | 75 (77.3) | 22 (22.7) | 1.0 (ref) | ||||
| >75% of Usual Intake | 17 (63.0) | 10 (37.0) | 2.9 (1.1, 7.4) | 0.026 | 16 (69.6) | 7 (30.4) | 1.5 (0.6, 4.1) | 0.437 | ||
| ≤75% of Usual Intake | 8 (23.5) | 26 (76.5) | 16.1 (6.2, 41.5) | <0.001 | 10 (32.3) | 21 (67.7) | 7.2 (2.9, 17.4) | <0.001 | ||
| ≤50% of Usual Intake | 5 (16.1) | 26 (83.9) | 25.7 (8.6, 76.4) | <0.001 | 6 (20) | 24 (80) | 13.6 (5.0, 37.6) | <0.001 | ||
| ≤25% of Usual Intake | 2 (28.6) | 5 (71.4) | 12.4 (2.2, 69.1) | 0.004 | 2 (28.6) | 5 (71.4) | 8.5 (1.6, 47.0) | 0.014 | ||
| Length of Time of Reduced Dietary Intake | <0.001 | <0.001 | ||||||||
| No Reduction in Intake | 88 (83.8) | 17 (16.2) | 1.0 (ref) | 78 (77.2) | 23 (22.8) | 1.0 (ref) | ||||
| <1 Week | 2 (100.0) | 0 (0) | Empty | 1 (100) | 0 (0) | (empty) | ||||
| 1–2 Weeks | 5 (45.5) | 6 (54.5) | 6.2 (1.7, 22.7) | 0.006 | 4 (36.4) | 7 (63.6) | 5.9 (1.6, 22.1) | 0.008 | ||
| 2–4 Weeks | 5 (38.5) | 8 (61.5) | 8.3 (2.4, 28.4) | 0.001 | 6 (46.2) | 7 (53.8) | 4.0 (1.2, 13.0) | 0.023 | ||
| ≥1 Month | 16 (23.2) | 53 (76.8) | 17.1 (8.0, 36.8) | <0.001 | 20 (32.3) | 42 (67.7) | 7.1 (3.5, 14.4) | <0.001 | ||
| Variable | Malnutrition OR (95% CI) | p Value | Unintentional Weight Loss ≥ 5%OR (95% CI) | p Value |
|---|---|---|---|---|
| Age ≥ 65 | 4.1 (1.5, 11.5) | 0.008 | ||
| LOW ≥ 5% in 6 Months | 28.7 (10.5, 78.6) | <0.001 | ||
| Length of Time of Reduced Intake | ||||
| 2–4 Weeks | 7.4 (1.3, 43.5) | 0.026 | ||
| ≥1 Month | 7.7 (2.7, 22.0) | <0.001 | ||
| Degree of reduction in solid food intake | ||||
| ≤75% of Usual Intake | 3.3 (1.2, 9.2) | 0.02 | ||
| ≤50% of Usual Intake | 4.9 (1.5, 15.6) | 0.008 | ||
| Nutrition Impact Symptoms | ||||
| Vomiting | 17.1 (1.4, 207.6) | 0.025 | ||
| Poor Appetite | 3.7 (1.6, 8.4) | 0.002 |
Publisher’s Note: MDPI stays neutral with regard to jurisdictional claims in published maps and institutional affiliations. |
© 2021 by the authors. Licensee MDPI, Basel, Switzerland. This article is an open access article distributed under the terms and conditions of the Creative Commons Attribution (CC BY) license (https://creativecommons.org/licenses/by/4.0/).
Share and Cite
Deftereos, I.; Yeung, J.M.C.; Arslan, J.; Carter, V.M.; Isenring, E.; Kiss, N.; on behalf of The NOURISH Point Prevalence Study Group. Assessment of Nutritional Status and Nutrition Impact Symptoms in Patients Undergoing Resection for Upper Gastrointestinal Cancer: Results from the Multi-Centre NOURISH Point Prevalence Study. Nutrients 2021, 13, 3349. https://doi.org/10.3390/nu13103349
Deftereos I, Yeung JMC, Arslan J, Carter VM, Isenring E, Kiss N, on behalf of The NOURISH Point Prevalence Study Group. Assessment of Nutritional Status and Nutrition Impact Symptoms in Patients Undergoing Resection for Upper Gastrointestinal Cancer: Results from the Multi-Centre NOURISH Point Prevalence Study. Nutrients. 2021; 13(10):3349. https://doi.org/10.3390/nu13103349
Chicago/Turabian StyleDeftereos, Irene, Justin M. C. Yeung, Janan Arslan, Vanessa M. Carter, Elizabeth Isenring, Nicole Kiss, and on behalf of The NOURISH Point Prevalence Study Group. 2021. "Assessment of Nutritional Status and Nutrition Impact Symptoms in Patients Undergoing Resection for Upper Gastrointestinal Cancer: Results from the Multi-Centre NOURISH Point Prevalence Study" Nutrients 13, no. 10: 3349. https://doi.org/10.3390/nu13103349
APA StyleDeftereos, I., Yeung, J. M. C., Arslan, J., Carter, V. M., Isenring, E., Kiss, N., & on behalf of The NOURISH Point Prevalence Study Group. (2021). Assessment of Nutritional Status and Nutrition Impact Symptoms in Patients Undergoing Resection for Upper Gastrointestinal Cancer: Results from the Multi-Centre NOURISH Point Prevalence Study. Nutrients, 13(10), 3349. https://doi.org/10.3390/nu13103349