Abstract
Nutritional status affects linear growth and development. However, studies on the associations between nutritional status, diet quality, and age-standardized height in children are limited. The aim of this study was to assess the relationship between macro- and micronutrient intake and food consumption and height-for-age Z score (HAZ) among US children in the National Health and Nutrition Examination Survey (NHANES). This cross-sectional population-based study included 6116 US children aged 2–18 years. The usual dietary intake of nutrients and food groups was estimated by the multiple source method (MSM) using two-day food consumption data from NHANES 2007–2014. After adjusting for covariates, HAZ was positively associated with intakes of energy, protein, carbohydrate, fat, vitamins A, D, E, B6, and B12, thiamin, riboflavin, niacin, calcium, and iron. Children in the highest tertile of HAZ were less likely to consume lower than the EAR for vitamin E and calcium. Major foods consumed by children with lower HAZ were soft drinks, high-fat milk products, cakes, cookies, pastries, and pies, whereas children with higher HAZ tended to consume low-fat milk products, tea, and low-calorie fruit juice. These findings suggest that adequate nutritional intake, diet quality, and nutrient-dense food are important factors for height in children.
1. Introduction
Height is a good overall indicator of a child’s growth and well-being, and stunting in childhood is a critical impediment to human development. Stunting is one of six global nutrition targets that the World Health Organization (WHO) have endorsed for improving maternal, infant and young child nutrition by 2025 [1]. Approximately 162 million children under five years old have been affected by growth faltering globally, which has negative impacts on individuals and societies, including impaired cognitive development [2,3], poor health and reduced productive capacity [4], and increased risk of disease and mortality [5,6].
Growth in childhood may be determined by the cumulative effects of short-and long-term factors, including household and family environment [7,8], infection [9], and nutritional intake [10]. Among several determinants of growth, it is well known that nutritional status in childhood directly affects growth and development [11]. Although extreme hunger is likely to be linked to severe malnutrition, well-nourished populations may not necessarily achieve nutritional adequacy. Adequate intake of energy, protein, and other nutrients plays an important role in growth. Energy and protein restriction have been shown to result in significant decreases in insulin-like growth factor 1 (IGF-1), a key hormone in the promotion of childhood growth, in animal [12] and human [13] studies. Selected studies have reported on the relationships between supplementation of particular nutrients or foods and growth [14,15], yet findings from previous studies on the effects of nutrients, foods, and food groups on skeletal growth are still limited. A randomized controlled trial [14] showed that high-dose vitamin A supplementation improved linear growth among Indonesian preschool children with low serum retinol. However, there are few studies exploring the relationship between dietary intake and linear growth based on the estimation of usual dietary intake. Therefore, the objective of this study was to assess the relationship between height-for-age Z score (HAZ) and usual intake of macronutrients, micronutrients, and food groups among US children, using data from the National Health and Nutrition Examination Survey (NHANES). To our knowledge, this is the first report describing the associations between nutritional status, diet quality, and age-standardized height in a large, representative sample of US children.
2. Materials and Methods
2.1. Study Population
This cross-sectional study included 6116 US children aged 2–18 years from NHANES 2007–2014 [16,17,18]. We excluded those with dietary recalls coded as unreliable or incomplete (n = 19), those who reported that 24-h diet was unusual, such as “much less than usual” or “much more than usual” (n = 3770), those who were on any kind of diet to lose weight or for other health-related reasons (n = 209), and those with missing height data (n = 125). NHANES study protocols were approved by the National Center for Health Statistics research ethics review board. (Continuation of Protocol #2005-06 for NHANES 2007-2010, Protocol #2011-17 for NHANES 2011-2012, and Continuation of Protocol #2011-17 for NHANES 2013-2014).
2.2. Estimation of Usual Dietary Intake
Dietary data were collected from participants through two 24-h dietary recalls. The first 24-h dietary recall was collected during an in-person interview and the second was collected by phone. The usual dietary intake of macronutrients, micronutrients and food groups was estimated by the Multiple Source Method (MSM) using two 24-h dietary recalls from NHANES 2007-2014. MSM is a new statistical method for estimating usual dietary intake on the basis of two or more short-term measurements, such as 24-h dietary recall data. The statistical algorithms of MSM account for intra-individual variation of intake. This method is characterized by a two-part shrinkage technique applied to residuals of two regression models: One for the positive daily intake data and one for the probability of consumption [19]. For the estimation of usual intake using MSM, different models were used for nutrients and food groups. Since the probability of nutrients consumption on a certain day is close to 100%, the probability of consumption was not added as a variable, and all subjects were considered as habitual consumers in the usual intake estimation model. However, as there is a possibility that there is a true non-consumer for food groups, the probability of consumption of the food group was added as a covariate to the model. The most accurate way to assess food group intake is to obtain frequency information for specific food groups through a long-term measurement such as a food frequency questionnaire (FFQ). However, as there is no FFQ in NHANES 2007–2014, the probability of consumption for each food group was calculated from the FFQ data collected in NHANES 2005–2006 and used in the process of estimating usual intake of NHANES 2007–2014 data, alternatively [20]. Participants were also classified as having met or having failed to meet the estimated average requirements (EAR) [21] for nutrients based on the usual intake calculated by MSM from the two days of dietary recalls. Whether participants had met or failed to meet the EAR for nutrients was determined according to age and gender.
Although food groups are chosen based on the first two digits of the USDA 8-digit food code, some foods were disaggregated to identify frequently consumed foods. Milk and milk products were disaggregated into high fat dairy products, low fat dairy products and yogurt. Frequently consumed fruit and 100% fruit juice, such as apple, orange, berry, banana, grapefruit, 100% apple juice, and 100% orange juice were separated from fruits and fruit juice. Nonalcoholic beverages were separated into coffee, tea, regular fruit juice drink, low-calorie fruit juice drink, and total carbonated soft drink.
2.3. Estimation of Height-for-Age Z Score
Physical examination data of participants including heights and weights were collected by trained health technicians in the Mobile Examination Center and measured as described in the NHANES Anthropometry Procedures Manual [22]. HAZ was calculated using World Health Organization (WHO) 2006 growth standards [23]. The Z score was estimated by using the L (power transformation for skewness), M (median), and S (dispersion) parameters in Cole’s LMS method [24].
2.4. Statistical Analysis
Statistical analyses were performed using SAS software, version 9.4 (SAS Institute Inc., Cary, NC, USA), using SAS survey procedures and the appropriate weight, strata, and cluster variables to account for the complex survey design. Participants were grouped into tertiles based on HAZ. The mean and frequencies according to tertiles of HAZ were calculated across sociodemographic factors. P-values for differences among subgroups were obtained by chi-square test and ANOVA. Odds ratios (ORs) for nutrient intake below the EAR and the corresponding 95% confidence intervals (CIs) were estimated using multiple logistic regression modeling. P-trends were calculated in a model adjusted for age, gender, ethnicity and birth weight. Birth weight and sleep hours were measured using questions of ‘how much sleep do you get (hours)?’ and ‘how much did you weigh at birth?’ Participants were grouped by poverty income ratio (PIR) as follows: <1.3, 1.3≤ to <1.85 and ≥1.85. PIR was defined as ratio of family income to federal poverty level. Physical activity was presented as metabolic equivalent of tasks (MET), which were based on weekly minutes of walking/bicycling and moderate and vigorous recreational activities, and multiplying the number of days per week by the average minutes of activities on a typical day [25]. MET-min/week were determined by multiplying weekly minutes of activities by the assigned MET values. We used the MET values provided by the NHANES manual, where suggested MET values of moderate recreational activities such as walking/bicycling were 4 MET and vigorous recreational activities were 8 MET. Participants who reported no walking/bicycling and no moderate and vigorous recreational activities for at least 10 min continuously were defined as inactive. Physical activity was then categorized as inactive, <500 MET-min/week, and ≥500 MET-min/week. All P-values reported are two sided (α = 0.05).
3. Results
The majority of children were white (59.7%), had a PIR >1.85 (56.4%), engaged in at least a modest amount of physical activity (77.4%), were in the healthy weight range (66.1%), and did not use supplements (74.3%) (Table 1). Additionally, the subjects with higher HAZ were more likely to have a higher income, higher birth weight, and higher BMI. Higher HAZ was associated with greater consumption of vitamins A, D, and E, thiamin, riboflavin, niacin, vitamin B6, vitamin B12, calcium, and iron after adjusting for gender, age, ethnicity, and birth weight (Table 2).

Table 1.
Sociodemographic and lifestyle characteristics by tertile of HAZ among US children aged 2–18 years in NHANES 2007–2014 (n = 6116).
Table 2.
Daily average micronutrient intakes by tertile of HAZ among US children aged 2–18 years in NHANES 2007–2014 (n = 6116).
HAZ was positively associated with total energy intake but not with percent of energy from each macronutrient. The latter is unsurprising given the close similarities in macronutrient compositions of the diets. Additionally, those in the highest HAZ tertile had greater consumption of protein, carbohydrate, and fat compared to those in the lowest tertile (Figure 1). Among the five major food groups, the consumption of grains and dairy but not fruits, vegetables or meat/protein was greatest for children in the highest HAZ tertile (Figure 2).
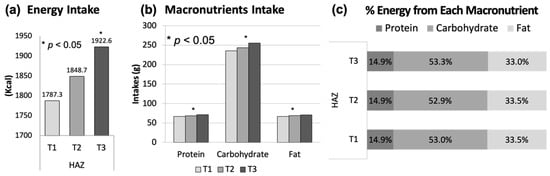
Figure 1.
(a) Energy intake, (b) protein, carbohydrate, fat intake, (c) % energy from each macronutrient by tertile of HAZ among US children aged 2–18 years, NHANES 2007–2014 (n = 6116) Each tertile was defined as follows: T1 (low HAZ), T2 (medium HAZ), T3 (high HAZ) * Tested by ANOVA and adjusted for age, gender, ethnicity and birth weight.
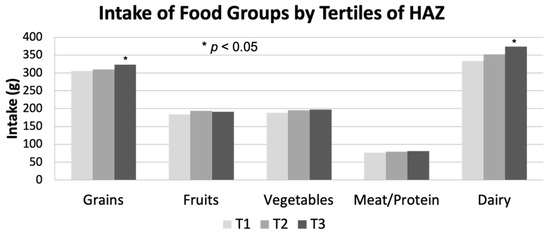
Figure 2.
Intake of five food groups by tertile of HAZ among US children aged 2–18 years, NHANES 2007–2014 (n = 6116). Each tertile was defined as follows: T1 (low HAZ), T2 (medium HAZ), T3 (high HAZ) * Tested by ANOVA and adjusted for age, gender, ethnicity and birth weight. HAZ, height-for-age Z score.
Compared to children in the lowest tertile of HAZ, children in the highest tertile of HAZ were 25% less likely to consume below the EAR of vitamin E (OR: 0.75; 95% CI, 0.59–0.95) after adjusting for gender, age, ethnicity and birth weight. With regards to calcium, children in the middle HAZ tertile were 21% less likely to consume below the EAR (OR: 0.79; 95% CI: 0.64–0.97) while children in the highest tertile were 31% less likely to consume below the EAR (OR: 0.69; 95% CI, 0.57–0.85) compared to children in the lowest tertile (Table 3). While the food most consumed (by weight) by children in the highest tertile of HAZ was low-fat milk products, the food most consumed by those in the lowest tertile of HAZ was carbonated soft drinks. Additionally, while those in the lowest tertile of HAZ consumed greater amounts of high-fat milk, cakes, cookies, pastries, and pies, those in the highest tertile of HAZ consumed greater amounts of tea and low-calorie fruit juice drinks (Table 4).
Table 3.
Odds ratios and 95% CIs for consuming below the EAR by tertile of HAZ among US children aged 2-18 years in NHANES 2007-2014 (n = 6116).
Table 4.
Comparison of major foods consumed by children aged 2–18 years in the highest HAZ vs. lowest HAZ in NHANES 2007-2014 (n = 6116).
4. Discussion
In this nationally representative study, US children aged 2–18 years old with higher HAZ tended to have a higher income and BMI percentile. This result is consistent with previous reports that HAZ was positively associated with household income [26,27,28] and BMI [29]. Although higher BMI was associated with greater HAZ in this study, without follow-up data we could not determine whether children with lower BMIs may eventually attain similar heights as their higher BMI peers. The current study also found that those with higher HAZ had higher birth weight, which is consistent with previous reports showing that HAZ was positively associated with birth weight in the Alive and Thrive Study [30] and in the Brazilian follow-up study [28].
This study found that HAZ is positively associated with energy intake after adjusting for age, gender, ethnicity, and birth weight. This finding is consistent with a previous study reporting that stunted children had a lower energy intake [31]. Several studies showed that lower energy intake was associated with lower levels of bone mineral content (BMC) [32] and IGF-1 [13]. We found that there was a positive association between HAZ and intake of carbohydrate, fats, and protein, which is consistent with previous studies showing that there was a significant positive association between linear growth and carbohydrate [33], fat [34], and protein [31,33]. The current study also found that HAZ was not associated with percentage of energy from any macronutrient. This suggests that total macronutrient and energy intake, rather than the distribution of energy across macronutrients, is associated with HAZ.
This study found that HAZ was positively associated with consumption of vitamin A, vitamin D, vitamin E, thiamin, riboflavin, niacin, vitamin B6, vitamin B12, calcium, iron, and food groups of grains and dairy products after adjusting for age, gender, ethnicity and birth weight. It is important to consider that this finding may, at least in part, relate to the fact that taller children are likely to consume more food than shorter children, which ultimately contributes more to micronutrient intakes. We also found that children in the highest tertile of HAZ were less likely to consume below the EAR of vitamin E and calcium after adjusting for potential confounders. These results are consistent with previous studies reporting that there was a positive association between linear growth and intake levels of vitamin A [11,14,35], vitamin D [32,36], vitamin E [37,38], riboflavin [11,36], vitamin B6, calcium [11,32,36] and dairy products [39]. Several studies [15,40,41] reported that dairy product supplementation stimulates linear growth in both well-nourished and malnourished children, presumably through stimulation of circulating IGF-1 [42,43,44] and enhanced BMC [44,45].
This study found that major foods consumed by children in the lowest tertile of HAZ were soft drinks, cakes, cookies, pastries and pies, and the major foods consumed by those in the highest tertile of HAZ were low-fat milk products, tea, and low-calorie fruit juice drinks. This result showed that children with higher HAZ may have healthier food choices and diet quality compared to children with lower HAZ. Soft drinks, which were popular choices among children with relatively lower HAZ in this study, have previously been associated with lower intake of milk [46,47,48], calcium [48,49], and vitamin A [49], and with lower diet quality [49,50,51], resulting in an increased risk of several medical problems such as asthma [52], hypocalcemia [53,54], and type 2 diabetes [55]. Conversely, greater consumption of low-calorie beverages/tea, which was an important feature of the diets of high HAZ children in this study, has previously been associated with higher diet quality compared to greater consumption of sugar-sweetened beverages [56].
This study is strengthened by its use of a large, nationally representative sample of US children, allowing for the detailed analysis of the relationship between dietary intake and HAZ across participants with varying sociodemographic characteristics. Additionally, we estimated usual dietary intake of nutrients and food groups using MSM, enabling more accurate estimation of usual intake by reducing intra-individual variation. However, this study has some limitations. First, no individual’s growth trajectory can be captured from this study because the present study uses a cross-sectional design. Second, as heights of participants’ parents were not available in NHANES, birth weight as a genetic factor was controlled in our models. Third, because the estimation of usual intake of dietary supplement by the MSM method was not available, dietary supplement was not considered in this analysis. Finally, even though attempts were made to adjust for all relevant covariates available in NHANES, residual confounding factors may still be present.
5. Conclusions
In conclusion, a higher HAZ was associated with a greater intake of energy, dairy products, grains, low-fat milk, tea, and micronutrients among US children, suggesting that adequate nutritional intake, diet quality, and nutritious food choices could be beneficial to linear growth in childhood. Future studies should prospectively assess the relationship between dietary intake/nutritional adequacy and height growth in order to better elucidate the relationship’s directionality.
Author Contributions
K.K. and O.K.C. designed the research; K.K. drafted the manuscript. K.K. and D.K. analyzed data and performed statistical analyses; K.K., M.M.M., J.L., K.C., J.R.S., and O.K.C. contributed to the interpretation of results and critically reviewed the manuscript. All authors have read and agreed to the published version of the manuscript.
Funding
This research received no external funding.
Institutional Review Board Statement
NHANES was conducted according to the guidelines of the Declaration of Helsinki, and approved by the Institutional Review Board of the National Center for Health Statistics (Continuation of Protocol #2005-06 for NHANES 2007-2010, Protocol #2011-17 for NHANES 2011-2012, and Continuation of Protocol #2011-17 for NHANES 2013-2014).
Informed Consent Statement
Informed consent was obtained from all subjects involved in NHANES.
Conflicts of Interest
The authors declare no conflict of interest.
References
- WHO. Global Nutrition Targets 2025: Policy Brief Series (WHO/NMH/NHD/14.2); World Health Organization: Geneva, Switzerland, 2014. [Google Scholar]
- Crookston, B.T.; Schott, W.; Cueto, S.; Dearden, K.A.; Engle, P.; Georgiadis, A.; Lundeen, E.A.; Penny, M.E.; Stein, A.D.; Behrman, J.R. Postinfancy growth, schooling, and cognitive achievement: Young Lives. Am. J. Clin. Nutr. 2013, 98, 1555–1563. [Google Scholar] [CrossRef] [PubMed]
- Fink, G.; Rockers, P.C. Childhood growth, schooling, and cognitive development: Further evidence from the Young Lives study. Am. J. Clin. Nutr. 2014, 100, 182–188. [Google Scholar] [CrossRef] [PubMed]
- Martorell, R. Results and implications of the INCAP follow-up study. J. Nutr. 1995, 125, 1127S–1138S. [Google Scholar] [CrossRef]
- Olofin, I.; McDonald, C.M.; Ezzati, M.; Flaxman, S.; Black, R.E.; Fawzi, W.W.; Caulfield, L.E.; Danaei, G.; Nutrition Impact Model, S. Associations of suboptimal growth with all-cause and cause-specific mortality in children under five years: A pooled analysis of ten prospective studies. PLoS ONE 2013, 8, e64636. [Google Scholar] [CrossRef] [PubMed]
- Kossmann, J.; Nestel, P.; Herrera, M.G.; El-Amin, A.; Fawzi, W.W. Undernutrition and childhood infections: A prospective study of childhood infections in relation to growth in the Sudan. Acta Paediatr. 2000, 89, 1122–1128. [Google Scholar] [CrossRef]
- Vilcins, D.; Sly, P.D.; Jagals, P. Environmental Risk Factors Associated with Child Stunting: A Systematic Review of the Literature. Ann. Glob. Health 2018, 84, 551–562. [Google Scholar] [CrossRef]
- Titaley, C.R.; Ariawan, I.; Hapsari, D.; Muasyaroh, A.; Dibley, M.J. Determinants of the Stunting of Children Under Two Years Old in Indonesia: A Multilevel Analysis of the 2013 Indonesia Basic Health Survey. Nutrients 2019, 11, 1106. [Google Scholar] [CrossRef]
- Steiner, K.L.; Ahmed, S.; Gilchrist, C.A.; Burkey, C.; Cook, H.; Ma, J.Z.; Korpe, P.S.; Ahmed, E.; Alam, M.; Kabir, M.; et al. Species of Cryptosporidia Causing Subclinical Infection Associated With Growth Faltering in Rural and Urban Bangladesh: A Birth Cohort Study. Clin. Infect. Dis. 2018, 67, 1347–1355. [Google Scholar] [CrossRef]
- Roberts, J.L.; Stein, A.D. The Impact of Nutritional Interventions beyond the First 2 Years of Life on Linear Growth: A Systematic Review and Meta-Analysis. Adv. Nutr. 2017, 8, 323–336. [Google Scholar] [CrossRef] [PubMed]
- Chiplonkar, S.; Khadilkar, A.; Pandit-Agrawal, D.; Kawade, R.; Kadam, N.; Ekbote, V.; Sanwalka, N.; Khadilkar, V. Influence of micronutrient status and socioeconomic gradient on growth indices of 2-18-year-old Indian girls. J. Pediatr. Endocrinol. Metab. 2013, 26, 825–832. [Google Scholar] [CrossRef] [PubMed]
- Sticker, L.S.; Thompson, D.L., Jr.; Fernandez, J.M.; Bunting, L.D.; DePew, C.L. Dietary protein and(or) energy restriction in mares: Plasma growth hormone, IGF-I, prolactin, cortisol, and thyroid hormone responses to feeding, glucose, and epinephrine. J. Anim. Sci. 1995, 73, 1424–1432. [Google Scholar] [CrossRef] [PubMed]
- Smith, W.J.; Underwood, L.E.; Clemmons, D.R. Effects of caloric or protein restriction on insulin-like growth factor-I (IGF-I) and IGF-binding proteins in children and adults. J. Clin. Endocrinol. Metab. 1995, 80, 443–449. [Google Scholar] [CrossRef] [PubMed]
- Hadi, H.; Stoltzfus, R.J.; Dibley, M.J.; Moulton, L.H.; West, K.P., Jr.; Kjolhede, C.L.; Sadjimin, T. Vitamin A supplementation selectively improves the linear growth of indonesian preschool children: Results from a randomized controlled trial. Am. J. Clin. Nutr. 2000, 71, 507–513. [Google Scholar] [CrossRef]
- Yackobovitch-Gavan, M.; Phillip, M.; Gat-Yablonski, G. How Milk and Its Proteins Affect Growth, Bone Health, and Weight. Horm. Res. Paediatr. 2017, 88, 63–69. [Google Scholar] [CrossRef] [PubMed]
- National Center for Health Statistics. National Health and Nutrition Examination Survey Questionnaire; 2007–2008 Data Files; CDC: Hyattsville, MD, USA, 2010.
- National Center for Health Statistics. National Health and Nutrition Examination Survey Questionnaire; 2009–2010 Data Files; CDC: Hyattsville, MD, USA, 2012.
- National Center for Health Statistics. National Health and Nutrition Examination Survey Questionnaire; 2011–2012 Data Files; CDC: Hyattsville, MD, USA, 2014.
- Harttig, U.; Haubrock, J.; Knuppel, S.; Boeing, H.; Consortium, E. The MSM program: Web-based statistics package for estimating usual dietary intake using the Multiple Source Method. Eur. J. Clin. Nutr. 2011, 65 (Suppl. S1), S87–S91. [Google Scholar] [CrossRef] [PubMed]
- Haubrock, J.; Nothlings, U.; Volatier, J.L.; Dekkers, A.; Ocke, M.; Harttig, U.; Illner, A.K.; Knuppel, S.; Andersen, L.F.; Boeing, H.; et al. Estimating usual food intake distributions by using the multiple source method in the EPIC-Potsdam Calibration Study. J. Nutr. 2011, 141, 914–920. [Google Scholar] [CrossRef]
- Food and Nutrition Board. Dietary Reference Intakes for Vitamins and Minerals. Available online: https://www.nal.usda.gov/fnic/vitamins-and-minerals (accessed on 13 May 2021).
- Lohman, T.G.; Roche, A.F.; Martorell, R. Anthropometric Standardization Reference Manual; Human Kinetics Books: Champaign, IL, USA, 1988. [Google Scholar]
- WHO. Multicentre Growth Reference Study Group. WHO Child Growth Standards: Length/Height-for-Age, Weight-for-Age, Weight-for-Length, Weight-for-Height and Body Mass Index-for-Age: Methods and Development; World Health Organization: Geneva, Switzerland, 2006. [Google Scholar]
- Cole, T.J.; Green, P.J. Smoothing reference centile curves: The LMS method and penalized likelihood. Stat. Med. 1992, 11, 1305–1319. [Google Scholar] [CrossRef] [PubMed]
- Ainsworth, B.E.; Haskell, W.L.; Herrmann, S.D.; Meckes, N.; Bassett, D.R., Jr.; Tudor-Locke, C.; Greer, J.L.; Vezina, J.; Whitt-Glover, M.C.; Leon, A.S. 2011 Compendium of Physical Activities: A second update of codes and MET values. Med. Sci. Sports Exerc. 2011, 43, 1575–1581. [Google Scholar] [CrossRef]
- Reynolds, S.A.; Andersen, C.; Behrman, J.; Singh, A.; Stein, A.D.; Benny, L.; Crookston, B.T.; Cueto, S.; Dearden, K.; Georgiadis, A.; et al. Disparities in children’s vocabulary and height in relation to household wealth and parental schooling: A longitudinal study in four low- and middle-income countries. SSM Popul. Health 2017, 3, 767–786. [Google Scholar] [CrossRef]
- Devakumar, D.; Kular, D.; Shrestha, B.P.; Grijalva-Eternod, C.; Daniel, R.M.; Saville, N.M.; Manandhar, D.S.; Costello, A.; Osrin, D.; Wells, J.C.K. Socioeconomic determinants of growth in a longitudinal study in Nepal. Matern. Child Nutr. 2018, 14. [Google Scholar] [CrossRef]
- Lourenco, B.H.; Villamor, E.; Augusto, R.A.; Cardoso, M.A. Determinants of linear growth from infancy to school-aged years: A population-based follow-up study in urban Amazonian children. BMC Public Health 2012, 12, 265. [Google Scholar] [CrossRef]
- Freedman, D.S.; Thornton, J.C.; Mei, Z.; Wang, J.; Dietz, W.H.; Pierson, R.N., Jr.; Horlick, M. Height and adiposity among children. Obes. Res. 2004, 12, 846–853. [Google Scholar] [CrossRef] [PubMed]
- Nguyen, P.H.; Headey, D.; Frongillo, E.A.; Tran, L.M.; Rawat, R.; Ruel, M.T.; Menon, P. Changes in Underlying Determinants Explain Rapid Increases in Child Linear Growth in Alive & Thrive Study Areas between 2010 and 2014 in Bangladesh and Vietnam. J. Nutr. 2017, 147, 462–469. [Google Scholar] [CrossRef] [PubMed]
- Tessema, M.; Gunaratna, N.S.; Brouwer, I.D.; Donato, K.; Cohen, J.L.; McConnell, M.; Belachew, T.; Belayneh, D.; De Groote, H. Associations among High-Quality Protein and Energy Intake, Serum Transthyretin, Serum Amino Acids and Linear Growth of Children in Ethiopia. Nutrients 2018, 10, 1776. [Google Scholar] [CrossRef]
- Gutin, B.; Stallmann-Jorgensen, I.S.; Le, A.H.; Johnson, M.H.; Dong, Y. Relations of diet and physical activity to bone mass and height in black and white adolescents. Pediatr. Rep. 2011, 3, e10. [Google Scholar] [CrossRef]
- Esfarjani, F.; Roustaee, R.; Mohammadi-Nasrabadi, F.; Esmaillzadeh, A. Major dietary patterns in relation to stunting among children in Tehran, Iran. J. Health Popul. Nutr. 2013, 31, 202–210. [Google Scholar] [CrossRef] [PubMed][Green Version]
- Iannotti, L.L.; Dulience, S.J.; Green, J.; Joseph, S.; Francois, J.; Antenor, M.L.; Lesorogol, C.; Mounce, J.; Nickerson, N.M. Linear growth increased in young children in an urban slum of Haiti: A randomized controlled trial of a lipid-based nutrient supplement. Am. J. Clin. Nutr. 2014, 99, 198–208. [Google Scholar] [CrossRef]
- Mwanri, L.; Worsley, A.; Ryan, P.; Masika, J. Supplemental vitamin A improves anemia and growth in anemic school children in Tanzania. J. Nutr. 2000, 130, 2691–2696. [Google Scholar] [CrossRef]
- van Stuijvenberg, M.E.; Nel, J.; Schoeman, S.E.; Lombard, C.J.; du Plessis, L.M.; Dhansay, M.A. Low intake of calcium and vitamin D, but not zinc, iron or vitamin A, is associated with stunting in 2- to 5-year-old children. Nutrition 2015, 31, 841–846. [Google Scholar] [CrossRef]
- Traber, M.G. Vitamin E inadequacy in humans: Causes and consequences. Adv. Nutr. 2014, 5, 503–514. [Google Scholar] [CrossRef]
- Rosado, J.L. Separate and joint effects of micronutrient deficiencies on linear growth. J. Nutr. 1999, 129, 531S–533S. [Google Scholar] [CrossRef] [PubMed]
- Nezami, M.; Segovia-Siapco, G.; Beeson, W.L.; Sabate, J. Associations between Consumption of Dairy Foods and Anthropometric Indicators of Health in Adolescents. Nutrients 2016, 8, 427. [Google Scholar] [CrossRef] [PubMed]
- Grenov, B.; Michaelsen, K.F. Growth Components of Cow’s Milk: Emphasis on Effects in Undernourished Children. Food Nutr. Bull. 2018, 39, S45–S53. [Google Scholar] [CrossRef] [PubMed]
- de Beer, H. Dairy products and physical stature: A systematic review and meta-analysis of controlled trials. Econ. Hum. Biol. 2012, 10, 299–309. [Google Scholar] [CrossRef] [PubMed]
- Hoppe, C.; Molgaard, C.; Michaelsen, K.F. Cow’s milk and linear growth in industrialized and developing countries. Annu. Rev. Nutr. 2006, 26, 131–173. [Google Scholar] [CrossRef]
- Hoppe, C.; Molgaard, C.; Juul, A.; Michaelsen, K.F. High intakes of skimmed milk, but not meat, increase serum IGF-I and IGFBP-3 in eight-year-old boys. Eur. J. Clin. Nutr. 2004, 58, 1211–1216. [Google Scholar] [CrossRef] [PubMed]
- Esterle, L.; Sabatier, J.P.; Guillon-Metz, F.; Walrant-Debray, O.; Guaydier-Souquieres, G.; Jehan, F.; Garabedian, M. Milk, rather than other foods, is associated with vertebral bone mass and circulating IGF-1 in female adolescents. Osteoporos. Int. 2009, 20, 567–575. [Google Scholar] [CrossRef]
- Huncharek, M.; Muscat, J.; Kupelnick, B. Impact of dairy products and dietary calcium on bone-mineral content in children: Results of a meta-analysis. Bone 2008, 43, 312–321. [Google Scholar] [CrossRef]
- Harnack, L.; Stang, J.; Story, M. Soft drink consumption among US children and adolescents: Nutritional consequences. J. Am. Diet. Assoc. 1999, 99, 436–441. [Google Scholar] [CrossRef]
- Marshall, T.A.; Eichenberger Gilmore, J.M.; Broffitt, B.; Stumbo, P.J.; Levy, S.M. Diet quality in young children is influenced by beverage consumption. J. Am. Coll. Nutr. 2005, 24, 65–75. [Google Scholar] [CrossRef]
- Rodriguez-Artalejo, F.; Garcia, E.L.; Gorgojo, L.; Garces, C.; Royo, M.A.; Martin Moreno, J.M.; Benavente, M.; Macias, A.; De Oya, M.; Investigators of the Four Provinces Study. Consumption of bakery products, sweetened soft drinks and yogurt among children aged 6-7 years: Association with nutrient intake and overall diet quality. Br. J. Nutr. 2003, 89, 419–429. [Google Scholar] [CrossRef] [PubMed]
- Ballew, C.; Kuester, S.; Gillespie, C. Beverage choices affect adequacy of children’s nutrient intakes. Arch. Pediatr. Adolesc. Med. 2000, 154, 1148–1152. [Google Scholar] [CrossRef] [PubMed]
- Sharkey, J.R.; Johnson, C.M.; Dean, W.R. Less-healthy eating behaviors have a greater association with a high level of sugar-sweetened beverage consumption among rural adults than among urban adults. Food Nutr. Res. 2011, 55. [Google Scholar] [CrossRef] [PubMed]
- Yamada, M.; Murakami, K.; Sasaki, S.; Takahashi, Y.; Okubo, H. Soft drink intake is associated with diet quality even among young Japanese women with low soft drink intake. J. Am. Diet. Assoc. 2008, 108, 1997–2004. [Google Scholar] [CrossRef]
- DeChristopher, L.R.; Uribarri, J.; Tucker, K.L. Intakes of apple juice, fruit drinks and soda are associated with prevalent asthma in US children aged 2-9 years. Public Health Nutr. 2016, 19, 123–130. [Google Scholar] [CrossRef] [PubMed]
- Mazariegos-Ramos, E.; Guerrero-Romero, F.; Rodriguez-Moran, M.; Lazcano-Burciaga, G.; Paniagua, R.; Amato, D. Consumption of soft drinks with phosphoric acid as a risk factor for the development of hypocalcemia in children: A case-control study. J. Pediatr. 1995, 126, 940–942. [Google Scholar] [CrossRef]
- Fernando, G.R.; Martha, R.M.; Evangelina, R. Consumption of soft drinks with phosphoric acid as a risk factor for the development of hypocalcemia in postmenopausal women. J. Clin. Epidemiol. 1999, 52, 1007–1010. [Google Scholar] [CrossRef]
- Schulze, M.B.; Manson, J.E.; Ludwig, D.S.; Colditz, G.A.; Stampfer, M.J.; Willett, W.C.; Hu, F.B. Sugar-sweetened beverages, weight gain, and incidence of type 2 diabetes in young and middle-aged women. JAMA 2004, 292, 927–934. [Google Scholar] [CrossRef]
- Gibson, S.A.; Horgan, G.W.; Francis, L.E.; Gibson, A.A.; Stephen, A.M. Low Calorie Beverage Consumption Is Associated with Energy and Nutrient Intakes and Diet Quality in British Adults. Nutrients 2016, 8, 9. [Google Scholar] [CrossRef]


Publisher’s Note: MDPI stays neutral with regard to jurisdictional claims in published maps and institutional affiliations. |
© 2021 by the authors. Licensee MDPI, Basel, Switzerland. This article is an open access article distributed under the terms and conditions of the Creative Commons Attribution (CC BY) license (https://creativecommons.org/licenses/by/4.0/).