Article

Brown Seaweed Sargassum siliquosum as an Intervention for Diet-Induced Obesity in Male Wistar Rats

by
Ryan du Preez
1,†,
Marie Magnusson
2,
Marwan E. Majzoub
3,4,
Torsten Thomas
3,4,
Christina Praeger
5,
Christopher R. K. Glasson
2,
Sunil K. Panchal
1,‡ and
Lindsay Brown
1,6,*
1
Functional Foods Research Group, University of Southern Queensland, Toowoomba, QLD 4350, Australia
2
School of Science, Environmental Research Institute, University of Waikato, Tauranga 3112, New Zealand
3
Centre for Marine Science and Innovation, University of New South Wales, Sydney, NSW 2052, Australia
4
School of Biological, Earth and Environmental Sciences, University of New South Wales, Sydney, NSW 2052, Australia
5
MACRO—The Centre for Macroalgal Resources and Biotechnology, College of Marine and Environmental Sciences, James Cook University, Townsville, QLD 4811, Australia
6
School of Health and Wellbeing, University of Southern Queensland, Ipswich, QLD 4305, Australia
*
Author to whom correspondence should be addressed.
Present address: School of Health, Medical and Applied Sciences, Central Queensland University, Rockhampton, QLD 4701, Australia.
Present address: School of Science, Western Sydney University, Richmond, NSW 2753, Australia.
Nutrients 2021, 13(6), 1754; https://doi.org/10.3390/nu13061754
Submission received: 6 April 2021 / Revised: 17 May 2021 / Accepted: 19 May 2021 / Published: 21 May 2021

Abstract

:
The therapeutic potential of Sargassum siliquosum grown in Australian tropical waters was tested in a rat model of metabolic syndrome. Forty-eight male Wistar rats were divided into four groups of 12 rats and each group was fed a different diet for 16 weeks: corn starch diet (C); high-carbohydrate, high-fat diet (H) containing fructose, sucrose, saturated and trans fats; and C or H diets with 5% S. siliquosum mixed into the food from weeks 9 to 16 (CS and HS). Obesity, hypertension, dyslipidaemia, impaired glucose tolerance, fatty liver and left ventricular fibrosis developed in H rats. In HS rats, S. siliquosum decreased body weight (H, 547 ± 14; HS, 490 ± 16 g), fat mass (H, 248 ± 27; HS, 193 ± 19 g), abdominal fat deposition and liver fat vacuole size but did not reverse cardiovascular and liver effects. H rats showed marked changes in gut microbiota compared to C rats, while S. siliquosum supplementation increased gut microbiota belonging to the family Muribaculaceae. This selective increase in gut microbiota likely complements the prebiotic actions of the alginates. Thus, S. siliquosum may be a useful dietary additive to decrease abdominal and liver fat deposition.

1. Introduction

Seaweeds are now a major industry worldwide, including a rediscovery of regional seaweed cuisines [1], but there are risks involved with some edible seaweeds [2]. The brown seaweed, Saccharina japonica, accounts for more than one-third of total world production, with over 11 million tonnes in 2018 [3]. Brown seaweeds have many commercial uses, including as food for human consumption [4], improving growth and meat quality of livestock [5], as a substrate for bioethanol production [6], as biostimulants for agricultural use [7] and as cation exchangers for wastewater remediation [8]. Further, the management of metabolic syndrome may be improved by some brown seaweeds, including Ascophyllum nodosum and Fucus vesiculosis [9].
Brown seaweeds also include the Sargassum genus that inhabits the Atlantic, Pacific and Indian oceans, including temperate, subtropical and tropical habitats; its biogeography suggests an origin at around 6.7 million years ago [10]. Sargassum species, primarily S. natans and S. fluitans, produced more than 20 million metric tonnes of biomass extending from West Africa to the Gulf of Mexico in 2018 [11]. Further, massive mats of S. horneri have occurred since 2015 off the southeastern coast of Korea [12]. However, value-adding pathways have been proposed for these golden tide seaweeds [13]. Sargassum (fusiforme) is already a traditional and highly prized food in Asia, with commercial aquaculture production of 54,624 tonnes of S. fusiforme in 2017 at a value of USD 28.7 million [14]. Further, Sargassum species produce many compounds with a wide range of biological actions, including protection against heat, pollution, stress, decreased oxygen concentration and ultraviolet radiation [15].
Commercial Sargassum species such as S. fusiforme contain alginates, laminarins and fucoidans as the major polysaccharides [16]; the xanthophyll, fucoxanthin, gives the brown seaweeds their colour. The species tested in this project, S. siliquosum, is found predominantly in the Sargasso Sea (western North Atlantic Ocean) and the Coral Sea (off the northeast coast of Australia) [17].
Functional foods are claimed to ameliorate metabolic syndrome [18], defined as a clustering of conditions that increase the risk of developing cardiovascular disease and type 2 diabetes; these factors include obesity, dyslipidaemia, hypertension, impaired glucose tolerance and fatty liver [19]. However, the effectiveness of Sargassum as a functional food has not been defined, although Sargassum products have shown effectiveness against metabolic diseases [20]. Sargassum species could exhibit antioxidant responses such as nitric oxide scavenging [21] and anti-inflammatory responses including reduced paw volumes in carrageenan-induced oedema [22]; both actions may be useful in metabolic syndrome. Further, fucoxanthin present in the whole seaweed may decrease obesity by modulating the expression of uncoupling protein-1; in a human trial, body weight was reduced by 5.5 kg following treatment with fucoxanthin at 2.4 mg/day for 16 weeks [23]. Fucoxanthin concentrations in brown seaweeds such as Sphaerotrichia divaricata [24] may be sufficient to improve physiological parameters when added to foods [25]. However, no studies have investigated Sargassum species on the range of pathophysiological changes that characterise metabolic syndrome.
We have reported that sulphated polysaccharides from the red seaweed Sarconema filiforme [26] and the green seaweed Caulerpa lentillifera [27] reversed the cardiovascular, metabolic and liver changes induced by a high-carbohydrate, high-fat diet in rats. Our hypothesis for this project was that the brown seaweed, S. siliquosum, as a source of non-sulphated (alginates and laminarins) and sulphated polysaccharides (fucoidans) and fucoxanthin, also reverses the signs of metabolic syndrome in this rat model [28]. This seaweed was chosen as it may be amenable to cultivation in tropical areas of Australia [29]. To test our hypothesis, we measured the parameters related to metabolic syndrome following chronic dietary intervention with S. siliquosum, including the structure and function of heart and liver, plasma biochemistry, glucose and insulin responses and body composition. Further, we characterised the changes in the composition of gut microbiota after seaweed treatment, as functional foods have the potential to reverse the changes induced in obesity [30,31]. The major mechanisms for possible responses to S. siliquosum could include the prebiotic actions of polysaccharides including fucoidans and alginates in the colon by reducing the intestinal absorption of carbohydrates and fats and also changing the gut microbiota, in combination with the anti-inflammatory effects of fucoxanthin [25]. The combination of these polysaccharides with fucoxanthin in the dried seaweed may also suppress the infiltration of inflammatory cells into the heart and liver.

2. Materials and Methods

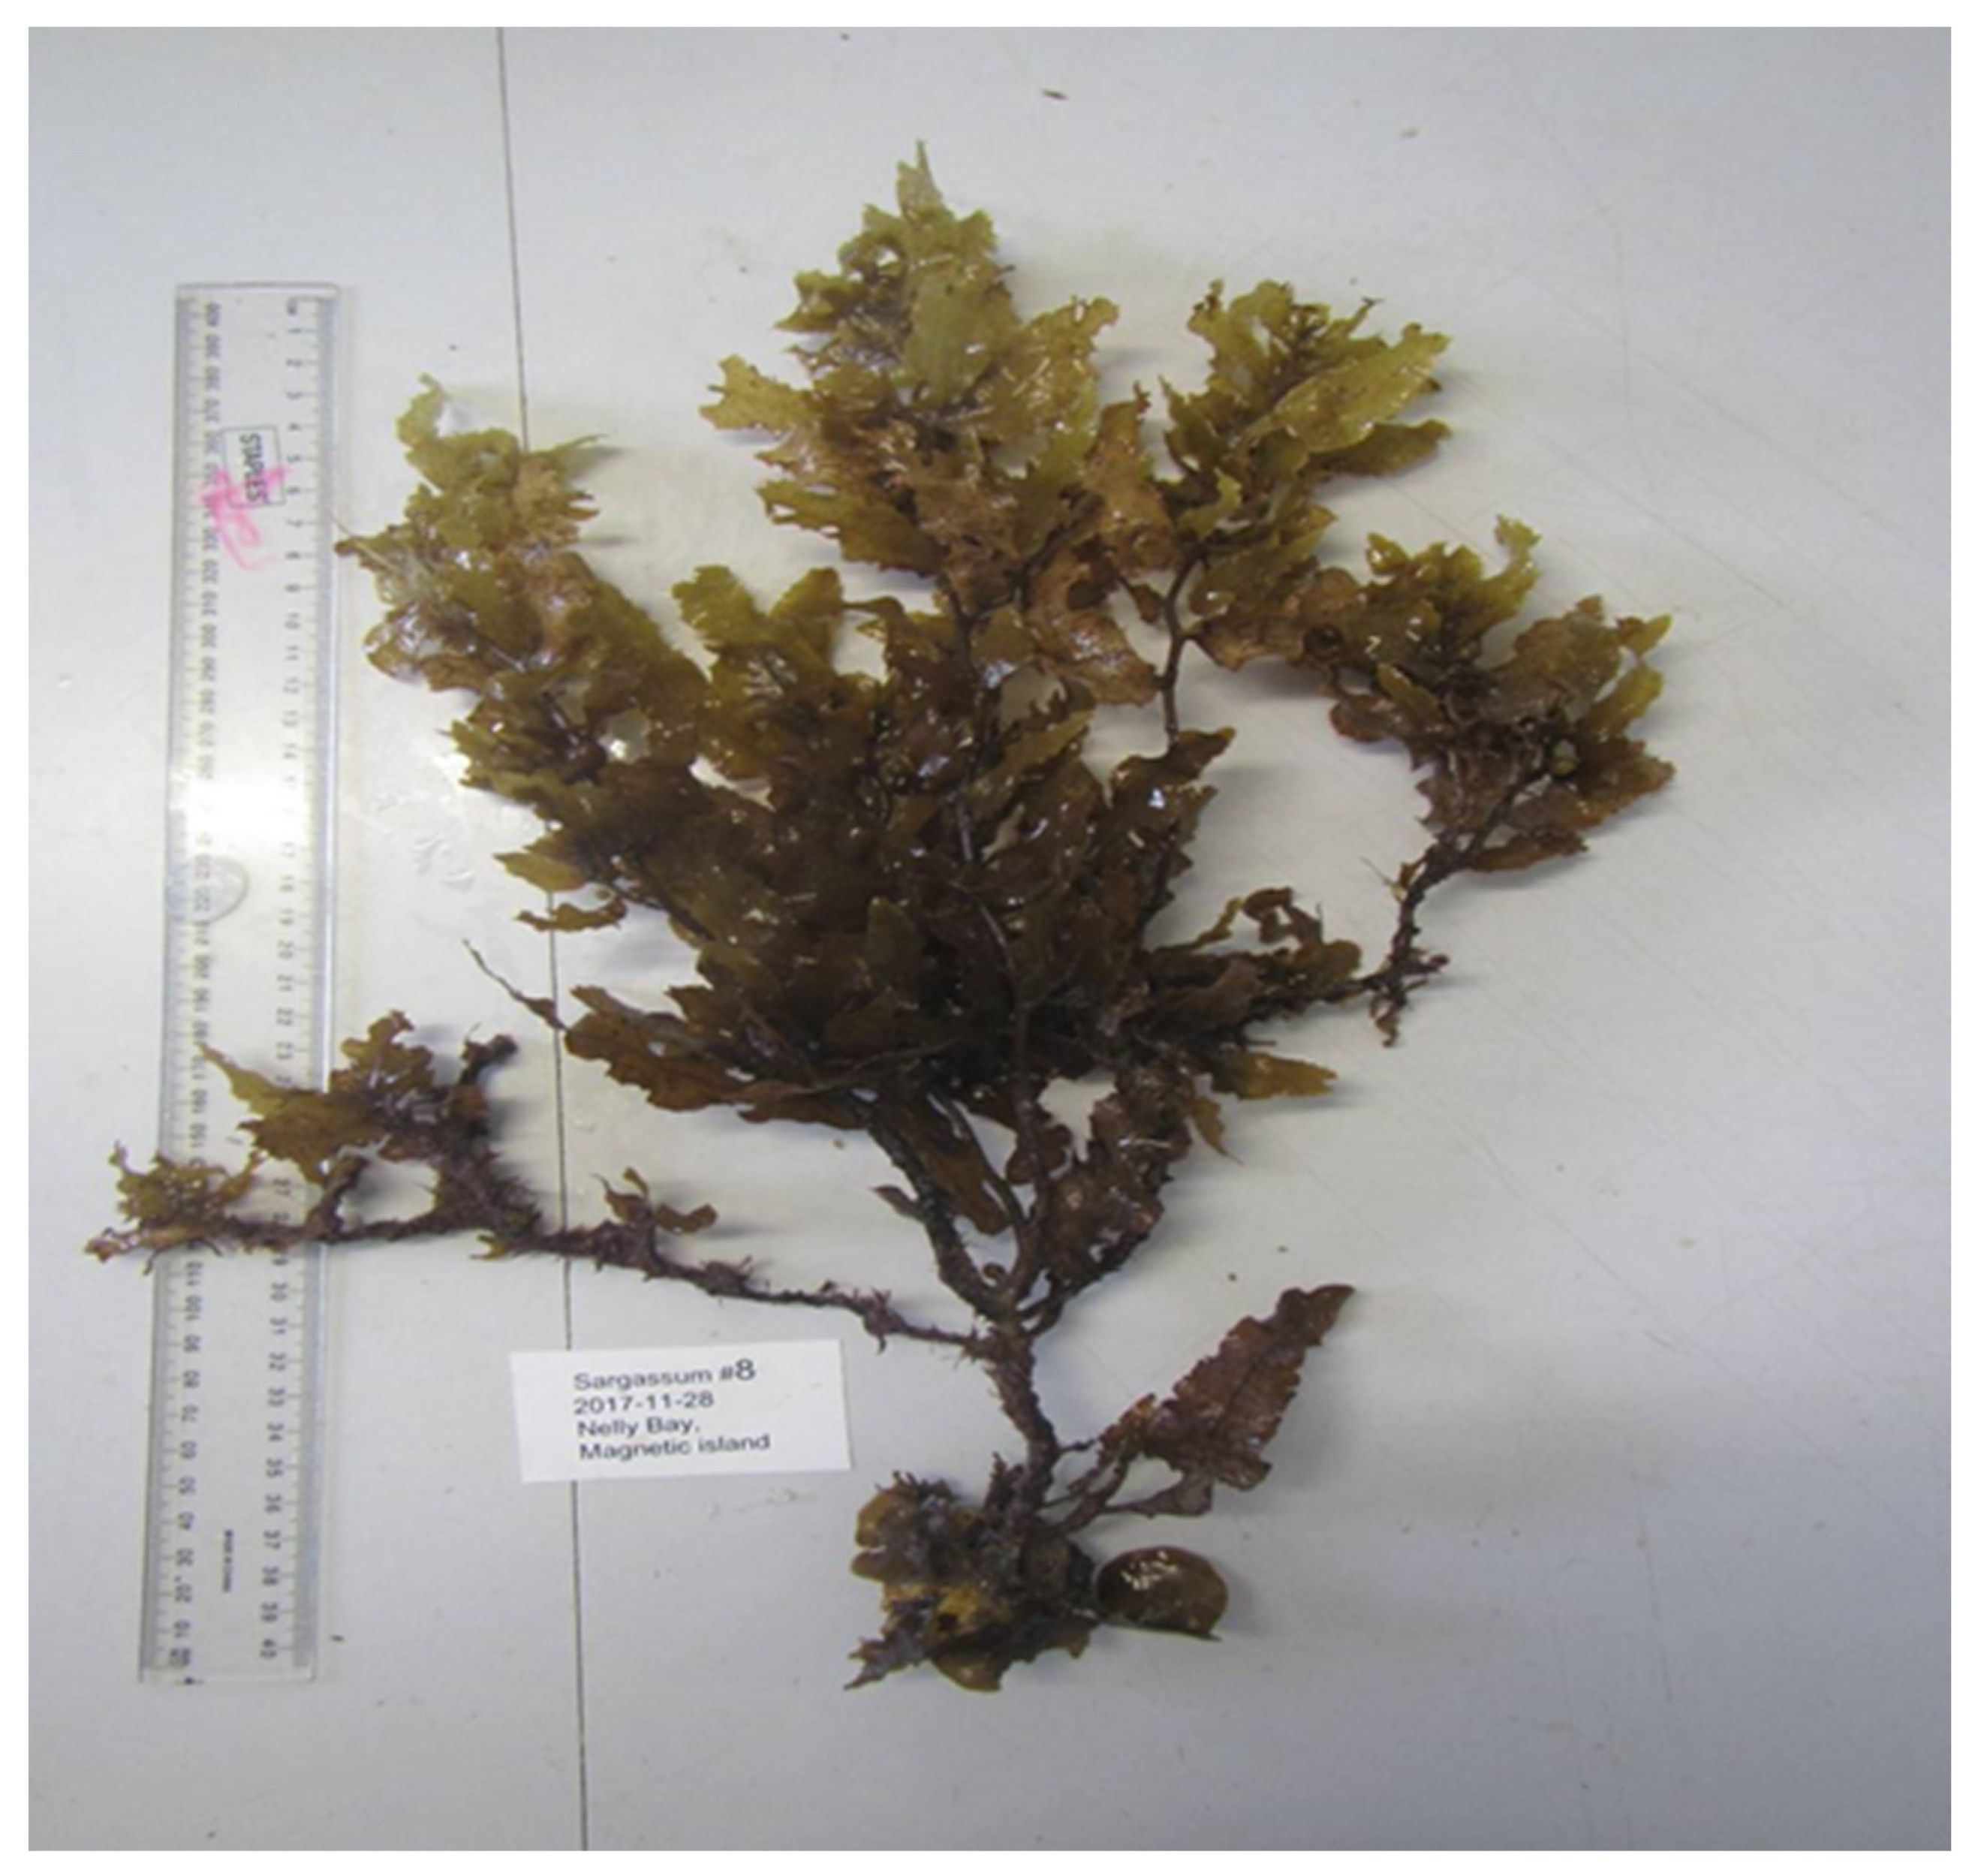
2.1. Sargassum siliquosum Biomass Collection

S. siliquosum was collected by snorkel from a rocky reef at approximately 2 m depth in Nelly Bay, Magnetic Island, QLD, Australia (19.1708° S, 146.8471° E), on 28 November 2017, and immediately transported to James Cook University, Townsville, QLD, Australia. Twelve specimens with intact holdfasts and fresh new growth were photographed (Figure 1) and selected for genetic barcoding. The remaining fresh biomass was briefly rinsed in batches in filtered seawater, followed by freshwater to remove sand, debris, invertebrates and epiphytes. The rinsed biomass was dried at 60 °C for 48 h, sorted to remove remaining foreign matter such as coral rubble in holdfasts, milled to 1 mm and homogenised. The biomass was stored with silica desiccant in vacuum-sealed bags at 4 °C until processing for experiments.

2.2. Genetic Barcoding

One blade from each of the twelve specimens selected for molecular barcoding was excised and cleaned in autoclaved seawater, using a soft paintbrush to remove debris and epiphytes. Each blade was dried to remove excess water and subsequently kept in individually labelled zip-lock bags with 50 g of silica beads to desiccate. Dried samples were sent to Victoria University of Wellington, New Zealand, for DNA extraction using a modified CTAB protocol [32]. The molecular marker mitochondrial gene cytochrome oxidase I (COI) was used to obtain sequences to assign Sargassum specimens to a genetic species group. The forward primer GazF2 (5′CCAACCAYAAAGATATWGGTAC3′) and reverse primer GazR2 (5′GGATGACCAAARAACCAAAA3′) were used [33]. Maximum likelihood (ML) phylogenetic trees were constructed in Iqtree with sequences downloaded from Genbank.

2.3. Compositional Analyses

All analyses were performed on five subsamples (n = 5) of milled and homogenised material, except for amino acid and constituent sugar analyses (n = 3) and fibre analysis (n = 2). For sugar analysis, hydrolysis of the biomass (10 mg) was performed in a two-step process: step 1: hydrolysis in 300 µL of 72% sulphuric acid at 20 °C for 1 h; step 2: hydrolysis in 3.6 mL of 1M sulphuric acid at 100 °C for 2 h [34]. Sugar hydrolysates were derivatised with 1-phenyl-3-methyl-5-pyrazolone (PMP) by a modified procedure [35]. Hydrolysates (40 µL) were neutralised with either 80 µL 1M NaOH prior to the addition of 400 µL of PMP-derivatising reagent (250 mM PMP and 400 mM ammonia in type 1 water) or 40 µL of 2-deoxy-glucose solution (10 mg/mL in type 1 water). This mixture was then heated on a magnetic stirrer at 70⁰C for 90 min. Derivatised samples were neutralised by addition of 400 µL of 0.8M formic acid followed by extraction of unbound PMP with 750 µL of chloroform. The aqueous layer was isolated and clarified by centrifugation (13,000 rpm for 5 min; Heraeus Pico 17 Thermo Scientific Centrifuge) prior to HPLC analysis. HPLC analysis was carried out with a Shimadzu LC-20AD Prominence fitted with a Restek Raptor C18 column (5 µm particle size, 150 mm × 4.6 mm; Cat # 9314565) with a flow rate of 0.8 mL/min and oven temperature of 40 ⁰C. Derivatised sugar standards or sample hydrolysates (5 µL) were injected and eluted with solvent A (0.1 M phosphate buffer at pH 7 in 10% acetonitrile) and solvent B (0.1 M phosphate buffer at pH 7 in 17% acetonitrile) with the following gradient programme: 25% B 0–15 min, 25–100% B at 15–40 min, 100% B 40–55 min, 25% B 55–60 min. Constituent sugars were quantified using PMP-derivatised calibration standards (0–10 mg/L) of fucose, galactose, glucose, mannose, rhamnose, xylose, mannuronic acid, guluronic acid, glucuronic acid and galacturonic acid. Proximate and elemental composition, trace elements, metals and metalloids, soluble and insoluble fibre were analysed as previously described [36]. Total lipids were quantified gravimetrically following extraction (60 °C, 1 h) of 200 mg (±0.1 mg) biomass in 5 mL chloroform:methanol (2:1, v:v). The extract was filtered, washed with 0.9% NaCl (w:v), allowed to separate into two phases, and the lower (organic) phase was collected for evaporation under nitrogen and subsequently weighed to give the total lipid content [37]. Fatty acids were simultaneously extracted and transesterified by heating (100 °C, 1 h) 50 mg (±0.1 mg) biomass in 2 mL methylation reagent (methanol, acetyl chloride, 20:1 (v/v)) with 300 µL nonadecanoic acid (C19H38O2; >99%, Sigma-Aldrich, Castle Hill, NSW, Australia) as internal standard. After cooling, 1 mL of hexane and 2 mL of deionised water were added, and the upper (hexane) phase was collected for analysis by GC–MS [37]. Total xanthophyll content was determined using ultraviolet–visible spectral peaks identified as xanthophyll carotenoids based on common and characteristic spectra. Fucoxanthin content was analysed using HPLC (diode-array detection at 450 nm) at Southern Cross University, Lismore, NSW, Australia.

2.4. Rats and Diets

Male Wistar rats (8–9 weeks old; 336 ± 2 g, n = 48) were sourced and housed as in previous studies [26,27] before being randomly divided into four groups (12 rats per group). Two groups received either corn starch or high-carbohydrate, high-fat diets (C and H, respectively) [28] for the full 16 weeks. The remaining groups received C and H diets for the first eight weeks and then received C or H diet with 5% S. siliquosum for the final eight weeks (CS and HS, respectively). Detailed composition of diets has been described in our published study [28].

2.5. Rat Measurements

The interventions and measured parameters are given in Figure 2. Rats were anaesthetised using isoflurane for measurements of body composition using dual-energy X-ray absorptiometry, systolic blood pressure and abdominal circumference measurement [26]. Oral glucose and insulin tolerance tests and indirect calorimetry were performed as previously described [28,38]. Following euthanasia, heparin was injected before blood collection, centrifugation, plasma isolation and analysis and then diastolic stillness measurements, organ weights, thoracic aortic responses and histological analyses [28].
Post euthanasia, two or three faecal pellets were collected from the colon of each rat and processed as described previously to obtain gut microbiota composition [26,27]. Data were presented and analysed for statistical significance as detailed in previous studies [26,27].

3. Results

3.1. Sargassum siliquosum Identification and Compositional Analyses

DNA barcoding using the cytochrome oxidase subunit 1 (COI) gene was used for identification of the Sargassum samples collected. Sequences could be generated for 9 (out of 10) specimens and all sequences were identical. A phylogenetic tree was compiled from comparison with sequences downloaded from Genbank. A trimmed phylogenetic tree (Figure 3; full tree in Supplementary Figure S1) shows a clustering, with moderate bootstrap support (53%), of similar Sargassum species; these Genbank accessions include several named Sargassum species (S. ilicifolium, S. integerrimum) including S. siliquosum. The COI sequences of this grouping were identical, except for our samples and S. siliquosum, which shared a single synapomorphy. Based on these data and distributional data, we identified this species as S. siliquosum. These samples of S. siliquosum contained (in % of dry weight) 57.8% carbohydrate (11 mol% fucose, 24.4 mol% glucose, 26.4 mol% mannuronic acid and 24.2 mol% guluronic acid), 1.7% lipid, 4.02% protein, 41.4% dietary fibre including 33.3% as soluble fibre with 7.5% K, 1.9% Ca, 1.2% Na and 0.97% S as the major elements (Table 1 and Table 2; Supplementary Tables S1 and S2). Hydrolysates of Sargassum biomass indicated a total of 9.47% w/w sugars, with high contents of mannuronic acid and guluronic acid and glucose, consistent with the presence of alginate and storage carbohydrates/cellulose, respectively. Fucose was present at 0.91% w/w, consistent with the presence of fucoidan at ≥1.5% w/w as the monosulphated sodiated salt (Table 1). In S. siliquosum, glutamic acid and aspartic acid were the most common amino acids (Supplementary Table S1) and potassium and calcium the most common elements (Supplementary Table S2). Total xanthophyll content was 0.00746% w/w and fucoxanthin content was 0.00058% w/w based on HPLC data (Figure 4).

3.2. Physiological Parameters

Metabolic changes were more marked than cardiovascular or liver changes following intervention with S. siliquosum. During weeks 9–16, the food consumption was unchanged in C and CS, and in H and HS (Table 3; Figure 5). CS and HS rats drank more water than their respective controls, C and H (Table 3, Figure 5). During weeks 9–16, there was no difference in energy intake between C and CS rats or H and HS rats. After sixteen weeks of feeding, the body weight of H rats was higher than C rats; HS rats had lower body weights than H rats. There was no difference in lean mass across all groups. Fat mass was higher in H rats compared to C rats, which were similar to CS rats. HS rats had decreased retroperitoneal, liver and whole-body fat compared to H rats (Table 3). In HS rats, there were no changes in lipid profile or glucose and insulin metabolism compared to H rats. S. siliquosum did not affect the plasma triglyceride concentrations in HS and CS rats compared to H and C rats, respectively, whereas plasma total cholesterol concentrations were unaffected by diet or treatment (Table 3). H diet increased basal blood glucose concentrations compared to C diet but S. siliquosum did not change basal blood glucose concentrations or blood glucose area under the curve (Table 3).
Systolic blood pressure of H and HS rats was higher than C and CS rats at 8 weeks (Table 3). Systolic blood pressure and left ventricular diastolic stiffness in H rats were higher than in C rats at 16 weeks. Intervention with S. siliquosum did not alter systolic blood pressure or left ventricular stiffness (Table 3). Left ventricular wet weights with septum and right ventricular wet weights were not different among the groups (Table 3). Intervention with S. siliquosum did not alter noradrenaline-induced contraction or sodium nitroprusside-induced relaxation responses of thoracic aorta, while acetylcholine-induced relaxation was improved in HS rats compared to H rats (Figure 6). Left ventricles from H rats showed infiltration of inflammatory cells and collagen deposition, whereas these changes were absent in left ventricles from C rats; intervention with S. siliquosum did not alter collagen deposition (Figure 7). Fat vacuole area and infiltration of inflammatory cells were increased in livers from H rats compared to C rats; these parameters were reduced in HS rats (Figure 7). Plasma activities of ALT and AST were unchanged between groups (Table 3).

3.3. Gut Structure and Microbiota

The structures of the ileum and colon were unchanged by diet or intervention, defined by crypt depth, villi length and goblet cells, and lack of inflammatory cell infiltration (Figure 7).
For gut microbiota characterisation, a total of 799,215 quality-filtered sequences were clustered into 1307 zOTUs; Good’s coverage score of 99.69 ± 0.12% suggested full recovery of bacterial communities. Shannon’s diversity and richness indices were unchanged among the groups (Supplementary Figure S2). Diet and S. siliquosum affected the overall bacterial community structure individually as well as through their interaction (Figure 8; Supplementary Table S3).
Actinobacteria, Bacteroidia, Bacilli, Clostridia, Erysipelotrichia and Verrucomicrobia were the most abundant bacterial classes in the faecal samples (Figure 9). Coriobacteriia, Melainabacteria, Deferribacteres, Saccharimonadia, Alphaproteobacteria, Deltaproteobacteria, Gammaproteobacteria and Mollicutes were observed at lower abundance levels (<1%) in some faecal samples. A higher abundance of bacteria from the class Clostridia was observed for the H diet samples, and this was more pronounced for control groups (C: 43.45 ± 1.75%, H: 66.35 ± 5.26%, p = 0.0005) compared to groups supplemented with Sargassum (CS: 53.58 ± 8.73%, HS: 55.23 ± 8.40%) (Figure 9). Within the class Bacteroidia, there was an increase in the relative abundance of bacteria from the family Muribaculaceae in HS rats (24.34%) compared to H rats (10.35%) (p = 00063). Further information on the gut microbiota, including at genus level (Supplementary Figure S3), and changes due to diet intervention (Supplementary Tables S3–S6), are included in the Supplementary Information.

4. Discussion

Seaweeds containing complex mixtures of polysaccharides, peptides, pigments, minerals and omega-3 fatty acids have been shown to improve the signs of metabolic syndrome [39]. This study showed that 5% S. siliquosum supplementation in rats with diet-induced metabolic syndrome decreased body weight and decreased retroperitoneal fat and liver fat but had no effect on systolic blood pressure, liver enzyme activities, lipid profile or glucose and insulin metabolism. Similar responses have been shown with other Sargassum species. As examples, S. thunbergii decreased obesity, serum insulin, triglycerides and cholesterol in high-fat-diet-fed mice [40] and S. polycystum decreased damage to the liver in high-sugar, high-fat diet + streptozotocin-induced type 2 diabetic rats [41].
Sargassum species contain polysaccharides, predominantly (in decreasing content) alginates, fucoidans and laminarans; these are the major constituents of the high fibre content of S. siliquosum [42] as in other brown seaweeds [43]. Oral intake of alginates leads to the formation of alginate gels in the small intestine, proposed as the most likely mechanism for alginate-related slowed nutrient absorption leading to body weight loss [44]. In healthy humans, a dose of 9.9–15 g/day of sodium alginate increased satiety and reduced energy intake, suggesting that increased viscosity causing swelling of gastrointestinal contents [45]. In a human trial using energy restriction (~1250 kJ/day) and 15 g/day of alginates as a beverage for 12 weeks, body weight was reduced compared to the placebo group, mainly attributed to body fat reduction [46]. This human dose of 15 g alginates/day approximates to 3.1 g alginates/day in rats using the Reagan–Shaw scaling equation [47].
Fucoidan from S. fusiforme changed the gut microbiota, particularly by increasing the Bacteroidetes to Firmicutes ratio, to decrease streptozotocin-induced hyperglycaemia in mice [48]. Further, fucoidan from S. fusiforme decreased high-fat-diet-induced insulin resistance in mice by activating the Nrf2 pathway, changing the gut microbiota and reducing intestinal inflammation [49]. Fucoidan supplementation of 100 mg/kg/day in high-fat-diet-fed rats improved blood lipid concentrations, decreased fat deposition in the liver and changed the gut microbiota [50]. However, this fucoidan dose was around three times higher than the dose of around 34 mg/kg/day in the current study, so fucoidan is unlikely to be the major bioactive compound in S. siliquosum.
Inhibiting digestive enzymes including α-amylase, α-glucosidase, pepsin and lipase by seaweed polysaccharides and polyphenols may modulate obesity and cardiovascular risk [51]. In an in vitro study, S. siliquosum and S. polycystum inhibited angiotensin-converting enzyme, α-amylase and α-glucosidase [52]. The role of these mechanisms in the current study is unknown.
The biological responses could be caused by the xanthophyll, fucoxanthin. In high-fat-diet-induced obese rats, fucoxanthin at doses of 0.083 and 0.167 mg/kg reduced white adipose tissue weight, accumulation of hepatic lipid droplets and perirenal adipocyte size [53]. These doses are 6–12 times higher than the fucoxanthin intake in the current study, so it seems unlikely that the metabolic responses with S. siliquosum are primarily due to the actions of fucoxanthin. The metabolic actions of phenolic acids and other xanthophyll compounds present in this seaweed are unknown but they could be additive to responses produced by the alginates.
Polyunsaturated fatty acids such as EPA and DHA decreased abdominal obesity and total body fat in the same rat model of metabolic syndrome as the current study [54]. However, the dose of EPA or DHA in this study was approximately 1500 mg/kg/day, in contrast to the dose of total polyunsaturated fatty acids in the current study of around 11 mg/kg/day. Thus, the changes in metabolic parameters following intervention with S. siliquosum are unlikely to be due to an increased intake of polyunsaturated fatty acids.
Not unexpectedly, a diet with higher simple sugars and trans and saturated fats changed the gut microbiome, similar to results in our previous study [26]. Supplementation with S. siliquosum caused a further change in the gut microbiota, including an increase in bacteria belonging to the family Muribaculaceae (also known as S24-7). Members of this family are understudied but have recently been recognised for their versatile metabolism of complex carbohydrates [55,56] and their potential for increased succinate, acetate and propionate production [57]. Members of this family have also been linked to longevity in rodents [58] and, based on our results, could decrease fat absorption or deposition, as these parameters were reduced following intervention with S. siliquosum.
One potential mechanism would be that the polysaccharides from Sargassum act as prebiotics to alter the changed gut microbiota in obesity, as shown by other seaweeds [59]. Alginates may be degraded by specific bacteria, including members of the Muribaculaceae, thereby increasing concentrations of short-chain fatty acids, which could lead to human health benefits [60]. Unsaturated alginate polysaccharides have been reported to act as effective prebiotics by increasing beneficial gut bacteria and decreasing inflammogenic bacteria in mice with high-fat-diet-induced obesity [61]. An improvement in gut health was suggested by the in vitro fermentation of a polysaccharide from S. thunbergia by colonic microbiota to short-chain fatty acids [62].
The current study could be extended by including the measurement of obesity-related plasma and tissue biomarkers such as adiponectin and C-reactive protein, inflammatory mediators such as TNF and functional changes in the colon such as short-chain fatty acid production. These data could allow further interpretation of the mechanisms of action of this seaweed.

5. Conclusions

The tropical Australian brown seaweed, S. siliquosum, reduced liver and abdominal fat accumulation in high-carbohydrate high-fat fed rats. As this seaweed contains alginates as the major polysaccharide, these alginates may act as prebiotics in the intestine to increase concentrations of short-chain fatty acids. These actions are possibly complemented by an increase in specific bacteria such as Muribaculaceae in the gut microbiome. These intestinal changes could then lead to systemic anti-inflammatory effects in the heart and liver. We conclude that the tropical Australian seaweed, S. siliquosum, should now be included with other local tropical seaweeds such as Sarconema filiforme [26] and Caulerpa lentillifera [27] as dietary additives in clinical studies designed to measure improvements in the signs of metabolic syndrome.

Supplementary Materials

The following are available online at https://www.mdpi.com/article/10.3390/nu13061754/s1, Figure S1: Genetic barcoding of Sargassum species: Maximum likelihood tree of cytochrome oxidase I marker sequence data (full phylogenetic tree); Figure S2: (A) Shannon diversity and (B) richness of faecal samples; Figure S3: Taxonomic profiles of bacterial communities of all faecal samples shown at the genus level; Table S1: Fatty acids and amino acids content (% of dry weight) in Sargassum siliquosum; Table S2: Metals and metalloids content (mg/kg of dry weight) in Sargassum siliquosum; Table S3: PERMANOVAs based on Bray–Curtis similarity measure for square-root transformed abundances; Table S4: Summarised differential zOTU abundance; Table S5: Effects of diet on relative abundance of zOTUs; Table S6: Effects of treatment on relative abundance of zOTUs.

Author Contributions

Conceptualisation, S.K.P. and L.B.; methodology, R.d.P., M.M., M.E.M., C.R.K.G. and T.T.; formal analysis, R.d.P., M.M., M.E.M., T.T. and S.K.P.; investigation, R.d.P., C.P., M.E.M., C.R.K.G. and S.K.P.; resources, M.M., S.K.P. and L.B.; supervision, S.K.P. and L.B.; project administration, S.K.P.; funding acquisition, M.M., S.K.P. and L.B. All authors have read and agreed to the published version of the manuscript.

Funding

This study was supported by strategic research funding received from the University of Southern Queensland Research and Innovation Division (SRF-09) and Pacific Biotechnology (previously MBD Industries Ltd) Research and Development program for the Integrated Production of Macroalgae (Grant 001). M.M. and C.R.K.G. are funded through the Entrepreneurial Universities Macroalgal Biotechnologies Programme, jointly funded by the University of Waikato and the Tertiary Education Commission (TEC).

Institutional Review Board Statement

Animal Ethics Committee of the University of Southern Queensland approved all experimental protocols on rats (Approval number: 18REA001). This Committee operates under the guidelines of the Australian National Health and Medical Research Council.

Informed Consent Statement

Not applicable.

Data Availability Statement

The data presented in this study are available on request from the corresponding author.

Acknowledgments

Bryan Bynon from the School of Veterinary Sciences, The University of Queensland, Gatton, QLD is thanked for plasma biochemical analyses and the University of Southern Queensland is acknowledged for a postgraduate research scholarship for R.d.P.

Conflicts of Interest

The authors declare no conflict of interest.

References

  1. Mouritsen, O.G.; Rhatigan, P.; Pérez-Lloréns, J.L. The rise of seaweed gastronomy: Phycogastronomy. Bot. Mar. 2019, 62, 195–209. [Google Scholar] [CrossRef]
  2. Cherry, P.; O’Hara, C.; Magee, P.J.; McSorley, E.M.; Allsopp, P.J. Risks and benefits of consuming edible seaweeds. Nutr. Rev. 2019, 77, 307–329. [Google Scholar] [CrossRef] [Green Version]
  3. FAO. The State of World Fisheries and Aquaculture 2020. In Sustainability in Action; FAO: Rome, Italy, 2020. [Google Scholar] [CrossRef]
  4. Kothale, D.; Verma, U.; Dewangan, N.; Jana, P.; Jain, A.; Jain, D. Alginate as promising natural polymer for pharmaceutical, food, and biomedical applications. Curr. Drug Deliv. 2020, 17, 755–775. [Google Scholar] [CrossRef] [PubMed]
  5. Costa, M.; Cardoso, C.; Afonso, C.; Bandarra, N.M.; Prates, J.A.M. Current knowledge and future perspectives of the use of seaweeds for livestock production and meat quality: A systematic review. J. Anim. Physiol. Anim. Nutr. (Berl.) 2021. [Google Scholar] [CrossRef] [PubMed]
  6. Greetham, D.; Adams, J.M.; Du, C. The utilization of seawater for the hydrolysis of macroalgae and subsequent bioethanol fermentation. Sci. Rep. 2020, 10, 9728. [Google Scholar] [CrossRef] [PubMed]
  7. Shukla, P.S.; Mantin, E.G.; Adil, M.; Bajpai, S.; Critchley, A.T.; Prithiviraj, B. Ascophyllum nodosum-based biostimulants: Sustainable applications in agriculture for the stimulation of plant growth, stress tolerance, and disease management. Front. Plant. Sci. 2019, 10, 655. [Google Scholar] [CrossRef] [PubMed] [Green Version]
  8. Mazur, L.P.; Cechinel, M.A.P.; de Souza, S.; Boaventura, R.A.R.; Vilar, V.J.P. Brown marine macroalgae as natural cation exchangers for toxic metal removal from industrial wastewaters: A review. J. Environ. Manag. 2018, 223, 215–253. [Google Scholar] [CrossRef] [PubMed]
  9. Keleszade, E.; Patterson, M.; Trangmar, S.; Guinan, K.J.; Costabile, A. Clinical efficacy of brown seaweeds Ascophyllum nodosum and Fucus vesiculosus in the prevention or delay progression of the metabolic syndrome: A review of clinical trials. Molecules 2021, 26, 714. [Google Scholar] [CrossRef]
  10. Yip, Z.T.; Quek, R.Z.B.; Huang, D. Historical biogeography of the widespread macroalga Sargassum (Fucales, Phaeophyceae). J. Phycol. 2020, 56, 300–309. [Google Scholar] [CrossRef] [Green Version]
  11. Wang, M.; Hu, C.; Barnes, B.B.; Mitchum, G.; Lapointe, B.; Montoya, J.P. The great Atlantic Sargassum belt. Science 2019, 365, 83–87. [Google Scholar] [CrossRef]
  12. Byeon, S.Y.; Oh, H.J.; Kim, S.; Yun, S.H.; Kang, J.H.; Park, S.R.; Lee, H.J. The origin and population genetic structure of the ‘golden tide’ seaweeds, Sargassum horneri, in Korean waters. Sci. Rep. 2019, 9, 7757. [Google Scholar] [CrossRef] [PubMed] [Green Version]
  13. Davis, D.; Simister, R.; Campbell, S.; Marston, M.; Bose, S.; McQueen-Mason, S.J.; Gomez, L.D.; Gallimore, W.A.; Tonon, T. Biomass composition of the golden tide pelagic seaweeds Sargassum fluitans and S. natans (morphotypes I and VIII) to inform valorisation pathways. Sci. Total Environ. 2021, 762, 143134. [Google Scholar] [CrossRef] [PubMed]
  14. Hwang, E.K.; Park, C.S. Seaweed cultivation and utilization of Korea. Algae 2020, 35, 107–121. [Google Scholar] [CrossRef]
  15. Ayyad, S.E.; Ezmirly, S.T.; Basaif, S.A.; Alarif, W.M.; Badria, A.F.; Badria, F.A. Antioxidant, cytotoxic, antitumor, and protective DNA damage metabolites from the red sea brown alga Sargassum sp. Pharmacogn. Res. 2011, 3, 160–165. [Google Scholar] [CrossRef] [Green Version]
  16. Zhang, R.; Zhang, X.; Tang, Y.; Mao, J. Composition, isolation, purification and biological activities of Sargassum fusiforme polysaccharides: A review. Carbohydr. Polym. 2020, 228, 115381. [Google Scholar] [CrossRef]
  17. Atlas of Living Australia. Sargassum siliquosum J. Agardh. Available online: https://bie.ala.org.au/species/54105062 (accessed on 29 March 2021).
  18. Brown, L.; Poudyal, H.; Panchal, S.K. Functional foods as potential therapeutic options for metabolic syndrome. Obes. Rev. 2015, 16, 914–941. [Google Scholar] [CrossRef] [PubMed]
  19. O’Neill, S.; O’Driscoll, L. Metabolic syndrome: A closer look at the growing epidemic and its associated pathologies. Obes. Rev. 2015, 16, 1–12. [Google Scholar] [CrossRef] [Green Version]
  20. Yende, S.R.; Harle, U.N.; Chaugule, B.B. Therapeutic potential and health benefits of Sargassum species. Pharmacogn. Rev. 2014, 8, 1–7. [Google Scholar] [CrossRef] [Green Version]
  21. Choi, D.-S.; Athukorala, Y.; Jeon, Y.-J.; Senevirathne, M.; Cho, K.-R.; Kim, S.-H. Antioxidant activity of sulfated polysaccharides isolated from Sargassum fulvellum. Prev. Nutr. Food Sci. 2007, 12, 65–73. [Google Scholar] [CrossRef]
  22. Dar, A.; Baig, H.; Saifullah, S.; Ahmad, V.; Yasmeen, S.; Nizamuddin, M. Effect of seasonal variation on the anti-inflammatory activity of Sargassum wightii growing on the N. Arabian Sea coast of Pakistan. J. Exp. Mar. Biol. Ecol. 2007, 351, 1–9. [Google Scholar] [CrossRef]
  23. Abidov, M.; Ramazanov, Z.; Seifulla, R.; Grachev, S. The effects of Xanthigen in the weight management of obese premenopausal women with non-alcoholic fatty liver disease and normal liver fat. Diabetes Obes. Metab. 2010, 12, 72–81. [Google Scholar] [CrossRef]
  24. Maeda, H.; Fukuda, S.; Izumi, H.; Saga, N. Anti-oxidant and fucoxanthin contents of brown alga Ishimozuku (Sphaerotrichia divaricata) from the West Coast of Aomori, Japan. Mar. Drugs 2018, 16, 255. [Google Scholar] [CrossRef] [PubMed] [Green Version]
  25. D’Orazio, N.; Gemello, E.; Gammone, M.A.; de Girolamo, M.; Ficoneri, C.; Riccioni, G. Fucoxanthin: A treasure from the sea. Mar. Drugs 2012, 10, 604–616. [Google Scholar] [CrossRef] [Green Version]
  26. du Preez, R.; Paul, N.; Mouatt, P.; Majzoub, M.E.; Thomas, T.; Panchal, S.K.; Brown, L. Carrageenans from the red seaweed Sarconema filiforme attenuate symptoms of diet-induced metabolic syndrome in rats. Mar. Drugs 2020, 18, 97. [Google Scholar] [CrossRef] [Green Version]
  27. du Preez, R.; Majzoub, M.E.; Thomas, T.; Panchal, S.K.; Brown, L. Caulerpa lentillifera (sea grapes) improves cardiovascular and metabolic health of rats with diet-induced metabolic syndrome. Metabolites 2020, 10, 500. [Google Scholar] [CrossRef] [PubMed]
  28. Panchal, S.K.; Poudyal, H.; Iyer, A.; Nazer, R.; Alam, A.; Diwan, V.; Kauter, K.; Sernia, C.; Campbell, F.; Ward, L.; et al. High-carbohydrate high-fat diet-induced metabolic syndrome and cardiovascular remodeling in rats. J. Cardiovasc. Pharmacol. 2011, 57, 611–624. [Google Scholar] [CrossRef] [PubMed]
  29. May-Lin, B.Y.; Ching-Lee, W. Seasonal growth rate of Sargassum species at Teluk Kemang, Port Dickson, Malaysia. J. Appl. Phycol. 2013, 25, 805–814. [Google Scholar] [CrossRef]
  30. Lyu, M.; Wang, Y.F.; Fan, G.W.; Wang, X.Y.; Xu, S.Y.; Zhu, Y. Balancing herbal medicine and functional food for prevention and treatment of cardiometabolic diseases through modulating gut microbiota. Front. Microbiol. 2017, 8, 2146. [Google Scholar] [CrossRef] [Green Version]
  31. Vallianou, N.; Stratigou, T.; Christodoulatos, G.S.; Dalamaga, M. Understanding the role of the gut microbiome and microbial metabolites in obesity and obesity-associated metabolic disorders: Current evidence and perspectives. Curr. Obes. Rep. 2019, 8, 317–332. [Google Scholar] [CrossRef]
  32. Zuccarello, G.C.; Lokhorst, G.M. Molecular phylogeny of the genus Tribonema (Xanthophyceae) using rbcL gene sequence data: Monophyly of morphologically simple algal species. Phycologia 2005, 44, 384–392. [Google Scholar] [CrossRef]
  33. Lane, C.; Lindstrom, S.; Saunders, G. A molecular assessment of northeast Pacific Alaria species (Laminariales, Phaeophyceae) with reference to the utility of DNA barcoding. Mol. Phylogenet. Evol. 2007, 44, 634–648. [Google Scholar] [CrossRef] [PubMed]
  34. Robic, A.; Rondeau-Mouro, C.; Sassi, J.F.; Lerat, Y.; Lahaye, M. Structure and interactions of ulvan in the cell wall of the marine green algae Ulva rotundata (Ulvales, Chlorophyceae). Carbohydr. Polym. 2009, 77, 206–216. [Google Scholar] [CrossRef]
  35. Wu, J.; Zhao, X.; Ren, L.; Xue, Y.; Li, C.; Yu, G.; Guan, H. Determination of M/G ratio of propylene glycol alginate sodium sulfate by HPLC with pre-column derivatization. Carbohydr. Polym. 2014, 104, 23–28. [Google Scholar] [CrossRef] [PubMed]
  36. Wanyonyi, S.; du Preez, R.; Brown, L.; Paul, N.A.; Panchal, S.K. Kappaphycus alvarezii as a food supplement prevents diet-induced metabolic syndrome in rats. Nutrients 2017, 9, 1261. [Google Scholar] [CrossRef] [PubMed] [Green Version]
  37. Gosch, B.J.; Magnusson, M.; Paul, N.A.; de Nys, R. Total lipid and fatty acid composition of seaweeds for the selection of species for oil-based biofuel and bioproducts. Glob. Change Biol. Bioenergy 2012, 4, 919–930. [Google Scholar] [CrossRef] [Green Version]
  38. Sekar, S.; Shafie, S.R.; Prasadam, I.; Crawford, R.; Panchal, S.K.; Brown, L.; Xiao, Y. Saturated fatty acids induce development of both metabolic syndrome and osteoarthritis in rats. Sci. Rep. 2017, 7, 46457. [Google Scholar] [CrossRef] [PubMed] [Green Version]
  39. Kumar, S.A.; Brown, L. Seaweeds as potential therapeutic interventions for the metabolic syndrome. Rev. Endocr. Metab. Disord. 2013, 14, 299–308. [Google Scholar] [CrossRef] [PubMed]
  40. Kang, M.C.; Lee, H.G.; Kim, H.S.; Song, K.M.; Chun, Y.G.; Lee, M.H.; Kim, B.K.; Jeon, Y.J. Anti-obesity effects of Sargassum thunbergii via downregulation of adipogenesis gene and upregulation of thermogenic genes in high-fat diet-induced obese mice. Nutrients 2020, 12, 3325. [Google Scholar] [CrossRef]
  41. Motshakeri, M.; Ebrahimi, M.; Goh, Y.M.; Othman, H.H.; Hair-Bejo, M.; Mohamed, S. Effects of brown seaweed (Sargassum polycystum) extracts on kidney, liver, and pancreas of type 2 diabetic rat model. Evid. Based Complement. Alternat. Med. 2014, 2014, 379407. [Google Scholar] [CrossRef] [Green Version]
  42. Liu, L.; Heinrich, M.; Myers, S.; Dworjanyn, S.A. Towards a better understanding of medicinal uses of the brown seaweed Sargassum in Traditional Chinese Medicine: A phytochemical and pharmacological review. J. Ethnopharmacol. 2012, 142, 591–619. [Google Scholar] [CrossRef]
  43. Stiger-Pouvreau, V.; Bourgougnon, N.; Deslandes, E. Chapter 8-Carbohydrates from Seaweeds. In Seaweed in Health and Disease Prevention; Fleurence, J., Levine, I., Eds.; Academic Press: San Diego, CA, USA, 2016; pp. 223–274. [Google Scholar] [CrossRef]
  44. Jensen, G.M.; Pedersen, C.; Kristensen, M.; Frost, G.; Astrup, A. Review: Efficacy of alginate supplementation in relation to appetite regulation and metabolic risk factors: Evidence from animal and human studies. Obes. Rev. 2013, 14, 129–144. [Google Scholar] [CrossRef] [PubMed]
  45. Jensen, G.M.; Kristensen, M.; Belza, A.; Knudsen, J.C.; Astrup, A. Acute effect of alginate-based preload on satiety feelings, energy intake, and gastric emptying rate in healthy subjects. Obesity (Silver Spring) 2012, 20, 1851–1858. [Google Scholar] [CrossRef]
  46. Jensen, G.M.; Kristensen, M.; Astrup, A. Effect of alginate supplementation on weight loss in obese subjects completing a 12-wk energy-restricted diet: A randomized controlled trial. Am. J. Clin. Nutr. 2012, 96, 5–13. [Google Scholar] [CrossRef] [PubMed] [Green Version]
  47. Reagan-Shaw, S.; Nihal, M.; Ahmad, N. Dose translation from animal to human studies revisited. FASEB J. 2008, 22, 659–661. [Google Scholar] [CrossRef] [PubMed] [Green Version]
  48. Cheng, Y.; Sibusiso, L.; Hou, L.; Jiang, H.; Chen, P.; Zhang, X.; Wu, M.; Tong, H. Sargassum fusiforme fucoidan modifies the gut microbiota during alleviation of streptozotocin-induced hyperglycemia in mice. Int. J. Biol. Macromol. 2019, 131, 1162–1170. [Google Scholar] [CrossRef]
  49. Zhang, Y.; Zuo, J.; Yan, L.; Cheng, Y.; Li, Q.; Wu, S.; Chen, L.; Thring, R.W.; Yang, Y.; Gao, Y.; et al. Sargassum fusiforme fucoidan alleviates high-fat diet-induced obesity and insulin resistance associated with the improvement of hepatic oxidative stress and gut microbiota profile. J. Agric. Food Chem. 2020, 68, 10626–10638. [Google Scholar] [CrossRef] [PubMed]
  50. Chen, Q.; Liu, M.; Zhang, P.; Fan, S.; Huang, J.; Yu, S.; Zhang, C.; Li, H. Fucoidan and galactooligosaccharides ameliorate high-fat diet-induced dyslipidemia in rats by modulating the gut microbiota and bile acid metabolism. Nutrition 2019, 65, 50–59. [Google Scholar] [CrossRef]
  51. Chater, P.I.; Wilcox, M.D.; Houghton, D.; Pearson, J.P. The role of seaweed bioactives in the control of digestion: Implications for obesity treatments. Food Funct. 2015, 6, 3420–3427. [Google Scholar] [CrossRef]
  52. Nagappan, H.; Pee, P.P.; Kee, S.H.Y.; Ow, J.T.; Yan, S.W.; Chew, L.Y.; Kong, K.W. Malaysian brown seaweeds Sargassum siliquosum and Sargassum polycystum: Low density lipoprotein (LDL) oxidation, angiotensin converting enzyme (ACE), α-amylase, and α-glucosidase inhibition activities. Food Res. Int. 2017, 99, 950–958. [Google Scholar] [CrossRef]
  53. Hu, X.; Li, Y.; Li, C.; Fu, Y.; Cai, F.; Chen, Q.; Li, D. Combination of fucoxanthin and conjugated linoleic acid attenuates body weight gain and improves lipid metabolism in high-fat diet-induced obese rats. Arch. Biochem. Biophys. 2012, 519, 59–65. [Google Scholar] [CrossRef]
  54. Poudyal, H.; Panchal, S.K.; Ward, L.C.; Brown, L. Effects of ALA, EPA and DHA in high-carbohydrate, high-fat diet-induced metabolic syndrome in rats. J. Nutr. Biochem. 2013, 24, 1041–1052. [Google Scholar] [CrossRef] [PubMed]
  55. Lagkouvardos, I.; Lesker, T.R.; Hitch, T.C.A.; Galvez, E.J.C.; Smit, N.; Neuhaus, K.; Wang, J.; Baines, J.F.; Abt, B.; Stecher, B.; et al. Sequence and cultivation study of Muribaculaceae reveals novel species, host preference, and functional potential of this yet undescribed family. Microbiome 2019, 7, 28. [Google Scholar] [CrossRef] [PubMed] [Green Version]
  56. Ormerod, K.L.; Wood, D.L.; Lachner, N.; Gellatly, S.L.; Daly, J.N.; Parsons, J.D.; Dal’Molin, C.G.; Palfreyman, R.W.; Nielsen, L.K.; Cooper, M.A.; et al. Genomic characterization of the uncultured Bacteroidales family S24-7 inhabiting the guts of homeothermic animals. Microbiome 2016, 4, 36. [Google Scholar] [CrossRef] [Green Version]
  57. Smith, B.J.; Miller, R.A.; Ericsson, A.C.; Harrison, D.C.; Strong, R.; Schmidt, T.M. Changes in the gut microbiome and fermentation products concurrent with enhanced longevity in acarbose-treated mice. BMC Microbiol. 2019, 19, 130. [Google Scholar] [CrossRef] [PubMed] [Green Version]
  58. Sibai, M.; Altuntas, E.; Yildirim, B.; Ozturk, G.; Yildirim, S.; Demircan, T. Microbiome and longevity: High abundance of longevity-linked Muribaculaceae in the gut of the long-living rodent Spalax leucodon. OMICS 2020, 24, 592–601. [Google Scholar] [CrossRef] [PubMed]
  59. Cherry, P.; Yadav, S.; Strain, C.R.; Allsopp, P.J.; McSorley, E.M.; Ross, R.P.; Stanton, C. Prebiotics from seaweeds: An ocean of opportunity? Mar. Drugs 2019, 17, 327. [Google Scholar] [CrossRef] [Green Version]
  60. Li, M.; Li, G.; Shang, Q.; Chen, X.; Liu, W.; Pi, X.; Zhu, L.; Yin, Y.; Yu, G.; Wang, X. In vitro fermentation of alginate and its derivatives by human gut microbiota. Anaerobe 2016, 39, 19–25. [Google Scholar] [CrossRef]
  61. Li, S.; Wang, L.; Liu, B.; He, N. Unsaturated alginate oligosaccharides attenuated obesity-related metabolic abnormalities by modulating gut microbiota in high-fat-diet mice. Food Funct. 2020, 11, 4773–4784. [Google Scholar] [CrossRef]
  62. Fu, X.; Cao, C.; Ren, B.; Zhang, B.; Huang, Q.; Li, C. Structural characterization and in vitro fermentation of a novel polysaccharide from Sargassum thunbergii and its impact on gut microbiota. Carbohydr. Polym. 2018, 183, 230–239. [Google Scholar] [CrossRef]
Figure 1. Sargassum siliquosum specimen with intact holdfasts and fresh new growth.
Nutrients 13 01754 g001
Figure 2. Study design to identify effects of Sargassum siliquosum intervention. C, rats fed with corn starch diet; CS, rats fed with corn starch diet +5% Sargassum siliquosum; H, rats fed with high-carbohydrate, high-fat diet; HS, rats fed with high-carbohydrate, high-fat diet +5% Sargassum siliquosum.
Nutrients 13 01754 g002
Figure 3. Genetic barcoding of Sargassum species: maximum likelihood tree of cytochrome oxidase I marker sequence data. Numbers near each node refer to bootstrap support values. Numbers accompanying the species names are GenBank accession numbers for the sequences used in the analysis. The specimens collected here are referred to as H104 Australia.
Nutrients 13 01754 g003
Figure 4. Chromatograms using diode-array detection to estimate xanthophyll (total) and fucoxanthin concentrations in Sargassum siliquosum.
Nutrients 13 01754 g004
Figure 5. Effects of S. siliquosum on (A) body weight, (B) food intake and (C) water intake. Means with unlike superscripts (a, b or c) differ, p < 0.05. C, rats fed with corn starch diet; CS, rats fed with corn starch diet + 5% Sargassum siliquosum; H, rats fed with high-carbohydrate, high-fat diet; HS, rats fed with high-carbohydrate, high-fat diet + 5% Sargassum siliquosum.
Nutrients 13 01754 g005
Figure 6. Effects of S. siliquosum on thoracic aortic responses to (A) noradrenaline, (B) sodium nitroprusside and (C) acetylcholine. Means with unlike superscripts (a or b) differ, p < 0.05. C, rats fed with corn starch diet; CS, rats fed with corn starch diet + Sargassum siliquosum; H, rats fed with high-carbohydrate, high-fat diet; HS, rats fed with high-carbohydrate, high-fat diet + 5% Sargassum siliquosum (HS).
Nutrients 13 01754 g006
Figure 7. Histological analysis of liver, heart, ileum and colon. (AD) showing haematoxylin and eosin staining and (EH) showing oil red O staining to identify liver fat deposition; (IL) showing haematoxylin and eosin staining to identify heart inflammation; (MP) showing picrosirius red staining to identify heart fibrosis; (QT) showing haematoxylin and eosin stain of ileum and (UX) showing haematoxylin and eosin stain of colon in rats fed with corn starch diet (A,E,I,M,Q,U), rats fed with corn starch diet + Sargassum siliquosum (B,F,J,N,R,V), rats fed with high-carbohydrate, high-fat diet (C,G,K,O,S,W) and rats fed with high-carbohydrate, high-fat diet + Sargassum siliquosum (D,H,L,P,T,X). Fat cells = fc; inflammatory cells = ic; fibrosis = fb. Scale bar is 200 µm for (AP) (20×) and 100 µm for (QX) (10×).
Nutrients 13 01754 g007
Figure 8. Multidimensional scaling plot for the Bray–Curtis dissimilarities of bacterial gut communities. C, rats fed with corn starch diet; CS, rats fed with corn starch diet + Sargassum siliquosum; H, rats fed with high-carbohydrate, high-fat diet; HS, high-carbohydrate, high-fat diet + Sargassum siliquosum.
Nutrients 13 01754 g008
Figure 9. Taxonomic profiles of bacterial communities of all faecal samples shown at the class level. C, rats fed with corn starch diet; CS, rats fed with corn starch diet + Sargassum siliquosum; H, rats fed with high-carbohydrate, high-fat diet; HS, rats fed with high-carbohydrate, high-fat diet + Sargassum siliquosum.
Nutrients 13 01754 g009
Table 1. Proximate composition (% of dry weight) of Sargassum siliquosum.
LipidProtein (Sum Amino Acids)AshMoistureCarbohydrate *Dietary Fibre
TotalSolubleInsoluble
1.7 ± 0.44.02 ± 0.127.7 ± 1.39.1 ± 0.557.8 ± 0.540.2, 42.65.36, 11.034.9, 31.6
* by difference. Values are presented as mean ± SEM, n = 3 for protein; and n = 2 for dietary fibre, both values are provided.
Table 2. Elemental composition (% of dry weight) of Sargassum siliquosum.
CHNSI
29.00 ± 0.334.31 ± 0.090.91 ± 0.021.18 ± 0.050.038 ± 0.002
Values are presented as mean ± SEM, n = 5.
Table 3. Responses to Sargassum siliquosum.
VariablesCCSHHSp Value
DietTreatmentInteraction
Physiological variables
Body weight 0 weeks, g337 ± 1338 ± 1339 ± 1338 ± 10.381.000.38
Body weight 8 weeks, g366 ± 7 b369 ± 5 b445 ± 10 a461 ± 13 a<0.00010.390.55
Body weight 16 weeks, g388 ± 10 c384 ± 10 c547 ± 14 a490 ±16 b<0.00010.0470.08
Lean mass 16 weeks, g292 ± 15282 ± 6299 ± 12281 ± 100.780.200.71
Fat mass 16 weeks, g75 ± 15 c86 ± 8 c248 ± 27 a193 ± 19 b<0.00010.240.08
Food intake 0–8 weeks, g/day43.2 ± 2.2 a44.2 ± 1.0 a26.6 ± 1.1 b26.4 ± 1.0 b<0.00010.760.65
Food intake 9–16 weeks, g/day44.0 ± 1.2 a41.1 ± 0.9 a23.9 ± 0.9 b22.3 ± 0.6 b<0.00010.0220.49
Xanthophylls intake (total), mg/kg/day-0.40 ± 0.01-0.17 ± 0.01---
Fucoxanthin intake, mg/kg/day-0.031 ± 0.001-0.013 ± 0.001---
Alginate intake, mg/kg/day-1764 ± 15-749 ± 9---
Fucoidan intake, mg/kg/day-80.2 ± 0.8-34.1 ± 10.4---
Iodine, mg/kg/day-41 ± 1-17 ± 1---
Polyunsaturated fatty acid intake, mg/kg/day-26.2 ± 0.2-11.1 ± 0.1---
Water intake 0–8 weeks, g/day31.8 ± 1.631.8 ± 2.032.4 ± 1.4 29.1 ± 1.20.570.370.37
Water intake 9–16 weeks, g/day21.7 ± 1.4 c28.5 ± 0.7 b28.8 ± 1.3 b34.8 ± 1.4 a<0.0001<0.00010.76
Energy intake 0–8 weeks, kJ/day485 ± 25 b496 ± 11 b607 ± 19 a584 ± 20 a<0.00010.760.39
Energy intake 9–16 weeks, kJ/day470 ± 13 b457 ± 6 b536 ± 15 a534 ± 13 a<0.00010.550.66
Feed efficiency 9–16 weeks, g/kJ 0.05 ± 0.01 b0.03 ± 0.01 b0.19 ± 0.02 a0.05 ± 0.01 b0.00010.080.042
Abdominal circumference 16 weeks, cm18.7 ± 0.5 b18.5 ± 0.2 b21.5 ± 0.2 a22.0 ± 0.5 a<0.00010.730.42
Body mass index, g/cm20.61 ± 0.03 b0.65 ± 0.01 b0.81 ± 0.02 a0.75 ± 0.02 a<0.00010.620.019
Retroperitoneal fat, mg/mm210 ± 20 c218 ± 13 c673 ± 54 a495 ± 50 b<0.00010.0520.034
Epididymal fat, mg/mm89 ± 11 b65 ± 7 b250 ± 36 a115 ± 15 b<0.0001<0.00010.003
Omental fat, mg/mm139 ± 14 b165 ± 9 b325 ± 34 a272 ± 22 a<0.00010.530.07
Total abdominal fat, mg/mm437 ± 42 c448 ± 25 c1107 ± 57 a907 ± 71 b<0.00010.120.08
Visceral adiposity, %5.2 ± 0.5 b5.3 ± 0.2 b9.3 ± 1.1 a8.3 ± 0.6 a<0.00010.470.38
Liver wet weight, mg/mm261 ± 11 b244 ± 10 b380 ± 12 a376 ± 14 a<0.00010.440.63
Cardiovascular variables
Systolic blood pressure 8 weeks, mmHg125 ± 4 b121 ± 2 b137 ± 3 a134 ± 3 a0.00030.270.87
Systolic blood pressure 16 weeks, mmHg123 ± 2 b122 ± 2 b138 ± 3 a135 ± 4 a0.00030.570.77
Left ventricle + septum, mg/mm22.9 ± 1.122.8 ± 0.725.2 ± 1.123.0 ± 0.70.170.200.25
Right ventricle, mg/mm4.5 ± 0.73.9 ± 0.35.3 ± 0.25.3 ± 0.20.0040.410.41
Left ventricular diastolic stiffness, κ22.1 ± 0.8 b22.9 ± 0.7 b30.5 ± 1.2 a29.4 ± 1.3 a<0.00010.900.42
Left ventricular collagen area, %10 ± 2 b11 ± 3 b33 ± 3 a29 ± 5 a0.00030.670.49
Metabolic variables
Plasma total cholesterol, mmol/L1.56 ± 0.081.68 ± 0.061.57 ± 0.101.86 ± 0.190.530.180.57
Plasma triglycerides, mmol/L0.43 ± 0.02 b0.42 ± 0.04 b1.88 ± 0.31 a1.54 ± 0.28 a<0.00010.400.43
Alanine transaminase, U/L34 ± 453 ± 638 ± 248 ± 60.940.0280.48
Aspartate transaminase, U/L116 ± 2150 ± 19120 ± 12142 ± 200.920.180.77
Liver inflammatory cells, cells/200 µm26 ± 1 b7 ± 1 b25 ± 2 a26 ± 3 a<0.00010.621.00
Liver fat vacuoles area, fat vacuoles/200 µm213.1 ± 1.7 c15.6 ± 2.4 c88.6 ± 3.4 a55.2 ± 2.9 b<0.0001<0.0001<0.0001
Oral glucose tolerance test
Basal blood glucose 0 weeks, mmol/L2.6 ± 0.12.6 ± 0.12.6 ± 0.22.7 ± 0.10.700.700.70
Area under the curve 0 weeks, mmol/L × minute632 ± 30594 ± 20606 ± 19552 ± 12 0.110.0330.70
Basal blood glucose 8 weeks, mmol/L2.9 ± 0.2 b2.6 ± 0.1 b3.3 ± 0.1 a3.5 ± 0.1 a<0.00010.700.058
120-minute blood glucose 8 weeks, mmol/L3.5 ± 0.2 b3.7 ± 0.1 b5.0 ± 0.1 a5.2 ± 0.2 a<0.00010.271.00
Area under the curve 8 weeks, mmol/L × minute530 ± 15 b537 ± 9 b657 ± 22 a682 ± 15 a<0.00010.310.57
Basal blood glucose 16 weeks, mmol/L2.8 ± 0.23.0 ± 0.23.3 ± 0.23.4 ± 0.10.550.840.95
120-minute blood glucose 16 weeks, mmol/L3.9 ± 0.2 b3.7 ± 0.1 b4.8 ± 0.3 a4.5 ± 0.1 a<0.00010.130.76
Area under the curve 16 weeks, mmol/L × minute501 ± 21 b523 ± 14 b617 ± 25 a604 ± 9 a<0.00010.790.29
Insulin tolerance test
120-minute blood glucose 8 weeks, mmol/L2.9 ± 0.4 b2.7 ± 0.2 b4.5 ± 0.3 a4.4 ± 0.2 a<0.00010.580.85
Area under the curve 8 weeks, mmol/L × minute247 ± 58 b234 ± 32 b408 ± 21 a390 ± 18 a<0.00010.650.94
120-minute blood glucose 16 weeks, mmol/L2.7 ± 0.3 b3.3 ± 0.2 b4.5 ± 0.4 a4.3 ± 0.2 a<0.00010.460.14
Area under the curve 16 weeks, mmol/L × minute208 ± 37 b168 ± 27 b404 ± 54 a420 ± 28 a<0.00010.740.44
Values are presented as mean ± SEM, n = 10–12. Means in a row with unlike superscripts (a, b or c) differ, p < 0.05. C, rats fed with corn starch diet; CS, rats fed with corn starch diet + Sargassum siliquosum; H, rats fed with high-carbohydrate, high-fat diet; HS, rats fed with high-carbohydrate, high-fat diet + Sargassum siliquosum.
Publisher’s Note: MDPI stays neutral with regard to jurisdictional claims in published maps and institutional affiliations.

