
Predicting Malnutrition Risk with Data from Routinely Measured Clinical Biochemical Diagnostic Tests in Free-Living Older Populations

 , , , and
Abstract
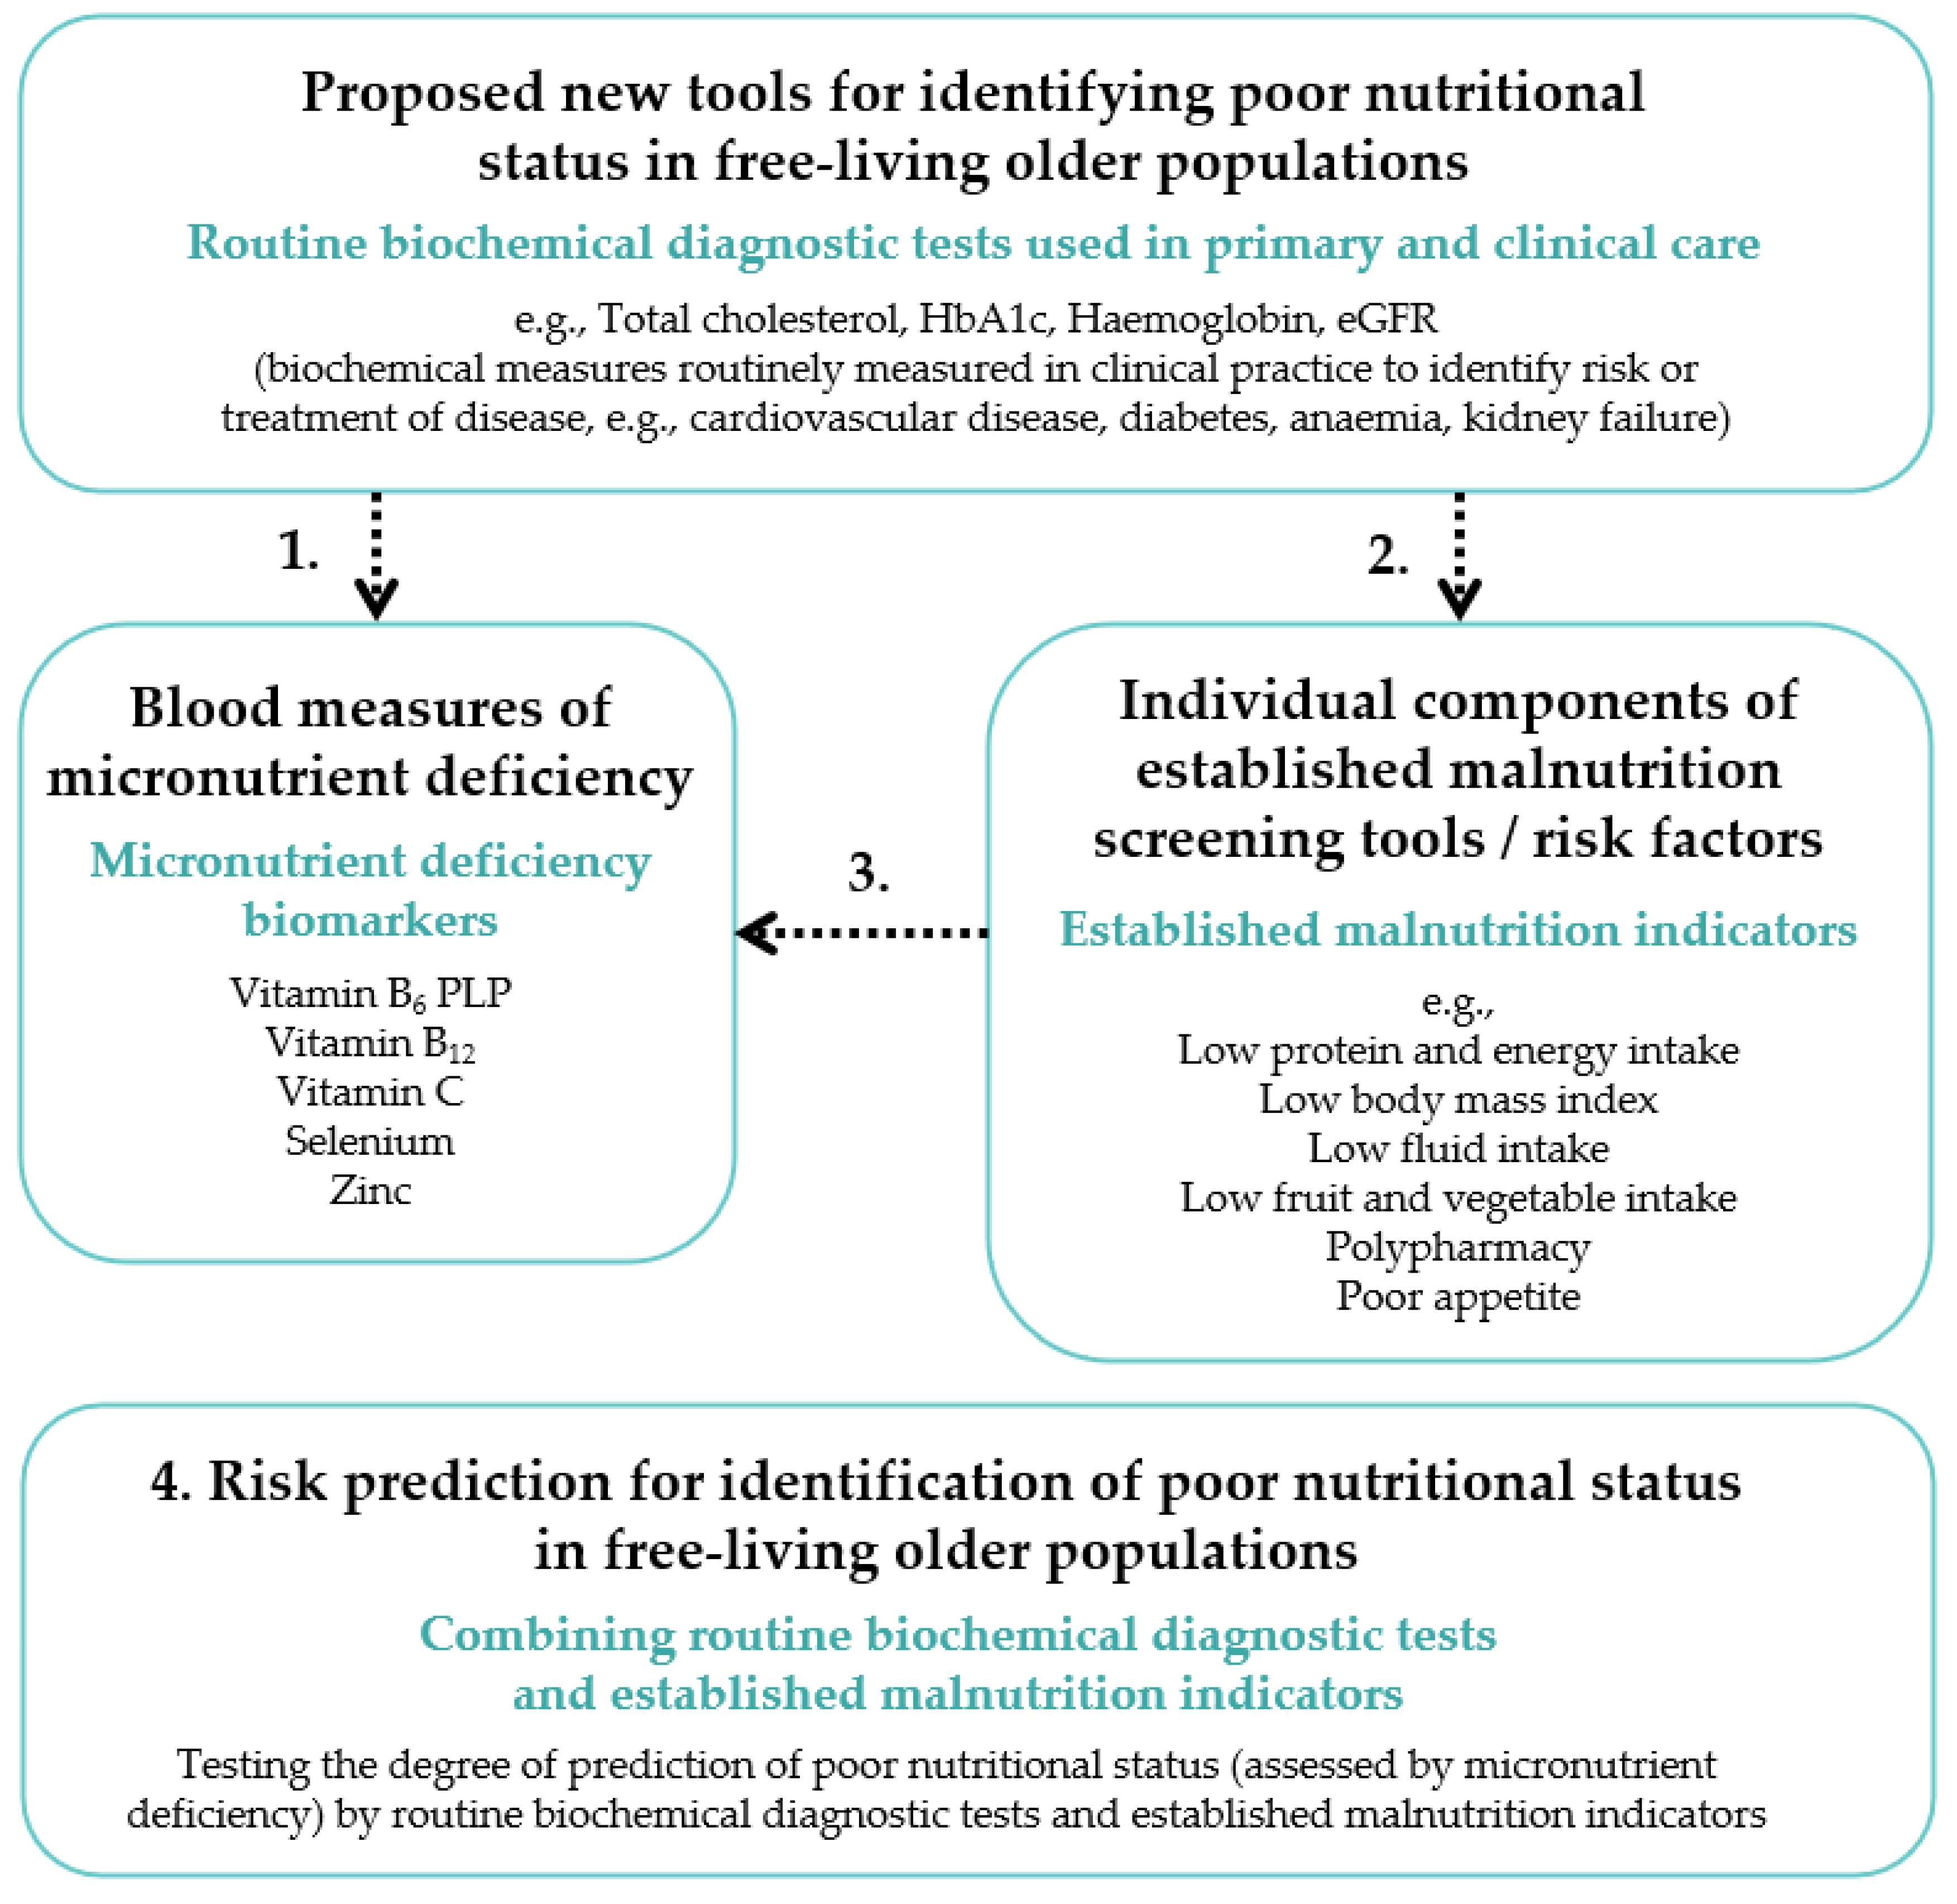
:1. Introduction
2. Materials and Methods
2.1. Study Design and Population
2.2. Study Population Measurements
2.2.1. Subject’s Characteristics Data Collection
2.2.2. Dietary Data Collection
2.2.3. Blood Sample Collection and Biochemical Analyses
2.3. Routine Biochemical Diagnostic Tests and Cut-Off Points for Inadequate Status
2.4. Micronutrient Deficiency Biomarkers and Cut-Off Points for Inadequate Status
2.5. Established Malnutrition Indicators and Cut-Off Points for Inadequate Status
2.6. Statistical Analyses
3. Results
3.1. Study Population Characteristics
3.2. Descriptives of Micronutrient Deficiency Biomarkers and Routine Biochemical Diagnostic Tests
3.3. Associations between Routine Biochemical Diagnostic Tests and Micronutrient Deficiency (Stage 1)
3.4. Associations between Routine Biochemical Diagnostic Tests and Established Malnutrition Indicators (Stage 2)
3.5. Associations between Established Malnutrition Indicators and Micronutrient Deficiency (Stage 3)
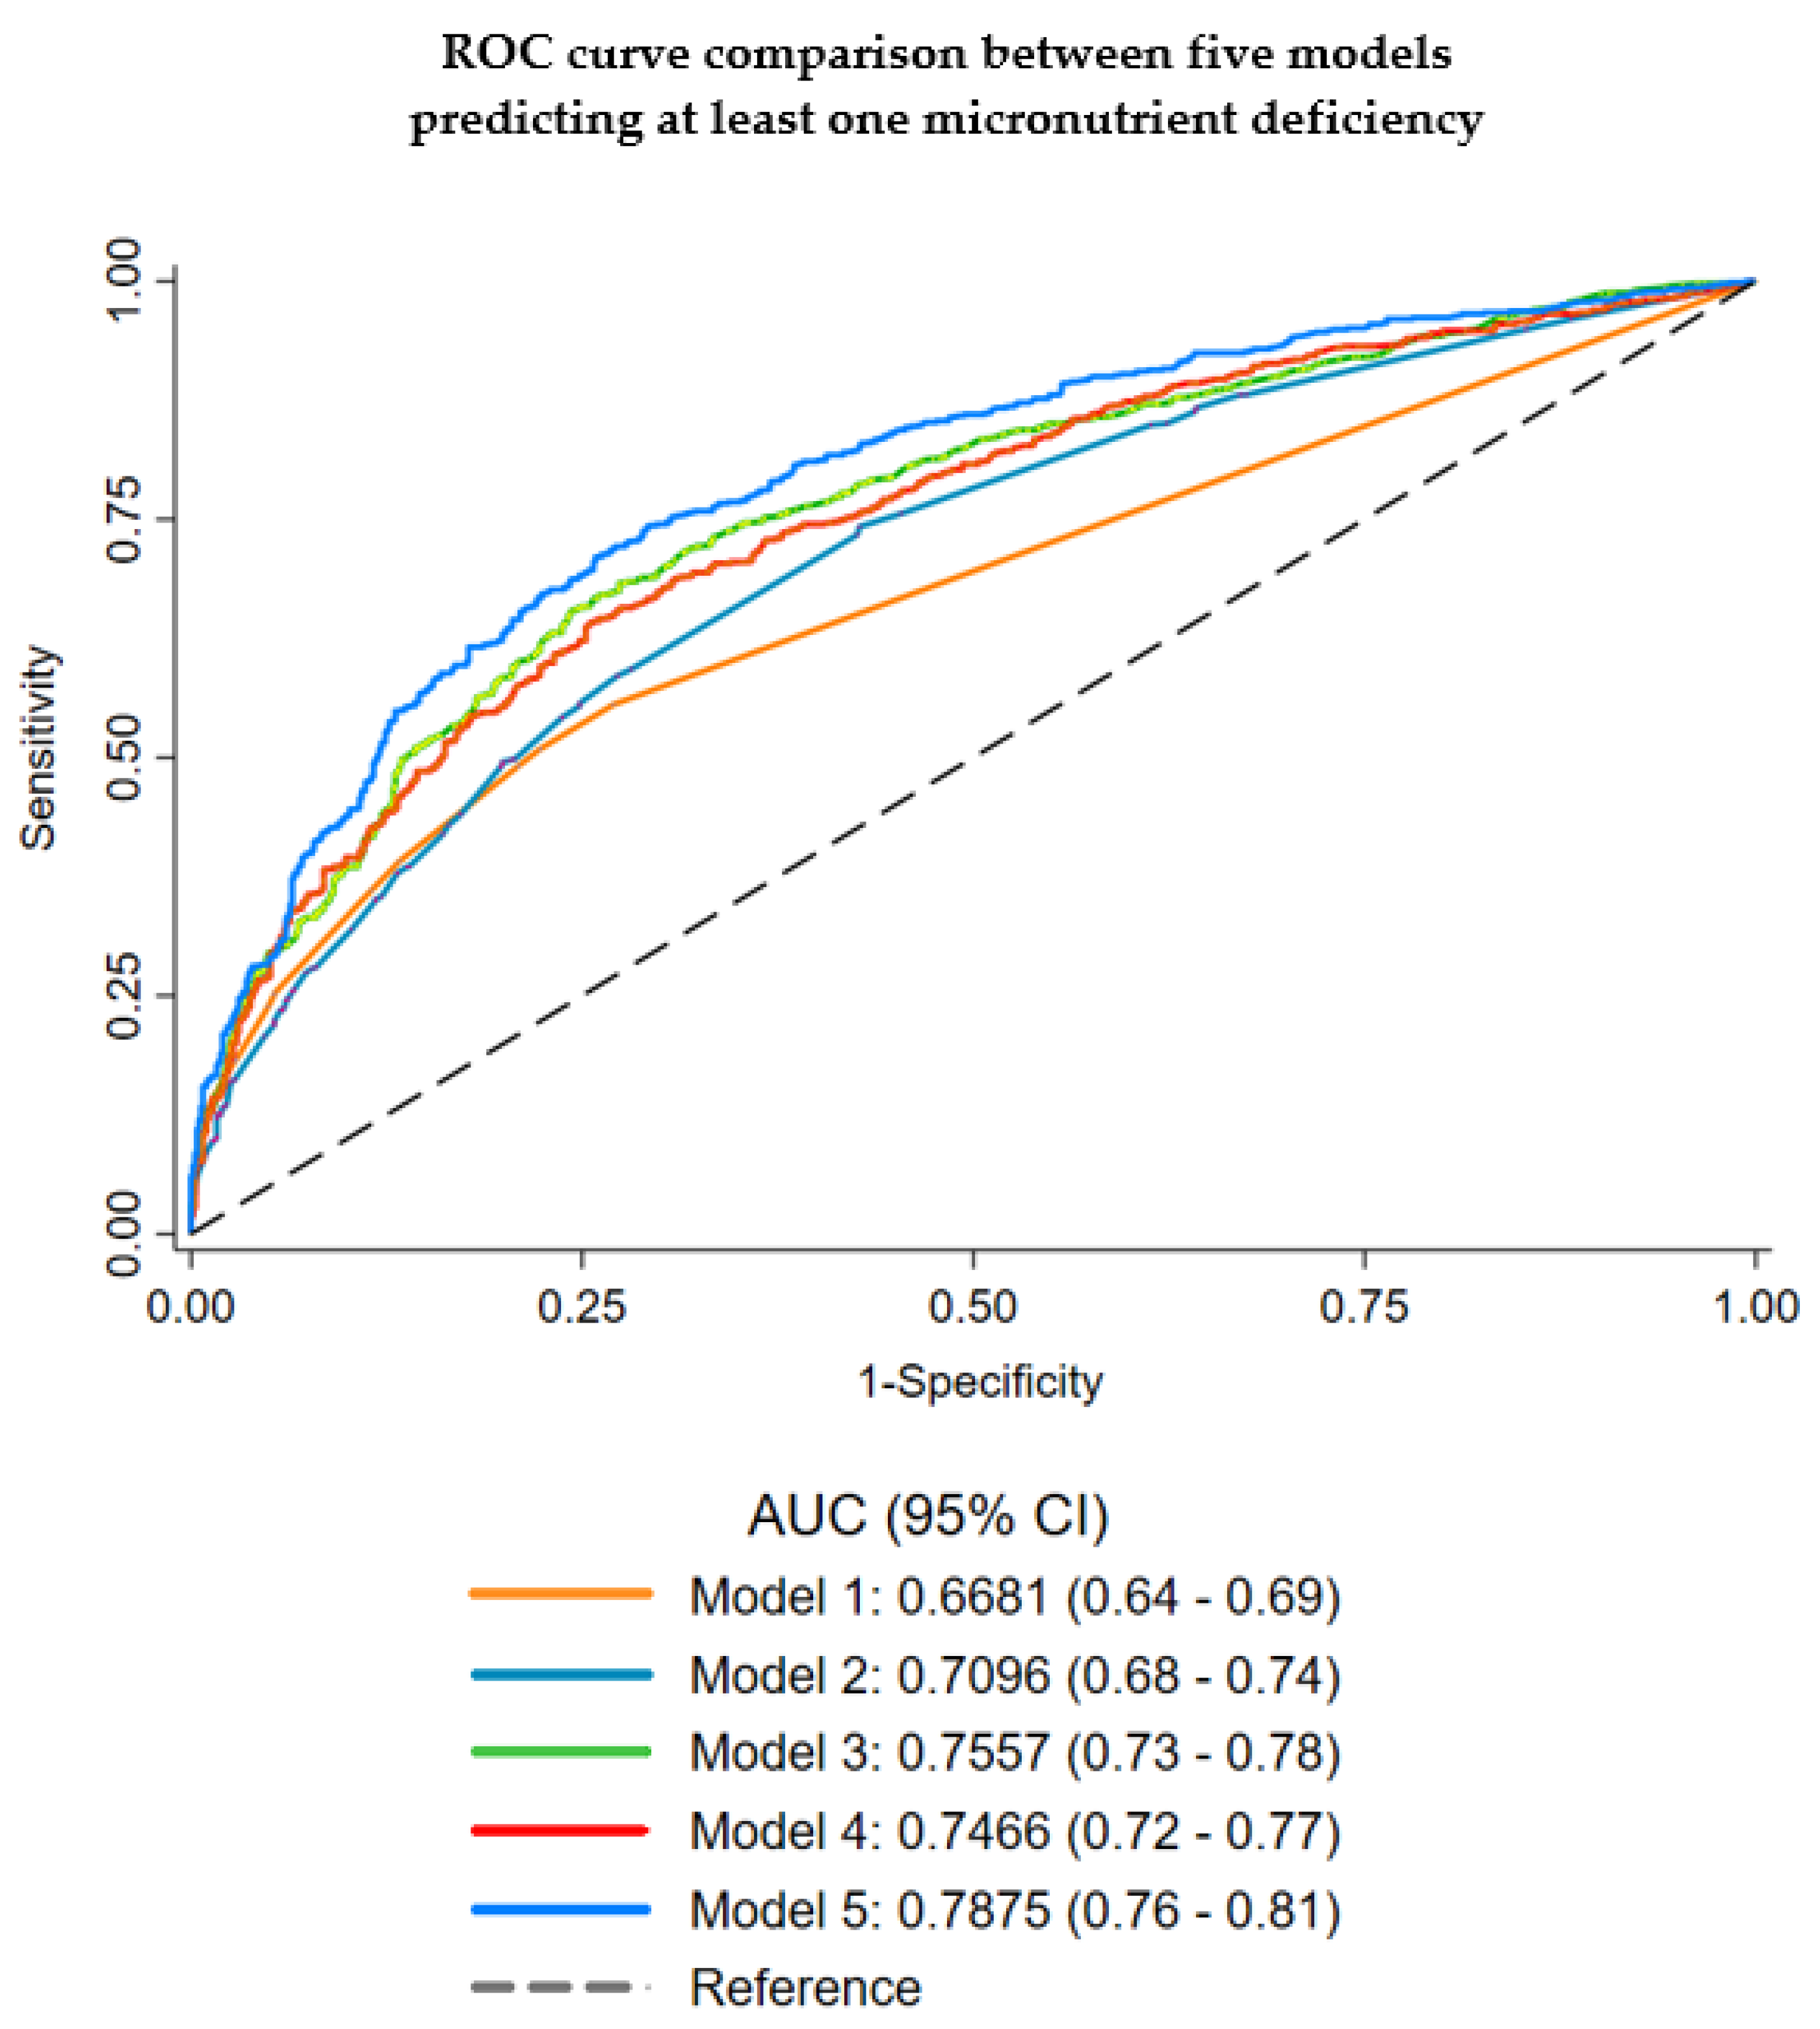
3.6. Prediction of a Poor Nutritional Status (Micronutrient Deficiency) (Stage 4)
4. Discussion
4.1. Limitations
4.2. Recommendations
5. Conclusions
Supplementary Materials
Author Contributions
Funding
Institutional Review Board Statement
Informed Consent Statement
Data Availability Statement
Acknowledgments
Conflicts of Interest
References
- Tournadre, A.; Vial, G.; Capel, F.; Soubrier, M.; Boirie, Y. Sarcopenia. Jt. Bone Spine 2019, 86, 309–314. [Google Scholar] [CrossRef]
- Cruz-Jentoft, A.J.; Sayer, A.A. Sarcopenia. Lancet 2019, 393, 2636–2646. [Google Scholar] [CrossRef]
- Lanham-New, S.A.; Webb, A.R.; Cashman, K.D.; Buttriss, J.L.; Fallowfield, J.L.; Masud, T.; Hewison, M.; Mathers, J.C.; Kiely, M.; Welch, A.A.; et al. Vitamin D and SARS-CoV-2 virus/COVID-19 disease. BMJ Nutr. Prev. Health 2020, 31, 106. [Google Scholar] [CrossRef]
- Hong, X.; Yan, J.; Xu, L.; Shen, S.; Zeng, X.; Chen, L. Relationship between nutritional status and frailty in hospitalized older patients. Clin. Interv. Aging 2019, 14, 105–111. [Google Scholar] [CrossRef] [PubMed] [Green Version]
- Lorenzo-López, L.; Maseda, A.; De Labra, C.; Regueiro-Folgueira, L.; Rodríguez-Villamil, J.L.; Millán-Calenti, J.C. Nutritional determinants of frailty in older adults: A systematic review. BMC Geriatr. 2017, 17, 1–13. [Google Scholar] [CrossRef] [PubMed] [Green Version]
- Bunn, D.; Hooper, L.; Welch, A. Dehydration and Malnutrition in Residential Care: Recommendations for Strategies for Improving Practice Derived from a Scoping Review of Existing Policies and Guidelines. Geriatrics 2018, 3, 77. [Google Scholar] [CrossRef] [PubMed] [Green Version]
- Söderström, L.; Rosenblad, A.; Adolfsson, E.T.; Bergkvist, L. Malnutrition is associated with increased mortality in older adults regardless of the cause of death. Br. J. Nutr. 2017, 117, 532–540. [Google Scholar] [CrossRef] [PubMed] [Green Version]
- Correia, M.I.T.; Waitzberg, D.L. The impact of malnutrition on morbidity, mortality, length of hospital stay and costs evaluated through a multivariate model analysis. Clin. Nutr. 2003, 22, 235–239. [Google Scholar] [CrossRef]
- British Association for Parenteral and Enteral Nutrition. Introduction to Malnutrition: What is the Size of the Problem in the UK? Last Updated 20 September 2018. Available online: https://www.bapen.org.uk/malnutrition-undernutrition/introduction-to-malnutrition?start=4 (accessed on 6 January 2020).
- Kaiser, M.J.; Bauer, J.M.; Ms, R.P.S.A.; Uter, W.; Guigoz, Y.; Cederholm, T.; Thomas, D.R.; Anthony, P.S.; Charlton, K.E.; Maggio, M.; et al. Frequency of malnutrition in older adults: A multinational perspective using the mini nutritional assessment. J. Am. Geriatr. Soc. 2010, 58, 1734–1738. [Google Scholar] [CrossRef] [PubMed]
- Russell, C.A.; Elia, M. Malnutrition in the UK: Where does it begin? Proc. Nutr. Soc. 2010, 69, 465–469. [Google Scholar] [CrossRef] [Green Version]
- Arvanitakis, M.; Vandewoude, M.; Perkisas, S.; Van Gossum, A. Undernutrition in community dwelling elderly. e-SPEN J. 2013, 8, e213–e215. [Google Scholar] [CrossRef]
- Ragubeer, R.; Jerrams, E. Prevalence of malnutrition in nursing and care homes in Walsall. In Proceedings of the Nutrition Society, Harrogate, UK, 2–3 November 2010; Volume 69. [Google Scholar]
- Stratton, R.; Smith, T.; Gabe, S. Managing Malnutrition to Improve Lives and Save Money. BAPEN (British Society of Enteral and Parenteral Nutrition). 2018. Available online: https://www.bapen.org.uk/pdfs/reports/mag/managing-malnutrition.pdf (accessed on 6 January 2020).
- Porter, K.; Hoey, L.; Hughes, C.F.; Ward, M.; McNulty, H. Causes, consequences and public health implications of low b-vitamin status in ageing. Nutrients 2016, 8, 725. [Google Scholar] [CrossRef] [Green Version]
- Montgomery, S.C.; Streit, S.M.; Beebe, M.L.; Maxwell, P.J., IV. Micronutrient needs of the elderly. Nutr. Clin. Pract. 2014, 29, 435–444. [Google Scholar] [CrossRef] [PubMed] [Green Version]
- Semba, R.D.; Bartali, B.; Zhou, J.; Blaum, C.; Ko, C.-W.; Fried, L.P. Low Serum Micronutrient Concentrations Predict Frailty Among Older Women Living in the Community. J. Gerontol. Ser. A Biol. Sci. Med. Sci. 2006, 61, 594–599. [Google Scholar] [CrossRef]
- Inzitari, M.; Doets, E.; Bartali, B.; Benetou, V.; Di Bari, M.; Visser, M.; Volpato, S.; Gambassi, G.; Topinkova, E.; De Groot, L.; et al. Nutrition in the age-related disablement process. J. Nutr. Health Aging 2011, 15, 599–604. [Google Scholar] [CrossRef] [PubMed] [Green Version]
- Lamers, Y.; O’Rourke, B.; Gilbert, L.R.; Keeling, C.; Matthews, D.E.; Stacpoole, P.W.; Gregory, J.F. Vitamin B-6 restriction tends to reduce the red blood cell glutathione synthesis rate without affecting red blood cell or plasma glutathione concentrations in healthy men and women. Am. J. Clin. Nutr. 2009, 90, 336–343. [Google Scholar] [CrossRef] [Green Version]
- Goyal, A.; Terry, M.B.; Siegel, A.B. Serum antioxidant nutrients, Vitamin A. and Mortality in U.S. Adults. Cancer Epidemiol. Biomark. Prev. 2013, 22, 2202–2211. [Google Scholar] [CrossRef] [Green Version]
- Van Dronkelaar, C.; Van Velzen, A.; Abdelrazek, M.; Van Der Steen, A.; Weijs, P.; Tieland, M. SUN-P297: The role of calcium, iron, magnesium, phosphorus, potassium, selenium, sodium, and zinc on muscle mass, muscle strength, and physical performance in older adults: A systematic review. Clin. Nutr. 2017, 36, S163. [Google Scholar] [CrossRef]
- Lewis, L.N.; Hayhoe, R.P.G.; Mulligan, A.A.; Luben, R.N.; Khaw, K.-T.; Welch, A.A. Lower dietary and circulating vitamin c in middle- and older-aged men and women are associated with lower estimated skeletal muscle mass. J. Nutr. 2020, 150, 2789–2798. [Google Scholar] [CrossRef] [PubMed]
- White, J.V.; Guenter, P.; Jensen, G.; Malone, A.; Schofield, M. Consensus statement of the Academy of Nutrition and Dietetics/American Society for Parenteral and Enteral Nutrition: Characteristics recommended for the identification and documentation of adult malnutrition (undernutrition). J. Acad. Nutr. Diet. 2012, 112, 730–738. [Google Scholar] [CrossRef] [PubMed]
- Vellas, B.; Guigoz, Y.; Garry, P.; Nourhashemi, F.; Bennahum, D.; Lauque, S.; Albarede, J. The Mini Nutritional Assessment (MNA) and its use in grading the nutritional state of elderly patients. Nutrition. 1999, 15, 116–122. [Google Scholar] [CrossRef]
- Baker, J.P.; Detsky, A.S.; Wesson, D.E.; Wolman, S.L.; Stewart, S.; Whitewell, J.; Langer, B.; Jeejeebhoy, K.N. Nutritional assessment: A comparison of clinical judgment and objective measurements. N. Engl. J. Med. 1982, 306, 969–972. [Google Scholar] [CrossRef] [PubMed]
- Kondrup, J.; Rasmussen, H.H.; Hamberg, O.; Stanga, Z. Nutritional risk screening (NRS 2002): A new method based on an analysis of controlled clinical trials. Clin. Nutr. 2003, 22, 321–336. [Google Scholar] [CrossRef]
- Nago, N.; Ishikawa, S.; Goto, T.; Kayaba, K. Low cholesterol is associated with mortality from stroke, heart disease, and cancer: The Jichi Medical School Cohort Study. J. Epidemiol. 2011, 21, 67–74. [Google Scholar] [CrossRef] [PubMed] [Green Version]
- Carson, A.P.; Fox, C.S.; McGuire, D.K.; Levitan, E.B.; Laclaustra, M.; Mann, D.M.; Muntner, P. Low Hemoglobin A1c and Risk of All-cause mortality among us adults without diabetes. Circ. Cardiovasc. Qual. Outcomes 2010, 3, 661–667. [Google Scholar] [CrossRef] [PubMed] [Green Version]
- Matusushita, K.; van der Velde, M.; Astor, B.C.; Woodward, M.; Levey, A.S.; de Jong, P.E.; Coresh, J.; Gasevoort, R.T. Association of estimated glomerular filtration rate and albuminuria with all-cause and cardiovascular mortality in general population cohorts: A collaborative meta-analysis. Lancet 2010, 375, 2073–2081. [Google Scholar]
- Harding, A.-H.; Wareham, N.J.; Bingham, S.A.; Khaw, K.; Luben, R.; Welch, A.; Forouhi, N.G. Plasma Vitamin C level, fruit and vegetable consumption, and the risk of new-onset type 2 diabetes mellitusthe european prospective investigation of cancer–norfolk prospective study. Arch. Intern. Med. 2008, 168, 1493–1499. [Google Scholar] [CrossRef] [Green Version]
- Bingham, S.; Luben, R.; Welch, A.; Low, Y.L.; Khaw, K.T.; Wareham, N.; Day, N. Associations between dietary methods and biomarkers, and between fruits and vegetables and risk of ischaemic heart disease, in the EPIC Norfolk Cohort Study. Int. J. Epidemiol. 2008, 37, 978–987. [Google Scholar] [CrossRef] [Green Version]
- Zhang, Z.; Pereira, S.L.; Luo, M.; Matheson, E.M. Evaluation of blood biomarkers associated with risk of malnutrition in older adults: A systematic review and meta-Analysis. Nutrients 2017, 9, 829. [Google Scholar] [CrossRef] [PubMed]
- Fávaro-Moreira, N.C.; Krausch-Hofmann, S.; Matthys, C.; Vereecken, C.; Vanhauwaert, E.; Declercq, A.; Bekkering, G.E.; Duyck, J. Risk Factors for malnutrition in older adults: A systematic review of the literature based on longitudinal data. Adv. Nutr. 2016, 7, 507–522. [Google Scholar] [CrossRef]
- Bates, B.; Lennox, A.; Prentice, A.; Bates, C.; Swan, G. National Diet and Nutrition Survey: Results from Years 1, 2, 3 and 4 (Combined) of the Rolling Programme (2008/2009–2011/2012): A Survey Carried out on behalf of Public Health England and the Food Standards Agency; Public Health England: London, UK, 2014. [Google Scholar]
- Bates, B.; Lennox, A.; Prentice, A.; Bates, C.; Swan, G. Diet and Nutrition Survey Results from Years 5 and 6 (Combined) of the Rolling Programme (2012/2013–2013/2014); Public Health England: London, UK, 2016. [Google Scholar]
- Bates, B.; Lennox, A.; Prentice, A.; Bates, C.; Swan, G. National Diet and Nutrition Survey Results from Years 7–8 (Combined) of the Rolling Programme (2014/2015–2015/2016); Public Health England: London, UK, 2018. [Google Scholar]
- Bates, B.; Lennox, A.; Prentice, A.; Bates, C.; Swan, G. National Diet and Nutrition Survey, Years 1 to 9 of the Rolling Programme (2008/2009–2016/2017): Time Trend and Income Analyses; Public Health England: London, UK, 2019. [Google Scholar]
- Masnoon, N.; Shakib, S.; Kalisch-Ellett, L.; Caughey, G.E. What is polypharmacy? A systematic review of definitions. BMC Geriatr. 2017, 17, 230. [Google Scholar] [CrossRef] [PubMed] [Green Version]
- Lennox, A.; Fitt, E.; Whitton, C.; Roberts, C.; Prynne, C. Appendix A National Diet and Nutrition Survey: Results from Years 1–4 (Combined) of the Rolling Programme (2008/2009–2011/2012). Dietary Data Collection and Editing; Public Health England: London, UK, 2014. [Google Scholar]
- Lennox, A.; Fitt, E.; Whitton, C.; Roberts, C.; Prynne, C. Appendix A National Diet and Nutrition Survey: Results from Years 5–6 (Combined) of the Rolling Programme (2012/2013–2013/2014). Dietary Data Collection and Editing; Public Health England: London, UK, 2016. [Google Scholar]
- Lennox, A.; Fitt, E.; Whitton, C.; Roberts, C.; Prynne, C. Appendix A National Diet and Nutrition Survey: Results from Years 7–8 (Combined) of the Rolling Programme (2014/2015–2015/2016). Dietary Data Collection and Editing; Public Health England: London, UK, 2018. [Google Scholar]
- Lennox, A.; Fitt, E.; Whitton, C.; Roberts, C.; Prynne, C. Appendix A National Diet and Nutrition Survey: Results from Years 1–9 (Combined) of the Rolling Programme (2008/2009–2016/2017). Dietary Data Collection and Editing; Public Health England: London, UK, 2019. [Google Scholar]
- Levey, A.S.; Stevens, L.A.; Schmid, C.H.; Zhang, Y.L.; Castro, A.F., 3rd; Feldman, H.I.; Kusek, J.W.; Eggers, P.; Van Lente, F.; Greene, T.; et al. A new equation to estimate glomerular filtration rate. Ann. Intern. Med. 2009, 150, 604–612. [Google Scholar] [CrossRef]
- Rosairo, M.D. ; NNUH (Norfolk & Norwich University Hospital) Clinical Biochemistry. User Manual; Norfolk & Norwich University Hospital: London, UK, 2019; pp. 20–42. [Google Scholar]
- Gavran, L.; Pavlović, J.; Račić, M.; Ivković, N.; Bunc, K.T. Evaluation of biochemical markers effectiveness in elderly malnutrition assessment. Med. Glas. 2019, 16. [Google Scholar] [CrossRef]
- Omran, M.; Morley, J.E. Assessment of protein energy malnutrition in older persons, part II: Laboratory evaluation. Nutrients 2000, 16, 131–140. [Google Scholar] [CrossRef]
- NICE (National Institute for Health and Clinical Excellence. Chronic Kidney Disease (Partial Update): Early Identification and Management of Chronic Kidney Disease in Adults in Primary and Secondary Care (CG182). 2014. Available online: https://www.nice.org.uk/guidance/cg182/evidence/full-guideline-pdf-191905165 (accessed on 10 December 2019).
- SACN (Scientific Advisory Committee on Nutrition). Vitamin D and Health. 2016. Available online: https://assets.publishing.service.gov.uk/government/uploads/system/uploads/attachment_data/file/537616/SACN_Vitamin_D_and_Health_report.pdf (accessed on 10 December 2019).
- Abdelhafiz, A.H.; Sinclair, A.J. Low HbA1c and increased mortality risk-is frailty a confounding factor? Aging Dis. 2015, 6, 262–270. [Google Scholar] [CrossRef] [PubMed] [Green Version]
- Bardon, L.A.; Streicher, M.; Corish, C.A.; Clarke, M.; Power, L.C.; Kenny, R.A.; O’Connor, D.M.; Laird, E.; O’Connor, E.M.; Visser, M.; et al. Predictors of Incident Malnutrition in older irish adults from the irish longitudinal study on ageing cohort—a manuel study. J. Gerontol. Ser. A Biol. Sci. Med. Sci. 2018, 75, 249–256. [Google Scholar] [CrossRef] [PubMed]
- O’Keeffe, M.; Kelly, M.; O’Herlihy, E.; O’Toole, P.; Kearney, P.; Timmons, S.; O’Shea, E.; Stanton, C.; Hickson, M.; Rolland, Y.; et al. Potentially modifiable determinants of malnutrition in older adults: A systematic review. Clin. Nutr. 2019, 38, 2477–2498. [Google Scholar] [CrossRef] [Green Version]
- van der Pols-Vijlbrief, R.; Wijnhoven, H.A.; Schaap, L.A.; Terwee, C.B.; Visser, M. Determinants of protein–energy malnutrition in community-dwelling older adults: A systematic review of observational studies. Ageing Res. Rev. 2014, 18, 112–131. [Google Scholar] [CrossRef]
- Cederholm, T.; Jensen, G.; Correia, M.; Gonzalez, M.C.; Fukushima, R.; Higashiguchi, T.; Baptista, G.; Barazzoni, R.; Blaauw, R.; Coats, A.; et al. GLIM criteria for the diagnosis of malnutrition—A consensus report from the global clinical nutrition community. J. Cachex Sarcopenia Muscle 2019, 10, 207–217. [Google Scholar] [CrossRef] [PubMed] [Green Version]
- The Panel on Dietary Reference Values of the Committee on Medical Aspects of Food Policy. Dietary Reference Values for Food Energy and Nutrients for the United Kingdom. 1991. Available online: https://assets.publishing.service.gov.uk/government/uploads/system/uploads/attachment_data/file/743786/Dietary_Reference_Values_for_Food_Energy_and_Nutrients_for_the_United_Kingdom__1991_.pdf (accessed on 10 December 2019).
- SACN (Scientific Advisory Committee on Nutrition). Dietary Reference Values for Energy. 2011. Available online: https://assets.publishing.service.gov.uk/government/uploads/system/uploads/attachment_data/file/339317/SACN_Dietary_Reference_Values_for_Energy.pdf (accessed on 10 December 2019).
- Public Health England. Eatwell Guide. 2016. Available online: https://assets.publishing.service.gov.uk/government/uploads/system/uploads/attachment_data/file/528193/Eatwell_guide_colour.pdf (accessed on 10 December 2019).
- EFSA. Panel on Dietetic Products, Nutrition, and Allergies (NDA). Scientific opinion on dietary reference values for water. EFSA J. 2010, 8, 1459. [Google Scholar]
- EFSA. Panel on Dietetic Products, Nutrition, and Allergies (NDA). Dietary Reference Values for vitamin B6. EFSA J. 2016, 14, e04485. [Google Scholar]
- EFSA. Panel on Dietetic Products, Nutrition, and Allergies (NDA). Scientific opinion on dietary reference values for selenium. EFSA J. 2014, 12, 3846. [Google Scholar] [CrossRef]
- De Benoist, B. Conclusions of a WHO Technical Consultation on folate and vitamin B12 deficiencies. Food Nutr. Bull. 2008, 29 (Suppl. 2), S238–S244. [Google Scholar] [CrossRef]
- Schleicher, R.L.; Carroll, M.D.; Ford, E.S.; Lacher, D.A. Serum vitamin C and the prevalence of vitamin C deficiency in the United States: 2003–2004 National Health and Nutrition Examination Survey (NHANES). Am. J. Clin. Nutr. 2009, 90, 1252–1263. [Google Scholar] [CrossRef]
- McCall, S.J.; Clark, A.B.; Luben, R.N.; Wareham, N.J.; Khaw, K.-T.; Myint, P.K. Plasma Vitamin C Levels: Risk Factors for deficiency and association with self-reported functional health in the european prospective investigation into cancer-Norfolk. Nutrients 2019, 11, 1552. [Google Scholar] [CrossRef] [PubMed] [Green Version]
- McKeown, N.M.; Day, N.E.; Welch, A.A.; Runswick, S.A.; Luben, R.N.; Mulligan, A.A.; McTaggart, A.; Bingham, S.A. Use of biological markers to validate self-reported dietary intake in a random sample of the European Prospective Investigation into Cancer United Kingdom Norfolk cohort. Am. J. Clin. Nutr. 2001, 74, 188–196. [Google Scholar] [CrossRef]
- England Office for National Statistics and Wales Census. Ethnic Group, Local Authorities in the United Kingdom; Office for National Statistics: London, UK, 2011. [Google Scholar]
- Sheean, P.; Farrar, I.C.; Sulo, S.; Partridge, J.; Schiffer, L.; FitzGibbon, M. Nutrition risk among an ethnically diverse sample of community-dwelling older adults. Public Health Nutr. 2019, 22, 894–902. [Google Scholar] [CrossRef] [PubMed] [Green Version]
- Locher, J.L.; Ritchie, C.S.; Roth, D.L.; Baker, P.S.; Bodner, E.V.; Allman, R.M. Social isolation, support, and capital and nutritional risk in an older sample: Ethnic and gender differences. Soc. Sci. Med. 2005, 60, 747–761. [Google Scholar] [CrossRef] [PubMed] [Green Version]
- Bharadwaj, S.; Ginoya, S.; Tandon, P.; Gohel, T.D.; Guirguis, J.; Vallabh, H.; Jevenn, A.; Hanouneh, I. Malnutrition: Laboratory markers vs nutritional assessment. Gastroenterol. Rep. 2016, 4, 272–280. [Google Scholar] [CrossRef] [PubMed] [Green Version]
- Margetts, B.M.; Thompson, R.L.; Elia, M.; Jackson, A.A. Prevalence of risk of undernutrition is associated with poor health status in older people in the UK. Eur. J. Clin. Nutr. 2003, 57, 69–74. [Google Scholar] [CrossRef] [PubMed] [Green Version]
- McNeill, G.; Vyvyan, J.; Peace, H.; McKie, L.; Seymour, G.; Hendry, J.; MacPherson, I. Predictors of micronutrient status in men and women over 75 years old living in the community. Br. J. Nutr. 2002, 88, 555–561. [Google Scholar] [CrossRef] [PubMed]
- Tomkins, A. Assessing micronutrient status in the presence of inflammation. J. Nutr. 2003, 133, 1649S–1655S. [Google Scholar] [CrossRef]
- Thurnham, D.I.; Northrop-Clewes, C.A. Inflammation and biomarkers of micronutrient status. Curr. Opin. Clin. Nutr. Metab. Care 2016, 19, 458–463. [Google Scholar] [CrossRef] [PubMed]
- Bird, J.K.; Murphy, R.A.; Ciappio, E.D.; McBurney, M.I. Risk of deficiency in multiple concurrent micronutrients in children and adults in the United States. Nutrients 2017, 9, 655. [Google Scholar] [CrossRef] [PubMed] [Green Version]


| Characteristic | No Micronutrient Deficiencies (n = 789) * | At Least One Micronutrient Deficiency (n = 729) * | p-Value 1 |
|---|---|---|---|
| Sex, women | 462 (58.6) | 406 (55.7) | 0.260 |
| Age group | <0.001 | ||
| 50–59 years | 353 (44.7) | 223 (30.6) | |
| 60–69 years | 267 (33.8) | 255 (35.0) | |
| ≥70 years | 169 (21.4) | 251 (34.4) | |
| Ethnic group, white British | 759 (96.2) | 708 (97.1) | 0.319 |
| Region | <0.001 | ||
| England—North | 153 (19.4) | 140 (19.2) | |
| England—Central/Midlands | 102 (12.9) | 75 (10.3) | |
| England—South | 271 (34.4) | 184 (25.2) | |
| Scotland | 113 (14.3) | 128 (17.6) | |
| Wales | 96 (12.2) | 151 (20.7) | |
| Northern Ireland | 54 (6.8) | 51 (7.0) | |
| Qualification | <0.001 | ||
| Secondary education or less | 336 (42.6) | 415 (56.9) | |
| Further education | 105 (13.3) | 91 (12.5) | |
| Higher education | 309 (39.2) | 172 (23.6) | |
| Other | 39 (4.9) | 51 (7.0) | |
| Marital status | <0.001 | ||
| Single, never married | 81 (10.3) | 57 (7.8) | |
| Married or partnership | 495 (62.7) | 392 (53.8) | |
| Divorced or widowed | 213 (27.0) | 280 (38.4) | |
| Smoking status (cigarettes) | <0.001 | ||
| Never smoker | 483 (61.2) | 349 (47.9) | |
| Former smoker | 251 (31.8) | 234 (32.1) | |
| Current smoker | 55 (7.0) | 146 (20.0) | |
| Self-assessed general health | <0.001 | ||
| Good | 654 (82.9) | 466 (63.9) | |
| Fair | 122 (15.5) | 204 (28.0) | |
| Bad | 13 (1.7) | 59 (8.1) | |
| Has longstanding illness, yes | 354 (44.9) | 441 (60.5) | <0.001 |
| Number of medicines | <0.001 | ||
| No medication | 290 (36.8) | 161 (22.1) | |
| 1–4 medicines | 389 (49.3) | 319 (43.8) | |
| 5 or more medicines | 110 (13.9) | 249 (34.2) | |
| Any dietary supplement use last year, yes | 386 (48.9) | 229 (31.4) | <0.001 |
| Any of own teeth, yes | 722 (91.5) | 590 (80.9) | <0.001 |
| Appetite | <0.001 | ||
| Good | 342 (43.4) | 233 (32.0) | |
| Average | 132 (16.7) | 134 (18.4) | |
| Poor | 7 (0.9) | 42 (5.8) | |
| N/A to survey year | 308 (39.0) | 729 (43.9) | |
| BMI (kg/m2), mean ± SD 2 | 27.7 ± 4.6 | 28.9 ± 5.5 | <0.001 |
| BMI (kg/m2) | <0.001 | ||
| ≥20 (age < 70 years) or ≥22 (age ≥ 70 years) | 739 (93.7) | 636 (87.2) | |
| <20 (age < 70 years) or <22 (age ≥ 70 years) | 23 (2.9) | 30 (4.1) | |
| Unknown | 27 (3.4) | 63 (8.6) | |
| Protein intake (g) | <0.001 | ||
| ≥RNI | 653 (82.8) | 451 (61.9) | |
| <RNI | 115 (14.6) | 227 (31.1) | |
| Unknown | 21 (2.7) | 51 (7.0) | |
| Energy intake (kcal) | 0.198 | ||
| ≥EAR | 128 (16.2) | 101 (13.9) | |
| <EAR | 661 (83.8) | 628 (86.2) | |
| Protein intake (g) and energy intake (kcal) | <0.001 | ||
| ≥RNI and ≥EAR | 126 (16.0) | 91 (12.5) | |
| <RNI and <EAR | 115 (14.6) | 223 (30.6) | |
| Either <RNI or <EAR | 527 (66.8) | 364 (49.9) | |
| Unknown | 21 (2.7) | 51 (7.0) | |
| Fruit and vegetable intake 3 | |||
| <5 portions (80 g)/day | 430 (54.5) | 514 (70.5) | <0.001 |
| <2 portions (80 g)/day | 66 (8.4) | 156 (21.4) | <0.001 |
| Fluid intake 3 | |||
| <1600 mL/day (women) and <2000 mL/day (men) | 438 (55.5) | 470 (64.5) | <0.001 |
| <1250 mL/day | 174 (22.1) | 187 (25.7) | 0.100 |
| <750 mL/day | 21 (2.7) | 23 (3.2) | 0.567 |
| Micronutrient Deficiency Biomarkers | Cut-Off Point Inadequate Status | Sex | n Total | Mean ± SD | n (%) Inadequate Status |
|---|---|---|---|---|---|
| Vitamin B6 PLP (nmol/L) 2 | <30 [58] | Total | 1518 | 52.0 ± 42.7 | 454 (29.9) |
| Men | 650 | 48.9 ± 32.5 | 191 (29.4) | ||
| Women | 868 | 54.3 ± 48.8 | 263 (30.3) | ||
| Selenium (µmol/L) | <0.9 [59] | Total | 1518 | 1.06 ± 0.24 | 338 (22.3) |
| Men | 650 | 1.04 ± 0.22 | 151 (23.2) | ||
| Women | 868 | 1.07 ± 0.25 | 187 (21.5) | ||
| Zinc (µmol/L) | <11 [44] | Total | 1518 | 13.46 ± 2.55 | 177 (11.7) |
| Men | 650 | 13.60 ± 2.57 | 77(11.8) | ||
| Women | 868 | 13.36 ± 2.53 | 100 (11.5) | ||
| Vitamin B12 (pmol/L) | <150 [60] | Total | 1518 | 271.5 ± 103.0 | 76 (5.0) |
| Men | 650 | 254.7 ± 87.1 | 39 (6.0) | ||
| Women | 868 | 284.1 ± 111.8 | 37 (4.3) | ||
| Vitamin C (µmol/L) | <11.4 [61,62] | Total | 1518 | 50.1 ± 21.8 | 56 (3.7) |
| Men | 650 | 45.2 ± 20.1 | 28 (4.3) | ||
| Women | 868 | 53.8 ± 22.4 | 28 (3.2) |
| Routine Biochemical Diagnostic Test | At Risk Cut-Off Point | Sex | n Valid Result 2 | Mean ± SD | n (%) at Risk | n Valid Result 3 | Mean ± SD No Deficiencies (n = 789) | n Valid Result 3 | Mean ± SD ≥ 1 Deficiency (n = 729) | p-Value 4 |
|---|---|---|---|---|---|---|---|---|---|---|
| Total Cholesterol (mmol/L) | <4.1 [45,46] | Total | 1490 | 5.28 ± 1.17 | 223 (15.0) | 776 | 5.46 ± 1.09 | 714 | 5.08 ± 1.22 | <0.001 * |
| Men | 638 | 4.89 ± 1.11 | 152 (23.8) | |||||||
| Women | 852 | 5.57 ± 1.13 | 71 (8.3) | |||||||
| Triglycerides (mmol/L) 1 | <0.5 [44] | Total | 1483 | 1.37 ± 0.81 | 14 (0.9) | 774 | 1.30 ± 0.70 | 709 | 1.44 ± 0.92 | 0.001 * |
| Men | 637 | 1.45 ± 0.93 | 4 (0.6) | |||||||
| Women | 846 | 1.31 ± 0.71 | 10 (1.2) | |||||||
| LDL (mmol/L) | <2.2 [32] | Total | 1472 | 3.20 ± 1.04 | 255 (17.3) | 769 | 3.34 ± 0.97 | 703 | 3.05 ± 1.08 | <0.001 * |
| Men | 631 | 2.98 ± 1.00 | 151 (23.9) | |||||||
| Women | 841 | 3.37 ± 1.03 | 104 (12.4) | |||||||
| HDL (mmol/L) | <1.0 [44] <1.2 [44] | Total | 1490 | 1.49 ± 0.47 | 277 (18.6) | 324 452 | 1.35 ± 0.38 1.71 ± 0.47 | 314 400 | 1.25 ± 0.38 1.55 ± 0.46 | 0.001 * <0.001 * |
| Men | 638 | 1.30 ± 0.38 | 131 (20.5) | |||||||
| Women | 852 | 1.63 ± 0.47 | 146 (17.1) | |||||||
| Haemoglobin (g/dL) | <13 [44] <12 [44] | Total | 1436 | 13.8 ± 1.3 | 131 (9.1) | 313 438 | 14.8 ± 1.1 13.4 ± 0.9 | 304 381 | 14.3 ± 1.4 13.1 ± 1.2 | <0.001 * 0.006 * |
| Men | 617 | 14.6 ± 1.3 | 55 (8.9) | |||||||
| Women | 819 | 13.3 ± 1.1 | 76 (9.3) | |||||||
| Haematocrit (%) | <40 [44] <36 [44] | Total | 1436 | 42.0 ± 4.2 | 164 (11.4) | 313 438 | 44.8 ± 3.5 40.5 ± 3.0 | 304 381 | 43.3 ± 4.4 40.2 ± 4.0 | <0.001 * 0.256 |
| Men | 617 | 44.1 ± 4.0 | 85 (13.8) | |||||||
| Women | 819 | 40.4 ± 3.5 | 79 (9.6) | |||||||
| Mean Cell Volume (fL) | <83 or >101 [44] | Total | 1436 | 93.8 ± 5.6 | 147 (10.2) | 751 | 93.8 ± 5.0 | 685 | 93.9 ± 6.1 | 0.620 |
| Men | 617 | 94.3 ± 5.8 | 77 (12.5) | |||||||
| Women | 819 | 93.5 ± 5.4 | 70 (8.5) | |||||||
| Ferritin (µg/L) 1 | <23 [44] | Total | 1512 | 118.1 ± 126.4 | 139 (9.2) | 787 | 120.9 ± 115.2 | 725 | 115.1 ± 137.6 | 0.372 |
| Men | 649 | 153.2 ± 152.5 | 36 (5.5) | |||||||
| Women | 863 | 91.7 ± 94.4 | 103 (11.9) | |||||||
| HbA1c (%) 1 | <5.0 [28,49] | Total | 1429 | 5.8 ± 0.8 | 34 (2.4) | 739 | 5.7 ± 0.7 | 690 | 5.9 ± 0.9 | <0.001 * |
| Men | 609 | 5.9 ± 0.9 | 13 (2.1) | |||||||
| Women | 820 | 5.8 ± 0.6 | 21 (2.6) | |||||||
| Lymphocyte Count (109/L) | <1.0 [44] | Total | 1337 | 1.92 ± 0.69 | 69 (5.2) | 707 | 1.94 ± 0.69 | 630 | 1.91 ± 0.69 | 0.499 |
| Men | 568 | 1.85 ± 0.63 | 34 (6.0) | |||||||
| Women | 769 | 1.98 ± 0.73 | 35 (4.6) | |||||||
| White Blood Cell Count (109/L) | <4.0 [44] | Total | 1435 | 6.32 ± 2.28 | 59 (4.1) | 751 | 6.04 ± 2.53 | 684 | 6.63 ± 1.93 | <0.001 * |
| Men | 616 | 6.41 ± 1.67 | 16 (2.6) | |||||||
| Women | 819 | 6.26 ± 2.65 | 43 (5.3) | |||||||
| CRP (mg/L) 1 | >10 [44] | Total | 1300 | 4.44 ± 6.63 | 100 (7.7) | 654 | 3.39 ± 5.29 | 646 | 5.50 ± 7.61 | <0.001 * |
| Men | 552 | 3.94 ± 5.63 | 32 (5.8) | |||||||
| Women | 748 | 4.80 ± 7.26 | 68 (9.1) | |||||||
| eGFR (mL/min/1.73 m2) | <60 [47] | Total | 1505 | 76.6 ± 16.9 | 241 (16.0) | 785 | 78.5 ± 15.0 | 720 | 74.4 ± 18.6 | <0.001 * |
| Men | 646 | 76.7 ± 16.3 | 91 (14.1) | |||||||
| Women | 859 | 76.5 ± 17.3 | 150 (17.5) | |||||||
| Creatinine (µmol/L) | <59 [44] <45 [44] | Total | 1505 | 82.9 ± 24.7 | 14 (0.9) | 326 459 | 91.5 ± 14.6 73.8 ± 27.1 | 320 400 | 95.7 ± 25.1 76.2 ± 21.3 | 0.010 * 0.148 |
| Men | 646 | 93.6 ± 20.6 | 6 (0.9) | |||||||
| Women | 859 | 74.9 ± 24.6 | 8 (0.9) | |||||||
| 25-Hydroxy Vitamin D (nmol/L) | <25 [48] | Total | 1481 | 47.8 ± 20.4 | 200 (13.5) | 773 | 52.1 ± 19.9 | 708 | 43.1 ± 19.9 | <0.001 * |
| Men | 632 | 48.2 ± 19.9 | 77 (12.2) | |||||||
| Women | 849 | 47.5 ± 20.8 | 123 (14.5) |
| Low Concentrations of Routine Biochemical Diagnostic Tests | Univariate Analysis ≥ 1 Micronutrient Deficiency vs. No Micronutrient Deficiencies | Multivariable Analysis ≥ 1 Micronutrient Deficiency vs. No Micronutrient Deficiencies | ||||
|---|---|---|---|---|---|---|
| Crude OR (95% CI) | p-Value | Adjusted 3 OR (95% CI) | p-Value | Adjusted 3 OR (95% CI) | p-Value | |
| Total Cholesterol < 4.1 mmol/L | 2.48 (1.84–3.35) | <0.001 * | 2.29 (1.66–3.15) | <0.001 * | 2.03 (1.44–2.88) | <0.001 * |
| Triglycerides < 0.5 mmol/L | 0.81 (0.28–2.35) | 0.698 | 1.05 (0.34–3.20) | 0.938 | 1.14 (0.34–3.86) | 0.832 |
| LDL < 2.2 mmol/L | 2.13 (1.62–2.82) | <0.001 * | 1.84 (1.37–2.48) | <0.001 * | - 4 | - |
| HDL < 1.0 mmol/L (men) and < 1.2 mmol/L (women) | 1.71 (1.31–2.22) | <0.001 * | 1.56 (1.17–2.07) | 0.002 * | 1.17 (0.85–1.60) | 0.332 |
| Haemoglobin < 13 g/dL (men) and < 12 g/dL (women) | 4.26 (2.78–6.53) | <0.001 * | 4.24 (2.72–6.61) | <0.001 * | 2.71 (1.68–4.37) | <0.001 * |
| Haematocrit < 40% (men) and < 36% (women) | 2.74 (1.93–3.88) | <0.001 * | 2.65 (1.83–3.82) | <0.001 * | - 4 | - |
| Mean Cell Volume < 83 fL or > 10 1 fL | 1.60 (1.13–2.25) | 0.008 * | 1.43 (0.99–2.06) | 0.058 | 1.17 (0.78–1.75) | 0.456 |
| Ferritin < 23 µg/L | 2.06 (1.43–2.95) | <0.001 * | 2.59 (1.76–3.82) | <0.001 * | 2.25 (1.49–3.41) | <0.001 * |
| HbA1c < 5.0% | 1.77 (0.88–3.56) | 0.109 | 2.49 (1.20–5.19) | 0.015 * | 2.97 (1.38–6.40) | 0.006 * |
| Lymphocyte Count < 1.0 × 10⁹/L | 1.34 (0.83–2.18) | 0.232 | 1.30 (0.78–2.17) | 0.322 | 0.86 (0.48–1.55) | 0.611 |
| White Blood Cell Count < 4.0 × 10⁹/L | 0.91 (0.54–1.53) | 0.723 | 1.14 (0.65–1.98) | 0.650 | 1.11 (0.60–2.05) | 0.738 |
| CRP > 10 mg/L | 5.07 (3.04–8.44) | <0.001 * | 5.02 (2.96–8.53) | <0.001 * | 5.18 (3.00–8.95) | <0.001 * |
| eGFR < 60 mL/min/1.73 m2 | 2.30 (1.73–3.07) | <0.001 * | 1.67 (1.21–2.31) | 0.002 * | 1.45 (1.02–2.05) | 0.037 * |
| Creatinine < 59 µmol/L (men) and <45 µmol/L (women) | 14.31 (1.87–110) | 0.010 * | 11.85 (1.50–93.9) | 0.019 * | - 4 | - |
| 25-Hydroxy Vitamin D < 25 nmol/L | 3.31 (2.38–4.60) | <0.001 * | 2.94 (2.07–4.16) | <0.001 * | 2.93 (2.04–4.22) | <0.001 * |
| Low Concentrations of Routine Biochemical Diagnostic Tests | Protein Intake (g) < RNI (UK DRV [54]) | Energy Intake (kcal) < EAR (SACN [55]) | Fruit and Vegetable Intake < 2 Portions/Day (MNA) | Fluid Intake < 2000 mL/Day (men) and <1600 mL/Day (Women) (EFSA [57]) | BMI < 20 kg/m2 (age < 70 years) and <22 kg/m2 (Age ≥ 70 years) (GLIM [53]) | |||||
|---|---|---|---|---|---|---|---|---|---|---|
| Crude OR (95% CI) and p-value | ||||||||||
| Total Cholesterol < 4.1 mmol/L | 1.59 (1.15–2.19) | 0.005 * | 1.12 (0.74–1.68) | 0.593 | 1.39 (0.95–2.01) | 0.086 | 1.68 (1.24–2.28) | 0.001 * | 1.25 (0.60–2.59) | 0.558 |
| Haemoglobin < 13 g/dL (men) and < 12 g/dL (women) | 1.74 (1.17–2.60) | 0.007 * | 1.30 (0.76–2.24) | 0.338 | 1.50 (0.95–2.37) | 0.079 | 2.03 (1.35–3.04) | 0.001 * | 2.42 (1.15–5.10) | 0.020 * |
| Ferritin < 23 µg/L | 1.40 (0.94–2.08) | 0.096 | 1.14 (0.69–1.89) | 0.611 | 1.39 (0.88–2.18) | 0.155 | 0.94 (0.66–1.34) | 0.727 | 2.15 (1.02–4.51) | 0.043 * |
| HbA1c < 5.0% | 0.90 (0.39–2.10) | 0.811 | 1.86 (0.56–6.12) | 0.310 | 0.17 (0.02–1.27) | 0.085 | 0.52 (0.26–1.04) | 0.063 | - 3 | - |
| CRP > 10 mg/L | 2.41 (1.55–3.73) | <0.001 * | 0.80 (0.47–1.35) | 0.400 | 1.50 (0.90–2.51) | 0.118 | 0.85 (0.56–1.27) | 0.421 | 1.25 (0.44–3.56) | 0.670 |
| eGFR < 60 mL/min/1.73 m2 | 1.70 (1.25–2.32) | 0.001 * | 1.21 (0.81–1.80) | 0.361 | 1.33 (0.92–1.92) | 0.124 | 2.02 (1.49–2.74) | <0.001 * | 1.46 (0.74–2.88) | 0.274 |
| 25-Hydroxy Vitamin D < 25 nmol/L | 2.56 (1.85–3.53) | <0.001 * | 1.70 (1.04–2.75) | 0.033 * | 2.53 (1.78–3.60) | <0.001 * | 1.54 (1.12–2.12) | 0.007 * | 1.38 (0.66–2.88) | 0.385 |
| Adjusted 2 OR (95% CI) and p-value | ||||||||||
| Total Cholesterol < 4.1 mmol/L | 1.90 (1.35–2.69) | <0.001 * | 1.52 (0.99–2.34) | 0.057 | 1.31 (0.87–1.98) | 0.197 | 1.23 (0.88–1.71) | 0.222 | 1.04 (0.47–2.30) | 0.924 |
| Haemoglobin < 13 g/dL (men) and < 12 g/dL (women) | 1.83 (1.20–2.80) | 0.005 * | 1.41 (0.80–2.48) | 0.232 | 1.6 (1.02–2.75) | 0.041 * | 1.58 (1.03–2.43) | 0.035 * | 1.73 (0.78–3.87) | 0.178 |
| Ferritin < 23 µg/L | 1.36 (0.91–2.04) | 0.136 | 0.99 (0.59–1.67) | 0.984 | 1.66 (1.02–2.71) | 0.040 * | 1.06 (0.73–1.54) | 0.753 | 2.57 (1.17–5.67) | 0.019 * |
| HbA1c < 5.0% | 0.94 (0.40–2.22) | 0.885 | 1.74 (0.52–5.81) | 0.370 | 0.17 (0.02–1.30) | 0.088 | 0.59 (0.29–1.21) | 0.152 | - 3 | - |
| CRP > 10 mg/L | 2.22 (1.41–3.50) | 0.001 * | 0.71 (0.413–1.23) | 0.226 | 1.21 (0.70–2.10) | 0.502 | 0.77 (0.50–1.19) | 0.241 | 0.88 (0.30–2.62) | 0.820 |
| eGFR < 60 mL/min/1.73 m2 | 1.74 (1.22–2.48) | 0.002 * | 1.29 (0.83–2.01) | 0.264 | 1.01 (0.67–1.55) | 0.946 | 1.50 (1.07–2.12) | 0.019 * | 0.50 (0.24–1.06) | 0.069 |
| 25-Hydroxy Vitamin D < 25 nmol/L | 2.35 (1.68–3.27) | <0.001 * | 1.61 (0.98–2.65) | 0.061 | 2.03 (1.38–2.97) | <0.001 * | 1.45 (1.03–2.03) | 0.031 * | 0.99 (0.46–2.17) | 0.989 |
| Low Levels of Established Malnutrition Indicators (Source Cut-Off Point) | ≥1 Micronutrient Deficiency vs. No Micronutrient Deficiencies | ||
|---|---|---|---|
| n Analysis | Adjusted 2 OR (95% CI) | p-Value | |
| Protein intake (g) < RNI (UK DRV [54]) | 1446 | 2.82 (2.25–3.70) | <0.001 * |
| Energy intake (kcal) < EAR (SACN [55]) | 1518 | 1.21 (0.89–1.64) | 0.216 |
| Energy intake (kcal) < 1800 kcal/day | 1518 | 1.56 (1.22–1.99) | <0.001 * |
| Protein intake (g) < RNI and energy intake (kcal) < EAR | 555 | 2.53 (1.71–3.73) | <0.001 * |
| Fruit and vegetable intake < 5 portions/day (Eatwell Guide [56]) | 1518 | 1.66 (1.32–2.08) | <0.001 * |
| Fruit and vegetable intake < 2 portions/day (MNA) | 1518 | 2.12 (1.52–2.95) | <0.001 * |
| Fluid intake < 2000 mL/day (men) and <1600 mL/day (women) (EFSA [57]) | 1518 | 1.27 (1.01–1.59) | 0.040 * |
| Fluid intake < 1250 mL/day (MNA) | 1518 | 1.04 (0.80–1.34) | 0.773 |
| Fluid intake < 750 mL/day (MNA) | 1518 | 0.98 (0.52–1.86) | 0.962 |
| BMI < 20 kg/m2 (age < 70 years) and <22 kg/m2 (age ≥ 70 years) (GLIM [53]) | 1428 | 0.93 (0.51–1.68) | 0.803 |
| Predictors | At Least One Micronutrient Deficiency vs. No Micronutrient Deficiencies | |
|---|---|---|
| Adjusted 2 OR (95% CI) | p-Value | |
| Routine biochemical diagnostic tests (proposed tools for identifying a poor nutritional status) | ||
| Total Cholesterol < 4.1 mmol/L | 1.70 (1.19–2.43) | 0.003 * |
| Haemoglobin < 13 g/dL (men) and <12 g/dL (women) | 2.45 (1.50–4.01) | <0.001 * |
| Ferritin < 23 µg/L | 2.28 (1.49–3.49) | <0.001 * |
| HbA1c < 5.0% | 2.99 (1.39–6.41) | 0.005 * |
| CRP > 10 mg/L | 4.71 (2.70–8.22) | <0.001 * |
| 25-Hydroxy Vitamin D < 25 nmol/L | 2.43 (1.67–3.54) | <0.001 * |
| Established malnutrition indicators (individual components of established malnutrition screening tools/risk factors) | ||
| Number of medicines | ||
| 1–4 medicines vs. no medication | 1.26 (0.95–1.67) | 0.109 |
| 5 or more medicines vs. no medication | 2.07 (1.40–3.06) | <0.001 * |
| Any dietary supplement use last year, yes vs. no | 0.50 (0.39–0.64) | <0.001 * |
| Appetite 3 | ||
| Average vs. good | 0.94 (0.68–1.29) | 0.705 |
| Poor vs. good | 2.85 (1.17–6.98) | 0.022 * |
| Self-assessed general health | ||
| Fair vs. good | 1.20 (0.88–1.65) | 0.251 |
| Bad vs. good | 2.44 (1.20–4.96) | 0.014 * |
| Fruit and vegetable, <2 portions/day vs. 2 or more portions/day | 1.62 (1.13–2.33) | 0.009 * |
| Covariates (locked into model) | ||
| Sex, women vs. men | 0.86 (0.67–1.10) | 0.230 |
| Age group | ||
| 60–69 years vs. 50–59 years | 1.40 (1.05–1.86) | 0.020 * |
| ≥70 years vs. 50–59 years | 2.07 (1.50–2.85) | <0.001 * |
| Ethnic group, White British vs. non-white | 1.05 (0.54–2.04) | 0.889 |
| Region | ||
| England—North vs. England—Central/Midlands | 1.20 (0.78–1.85) | 0.407 |
| England—South vs. England—Central/Midlands | 1.07 (0.71–1.61) | 0.754 |
| Scotland vs. England—Central/Midlands | 1.31 (0.83–2.06) | 0.246 |
| Wales vs. England—Central/Midlands | 2.30 (1.46–3.61) | <0.001 * |
| Northern Ireland vs. England—Central/Midlands | 1.02 (0.58–1.80) | 0.949 |
| Qualification | ||
| Further education vs. secondary education or less | 1.04 (0.72–1.50) | 0.834 |
| Higher education vs. secondary education or less | 0.78 (0.59–1.03) | 0.085 |
| Other vs. secondary education or less | 1.15 (0.68–1.93) | 0.601 |
| Smoking status (cigarettes) | ||
| Former smoker vs. never smoker | 1.10 (0.84–1.43) | 0.491 |
| Current smoker vs. never smoker | 3.17 (2.14–4.69) | <0.001 * |
Publisher’s Note: MDPI stays neutral with regard to jurisdictional claims in published maps and institutional affiliations. |
© 2021 by the authors. Licensee MDPI, Basel, Switzerland. This article is an open access article distributed under the terms and conditions of the Creative Commons Attribution (CC BY) license (https://creativecommons.org/licenses/by/4.0/).
Share and Cite
Truijen, S.P.M.; Hayhoe, R.P.G.; Hooper, L.; Schoenmakers, I.; Forbes, A.; Welch, A.A. Predicting Malnutrition Risk with Data from Routinely Measured Clinical Biochemical Diagnostic Tests in Free-Living Older Populations. Nutrients 2021, 13, 1883. https://doi.org/10.3390/nu13061883
Truijen SPM, Hayhoe RPG, Hooper L, Schoenmakers I, Forbes A, Welch AA. Predicting Malnutrition Risk with Data from Routinely Measured Clinical Biochemical Diagnostic Tests in Free-Living Older Populations. Nutrients. 2021; 13(6):1883. https://doi.org/10.3390/nu13061883
Chicago/Turabian StyleTruijen, Saskia P. M., Richard P. G. Hayhoe, Lee Hooper, Inez Schoenmakers, Alastair Forbes, and Ailsa A. Welch. 2021. "Predicting Malnutrition Risk with Data from Routinely Measured Clinical Biochemical Diagnostic Tests in Free-Living Older Populations" Nutrients 13, no. 6: 1883. https://doi.org/10.3390/nu13061883
APA StyleTruijen, S. P. M., Hayhoe, R. P. G., Hooper, L., Schoenmakers, I., Forbes, A., & Welch, A. A. (2021). Predicting Malnutrition Risk with Data from Routinely Measured Clinical Biochemical Diagnostic Tests in Free-Living Older Populations. Nutrients, 13(6), 1883. https://doi.org/10.3390/nu13061883