
Human Milk Concentrations of Minerals, Essential and Toxic Trace Elements and Association with Selective Medical, Social, Demographic and Environmental Factors

 and
and
Abstract
:1. Introduction
2. Material and Methods
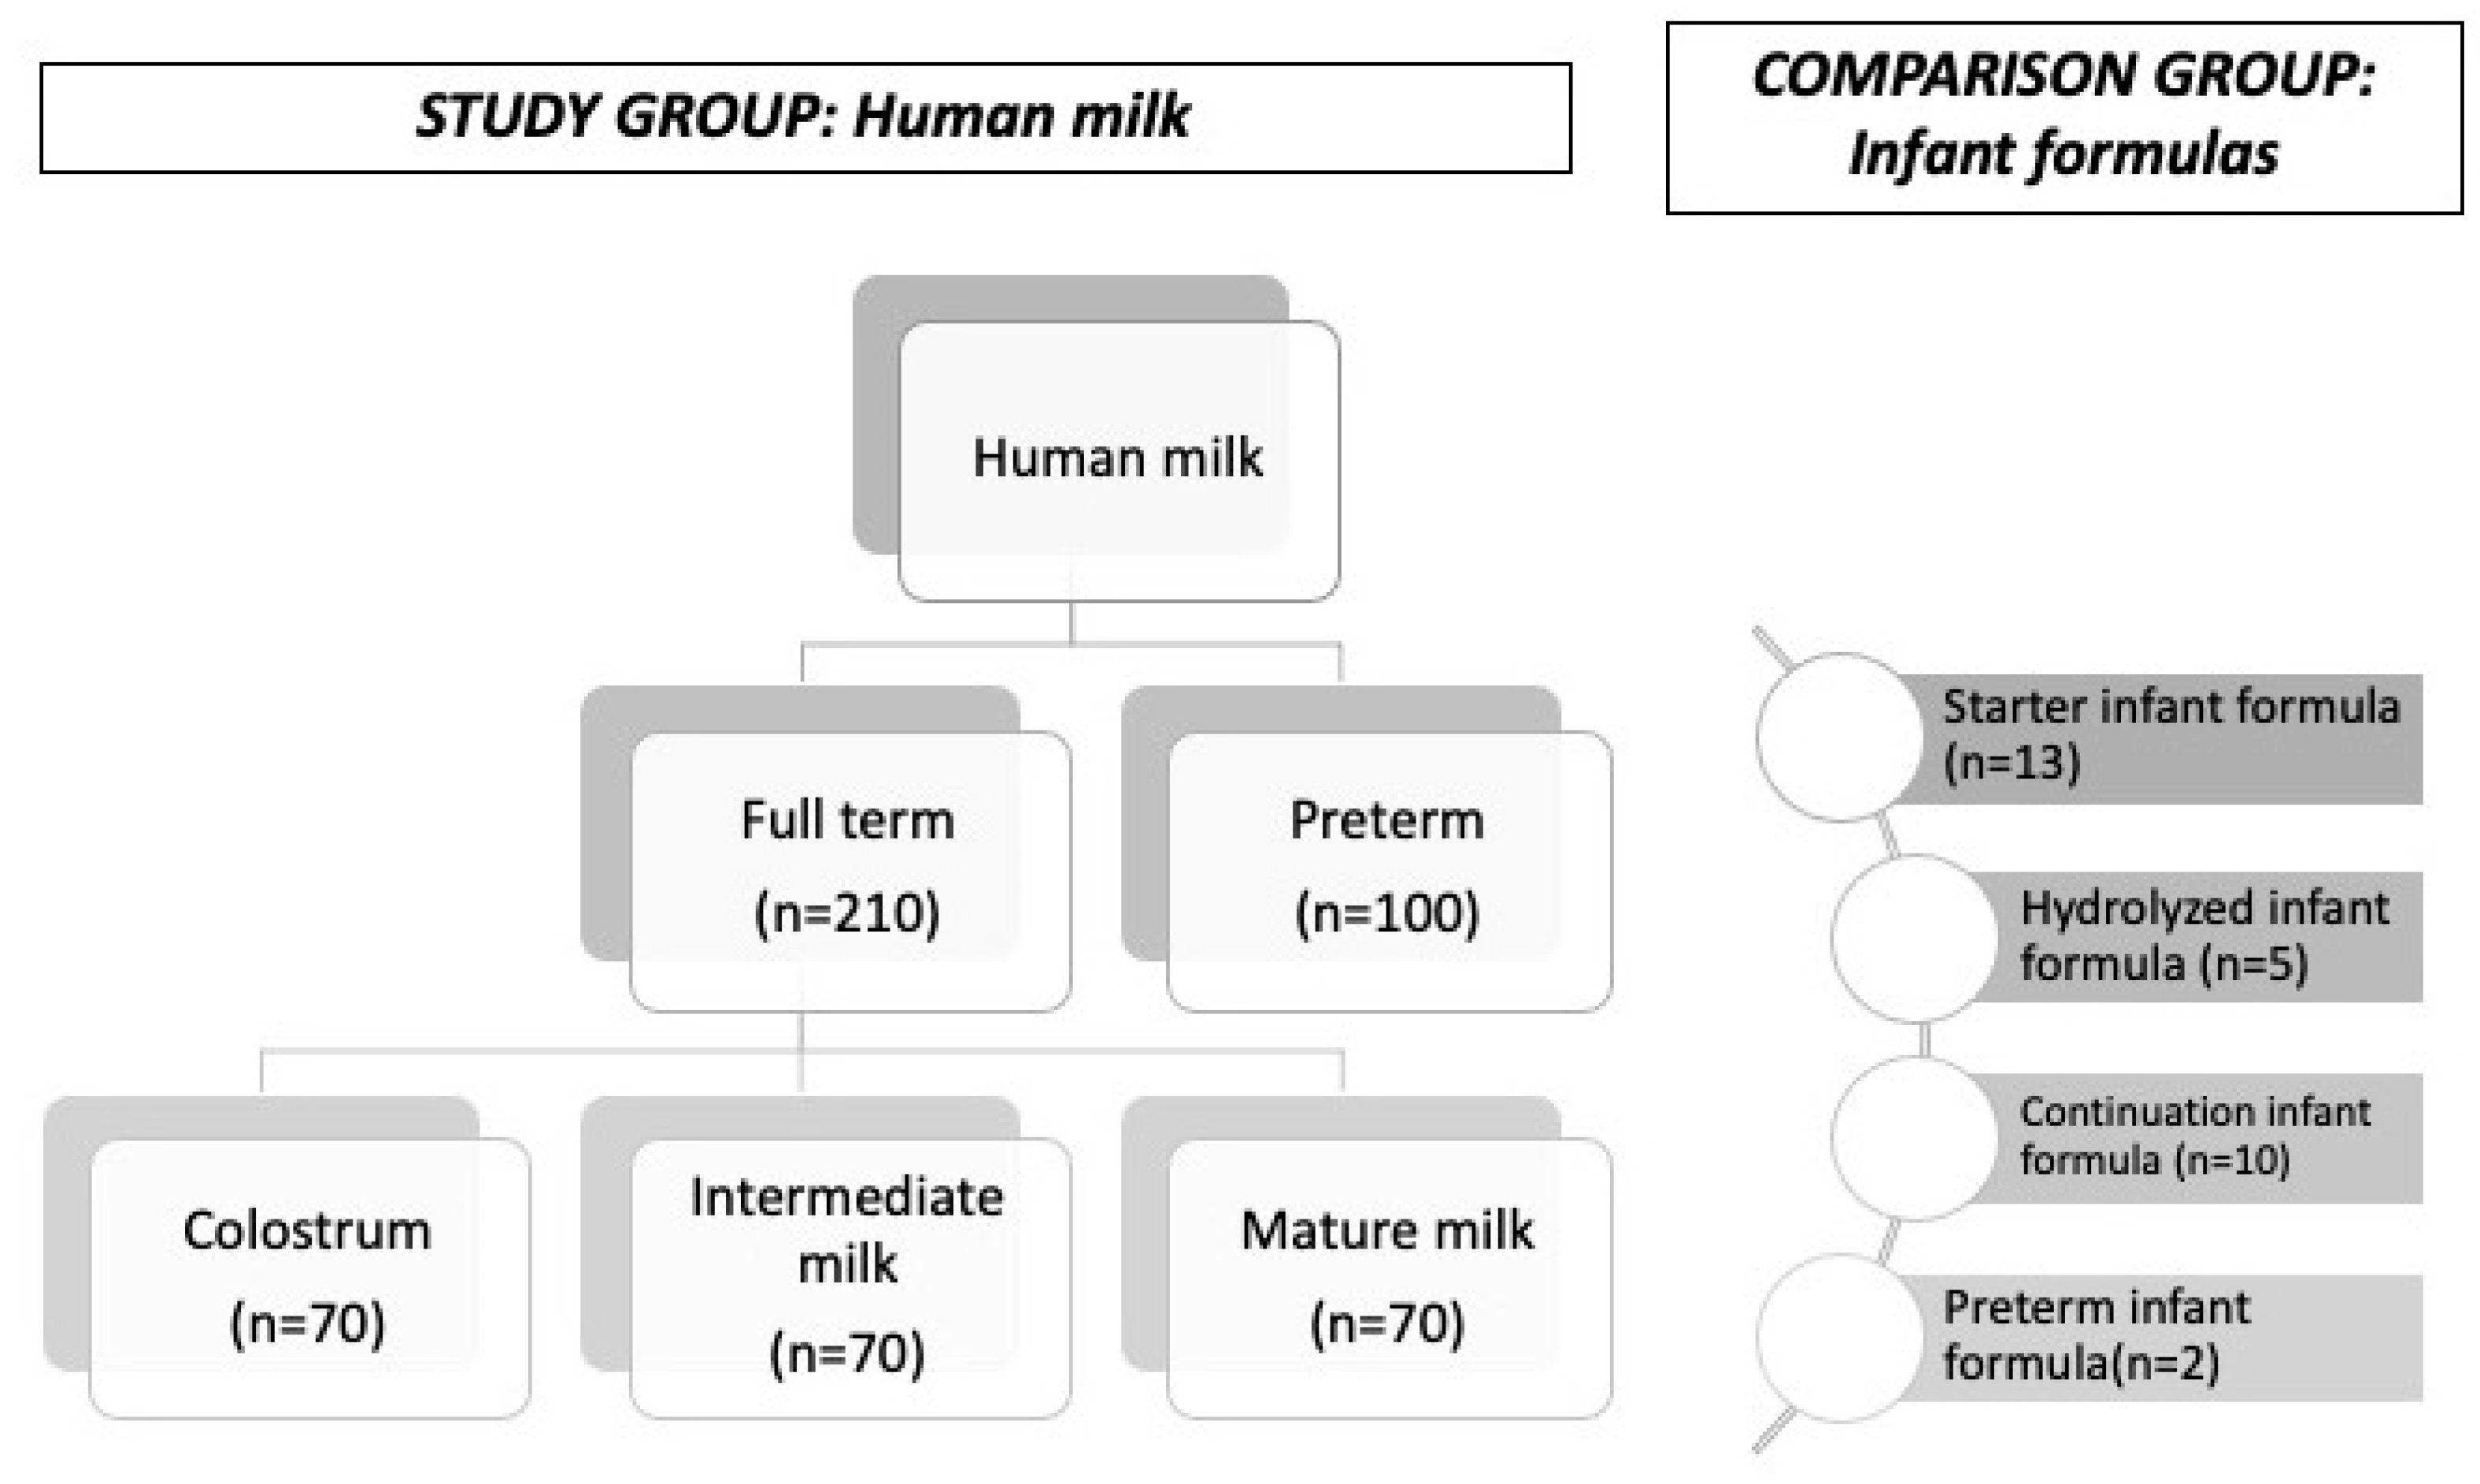
2.1. Study Design and Population
2.2. Method
2.2.1. Sample Collection and Preparation
2.2.2. Analyses
2.3. Statistical Analysis
3. Results
3.1. Characteristics of the Study Participants
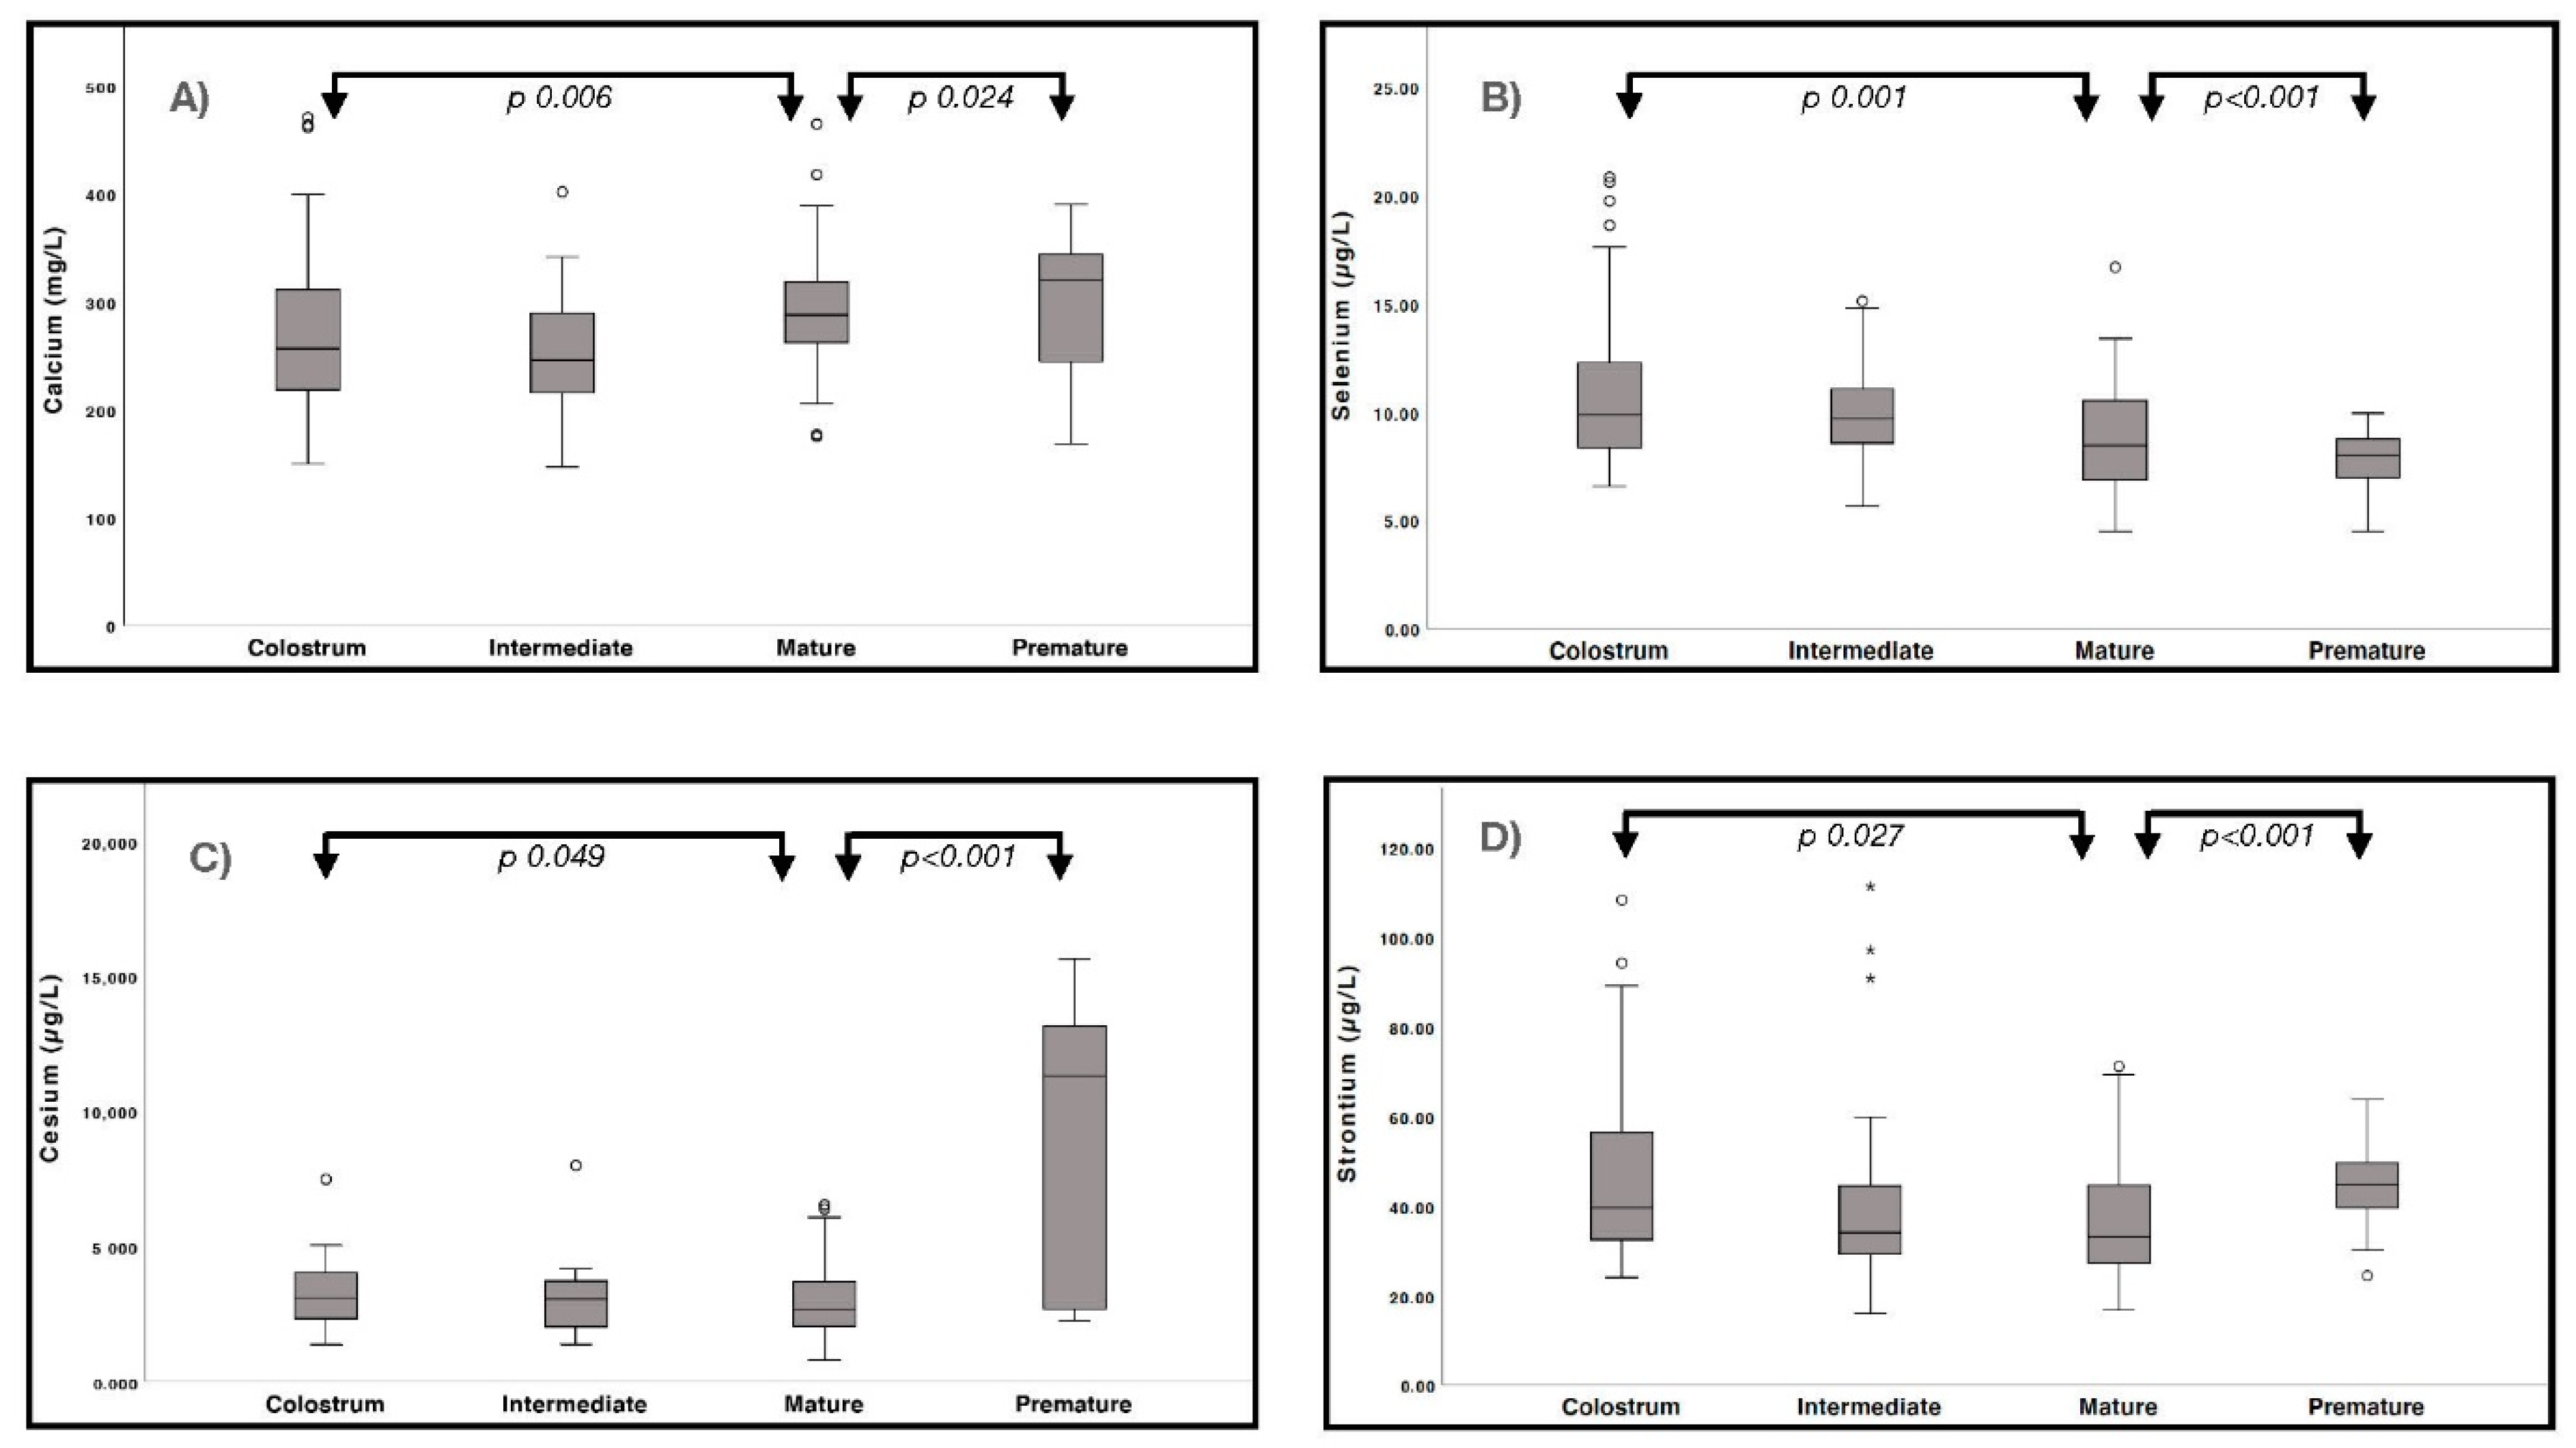
3.2. Minerals and Trace Elements in Human Milk
3.3. Minerals and Trace Element in Infant Formula
3.4. Associations with the Medical, Social, Environmental, and Demographic Variables
4. Discussion
4.1. Minerals and Essential Trace Elements
4.2. Toxic Trace Elements
5. Conclusions
Supplementary Materials
Author Contributions
Funding
Institutional Review Board Statement
Informed Consent Statement
Conflicts of Interest
References
- Ljung, K.; Palm, B.; Grandér, M.; Vahter, M. High concentrations of essential and toxic elements in infant formula and infant foods—A matter of concern. Food Chem. 2011, 127, 943–951. [Google Scholar] [CrossRef] [PubMed]
- ESPGHAN Committee on Nutrition; Agostoni, C.; Braegger, C.; Decsi, T.; Kolacek, S.; Koletzko, B.; Michaelsen, K.F.; Mihatsch, W.; Moreno, L.A.; Puntis, J.; et al. Breast-feeding: A commentary by the ESPGHAN Committee on Nutrition. J. Pediatr. Gastroenterol. Nutr. 2009, 49, 112–125. [Google Scholar] [CrossRef] [PubMed] [Green Version]
- Lönnerdal, B. Nutritional and physiologic significance of human milk proteins. Am. J. Clin. Nutr. 2003, 77, 1537S–1543S. [Google Scholar] [CrossRef] [PubMed]
- Leon-Cava, N.; Lutter, C.; Ross, J.; Martin, L. Quantifying the Benefits of Breastfeeding: A Summary of the Evidence; Pan American Health Organitation: Washington, DC, USA, 2002. [Google Scholar]
- Isaacs, E.B.; Morley, R.; Lucas, A. Early Diet and General Cognitive Outcome at Adolescence in Children Born at or Below 30 Weeks Gestation. J. Pediatr. 2009, 155, 229–234. [Google Scholar] [CrossRef] [PubMed]
- Quinn, E.A. Too much of a good thing: Evolutionary perspectives on infant formula fortification in the United States and its effects on infant health. Am. J. Hum. Biol. 2014, 26, 10–17. [Google Scholar] [CrossRef] [PubMed]
- O’Neal, S.L.; Zheng, W. Manganese Toxicity Upon Overexposure: A Decade in Review. Curr. Environ. Health Rep. 2015, 2, 315–328. [Google Scholar] [CrossRef] [PubMed] [Green Version]
- Ballard, O.; Morrow, A.L. Human milk composition: Nutrients and bioactive factors. Pediatr. Clin. N. Am. 2013, 60, 49–74. [Google Scholar] [CrossRef] [Green Version]
- Li, C.; Solomons, N.W.; Scott, M.; Koski, K.G. Minerals and Trace Elements in Human Breast Milk Are Associated with Guatemalan Infant Anthropometric Outcomes within the First 6 Months. J. Nutr. 2016, 146, 2067–2074. [Google Scholar] [CrossRef] [PubMed]
- Hojsak, I.; Bronsky, J.; Campoy, C.; Domellöf, M.; Embleton, N.; Mis, N.F.; Hulst, J.; Indrio, F.; Lapillonne, A.; Mølgaard, C.; et al. Young Child Formula: A Position Paper by the ESPGHAN Committee on Nutrition. J. Pediatr. Gastroenterol. Nutr. 2018, 66, 177–185. [Google Scholar] [CrossRef] [PubMed]
- American Academy of Pediatrics Committee on Nutrition. Trace Elements. In Pediatric Nutrition, 8th ed.; Kleinman, R.E., Greer, F.R., Eds.; American Academy of Pediatrics: Itasca, IL, USA, 2019. [Google Scholar]
- Bailey, R.L.; West, K.P., Jr.; Black, R.E. The Epidemiology of Global Micronutrient Deficiencies. Ann. Nutr. Metab. 2015, 66 (Suppl. S2), 22–33. [Google Scholar] [CrossRef]
- Molska, A.; Gutowska, I.; Baranowska-Bosiacka, I.; Nocen, I.; Chlubek, D. The content of elements in infant formulas and drinks against mineral requirements of children. Biol. Trace Elem. Res. 2014, 158, 422–427. [Google Scholar] [CrossRef] [Green Version]
- Solomon, G.M.; Weiss, P.M. Chemical contaminants in breast milk: Time trends and regional variability. Environ. Health Perspect. 2002, 110, A339–A347. [Google Scholar] [CrossRef]
- Friel, J.K.; Andrews, W.L.; Jackson, S.E.; Longerich, H.P.; Mercer, C.; McDonald, A.; Dawson, B.; Sutradhar, B. Elemental composition of human milk from mothers of premature and full-term infants during the first 3 months of lactation. Biol. Trace Elem. Res. 1999, 67, 225–247. [Google Scholar] [CrossRef] [PubMed]
- Hallen, I.; Jorhem, L.; Lagerkvist, B.; Oskarsson, A. Lead and cadmium levels in human milk and blood. Sci. Total Environ. 1995, 166, 149–155. [Google Scholar] [CrossRef]
- Qian, J.; Chen, T.; Lu, W.; Wu, S.; Zhu, J. Breast milk macro- and micronutrient composition in lactating mothers from suburban and urban Shanghai. J. Paediatr. Child Health 2010, 46, 115–120. [Google Scholar] [CrossRef] [PubMed]
- Wappelhorst, O.; Kühn, I.; Heidenreich, H.; Markert, B. Transfer of selected elements from food into human milk. Nutrition 2002, 18, 316–322. [Google Scholar] [CrossRef]
- Yamawaki, N.; Yamada, M.; Kan-No, T.; Kojima, T.; Kaneko, T.; Yonekubo, A. Macronutrient, mineral and trace element composition of breast milk from Japanese women. J. Trace Elem. Med. Biol. 2005, 19, 171–181. [Google Scholar] [CrossRef]
- Leotsinidis, M.; Alexopoulos, A.; Kostopoulou-Farri, E. Toxic and essential trace elements in human milk from Greek lactating women: Association with dietary habits and other factors. Chemosphere 2005, 61, 238–247. [Google Scholar] [CrossRef]
- Kominiarek, M.A.; Peaceman, A.M. Gestational weight gain. Am. J. Obstet. Gynecol. 2017, 217, 642–651. [Google Scholar] [CrossRef] [PubMed]
- Mohd-Taufek, N.; Cartwright, D.; Davies, M.; Hewavitharana, A.K.; Koorts, P.; Shaw, P.N.; Sumner, R.; Lee, E.; Whitfield, K. The Simultaneous Analysis of Eight Essential Trace Elements in Human Milk by ICP-MS. Food Anal. Methods 2016, 9, 2068–2075. [Google Scholar] [CrossRef]
- Prentice, A.; Barclay, D.V. Breast-milk calcium and phosphorus concentrations of mothers in rural Zaire. Eur. J. Clin. Nutr. 1991, 45, 611–617. [Google Scholar]
- Atkinson, S.; Radde, I.; Chance, G.; Bryan, M.; Anderson, G.H. Macro-mineral content of milk obtained during early lactation from mothers of premature infants. Early Hum. Dev. 1980, 4, 5–14. [Google Scholar] [CrossRef]
- Schanler, R.J.; William, O.H. Composition of breast milk obtained from mothers of premature infants as compared to breast milk obtained from donors. J. Pediatr. 1980, 96, 679–681. [Google Scholar] [CrossRef]
- Hannan, M.A.; Dogadkin, N.N.; Ashur, I.A.; Markus, W.M. Copper, Selenium, and Zinc Concentrations in Human Milk During the First Three Weeks of Lactation. Biol. Trace Elem. Res. 2005, 107, 011–020. [Google Scholar] [CrossRef]
- Wasowicz, W.; Gromadzinska, J.; Szram, K.; Rydzynski, K.; Cieslak, J.; Pietrzak, Z. Selenium, Zinc, and Copper Concentrations in the Blood and Milk of Lactating Women. Biol. Trace Elem. Res. 2001, 79, 221–233. [Google Scholar] [CrossRef]
- Navarro-Blasco, I.; Alvarez-Galindo, J. Selenium content of Spanish infant formulae and human milk: Influence of protein matrix, interactions with other trace elements and estimation of dietary intake by infants. J. Trace Elem. Med. Biol. 2004, 17, 277–289. [Google Scholar] [CrossRef] [Green Version]
- Cervilla, J.R.; Fernandez Lorenzo, J.R.; Gil Calvo, M.; Fraga, J.M. Daily intakes and selenium concentration in serum of infants in relation to different types of dietary milk in Spain. In Proceedings of the Selenium-Tellurium Development Association, Fifth International Symposium, Brussels, Belgium, 8–10 May 1994; Carapella, S.C., Oldfield, J.F., Palmieri, Y., Eds.; Selenium-Tellurium Development Association: Grimbergen, Belgium, 1994; pp. 355–356. [Google Scholar]
- Garrido, F.J.L.-B.; Bellido, L.L. Selenium and health; reference values and current status of Spanish population. Nutr. Hosp. 2013, 28, 1396–1406. [Google Scholar]
- Brätter, P.; De Brätter, V.N.; Recknagel, S.; Brunetto, M.D.R. Maternal Selenium Status Influences the Concentration and Binding Pattern of Zinc in Human Milk. J. Trace Elem. Med. Biol. 1997, 11, 203–209. [Google Scholar] [CrossRef]
- Mistry, H.D.; Wilson, V.; Ramsay, M.M.; Symonds, M.E.; Pipkin, F.B. Reduced Selenium Concentrations and Glutathione Peroxidase Activity in Preeclamptic Pregnancies. Hypertension 2008, 52, 881–888. [Google Scholar] [CrossRef] [PubMed] [Green Version]
- Dobrzynski, W.; Szymanski, W.; Zachara, B.A.; Trafikowska, U.; Trafikowska, A.; Pilecki, A. Decreased selenium concentration in maternal and cord blood in preterm compared with term delivery. Analyst 1998, 123, 93–97. [Google Scholar] [CrossRef] [PubMed]
- Klapec, T.; Ćavar, S.; Kasač, Z.; Ručević, S.; Popinjač, A. Selenium in placenta predicts birth weight in normal but not intrauterine growth restriction pregnancy. J. Trace Elem. Med. Biol. 2008, 22, 54–58. [Google Scholar] [CrossRef] [PubMed]
- Ustundag, B.; Yilmaz, E.; Dogan, Y.; Akarsu, S.; Canatan, H.; Halifeoglu, I.; Cikim, G.; Aygun, A.D. Levels of Cytokines (IL-1β, IL-2, IL-6, IL-8, TNF-α) and Trace Elements (Zn, Cu) in Breast Milk From Mothers of Preterm and Term Infants. Mediat. Inflamm. 2005, 2005, 331–336. [Google Scholar] [CrossRef] [PubMed] [Green Version]
- Harding, J.; Cormack, B.; Alexander, T.; Alsweiler, J.M.; Bloomfield, F.H. Advances in nutrition of the newborn infant. Lancet 2017, 389, 1660–1668. [Google Scholar] [CrossRef]
- Nikniaz, L.; Mahdavi, R.; Gargari, B.P.; Magami, S.J.G.; Nikniaz, Z. Maternal Body Mass Index, Dietary Intake and Socioeconomic Status: Differential Effects on Breast Milk Zinc, Copper and Iron Content. Health Promot. Perspect. 2011, 1, 140–146. [Google Scholar] [PubMed] [Green Version]
- Dumrongwongsiri, O.; Chatvutinun, S.; Phoonlabdacha, P.; Sangcakul, A.; Chailurkit, L.-O.; Siripinyanond, A.; Suthutvoravut, U.; Chongviriyaphan, N. High Urinary Iodine Concentration among Breastfed Infants and the Factors Associated with Iodine Content in Breast Milk. Biol. Trace Elem. Res. 2018, 186, 106–113. [Google Scholar] [CrossRef] [PubMed]
- Grillo, A.; Salvi, L.; Coruzzi, P.; Salvi, P.; Parati, G. Sodium Intake and Hypertension. Nutriens 2019, 11, 1970. [Google Scholar] [CrossRef] [Green Version]
- Bianchi, G.; Cusi, D.; Vezzoli, G. Role of cellular sodium and calcium metabolism in the pathogenesis of essential hypertension. Semin. Nephrol. 1988, 8, 110–119. [Google Scholar]
- Domellöf, M.; Lönnerdal, B.; Dewey, K.G.; Cohen, R.J.; Hernell, O. Iron, zinc, and copper concentrations in breast milk are independent of maternal mineral status. Am. J. Clin. Nutr. 2004, 79, 111–115. [Google Scholar] [CrossRef] [PubMed]
- Committee on Nutrition. Iron fortification of infant formulas. American Academy of Pediatrics. Committee on Nutrition. Pediatrics 1999, 104, 119–123. [Google Scholar] [CrossRef] [Green Version]
- Léonard, A.; Gerber, G.B. Mutagenicity, carcinogenicity and teratogenicity of thallium compounds. Mutat. Res. Mol. Mech. Mutagen. 1997, 387, 47–53. [Google Scholar] [CrossRef]
- Nishijo, M.; Nakagawa, H.; Honda, R.; Tanebe, K.; Saito, S.; Teranishi, H.; Tawara, K. Effects of maternal exposure to cadmium on pregnancy outcome and breast milk * COMMENTARY. Occup. Environ. Med. 2002, 59, 394–397. [Google Scholar] [CrossRef] [Green Version]
- Gundacker, C.; Pietschnig, B.; Wittmann, K.J.; Lischka, A.; Salzer, H.; Hohenauer, L.; Schuster, E. Lead and Mercury in Breast Milk. Pediatrics 2002, 110, 873–878. [Google Scholar] [CrossRef]
- Press, N.A. Institute of Medicine (US) Panel on Micronutrients. Dietary Reference Intakes for Vitamin A, Vitamin K, Arsenic, Boron, Chromium, Copper, Iodine, Iron, Manganese, Molybdenum, Nickel, Silicon, Vanadium, and Zinc; National Academies Press: Washington, DC, USA, 2001. [Google Scholar]
- O’Brien, C.E.; Harik, N.; James, L.P.; Seib, P.M.; Stowe, C.D. Cesium-Induced QT-Interval Prolongation in an Adolescent. Pharmacother. J. Hum. Pharmacol. Drug Ther. 2008, 28, 1059–1065. [Google Scholar] [CrossRef]
- D’Haese, P.C.; Couttenye, M.; Lamberts, L.V.; Elseviers, M.M.; Goodman, W.G.; Schrooten, I.; Cabrera, W.E.; De Broe, M.E. Aluminum, Iron, Lead, Cadmium, Copper, Zinc, Chromium, Magnesium, Strontium, and Calcium Content in Bone of End-Stage Renal Failure Patients. Clin. Chem. 1999, 45, 1548–1556. [Google Scholar] [CrossRef] [PubMed]
- Broadley, M.R.; White, P.J. Some elements are more equal than others: Soil-to-plant transfer of radiocaesium and radiostrontium, revisited. Plant Soil 2012, 355, 23–27. [Google Scholar] [CrossRef]
- Gattavecchia, E.; Ghini, S.; Tonelli, D.; Gori, G.; Cama, G.; Guerresi, E. Cesium-137 levels in breast milk and placentae after fallout from the reactor accident at Chernobyl. Health Phys. 1989, 56, 245–248. [Google Scholar]
- Shagina, N.B.; Tolstykh, E.I.; Fell, T.P.; Smith, T.J.; Harrison, J.D.; Degteva, M.O. Strontium biokinetic model for the lactat-ing woman and transfer to breast milk: Application to Techa River studies. J. Radiol. Prot. 2015, 35, 677–694. [Google Scholar] [CrossRef] [PubMed]
- Rahimi, E.; Hashemi, M.; Baghbadorani, Z.T. Determination of cadmium and lead in human milk. Int. J. Environ. Sci. Technol. 2009, 6, 671–676. [Google Scholar] [CrossRef] [Green Version]
- Gulson, B.L.; Jameson, C.W.; Mahaffey, K.R.; Mizon, K.J.; Patison, N.; Law, A.J.; Korsch, M.J.; Salter, M.A. Relationships of lead in breast milk to lead in blood, urine, and diet of the infant and mother. Environ. Health Perspect. 1998, 106, 667–674. [Google Scholar] [CrossRef] [PubMed]
- Kwapuliński, J.; Wiechuła, D.; Fischer, A. The influence of smoking and passive smoking to occurrence of metals in breast milk. Prz. Lek. 2004, 61, 1113–1115. [Google Scholar]
- Fernández-Lorenzo, J.R.; Cocho, J.A.; Rey-Goldar, M.L.; Couce, M.; Fraga, J.M. Aluminum contents of human milk, cow’s milk, and infant formulas. J. Pediatr. Gastroenterol. Nutr. 1999, 28, 270–275. [Google Scholar] [CrossRef] [PubMed]
- Exley, C. What is the risk of aluminium as a neurotoxin? Expert Rev. Neurother. 2014, 14, 589–591. [Google Scholar] [CrossRef]
- Exley, C.; Vickers, T. Elevated brain aluminium and early onset Alzheimer’s disease in an individual occupationally exposed to aluminium: A case report. J. Med. Case Rep. 2014, 8, 41. [Google Scholar] [CrossRef] [Green Version]
- World Health Organization. International Atomic Energy Agency & Food and Agricultura Organization of the United Nations; Trace Elements in Human Nutrition and Health: Geneva, Switzerland, 1996. [Google Scholar]
- Leuraud, K.; Schnelzer, M.; Tomasek, L.; Hunter, N.; Timarche, M.; Grosche, B.; Kreuzer, M.; Laurier, D. Radon, smoking and lung cancer risk: Results of a joint analysis of three European case-control studies among uranium miners. Radiat. Res. 2011, 176, 375–387. [Google Scholar] [CrossRef] [PubMed]
- Nguyen, C.H.; Field, J.A.; Sierra-Alvarez, R. Microbial toxicity of gallium- and indium-based oxide and arsenide nanoparticles. J. Environ. Sci. Health Part A 2019, 55, 168–178. [Google Scholar] [CrossRef] [PubMed]


| Full-Term Mothers (n = 70) | Pre-Term Mothers (n = 100) | ||||
|---|---|---|---|---|---|
| Mean (± SD)/Number | Range/% | Mean ± SD/Number | Range/% | p | |
| Mother’s age (y) | 31.91 ± 4.58 | 24–44 | 35.52 ± 5.66 | 23–46 | 0.234 |
| Maternal weight before pregnancy (kg) | 69.74 ± 7.64 | 47–122 | 64.43 ± 6.69 | 48–92 | 0.424 |
| Excessive weight gain during pregnancy (≥16 kg) | 17 | 24% | 23 | 23% | 0.645 |
| Multiple pregnancy | 2 | 2% | 13 | 13% | 0.593 |
| Gestational HT | 5 | 7% | 17 | 17% | 0.283 |
| Gestational diabetes | 4 | 5% | 10 | 10% | 0.103 |
| Residency (urban vs. rural) | 52 vs. 18 | 75% | 86 vs. 14 | 86% | 0.248 |
| Well water consumers | 14 | 20% | 27 | 27% | 0.323 |
| Smokers | 10 | 14% | 12 | 12% | 0.548 |
| Gestational age (wk) | 39.12 ± 1.08 | 37–41.3 | 31.15 ± 3.25 | 24.33–34.66 | 0.043 |
| Newborn weight (g) | 2990 ± 391 | 2410–3830 | 1445 ± 554 | 670–2790 | 0.047 |
| Element | Type of Milk | Mean ± SD | Interval for Mean | p-Value | Element | Mean ± SD | Interval for Mean | p-Value | ||
|---|---|---|---|---|---|---|---|---|---|---|
| Lower | Upper | Lower | Upper | |||||||
| Minerals (mg/L) | ||||||||||
| Ca | TC | 245.36 ± 49 | 233.43 | 257.29 | 0.006 | Na | 188.88 ±53 | 106.14 | 231.61 | >0.999 |
| TI | 270.59 ± 73 | 250.92 | 290.27 | 122.36 ± 87 | 99.05 | 145.68 | ||||
| TM | 291.04 ± 53 | 278.09 | 303.99 | 124.93 ± 60 | 110.18 | 139.68 | ||||
| PM | 298.76 ± 57 | 280.36 | 310.17 | 0.024 | 131.39 ± 34 | 124.48 | 138.30 | >0.999 | ||
| K | TC | 333.46 ± 94 | 308.14 | 458.78 | >0.999 | p | 134.85 ± 19 | 130.28 | 139.62 | >0.999 |
| TI | 350.06 ± 70 | 332.84 | 467.28 | 129.62 ± 25 | 122.85 | 136.39 | ||||
| TM | 434.10 ± 119 | 405.31 | 462.89 | 128.39 ± 27 | 121.67 | 135.10 | ||||
| PM | 373.65 ± 103 | 352.92 | 494.38 | >0.999 | 125.31 ± 31 | 119.10 | 131.51 | >0.999 | ||
| Mg | TC | 29.91 ± 7 | 28.19 | 41.62 | >0.999 | |||||
| TI | 35.98 ± 6 | 34.12 | 37.84 | |||||||
| TM | 38.19 ± 8 | 36.21 | 40.17 | |||||||
| PM | 37.36 ± 6 | 36.16 | 38.56 | >0.999 | ||||||
| Essential Trace Elements (µg/L) | ||||||||||
| Co | TC | 0.057 ± 0.02 | 0.049 | 0.065 | >0.999 | Mn | 2.60 ± 3.50 | 1.67 | 3.54 | 0.039 |
| TI | 0.052 ± 0.06 | 0.037 | 0.067 | 1.74 ± 0.75 | 1.56 | 1.93 | ||||
| TM | 0.044 ± 0.02 | 0.039 | 0.050 | 1.68 ± 1.00 | 1.44 | 1.92 | ||||
| PM | 0.052 ± 0.01 | 0.049 | 0.056 | 0.827 | 1.99 ± 0.93 | 1.80 | 2.18 | >0.999 | ||
| Cr | TC | 3.61 ± 0.99 | 3.38 | 3.85 | >0.999 | Mo | 1.88 ± 1.2 | 1.47 | 2.29 | <0.001 |
| TI | 3.5 ±0.00 | 3.5 | 3.5 | 1.22 ± 1.98 | 0.82 | 1.76 | ||||
| TM | 3.5 ± 0.00 | 3.5 | 3.5 | 0.96 ± 1.16 | 0.68 | 1.25 | ||||
| PM | 3.22 ± 1.04 | 3.01 | 3.71 | 0.013 | 0.70 ± 1.17 | 0.47 | 0.94 | >0.999 | ||
| Cu | TC | 339.34 ± 185 | 211.20 | 289.03 | 0.029 | Se | 10.82 ± 3.41 | 9.90 | 11.73 | 0.001 |
| TI | 269.15 ± 135 | 236.02 | 302.29 | 9.91 ± 1.95 | 9.44 | 10.38 | ||||
| TM | 250.11 ± 163 | 290.21 | 389.86 | 8.87 ± 2.44 | 8.28 | 9.47 | ||||
| PM | 265.33 ± 71 | 251.03 | 279.63 | >0.999 | 4.97 ± 3.77 | 4.22 | 9.72 | <0.001 | ||
| Fe | TC | 187.70 ± 90 | 162.82 | 211.32 | >0.999 | Zn | 1005.21 ± 1019 | 762.22 | 1248.20 | >0.999 |
| TI | 185.28 ± 78 | 166.09 | 204.46 | 1041.41 ± 911 | 797.25 | 1285.57 | ||||
| TM | 176.51 ± 94 | 157.97 | 198.96 | 1237.76 ± 949 | 1004.30 | 1471.22 | ||||
| PM | 138.43 ± 83 | 119.71 | 190.15 | 0.016 | 558.95 ± 716 | 316.06 | 1401.85 | <0.001 | ||
| I | TC | 108.63 ± 51 | 94.96 | 122.3 | >0.999 | |||||
| TI | 121.95 ± 51 | 109.37 | 134.52 | |||||||
| TM | 127.98 ± 88 | 106.84 | 149.12 | |||||||
| PM | 95.18 ± 53 | 84.57 | 105.79 | 0.045 | ||||||
| Toxic Trace Elements (µg/L) | ||||||||||
| Ag * | TC | 0.10 ± 0.00 | 0.10 | 0.10 | >0.999 | Pb | 0.51 ± 1.56 | 0.14 | 0.88 | >0.999 |
| TI | 0.10 ± 0.00 | 0.10 | 0.10 | 0.33 ± 0.38 | 0.22 | 0.43 | ||||
| TM | 0.10 ± 0.00 | 0.10 | 0.10 | 0.30 ± 0.23 | 0.25 | 0.36 | ||||
| PM | 0.10 ± 0.00 | 0.10 | 0.10 | >0.999 | 0.10 ± 0.01 | 0.09 | 0.10 | 0.004 | ||
| Al | TC | 8.54 ± 3.12 | 7.79 | 9.28 | 0.736 | Pt | 0.10 ± 0.24 | 0.03 | 0.16 | 0.025 |
| TI | 7.44 ± 4.05 | 6.35 | 8.52 | 0.05 ± 0.04 | 0.04 | 0.06 | ||||
| TM | 7.29 ± 1.11 | 7.02 | 7.56 | 0.05 ± 0.03 | 0.04 | 0.06 | ||||
| PM | 7.92 ± 4.38 | 7.04 | 8.79 | >0.999 | 0.04 ± 0.01 | 0.04 | 0.04 | >0.999 | ||
| As | TC | 0.93 ± 1.54 | 0.52 | 1.34 | >0.999 | Rb | 427.41 ± 130 | 392.51 | 462.31 | 0.013 |
| TI | 1.11 ± 0.171 | 0.70 | 1.51 | 448.36 ± 131 | 416.22 | 480.51 | ||||
| TM | 1.37 ± 1.82 | 0.93 | 1.82 | 519.64 ± 164 | 480.4 | 558.94 | ||||
| PM | 1.17 ± 0.60 | 1.05 | 1.29 | >0.999 | 492.31 ± 97 | 472.95 | 511.66 | >0.999 | ||
| Ba | TC | 4.02 ± 8.52 | 1.98 | 6.05 | >0.999 | Sb | 0.07 ± 0.04 | 0.05 | 0.08 | >0.999 |
| TI | 3.77 ± 4.68 | 2.51 | 5.02 | 0.06 ± 0.02 | 0.06 | 0.07 | ||||
| TM | 3.25 ± 2.45 | 2.65 | 3.85 | 0.06 ± 0.04 | 0.05 | 0.07 | ||||
| PM | 2.46 ± 1.07 | 2.24 | 2.67 | 0.047 | 0.10 ± 0.17 | 0.06 | 0.13 | 0.013 | ||
| Be * | TC | 0.10 ± 0.00 | 0.10 | 0.10 | >0.999 | Sn | 0.09 ± 0.07 | 0.07 | 0.11 | <0.001 |
| TI | 0.10 ± 0.00 | 0.10 | 0.10 | 0.07 ± 0.01 | 0.06 | 0.07 | ||||
| TM | 0.10 ± 0.00 | 0.10 | 0.10 | 0.07 ± 0.00 | 0.07 | 0.07 | ||||
| PM | 0.10 ± 0.00 | 0.10 | 0.10 | >0.999 | 0.07 ± 0.00 | 0.07 | 0.07 | >0.999 | ||
| Cd | TC | 0.18 ± 0.07 | 0.16 | 0.20 | 0.754 | Sr | 45.42 ± 18 | 40.34 | 50.50 | 0.027 |
| TI | 0.16 ± 0.05 | 0.14 | 0.17 | 38.18 ± 16 | 34.33 | 42.03 | ||||
| TM | 0.15 ± 0.20 | 0.10 | 0.20 | 36.36 ± 12 | 33.40 | 39.32 | ||||
| PM | 0.45 ± 0.49 | 0.35 | 0.54 | <0.001 | 44.37 ± 7.95 | 42.78 | 55.95 | <0.001 | ||
| Cs | TC | 5.48 ± 9.86 | 2.84 | 8.12 | 0.049 | Ti | 36.78 ± 7.81 | 34.68 | 38.87 | >0.999 |
| TI | 4.17 ± 4.86 | 3.01 | 5.33 | 37.25 ± 13 | 34.02 | 40.48 | ||||
| TM | 3.13 ± 1.73 | 2.71 | 3.55 | 40.90 ± 7.75 | 39.05 | 42.75 | ||||
| PM | 9.17 ± 5.00 | 5.17 | 10.17 | <0.001 | 48.82 ± 23 | 45.06 | 54.58 | <0.001 | ||
| Ga | TC | 1.84 ± 0.37 | 1.74 | 1.94 | >0.999 | Tl | 0.03 ± 0.01 | 0.03 | 0.03 | >0.999 |
| TI | 1.93 ± 0.61 | 1.77 | 2.08 | 0.03 ± 0.02 | 0.02 | 0.03 | ||||
| TM | 2.08 ± 0.51 | 1.95 | 2.20 | 0.04 ± 0.05 | 0.02 | 0.05 | ||||
| PM | 2.21 ± 0.57 | 2.10 | 2.33 | 0.005 | 0.04 ± 0.01 | 0.04 | 0.04 | >0.999 | ||
| Hg | TC | 0.34 ± 0.18 | 0.29 | 0.39 | >0.999 | U * | 0.004 ± 0.00 | 0.004 | 0.004 | >0.999 |
| TI | 0.32 ± 0.12 | 0.29 | 0.35 | 0.004 ± 0.00 | 0.004 | 0.004 | ||||
| TM | 0.31 ± 0.08 | 0.29 | 0.33 | 0.004 ± 0.00 | 0.004 | 0.004 | ||||
| PM | 0.42 ± 0.31 | 0.45 | 0.18 | 0.019 | 0.004 ± 0.00 | 0.004 | 0.004 | >0.999 | ||
| Li | TC | 2.48 ± 4.47 | 1.28 | 3..8 | >0.999 | V * | 0.05 ± 0.00 | 0.05 | 0.05 | 0.642 |
| TI | 2.04 ± 2.99 | 1.32 | 2.75 | 0.05 ± 0.01 | 0.04 | 0.05 | ||||
| TM | 1.66 ± 1.37 | 1.32 | 2.99 | 0.05 ± 0.00 | 0.05 | 0.05 | ||||
| PM | 1.94 ± 1.69 | 1.61 | 2.28 | >0.999 | 0.05 ± 0.01 | 0.05 | 0.06 | 0.003 | ||
| Ni | TC | 1.8 ± 0.00 | 1.80 | 1.80 | >0.999 | |||||
| TI | 2.18 ± 1.12 | 1.88 | 2.48 | |||||||
| TM | 2.35 ± 2.69 | 1.69 | 3.00 | |||||||
| PM | 1.89 ± 0.83 | 1.72 | 2.06 | >0.999 | ||||||
| Element | Type of Formula | Mean ± SD | Interval for Mean | p-Value | Element | Mean ± SD | Interval for Mean | p-Value | ||
|---|---|---|---|---|---|---|---|---|---|---|
| Lower | Upper | Lower | Upper | |||||||
| Minerals (mg/L) | ||||||||||
| Ca | SF | 419.93 ± 135 | 345.14 | 494.72 | >0.999 | Na | 147.06 ± 27 | 131.72 | 162.40 | >0.999 |
| CF | 417.62 ± 30 | 391.96 | 443.28 | 161.12 ± 12 | 150.49 | 171.75 | ||||
| HF | 430.2 ± 86 | 322.49 | 537.90 | 190.6 ± 62 | 113.57 | 267.72 | ||||
| PF | 509.5 ± 64 | 393 | 626 | 218.5 ± 54 | 180 | 257 | ||||
| K | SF | 473.06 ± 43 | 448.92 | 497.21 | >0.999 | P | 271.37 ± 12 | 253.67 | 281.59 | >0.999 |
| CF | 443.87 ± 9.26 | 436.12 | 451.62 | 284 ± 56 | 261.15 | 288.77 | ||||
| HF | 522.8 ± 95 | 404.43 | 641.16 | 312 ± 61 | 235.32 | 367 | ||||
| PF | 518 ± 49 | 432.28 | 662.71 | 319 ± 67 | 271 | 381.59 | ||||
| Mg | SF | 50.46 ± 7.21 | 46.46 | 54.46 | >0.999 | |||||
| CF | 53.12 ± 15 | 40.36 | 65.88 | |||||||
| HF | 59.8 ± 13 | 43.64 | 75.95 | |||||||
| PF | 67.5 ± 7.77 | 62 | 73 | |||||||
| Essential trace elements (µg/L) | ||||||||||
| Co | SF | 0.25 ± 0.13 | 0.17 | 0.33 | <0.001 | Mn | 92.8 ± 70 | 53.58 | 133.11 | <0.001 |
| CF | 0.25 ± 0.10 | 0.16 | 0.34 | 57.35 ± 27 | 34.27 | 80.43 | ||||
| HF | 0.11 ± 0.06 | 0.02 | 0.19 | 172.37 ± 139 | 37.9 | 341.22 | ||||
| PF | 0.71 ± 0.52 | 0.34 | 1.08 | 60.19 ± 26 | 31.37 | 79.02 | ||||
| Cr | SF | 2.71 ± 0.99 | 2.16 | 3.26 | <0.001 | Mo | 31.30 ± 17 | 21.80 | 40.80 | 0.012 |
| CF | 2.35 ± 0.90 | 1.60 | 3.11 | 28.19 ± 4.89 | 24.10 | 32.28 | ||||
| HF | 5.40 ± 3.9 | 0.54 | 10.27 | 21.12 ± 12 | 5.72 | 36.52 | ||||
| PF | 4.5 ± 4.43 | 1.4 | 7.6 | 33.13 ± 0.58 | 27.86 | 38.40 | ||||
| Cu | SF | 383.03 ± 82 | 337.25 | 428.81 | >0.999 | Se | 18.58 ± 4.74 | 15.95 | 21.21 | >0.999 |
| CF | 350.74 ± 63 | 297.81 | 403.68 | 17.46 ± 3.79 | 14.29 | 20.63 | ||||
| HF | 397.33 ± 66 | 314.82 | 479.84 | 21.02 ± 3.96 | 16.10 | 25.94 | ||||
| PF | 420.94 ± 23 | 206.96 | 634.91 | 19.74 ± 3.44 | 17.31 | 22.18 | ||||
| Fe | SF | 6069.33 ± 1264 | 5369.12 | 6769.54 | 0.027 | Zn | 4647.53 ± 888 | 4155.71 | 5139.35 | >0.999 |
| CF | 8925.65 ± 503 | 8505.13 | 9346.36 | 4910.37 ± 1070 | 4015.30 | 5805.44 | ||||
| HF | 7280.2 ± 1855 | 4939.29 | 9621.10 | 5045.8 ± 1670 | 2970.98 | 7120.61 | ||||
| PF | 6269 ± 394 | 2793.26 | 9814.03 | 6708 ± 748 | 6179 | 7237 | ||||
| I | SF | 133.03 ± 34 | 114.05 | 152.00 | >0.999 | |||||
| CF | 156.36 ± 18 | 141.07 | 171.05 | |||||||
| HF | 140.07 ± 6.52 | 131.96 | 148.17 | |||||||
| PF | 163.26 ± 19 | 149.24 | 177.28 | |||||||
| Toxic trace elements (µg/L) | ||||||||||
| Ag * | SF | 0.10 ± 0.00 | 0.10 | 0.10 | 0.543 | Pb | 0.37 ± 0.13 | 0.29 | 0.44 | >0.999 |
| CF | 0.10 ± 0.00 | 0.10 | 0.10 | 0.36 ± 0.22 | 0.17 | 0.54 | ||||
| HF | 0.10 ± 0.00 | 0.10 | 0.10 | 0.33 ± 0.18 | 0.10 | 0.56 | ||||
| PF | 0.10 ± 0.00 | 0.10 | 0.10 | 0.51 ± 0.28 | 0.3 | 0.7 | ||||
| Al | SF | 54.5 ± 27 | 39.20 | 69.79 | >0.999 | Pt * | 0.12 ± 0.00 | 0.12 | 0.12 | >0.999 |
| CF | 47.07 ± 25 | 25.98 | 68.15 | 0.12 ± 0.00 | 0.12 | 0.12 | ||||
| HF | 60.81 ± 45 | 4.77 | 116.85 | 0.12 ± 0.00 | 0.12 | 0.12 | ||||
| PF | 37.44 ± 11 | 29.51 | 45.28 | 0.12 ± 0.00 | 0.12 | 0.12 | ||||
| As | SF | 0.49 ± 0.13 | 0.41 | 0.56 | >0.999 | Rb | 287.13 ± 137 | 210.92 | 363.33 | >0.999 |
| CF | 1.39 ± 2 | 0.4 | 3.07 | 292.61 ± 105 | 204.02 | 381.19 | ||||
| HF | 0.61 ± 0.42 | 0.08 | 1.14 | 164.09 ± 144 | 15.11 | 363.96 | ||||
| PF | 0.48 ± 0.12 | 0.4 | 0.57 | 105.26 ± 65 | 59.56 | 151 | ||||
| Ba * | SF | 6.7 ± 0.00 | 6.7 | 6.7 | >0.999 | Sb | 0.79 ± 0.69 | 0.41 | 1.18 | 0.017 |
| CF | 6.7 ± 0.00 | 6.7 | 6.7 | 0.32 ± 0.27 | 0.09 | 0.55 | ||||
| HF | 6.7 ± 0.00 | 6.7 | 6.7 | 0.53 ± 0.51 | 0.1 | 1.41 | ||||
| PF | 6.7 ± 0.00 | 6.7 | 6.7 | 0.2 ± 0.14 | 0.1 | 0.3 | ||||
| Be | SF | 15.68 ± 5.51 | 12.62 | 18.73 | >0.999 | Sn | 3.96 ± 2.96 | 0.76 | 5.16 | <0.001 |
| CF | 17.15 ± 4.5 | 13.33 | 20.98 | 3.14 ± 2.57 | 0.28 | 10.04 | ||||
| HF | 12.75 ± 4.39 | 7.29 | 18.20 | 19.52 ± 11 | 0.76 | 46.2 | ||||
| PF | 14.73 ± 4.75 | 12.68 | 16.79 | 0.92 ± 0.13 | 0.83 | 1.02 | ||||
| Cd * | SF | 0.06 ± 0.00 | 0.06 | 0.06 | >0.999 | Sr | 145.86 ± 53 | 116.31 | 175.40 | <0.001 |
| CF | 0.06 ± 0.00 | 0.06 | 0.06 | 121.82 ± 28 | 97.73 | 145.90 | ||||
| HF | 0.06 ± 0.00 | 0.06 | 0.06 | 133.61 ± 70 | 46.29 | 220.42 | ||||
| PF | 0.06 ± 0.00 | 0.06 | 0.06 | 355.01 ± 336 | 117.01 | 593.02 | ||||
| Cs | SF | 0.88 ± 0.62 | 0.56 | 1.22 | >0.999 | Ti | 49 ± 13 | 41.65 | 53.54 | >0.999 |
| CF | 0.78 ± 0.23 | 0.58 | 0.98 | 45.63 ± 8.44 | 38.57 | 52.70 | ||||
| HF | 0.66 ± 0.45 | 0.09 | 1.23 | 47.16 ± 21 | 20.52 | 73.80 | ||||
| PF | 0.32 ± 0.21 | 0.17 | 0.48 | 60.95 ± 21 | 44.46 | 77.44 | ||||
| Ga | SF | 2.49 ± 0.78 | 2.06 | 2.93 | 0.438 | Tl | 0.03 ± 0.01 | 0.02 | 0.04 | >0.999 |
| CF | 2.37 ± 0.55 | 1.90 | 2.83 | 0.03 ± 0.01 | 0.02 | 0.04 | ||||
| HF | 2.23 ± 1.04 | 0.93 | 3.52 | 0.03 ± 0.02 | 0.006 | 0.06 | ||||
| PF | 2.93 ± 0.98 | 2.24 | 3.63 | 0.08 ± 0.03 | 0.06 | 0.11 | ||||
| Hg | SF | 0.78 ± 0.45 | 0.49 | 1 | >0.999 | U | 0.56 ± 0.32 | 0.37 | 0.004 | 0.014 |
| CF | 0.75 ± 0.46 | 0.36 | 1.13 | 0.70 ± 0.58 | 0.21 | 0.19 | ||||
| HF | 0.60 ± 0.21 | 0.33 | 0.89 | 0.64 ± 0.69 | 0.2 | 1.88 | ||||
| PF | 0.66 ± 0.10 | 0.6 | 0.7 | 0.94 ± 0.71 | 0.44 | 1.45 | ||||
| Li | SF | 1.46 ± 0.63 | 1.11 | 1.81 | >0.999 | V | 0.87 ± 0.28 | 0.71 | 1.03 | 0.019 |
| CF | 1.52 ± 0.65 | 0.97 | 2.07 | 1.84 ± 0.48 | 1.43 | 2.25 | ||||
| HF | 1.62 ± 0.89 | 052 | 2.73 | 4.62 ± 2.96 | 0.79 | 11.24 | ||||
| PF | 1.61 ± 0.24 | 1.44 | 1.79 | 6.15 ± 4.92 | 0.57 | 9.28 | ||||
| Ni | SF | 5.71 ± 4.79 | 3.05 | 8.37 | >0.999 | |||||
| CF | 3.65 ± 1.27 | 2.58 | 4.71 | |||||||
| HF | 4.32 ± 1.53 | 2.41 | 6.23 | |||||||
| PF | 6.62 ± 4.5 | 3.4 | 9.8 | |||||||
| Element | SF vs. TM | HF vs. TM | PF vs. PM | Element | SF vs. TM | HF vs. TM | PF vs. PM | ||||||
|---|---|---|---|---|---|---|---|---|---|---|---|---|---|
| % Difference | p-Value | % Difference | p-Value | % Difference | p-Value | % Difference | p-Value | % Difference | p-Value | % Difference | p-Value | ||
| Minerals (mg/dL) | |||||||||||||
| Ca | 30 | <0.001 | 32 | <0.001 | 41 | <0.001 | Mg | 24 | <0.001 | 36 | <0.001 | 44 | <0.001 |
| K | 26 | <0.001 | 32 | 0.004 | 27 | 0.063 | |||||||
| Essential trace elements (µg/L) | |||||||||||||
| Co | 80 | <0.001 | 45 | 0.062 | 90 | <0.001 | Mo | 96 | <0.001 | 95.4 | <0.001 | 97 | <0.001 |
| Cr | 28 | 0.073 | 35 | <0.001 | 16 | 0.534 | Se | 52 | <0.001 | 57 | <0.001 | 94 | 0.008 |
| Fe | 96 | <0.001 | 97 | <0.001 | 99 | <0.001 | Zn | 73 | <0.001 | 75.4 | <0.001 | 70.7 | <0.001 |
| Mn | 98 | <0.001 | 98 | <0.001 | 96 | 0.008 | |||||||
| Toxic trace elements (µg/L) | |||||||||||||
| Al | 86 | <0.001 | 88 | <0.001 | 78 | <0.001 | Sb | 53 | <0.001 | 52 | <0.001 | 63 | 0.062 |
| Be | 43 | <0.001 | 41 | <0.001 | 42 | <0.001 | Sn | 72 | 0.001 | 58 | <0.001 | 8 | >0.999 |
| Hg | 53 | <0.001 | 46 | 0.634 | 36 | 0.084 | Sr | 75 | <0.001 | 72 | <0.001 | 87 | <0.001 |
| Ni | 58 | <0.001 | 45.6 | 0.068 | 71 | 0.006 | U | 98 | <0.001 | 99 | <0.001 | 99 | <0.001 |
| Rb | −56 | 0.001 | −54 | <0.001 | −78 | 0.001 | V | 94 | <0.001 | 62 | <0.001 | 79 | <0.001 |
| Element | Excessive Maternal Weight Gain during Pregnancy | Baby’s Birth Body Weight | Gestational HT | Residence in Urban Area | Well Water Consumption | Smokers | ||||||
|---|---|---|---|---|---|---|---|---|---|---|---|---|
| Coefficient | p-Value | Coefficient | p-Value | Coefficient | p-Value | Coefficient | p-Value | Coefficient | p-Value | Coefficient | p-Value | |
| Minerals (mg/L) | ||||||||||||
| Ca | −0.06 | >0.999 | −0.20 | <0.001 | 5.257 | 0.024 | 0.257 | >0.999 | 0.016 | >0.999 | 0.429 | >0.999 |
| Mg | −0.12 | >0.999 | −0.19 | 0.001 | 0.776 | >0.999 | 0.776 | >0.999 | 2.524 | >0.999 | 0.921 | >0.999 |
| Na | 0.11 | 0.049 | −0.23 | <0.001 | 11.397 | 0.001 | 0.397 | >0.999 | 6.133 | 0.015 | 0.314 | >0.999 |
| Essential trace elements (µg/L) | ||||||||||||
| Co | −0.01 | >0.999 | −0.17 | 0.002 | 0.015 | >0.999 | 0.015 | >0.999 | 0.57 | >0.999 | 2.43 | >0.999 |
| Cr | −0.07 | >0.999 | −0.21 | <0.001 | 0.127 | >0.999 | 0.127 | >0.999 | 1.72 | >0.999 | 0 | >0.999 |
| Cu | −0.06 | >0.999 | −0.01 | >0.999 | 0.475 | >0.999 | 0.475 | >0.999 | 4.24 | 0.041 | 0.05 | >0.999 |
| Fe | 0.11 | 0.048 | −0.08 | >0.999 | 3.035 | >0.999 | 3.035 | >0.999 | 5.8 | 0.017 | 0.06 | >0.999 |
| I | 0.11 | 0.042 | −0.22 | <0.001 | 1.906 | 0.063 | 1.906 | >0.999 | 1.50 | >0.999 | 0.78 | >0.999 |
| Mo | −0.07 | 0.024 | −0.17 | 0.002 | 0.008 | >0.999 | 0.008 | >0.999 | 2.64 | >0.999 | 0.22 | >0.999 |
| Se | −0.18 | 0.002 | −0.28 | <0.001 | −0.11 | 0.049 | 1.11 | >0.999 | 1.58 | 0.058 | 0.61 | 0.493 |
| Zn | −0.17 | >0.999 | −0.30 | <0.001 | 2.183 | >0.999 | 2.183 | >0.999 | 1.65 | >0.999 | 0.21 | >0.999 |
| Toxic trace elements (µg/L) | ||||||||||||
| As | −0.05 | >0.999 | −0.24 | <0.001 | 0.564 | 0.394 | 0.11 | 0.013 | 0.101 | >0.294 | 0.558 | >0.999 |
| Ba | −0.01 | >0.999 | −0.04 | >0.999 | 0.804 | >0.999 | 0.804 | >0.999 | 0 | >0.999 | 7.96 | 0.049 |
| Cs | −0.15 | >0.999 | −0.34 | <0.001 | 0.502 | >0.999 | 0.502 | >0.999 | 0.71 | >0.999 | 0.51 | >0.999 |
| Ga | −0.09 | 0.193 | −0.14 | 0.016 | 3.75 | 0.047 | 0.75 | >0.999 | 2.24 | >0.999 | 0.025 | >0.999 |
| Hg | −0.12 | 0.032 | −0.18 | 0.001 | 0.43 | >0.999 | 0.43 | >0.999 | 0.085 | >0.999 | 2.42 | 0.094 |
| Pb | −0.04 | >0.999 | 0.45 | <0.001 | 1.395 | >0.999 | 1.395 | 0.075 | 3.674 | 0.046 | 9.61 | 0.024 |
| Sb | 0.002 | >0.999 | −0.16 | 0.006 | 0.178 | >0.999 | 0.178 | >0.999 | 1.37 | 0.057 | 0.453 | >0.999 |
| Sn | 0.005 | >0.999 | 0.17 | 0.004 | 1.224 | 0.082 | 1.224 | >0.999 | 1.995 | >0.999 | 0.188 | >0.999 |
| Sr | −0.08 | 0.027 | −0.20 | 0.001 | 5.126 | 0.021 | 0.126 | >0.999 | 2.595 | >0.999 | 0.5 | >0.999 |
| Ti | −0.06 | >0.999 | −0.13 | 0.029 | 5.27 | 0.025 | 0.27 | >0.999 | 2.997 | 0.041 | 0.52 | >0.999 |
| Tl | −0.005 | 0.938 | −0.26 | <0.001 | 0.017 | >0.999 | 0.017 | >0.999 | 2.601 | >0.999 | 0.653 | 0.827 |
| V | −0.03 | >0.999 | −0.27 | <0.001 | 7.865 | 0.002 | 0.865 | 0.628 | 1.358 | >0.999 | 0.699 | >0.999 |
Publisher’s Note: MDPI stays neutral with regard to jurisdictional claims in published maps and institutional affiliations. |
© 2021 by the authors. Licensee MDPI, Basel, Switzerland. This article is an open access article distributed under the terms and conditions of the Creative Commons Attribution (CC BY) license (https://creativecommons.org/licenses/by/4.0/).
Share and Cite
Mandiá, N.; Bermejo-Barrera, P.; Herbello, P.; López-Suárez, O.; Fraga, J.M.; Fernández-Pérez, C.; Couce, M.L. Human Milk Concentrations of Minerals, Essential and Toxic Trace Elements and Association with Selective Medical, Social, Demographic and Environmental Factors. Nutrients 2021, 13, 1885. https://doi.org/10.3390/nu13061885
Mandiá N, Bermejo-Barrera P, Herbello P, López-Suárez O, Fraga JM, Fernández-Pérez C, Couce ML. Human Milk Concentrations of Minerals, Essential and Toxic Trace Elements and Association with Selective Medical, Social, Demographic and Environmental Factors. Nutrients. 2021; 13(6):1885. https://doi.org/10.3390/nu13061885
Chicago/Turabian StyleMandiá, Natalia, Pilar Bermejo-Barrera, Paloma Herbello, Olalla López-Suárez, Jose M. Fraga, Cristina Fernández-Pérez, and María L. Couce. 2021. "Human Milk Concentrations of Minerals, Essential and Toxic Trace Elements and Association with Selective Medical, Social, Demographic and Environmental Factors" Nutrients 13, no. 6: 1885. https://doi.org/10.3390/nu13061885