Abstract
Arabinoxylan (AX) is a structural polysaccharide found in wheat, rice and other cereal grains. Diets high in AX-containing fiber may promote gut health in obesity through prebiotic function. Thus, the impact of soluble AX isolated from rice bran fiber on human gut microbiota phylogenetic composition and short-chain fatty acid (SCFA) production patterns from normal-weight and overweight/obese subjects was investigated through in vitro fecal fermentation. Results showed that rice bran arabinoxylan modified the microbiota in fecal samples from both weight classes compared to control, significantly increasing Collinsella, Blautia and Bifidobacterium, and decreasing Sutterella, Bilophila and Parabacteroides. Rice bran AX also significantly increased total and individual SCFA contents (p < 0.05). This study suggests that rice bran AX may beneficially impact gut health in obesity through prebiotic activities.
1. Introduction
The gut microbiota have received extensive attention in the last two decades because of their important role in host health and gut homeostasis [1]. Gut microbiota is the collective term of microorganisms living in the host gut, providing many health benefits to the host, including gut integrity and immune system improvement, energy harvest and protection from pathogens [2,3,4,5]. However, the gut microbiota are also related to many diseases, and the composition of the gut microbiota is known to be affected by diseases such as obesity [6,7], type 2 diabetes mellitus [8,9], cardiovascular diseases [10,11] and colon cancer [12,13].
Obesity is caused by excessively accumulated body weight from an imbalance between energy intake and expenditure, mostly due to consumption of highly processed foods high in fat and sugar and a sedentary lifestyle [14]. Obesity is a leading public health issue in the US, affecting 42.4% of US adults [15]. It is a proven risk factor for many other diseases, such as type 2 diabetes [16,17], hypertension [18], cardiovascular diseases [19] and certain cancers [20,21]. Many studies have associated gut microbiota and diet with obesity, identifying changes in the composition of gut microbiota through different diets leading to weight loss or obesity; thus, the gut microbiota and diet might be a good target for obesity studies [22,23,24,25,26,27].
The consumption of dietary fibers has garnered interest as prebiotics for gut microbiota [28,29,30]. Dietary fiber consists of polysaccharides that cannot be hydrolyzed by human digestive enzymes. Dietary fiber can be fermented by gut microbiota to short-chain fatty acids (SCFAs), which improve the intestinal environment directly or indirectly by lowering the pH, crossing the epithelial barrier and metabolizing butyrate primarily by epithelial cells, propionate by liver cells and acetate by muscles after uptake and use by host cells [31,32]. SCFAs have an important role in gut homeostasis with further impact on host health and metabolism [33]. SCFAs include acetic acid, propionic acid and butyric acid at a 60:20:20 ratio, with a total concentration of 50–200 mM [34]. SCFAs have distinguishable impacts on the host metabolism [35].
Arabinoxylans (AXs) are polysaccharides composed of a β-1,4-xylan polymer substituted predominantly with arabinose side chains [36]. AXs are major structural cell wall components in cereals (maize, rye, barley, oats, rice, sorghum and wheat) and other plants, such as bananas [37]. They are extractable with alkali from cereal brans, which are byproducts of grain processing [38]. Numerous studies have examined the impact of maize, wheat and rye arabinoxylans on gut microbiota, but the impact of arabinoxylans from rice bran on human gut microbiota with regard to obesity has not been well described [39,40,41]. The prebiotic function of cereal AXs has not been investigated as extensively compared to other well-established plant dietary fibers, such as fructans (including fructooligosaccharides, FOS), galactans and β-glucans [39,42,43,44].
In vitro fecal fermentation models have been widely used to evaluate the effect of substrate on the composition and diversity of gut microbiota without ethical constraints [45]. Since human and animal studies are more laborious and expensive, and there is still a limitation regarding animal models that cannot reflect the complex human digestive system; in vitro models have been useful tools, with fecal samples representing the distal large intestine [46], but the limitation of in vitro models is that the experiments are short-term because they cannot mimic the colorectal environment and might suffer from a lack of substrates. In addition, there is a possibility to change the batch conditions by accumulated end products, causing a negative impact on their relevance with in vivo long-term studies [45]. Nevertheless, in vitro models are good for the initial screening of different substrates [46].
Thus, the objective of this study was to investigate the impact of arabinoxylan isolated from rice bran (compared with FOS as prebiotic control) on modulating the gut microbiota populations and short-chain fatty acid (SCFA) production levels through in vitro fecal fermentation from normal-weight (NW) and overweight/obese (OO) subjects.
2. Materials and Methods
2.1. Materials
Rice bran was a gift from Riceland Foods (Stuttgart, AR, USA), and FOS was obtained from Megazyme International Ireland Ltd. (Wicklow, Ireland). For fermentation medium, yeast extract and resazurin from Alfa Aesar (Ward Hill, MA, USA), peptone from Fisher Scientific (Waltham, WA, USA), bile salts from Oxoid (Hampshire, UK), sodium bicarbonate, sodium chloride, potassium hydrogen phosphate, magnesium sulfate heptahydrate, calcium chloride hexahydrate, L-cysteine hydrochloride, vitamin K, bovine hemin and Tween 80 from Sigma (St. Louis, MO, USA) were purchased. SCFA standards (acetic acid, propionic acid and butyric acid) were purchased from MilliporeSigma Corporate (St. Louis, MO, USA).
2.2. Isolation of Arabinoxylan
Rice bran fiber was prepared by de-starching defatted commercial bran based on a modified protocol from Bunzel et al. [47]. A total of 50 g of bran suspended in 500 mL water was heated at 90 °C for 15 min, cooled to 55 °C and digested overnight at pH 5.0 with combined 2.5 mL alpha-amylase (Fungamyl 800 L, Sigma-Aldrich, St. Louis, MO, USA) and 2.5 mL amyloglucosidase (AMG 300 L, Sigma-Aldrich) under constant mixing in a water bath shaker at 55 °C. The suspension was adjusted to pH 7.5 and further digested with 2.5 mL subtilisin A (Alcalase 2.4 L, Sigma-Aldrich) for 2 h at 55 °C. The fiber was separated by centrifugation, washed extensively with water (centrifuging and decanting until supernatant clear) and then treated overnight with 250 mL 0.25% EDTA (w/v) at 75 °C. The suspension was cooled and water washing repeated. Finally, the fiber was sequentially extracted with 100 mL of ethanol (twice) then acetone before drying by evaporation in a fume hood and vacuum desiccator.
Arabinoxylan as hemicellulose B fraction was isolated from rice bran fiber after modification from Saulnier et al. [48]. A total of 20 g fiber was extracted for 2 h at 30 °C in 200 mL of 0.5 M sodium hydroxide with 0.2% sodium borohydride, and the supernatant was separated by centrifugation. The pellet was washed with 200 mL water, and the supernatant was combined with the NaOH extract. The pellet was further extracted by 200 mL of 1.2 M potassium hydroxide with 0.5% sodium borohydride with mixing at 90 °C for 2 h and then washed with 200 mL water. The combined supernatants from treatments were combined and neutralized with glacial acetic acid, treated with 10% loading of the starch-hydrolyzing enzymes for 2 h at room temperature, then reduced to about 100 mL by rotary evaporation and finally acidified to pH 4.5. After overnight incubation at room temperature, the solution was clarified by centrifugation at 15,000× g for 30 min and treated with 400 mL of ethanol to recover the arabinoxylan. The composition as arabinoxylan was confirmed by the method of Blakeney et al. [49], with nominal (<3%) residual glucose.
2.3. Subjects and Fecal Sample Collection
This study was approved by the University of Arkansas Institutional Review Board (IRB #13-09-080). Subjects aged 21–50 from the University of Arkansas and North West Arkansas area were recruited. During the screening process, subjects filled out consent and screening forms and food frequency questionnaires (Genesis R&D analysis software, Salem, OR). Their height, weight and fasting blood glucose level (FBG) were measured. From the screening, 13 subjects with no digestive diseases, fasting blood glucose level (FBG) lower than 100 mg/dL to exclude those with prediabetes or diabetes, no tobacco use, no current medication intake and no antibiotics taken in the past 6 months were selected. They were grouped as 6 normal weight (NW) with body mass index (BMI) < 25 and 7 overweight/obese (OO) with BMI ≥ 25. A fecal sample was collected from each subject in a tightly closed bag using stool collection kits (Commode Specimen Collection System, Fisher Scientific, Waltham, WA, USA). The fecal sample was delivered within 1 h of defecation and immediately transferred and processed in an anaerobic chamber (Coy Laboratory Products Inc., Grass Lake, MI, USA) for the in vitro experiment.
2.4. In Vitro Human Fecal Fermentation
In vitro fecal fermentation was carried out as previously described [50]. Fecal fermentation medium (1 L) consisted of yeast extract (2 g), peptone (2 g), bile salts (0.5 g), sodium bicarbonate (2 g), sodium chloride (0.1 g), potassium hydrogen phosphate (0.08 g), magnesium sulfate heptahydrate (0.01 g), calcium chloride hexahydrate (0.01 g), L-cysteine hydrochloride (0.5 g), vitamin K (10 μL), bovine hemin (50 mg), Tween 80 (2 mL) and 0.025% (w/v) resazurin solution [51]. After bubbling the medium in test tubes with nitrogen gas (N2) for 3 h, the tubes were sealed with a rubber stopper and autoclave tape and autoclaved at 121 °C for 15 min. All following procedures were carried out in an anaerobic chamber. In an anaerobic chamber, the fecal sample (2 g) was mixed with 20 mL of phosphate-buffered saline until homogeneous and filtrated through 4 layers of cotton gauze to prepare the fecal slurry. In test tubes (anaerobic culture tubes, 18 × 150 mm, Chemglass Life Science LLC, Vineland, NJ, USA), 1 mL of the fecal slurry was mixed with 14 mL of sterile fermentation medium and no substrate, 100 mg of FOS, or 100 mg of AX was added for control, FOS and AX treatment. Test tubes were tightly sealed with a rubber stopper and autoclave tape and transferred to an incubator at 37 °C. Aliquots from each test tube were taken at the time points 0, 4, 8, 12, and 24 h, mixed with 0.1 mL of stop solution (2 M potassium hydroxide) and stored at −80 °C until analysis.
2.5. Determination of Short-Chain Fatty Acids
Short-chain fatty acids in samples at all time points were measured using a modified method of Ahmadi et al. [52]. Samples were thawed and centrifuged at 12,000× g for 5 min. The supernatant (300 μL) was mixed with 10 μL of 1 mM of 4-methyl valeric acid as an internal standard. The sample was transferred into a syringe fitted with a 4 mm 45-micron nylon filter and analyzed immediately using HPLC. HPLC was equipped with a Bio-Rad HPLC Organic Acid Analysis Aminex HPX-87H ion exclusion column (300 × 7.8 mm). The column was maintained at 65 °C (0.1 °C by a temperature control unit). The mobile phase consisted of water acidified with sulfuric acid (pH 2.28) with a flow rate of 0.65 mL/min. The solvent delivery system was a Waters 515 HPLC pump equipped with a Waters 717 plus autosampler. A Waters 996 photodiode array detector monitored the eluting compounds at 210 nm. As reference standards, individual and an equimolar mixture of acetic, propionic and butyric acid were used to quantify individual SCFA content.
2.6. Analysis of Microbial Composition
Changes in microbial communities during in vitro fermentation with treatments were detected by DNA sequencing of samples at 0 and 24 h time points as previously described [53]. Bacterial DNA in samples at 0 and 24 h were extracted using the OIAamp Fast DNA Stool Mini Kit (Qiagen, Gaithersburg, MD, USA). All DNA samples were diluted to 10 ng/μL after determining the concentration of DNA using NanoDropTM 1000 Spectrophotometer (Thermo Fisher Scientific, Waltham, WA, USA). The V4 region of 16S rRNA gene in samples was amplified in Eppendorf Mastercycler pro S (Eppendorf, Hamburg, Germany) with AccuPrime Pfx SuperMix (Thermo Fisher Scientific, Waltham, WA, USA) and forward and reverse primers using polymerase chain reaction (PCR). Amplified DNA samples were confirmed by agarose gel electrophoresis and normalized using a SequalPrep Normalization Plate Kit (Thermo Fisher Scientific, Waltham, WA, USA). The pooled DNA library was sequenced with the Illumina MiSeq platform (Illumina, San Diego, CA, USA) based on the 16S-rRNA V4 region [54]. The raw sequencing data from Illumina were processed through Mothur 1.41.1. [55]. For microbial composition analysis, samples from 12 subjects (NW = 6, OO = 6) were used due to a missing sample.
2.7. Statistical Analysis
Statistical analyses were performed with SAS 9.4 (SAS Institute Inc., Cary, NC) and R version 3.3.3 (R core Team, Vienna, Austria) for randomized complete block design, where weight classes are confounded with subject blocks. Significant differences among means were determined at a 5% level of significance. The Friedman test was used to compare 3 treatments at each time point in SCFA content and among 2 time points (0 and 24 h) in microbial composition data. To test significant change in the relative abundance of microbiota between 0 and 24 h (time effect), the Wilcoxon signed rank sum test was used. The Mann–Whitney test was used to test significant difference in microbial relative abundance between the NW and OO group (weight effect) at each time point (0 and 24 h).
3. Results
3.1. Characteristics of Subjects
Subject characteristics including age, BMI, and FBG are shown in Table 1. Six NW (three males, three females) and seven OO (three males, four females), i.e., a total of thirteen, subjects participated in this study. For further information regarding individual subject characteristics in Table 1.

Table 1.
Subject characteristics.
3.2. Production of Short-Chain Fatty Acids
SCFA concentrations from the three different conditions (control, FOS, AX) at time points 0, 4, 8, 12 and 24 h were determined (Figure 1). The trend of the total SCFA production was similar under both FOS and AX treatments; a significant 1.7- to 3.3-fold increase was observed at most time points when compared to the control without fibers. The total SCFA content in the AX treatment was lower at 4 h, but higher after 8 h compared to the FOS treatment.
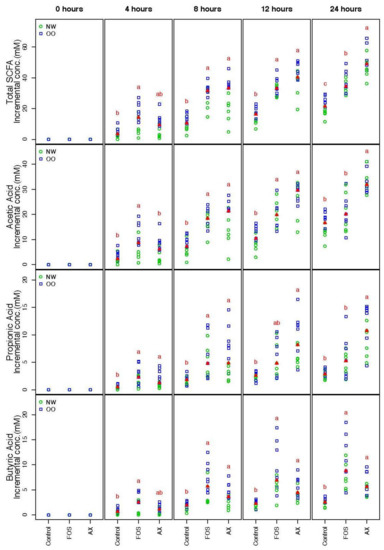
Figure 1.
Total and individual short-chain fatty acids (SCFAs) during in vitro fecal fermentation (n = 13; NW = 6, OO = 7). Treatments with different letters indicate significant differences at p < 0.05 based on the Friedman test and the corresponding multiple testing procedure. The medians are marked with red triangles. The weight classes are labeled by green circles (NW) and blue squares (OO). FOS: fructooligosaccharides, AX: arabinoxylan.
The individual SCFA production in the AX treatment showed a similar pattern in acetic acid (AA) and propionic acid (PA), where more AA and PA were produced after 8 h when compared to the FOS treatment. However, less butyric acid (BA) was produced in the AX treatment than the FOS treatment at all time points (no significant difference). In general, more AA was produced than PA and BA (AA:PA:BA = 66:17:17).
There were no significant differences in the total and individual SCFA concentrations between males and females. OO class showed a significantly higher value in total SCFA than NW at 0.05 level after adjustment of time and gender effect across all three treatments.
3.3. Compositional Changes in Phyla
Changes in microbial composition during in vitro fecal fermentation by treatments were determined by dual-index high throughput sequencing of the 16 rRNA gene V4 region. At the phylum level, Bacteroidetes, Firmicutes, Proteobacteria, Actinobacteria, Fusobacteria and Verrucomicrobia were identified from bacterial DNA samples (Figure 2a). Bacteroidetes were the most abundant phylum, showing a significant reduction in control at 24 h compared to at 0 h (p < 0.05) (Figure 2b). NW showed more drop at 24 h in the relative abundance of Bacteroidetes compared to OO, but with no significant difference. Similar to Figure 2b, the effect of time and weight group in major phyla is shown in Table 2.
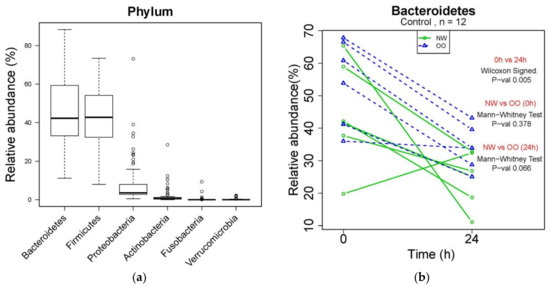
Figure 2.
Microbial composition at phylum level during in vitro fecal fermentation. (a) The composition of microbiota at phylum level; (b) effect of time and weight on composition of Bacteroidetes. The Wilcoxon signed test was used for the effect of time (0 and 24 h), and the Mann–Whitney test was used for the effect of weight (NW and OO) at each time point (0 and 24 h).
Table 2.
The effect of time and weight group in the major phyla.
After 24 h, the control without fibers significantly decreased Bacteroidetes and increased Proteobacteria, while the FOS treatment significantly increased Bacteroidetes and decreased Firmicutes and Verrucomicrobia (p < 0.05) (Table 2). The AX treatment resulted in increased Actinobacteria and decreased Verrucomicrobia after 24 h (p < 0.05) (Table 2). There was no significant difference in the relative abundance of any phylum between NW and OO at 24 h. For further information regarding individual changes in Table 2, see Figure S1 and Table S1.
In the comparison of relative abundance of phyla among treatments at 24 h, Bacteroidetes was significantly increased by the FOS treatment compared to the control without fibers (p < 0.05) (Figure 3a). OO tended to have more Bacteroidetes than NW in the control and AX treatments at 24 h. Due to a significant drop in the FOS treatment after 24 h, there were less Firmicutes in the FOS treatment than the AX treatment at 24 h (p < 0.05) (Figure 3b). Proteobacteria was significantly increased by the control without fibers compared to the FOS and AX treatments (p < 0.05) (Figure 3c). NW tended to have more Proteobacteria in all treatments. Actinobacteria showed remarkable increase with the AX treatment compared to other treatments (p < 0.05) (Figure 3d). Actinobacteria showed higher relative abundance in NW than in OO in the AX treatment. Fusobacteria (Figure 3e) and Verrucomicrobia (Figure 3f) showed no significant difference among treatments at 24 h.
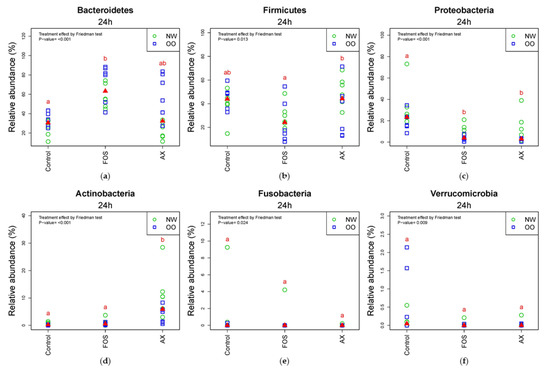
Figure 3.
Relative abundance of microbiota at the 24 h time point at phylum level (n = 12; NW = 6, OO = 6). (a) Bacteroidetes; (b) Firmicutes; (c) Proteobacteria; (d) Actinobacteria; (e) Fusobacteria; (f) Verrucomicrobia. Treatments with different letters indicate significant differences at p < 0.05 based on the Friedman test and the corresponding multiple testing procedure. The medians are marked with red triangles. The weight classes are labeled by green circles (NW) and blue squares (OO). AX: arabinoxylan.
3.4. Compositional Changes in Genera
At the genus level, a total of 260 genera were identified from bacterial DNA samples, and the distribution of 27 major genera is shown in Figure 4a. Prevotella was the most abundant genus, showing a decrease in the control at 24 h compared to at 0 h (Figure 4b). The relative abundance of Prevotella in the control was lower in NW than OO at 24 h, but with no significant difference. Similar to Table 2, the effect of time and weight group at the genus level are shown in Table 3.
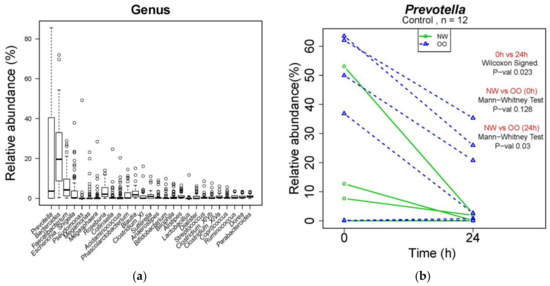
Figure 4.
Microbial composition at genus level during in vitro fecal fermentation (n = 12; NW = 6, OO = 6). (a) The composition of microbiota at genus level; (b) effect of time and weight on composition of Prevotella. The Wilcoxon signed test was used for the effect of time (0 and 24 h), and the Mann–Whitney test was used for the effect of weight (NW and OO) at each time point (0 and 24 h).
Table 3.
The effect of time and weight group at the genus level.
In Table 3, all treatments significantly increased Escherichia/Shigella and decreased Faecalibacterium and Streptococccus after 24 h (p < 0.05). The FOS treatment significantly reduced Roseburia, Alistipes, Megamonas, Ruminococcus and Lactobacillus, while the AX treatment resulted in increased Collinsella and Bifidobacterium and decreased Sutterella, Alistipes, Clostridium XIVa and b after 24 h (p < 0.05). There was no significant difference in the relative abundance of any genus between NW and OO at 24 h. For further information regarding individual changes in Table 3, see Figure S2 and Table S2.
In the comparison of relative abundance of genera among treatments at 24 h (Figure 5), the control without fibers significantly increased Escherichia/Shigella, Parabacteroides, Bilophila and Dorea compared to other treatments (p < 0.05). The FOS and AX treatments both reduced the abundance of Alistipes and Clostridium XIVa (p < 0.05). The AX treatment significantly increased Blautia, Collinsella and Bifidobacterium and decreased Faecalibacterium, Sutterella and Clostridium XIVb, while Coprococcus was increased by the FOS treatment (p < 0.05). In the comparison of relative abundance between weight groups at 24 h (Figure 5 and Figure S2), OO tended to have more Prevotella, Dorea and Coprococcus in the control without fibers. NW tended to have more Bacteroides and Parabacteroides with the FOS treatment, and more Megamonas with the AX treatment. With the FOS and AX treatment, the relative abundance of Escherichia/Shigella and Alistipes was higher in NW than OO. The level of Bilophila and Bifidobacterium was lower in OO in all treatments. However, these trends between weight groups at 24 h did not show a significant difference (Table 3).
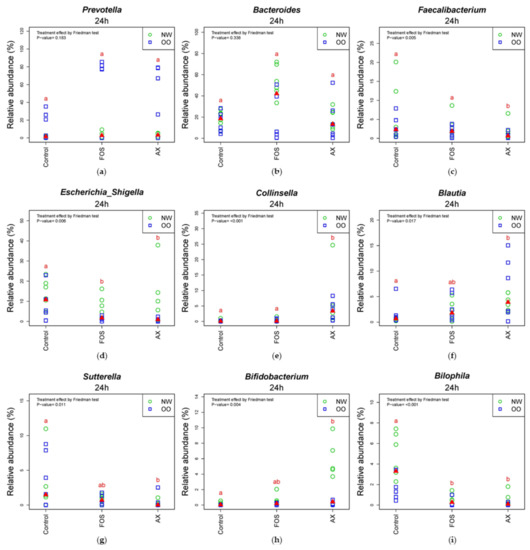
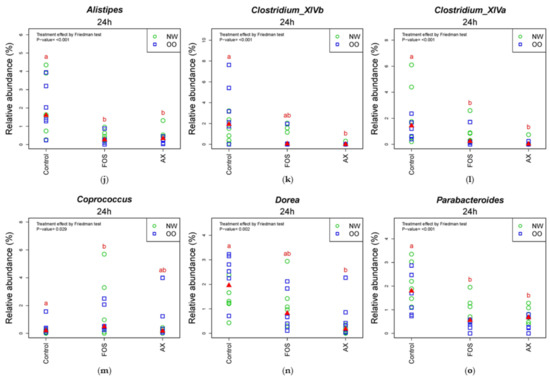
Figure 5.
Relative abundance of microbiota at the 24 h time point at genus level (n = 12). (a) Prevotella; (b) Bacteroides; (c) Faecalibacterium; (d) Escherichia/Shigella; (e) Collinsella; (f) Blautia; (g) Sutterella; (h) Bifidobacterium; (i) Bilophia; (j) Alistipes; (k) Clostridium XIVb; (l) Clostridium XIVa; (m) Coprococcus; (n) Dorea; (o) Parabacteroides. Treatments with different letters indicate significant differences at p < 0.05 based on the Friedman test and the corresponding multiple testing procedure. The medians are marked with red triangles. The weight classes are labeled by green circles (NW) and blue squares (OO). AX: arabinoxylan.
4. Discussion
The current study was performed to examine the effect of AX isolated from rice bran on gut microbial composition and SCFA content through in vitro fecal fermentation from NW and OO weight classes. Fructooligosaccharides (FOS) were used as a control with fiber in this study because FOS is a well-established prebiotic [56,57,58].
Acetic acid is the most abundant fermentation product from gut microbes as a net product, and it can be taken up and circulated to peripheral tissues, including muscles, the heart and the brain [31]. It is also used for hepatic cholesterol synthesis and lipogenesis related to body weight and adiposity [59]. In the current study, acetic acid showed the highest concentration among SCFAs and increased time-dependently with the AX treatment. Other studies with the treatment of wheat arabinoxylans [60], feruloylated arabinoxylan oligosaccharides from rice bran (FAXO) [53] and hydrolyzed rice arabinoxylans [61] also showed similar results as the current study by increasing the level of acetic acid the most among SCFAs.
Propionic acid is associated with gluconeogenesis in the liver, cholesterol synthesis inhibition, stimulation of the immune system and pH decrease in the colon [59]. Propionate also increases satiety and reduces appetite, energy uptake, weight gain and other risk factors related to obesity [62]. Propionic acid is produced either via the succinate pathway where succinate is used to make propionic acid or via the acrylate pathway where lactate is used [63,64]. Our results showed that the level of propionic acid in the AX treatment significantly increased at 24 h compared to control and FOS (p < 0.05). There were similar findings from the treatment of rice arabinoxylans [61] and FAXO [53], showing a comparable or more significant increase than FOS.
Butyric acid is a main energy source for the colonocytes, and it has a crucial role in improving the immune system, removing oxidative stress in the colon, stimulating the production of mucin and antimicrobial peptides and maintaining epithelial tight-junction integrity, for supporting gut barrier function [65,66]. In addition, it has been implicated for protection from colorectal cancer [65]. Feruloylated arabinoxylan oligosaccharides from rice bran increased butyric acid more than the FOS [53]. However, Rumpagaporn et al. [61] showed that endoxylanase–hydrolysate of rice alkali-extractable arabinoxylan produced less butyric acid than the FOS. Similar to Rumpagaporn et al. [61], we found that the AX treatment increased acetic acid and propionic acid more, but butyric acid less compared to the FOS treatment.
The AX treatment showed a lower fermentation in total and individual SCFA content at 0–4 h compared to the FOS treatment. This can be explained by the structural difference between treatments. In Rosa et al. [67] and Rose et al. [68], rice arabinoxylans had a more branched structure compared to maize arabinoxylans. Since rice arabinoxylans are highly branched, it takes more time for bacterial enzymes to remove arabinose branches and depolymerize xylan for subsequent fermentation. Kaur et al. [69] compared SCFA production of different dietary fibers using in vitro upper gastrointestinal digestion and human fecal fermentation for 48 h. They found that FOS showed the highest production in total SCFA at 4 h, with rapid fermentation at an early period. Maize bran AX showed the lowest concentration of SCFA at 4 h, with a slow fermenting rate at the early period, but their fermentation rate increased at 8 h, with rapid fermentation at a later period. Their results are consistent with our results for rice bran AX.
Between weight classes, OO had a higher total SCFA level than NW (p < 0.05) after adjusting the effects of time and gender in all treatments. Our results are in line with previous studies [70]. Kim et al. [70] combined the studies with SCFA levels of obese and nonobese individuals using a meta-analysis, and the results showed that obese individuals had significantly higher acetic acid, propionic acid and butyric acid concentration in fecal samples than nonobese individuals.
The major phyla after in vitro fecal fermentation with treatments were Bacteroidetes, Firmicutes, Proteobacteria, Actinobacteria, Fusobacteria and Verrucomicrobia. Bacteroidetes and Firmicutes are the most abundant phyla in the gut microbiota, accounting for more than 90% [71]. There have been many studies which have found that the Bacteroidetes/Firmicutes ratio is associated with obesity [51,72,73]. Obese individuals tend to have decreased Bacteroidetes and increased Firmicutes compared to normal-weight groups [74]. However, the association between the ratio and obesity has been controversial. Some studies found no significant differences in the Bacteroidetes/Firmicutes ratio between lean and obese people, and others showed opposite trends [23,75,76]. Duncan et al. [25] found that the Bacteroidetes/Firmicutes ratio does not determine human obesity. The Bacteroidetes/Firmicutes ratio can be very different among subjects due to many factors, such as diet, lifestyle and energy expenditure activity, so it is hard to use the ratio as an indicator of obesity [77]. In this study, there was no significant difference in Bacteroidetes and Firmicutes level between NW and OO. In addition, OO showed a relatively higher Bacteroidetes level than NW in AX at 24 h.
Proteobacteria and Actinobacteria are the major subdominant phyla in the gut microbiota, followed by the dominant phyla, Bacteroidetes and Firmicutes [78]. Chakraborti [78] reported that obese individuals showed a higher abundance of Actinobacteria. However, a recent review reported that Actinobacteria have an important role in developing and maintaining gut homeostasis, especially with an Actinobacteria genus, Bifidobacterium, a well-known probiotic [79]. The current study showed different results than Chakraborti [78]. In the current study, there was no significant difference in the abundance of Actinobacteria between NW and OO. In addition, AX significantly increased the abundance of Actinobacteria compared to FOS at 24 h.
Blautia is a genus that has shown a significant negative correlation with many diseases related to inflammation and obesity [80]. Blautia had a lower abundance in diabetic patients [81]. In another study, Blautia was more abundant in the gut microbiota of women from the effective weight loss group compared to the ineffective weight loss group [82]. Sutterella is a genus in Proteobacteria, and it was significantly elevated in obese individuals in Finegold [83] and Lv et al. [84]. Sutterella is also linked to human diseases, including inflammatory bowel disease, autism and Down syndrome [85]. In our study, AX significantly increased Blautia and decreased Sutterella, suggesting a possible beneficial impact on host health. However, there are still controversial results associated with many diseases, and the causal relationship with diseases is not extensively studied, so further studies are needed to confirm their impact on host health [70,80].
Traditionally, Bifidobacterium has been considered a beneficial bacterium [33]. Bifidobacterium has health-beneficial effects via many different pathways [86,87]. It reduces lipopolysaccharide levels, improves the tight-junction integrity of epithelial cells and prevents inflammatory diseases [88]. AX in the current study significantly increased Bifidobacterium level compared to control (p < 0.05), while NW showed relatively higher Bifidobacterium than the OO group. AX has been reported to be a preferential substrate for Bifidobacterium by several in vitro and in vivo studies [40,42,89,90,91,92], and our results support this model.
5. Conclusions
In conclusion, the present study showed that the in vitro fecal fermentation of rice bran AX increased the total SCFA content and modified the microbiota in fecal samples from both weight classes, NW and OO. There was a significant difference in total SCFA concentration between NW and OO, but both weight classes showed similar trends in fermentation patterns with AX treatment. This suggests that rice bran arabinoxylan may beneficially impact microbial gut health in obesity through prebiotic activities. However, further studies are needed to investigate the interaction with the host health due to the limitations of the current study.
Supplementary Materials
The following are available online at https://www.mdpi.com/article/10.3390/nu13062052/s1, Figure S1: Effect of time and weight on composition of major phyla, Figure S2: Effect of time and weight on composition of major genera, Table S1: The effect of time in each weight group at the phylum level, Table S2: The effect of time in each weight group at the genus level.
Author Contributions
Conceptualization, S.-O.L. and B.J.S.; methodology, S.-O.L., B.J.S. and D.M.; validation, S.-O.L., B.J.S., I.G. and J.A.L.; investigation, W.S.L., I.G. and C.B.; writing—original draft preparation, I.G. and W.S.L.; writing—review and editing, S.-O.L., B.J.S., J.A.L. and F.C.; funding acquisition, S.-O.L. and B.J.S. All authors have read and agreed to the published version of the manuscript.
Funding
This research was supported in part by funding from the Arkansas Biosciences Institute at Arkansas State University (B.J.S.), a grant from the USDA-NIFA AFRI (Food Safety, Nutrition, and Health, #2013-03091; B.J.S. and S.-O.L.), and University of Arkansas Division of Agriculture Hatch Project (1017406; S.-O.L.).
Institutional Review Board Statement
The study was approved by University of Arkansas Institutional Review Board (IRB #13-09-080).
Informed Consent Statement
Informed consent was obtained from all subjects involved in the study.
Data Availability Statement
The data presented in this study are available on request from the corresponding author.
Acknowledgments
Divya Parvatagiri and Kan Takahasi provided technical assistance in the preparation and analysis of rice bran arabinoxylan.
Conflicts of Interest
The authors declare no conflict of interest.
References
- Thursby, E.; Juge, N. Introduction to the human gut microbiota. Biochem. J. 2017, 474, 1823–1836. [Google Scholar] [CrossRef] [PubMed]
- Den Besten, G.; van Eunen, K.; Groen, A.K.; Venema, K.; Reijngoud, D.-J.; Bakker, B.M. The role of short-chain fatty acids in the interplay between diet, gut microbiota, and host energy metabolism. J. Lipid Res. 2013, 54, 2325–2340. [Google Scholar] [CrossRef] [PubMed]
- Bäumler, A.J.; Sperandio, V. Interactions between the microbiota and pathogenic bacteria in the gut. Nature 2016, 535, 85–93. [Google Scholar] [CrossRef] [PubMed]
- Gensollen, T.; Iyer, S.S.; Kasper, D.L.; Blumberg, R.S. How colonization by microbiota in early life shapes the immune system. Science 2016, 352, 539–544. [Google Scholar] [CrossRef]
- Rooks, M.G.; Garrett, W.S. Gut microbiota, metabolites and host immunity. Nat. Rev. Immunol. 2016, 16, 341–352. [Google Scholar] [CrossRef]
- Sun, L.; Ma, L.; Ma, Y.; Zhang, F.; Zhao, C.; Nie, Y. Insights into the role of gut microbiota in obesity: Pathogenesis, mechanisms, and therapeutic perspectives. Protein Cell 2018, 9, 397–403. [Google Scholar] [CrossRef]
- Meijnikman, A.S.; Gerdes, V.E.; Nieuwdorp, M.; Herrema, H. Evaluating causality of gut microbiota in obesity and diabetes in humans. Endocr. Rev. 2018, 39, 133–153. [Google Scholar] [CrossRef]
- Gurung, M.; Li, Z.; You, H.; Rodrigues, R.; Jump, D.B.; Morgun, A.; Shulzhenko, N. Role of gut microbiota in type 2 diabetes pathophysiology. EBioMedicine 2020, 51, 102590. [Google Scholar] [CrossRef]
- Sircana, A.; Framarin, L.; Leone, N.; Berrutti, M.; Castellino, F.; Parente, R.; De Michieli, F.; Paschetta, E.; Musso, G. Altered gut microbiota in type 2 diabetes: Just a coincidence? Curr. Diabetes Rep. 2018, 18, 1–11. [Google Scholar] [CrossRef]
- Jin, M.; Qian, Z.; Yin, J.; Xu, W.; Zhou, X. The role of intestinal microbiota in cardiovascular disease. J. Cell. Mol. Med. 2019, 23, 2343–2350. [Google Scholar] [CrossRef]
- Kazemian, N.; Mahmoudi, M.; Halperin, F.; Wu, J.C.; Pakpour, S. Gut microbiota and cardiovascular disease: Opportunities and challenges. Microbiome 2020, 8, 1–17. [Google Scholar] [CrossRef]
- Garrett, W.S. The gut microbiota and colon cancer. Science 2019, 364, 1133–1135. [Google Scholar] [CrossRef]
- Lin, C.; Cai, X.; Zhang, J.; Wang, W.; Sheng, Q.; Hua, H.; Zhou, X. Role of gut microbiota in the development and treatment of colorectal cancer. Digestion 2019, 100, 72–78. [Google Scholar] [CrossRef]
- Dahiya, D.K.; Puniya, M.; Shandilya, U.K.; Dhewa, T.; Kumar, N.; Kumar, S.; Puniya, A.K.; Shukla, P. Gut microbiota modulation and its relationship with obesity using prebiotic fibers and probiotics: A review. Front. Microbiol. 2017, 8, 563. [Google Scholar] [CrossRef]
- CDC. Adult Obesity Facts. June 2021. Available online: https://www.cdc.gov/obesity/data/adult.html (accessed on 11 June 2021).
- Piché, M.E.; Tchernof, A.; Després, J.P. Obesity phenotypes, diabetes, and cardiovascular diseases. Circ. Res. 2020, 126, 1477–1500. [Google Scholar] [CrossRef]
- Chobot, A.; Górowska-Kowolik, K.; Sokołowska, M.; Jarosz-Chobot, P. Obesity and diabetes—Not only a simple link between two epidemics. Diabetes Metab. Res. Rev. 2018, 34, e3042. [Google Scholar] [CrossRef]
- Seravalle, G.; Grassi, G. Obesity and hypertension. Pharmacol. Res. 2017, 122, 1–7. [Google Scholar] [CrossRef]
- Koliaki, C.; Liatis, S.; Kokkinos, A. Obesity and cardiovascular disease: Revisiting an old relationship. Metabolism 2019, 92, 98–107. [Google Scholar] [CrossRef]
- Avgerinos, K.I.; Spyrou, N.; Mantzoros, C.S.; Dalamaga, M. Obesity and cancer risk: Emerging biological mechanisms and perspectives. Metabolism 2019, 92, 121–135. [Google Scholar] [CrossRef]
- Stone, T.W.; McPherson, M.; Darlington, L.G. Obesity and cancer: Existing and new hypotheses for a causal connection. EBioMedicine 2018, 30, 14–28. [Google Scholar] [CrossRef]
- Bianchi, F.; Larsen, N.; de Mello Tieghi, T.; Adorno, M.A.T.; Kot, W.; Saad, S.M.I.; Jespersen, L.; Sivieri, K. Modulation of gut microbiota from obese individuals by in vitro fermentation of citrus pectin in combination with Bifidobacterium longum BB-46. Appl. Microbiol. Biotechnol. 2018, 102, 8827–8840. [Google Scholar] [CrossRef]
- Bianchi, F.; Duque, A.L.R.F.; Saad, S.M.I.; Sivieri, K. Gut microbiome approaches to treat obesity in humans. Appl. Microbiol. Biotechnol. 2019, 103, 1081–1094. [Google Scholar] [CrossRef]
- Murphy, E.; Cotter, P.; Healy, S.; Marques, T.M.; O’Sullivan, O.; Fouhy, F.; Clarke, S.; O’toole, P.; Quigley, E.M.; Stanton, C. Composition and energy harvesting capacity of the gut microbiota: Relationship to diet, obesity and time in mouse models. Gut 2010, 59, 1635–1642. [Google Scholar] [CrossRef] [PubMed]
- Duncan, S.H.; Lobley, G.; Holtrop, G.; Ince, J.; Johnstone, A.; Louis, P.; Flint, H.J. Human colonic microbiota associated with diet, obesity and weight loss. Int. J. Obes. 2008, 32, 1720–1724. [Google Scholar] [CrossRef] [PubMed]
- Clarke, S.F.; Murphy, E.F.; Nilaweera, K.; Ross, P.R.; Shanahan, F.; O’Toole, P.W.; Cotter, P.D. The gut microbiota and its relationship to diet and obesity: New insights. Gut Microbes 2012, 3, 186–202. [Google Scholar] [CrossRef]
- Delzenne, N.M.; Neyrinck, A.M.; Bäckhed, F.; Cani, P.D. Targeting gut microbiota in obesity: Effects of prebiotics and probiotics. Nat. Rev. Endocrinol. 2011, 7, 639. [Google Scholar] [CrossRef] [PubMed]
- Slavin, J. Fiber and prebiotics: Mechanisms and health benefits. Nutrients 2013, 5, 1417–1435. [Google Scholar] [CrossRef] [PubMed]
- Mendis, M.; Simsek, S. Arabinoxylans and human health. Food Hydrocoll. 2014, 42, 239–243. [Google Scholar] [CrossRef]
- Cummings, J.H.; Engineer, A. Denis Burkitt and the origins of the dietary fibre hypothesis. Nutr. Res. Rev. 2018, 31, 1–15. [Google Scholar] [CrossRef] [PubMed]
- Koh, A.; De Vadder, F.; Kovatcheva-Datchary, P.; Bäckhed, F. From dietary fiber to host physiology: Short-chain fatty acids as key bacterial metabolites. Cell 2016, 165, 1332–1345. [Google Scholar] [CrossRef]
- Kasubuchi, M.; Hasegawa, S.; Hiramatsu, T.; Ichimura, A.; Kimura, I. Dietary gut microbial metabolites, short-chain fatty acids, and host metabolic regulation. Nutrients 2015, 7, 2839–2849. [Google Scholar] [CrossRef]
- Rivière, A.; Selak, M.; Lantin, D.; Leroy, F.; De Vuyst, L. Bifidobacteria and butyrate-producing colon bacteria: Importance and strategies for their stimulation in the human gut. Front. Microbiol. 2016, 7, 979. [Google Scholar] [CrossRef]
- Louis, P.; Flint, H.J. Formation of propionate and butyrate by the human colonic microbiota. Environ. Microbiol. 2017, 19, 29–41. [Google Scholar] [CrossRef]
- Brahe, L.K.; Astrup, A.; Larsen, L.H. Is butyrate the link between diet, intestinal microbiota and obesity-related metabolic diseases? Obes. Rev. 2013, 14, 950–959. [Google Scholar] [CrossRef]
- Kaur, A.; Singh, B.; Yadav, M.P.; Bhinder, S.; Singh, N. Isolation of arabinoxylan and cellulose-rich arabinoxylan from wheat bran of different varieties and their functionalities. Food Hydrocoll. 2020, 112, 106287. [Google Scholar] [CrossRef]
- Chen, Z.; Li, S.; Fu, Y.; Li, C.; Chen, D.; Chen, H. Arabinoxylan structural characteristics, interaction with gut microbiota and potential health functions. J. Funct. Foods 2019, 54, 536–551. [Google Scholar] [CrossRef]
- Ryan, E.P. Bioactive food components and health properties of rice bran. J. Am. Vet. Med Assoc. 2011, 238, 593–600. [Google Scholar] [CrossRef]
- Nguyen, N.K.; Deehan, E.C.; Zhang, Z.; Jin, M.; Baskota, N.; Perez-Muñoz, M.E.; Cole, J.; Tuncil, Y.E.; Seethaler, B.; Wang, T. Gut microbiota modulation with long-chain corn bran arabinoxylan in adults with overweight and obesity is linked to an individualized temporal increase in fecal propionate. Microbiome 2020, 8, 1–21. [Google Scholar] [CrossRef]
- Neyrinck, A.M.; Possemiers, S.; Druart, C.; Van de Wiele, T.; De Backer, F.; Cani, P.D.; Larondelle, Y.; Delzenne, N.M. Prebiotic effects of wheat arabinoxylan related to the increase in bifidobacteria, Roseburia and Bacteroides/Prevotella in diet-induced obese mice. PLoS ONE 2011, 6, e20944. [Google Scholar] [CrossRef]
- Chen, T.; Long, W.; Zhang, C.; Liu, S.; Zhao, L.; Hamaker, B.R. Fiber-utilizing capacity varies in Prevotella-versus Bacteroides-dominated gut microbiota. Sci. Rep. 2017, 7, 1–7. [Google Scholar] [CrossRef]
- Van den Abbeele, P.; Venema, K.; Van de Wiele, T.; Verstraete, W.; Possemiers, S. Different human gut models reveal the distinct fermentation patterns of arabinoxylan versus inulin. J. Agric. Food Chem. 2013, 61, 9819–9827. [Google Scholar] [CrossRef]
- Gibson, G.R.; Hutkins, R.; Sanders, M.E.; Prescott, S.L.; Reimer, R.A.; Salminen, S.J.; Scott, K.; Stanton, C.; Swanson, K.S.; Cani, P.D. Expert consensus document: The International Scientific Association for Probiotics and Prebiotics (ISAPP) consensus statement on the definition and scope of prebiotics. Nat. Rev. Gastroenterol. Hepatol. 2017, 14, 491. [Google Scholar] [CrossRef]
- Nogacka, A.M.; Salazar, N.; Arboleya, S.; Ruas-Madiedo, P.; Mancabelli, L.; Suarez, A.; Martinez-Faedo, C.; Ventura, M.; Tochio, T.; Hirano, K. In vitro evaluation of different prebiotics on the modulation of gut microbiota composition and function in morbid obese and normal-weight subjects. Int. J. Mol. Sci. 2020, 21, 906. [Google Scholar] [CrossRef]
- Verhoeckx, K.; Cotter, P.; López-Expósito, I.; Kleiveland, C.; Lea, T.; Mackie, A.; Requena, T.; Swiatecka, D.; Wichers, H. (Eds.) The Impact of Food Bioactives on Health: In Vitro and Ex Vivo Models; Springer Nature: London, UK, 2015; p. 338. [Google Scholar]
- Tsitko, I.; Wiik-Miettinen, F.; Mattila, O.; Rosa-Sibakov, N.; Seppänen-Laakso, T.; Maukonen, J.; Nordlund, E.; Saarela, M. A small in vitro fermentation model for screening the gut microbiota effects of different fiber preparations. Int. J. Mol. Sci. 2019, 20, 1925. [Google Scholar] [CrossRef]
- Bunzel, M.; Allerdings, E.; Sinwell, V.; Ralph, J.; Steinhart, H. Cell wall hydroxycinnamates in wild rice (Zizania aquatica L.) insoluble dietary fibre. Eur. Food Res. Technol. 2002, 214, 482–488. [Google Scholar] [CrossRef]
- Saulnier, L.; Vigouroux, J.; Thibault, J.-F. Isolation and partial characterization of feruloylated oligosaccharides from maize bran. Carbohydr. Res. 1995, 272, 241–253. [Google Scholar] [CrossRef]
- Blakeney, A.B.; Harris, P.J.; Henry, R.J.; Stone, B.A. A simple and rapid preparation of alditol acetates for monosaccharide analysis. Carbohydr. Res. 1983, 113, 291–299. [Google Scholar] [CrossRef]
- Ashley, D.; Marasini, D.; Brownmiller, C.; Lee, J.; Carbonero, F.; Lee, S.-O. Impact of grain sorghum polyphenols on microbiota of normal weight and overweight/obese subjects during in vitro fecal fermentation. Nutrients 2019, 11, 217. [Google Scholar] [CrossRef]
- Yang, J.; Keshavarzian, A.; Rose, D.J. Impact of dietary fiber fermentation from cereal grains on metabolite production by the fecal microbiota from normal weight and obese individuals. J. Med. Food 2013, 16, 862–867. [Google Scholar] [CrossRef]
- Ahmadi, S.; Wang, S.; Nagpal, R.; Mainali, R.; Soleimanian-Zad, S.; Kitzman, D.; Yadav, H. An In Vitro Batch-culture Model to Estimate the Effects of Interventional Regimens on Human Fecal Microbiota. J. Vis. Exp. JoVE 2019, 149. [Google Scholar] [CrossRef] [PubMed]
- Pham, T.; Teoh, K.T.; Savary, B.J.; Chen, M.-H.; McClung, A.; Lee, S.-O. In vitro fermentation patterns of rice bran components by human gut microbiota. Nutrients 2017, 9, 1237. [Google Scholar] [CrossRef] [PubMed]
- Kozich, J.J.; Westcott, S.L.; Baxter, N.T.; Highlander, S.K.; Schloss, P.D. Development of a dual-index sequencing strategy and curation pipeline for analyzing amplicon sequence data on the MiSeq Illumina sequencing platform. Appl. Environ. Microbiol. 2013, 79, 5112–5120. [Google Scholar] [CrossRef] [PubMed]
- Schloss, P.D.; Westcott, S.L.; Ryabin, T.; Hall, J.R.; Hartmann, M.; Hollister, E.B.; Lesniewski, R.A.; Oakley, B.B.; Parks, D.H.; Robinson, C.J. Introducing mothur: Open-source, platform-independent, community-supported software for describing and comparing microbial communities. Appl. Environ. Microbiol. 2009, 75, 7537–7541. [Google Scholar] [CrossRef]
- Oku, T.; Nakamura, S. Fructooligosaccharide: Metabolism through gut microbiota and prebiotic effect. Food Nutr. J. 2017, 2, 128. [Google Scholar] [CrossRef]
- Singh, S.P.; Jadaun, J.S.; Narnoliya, L.K.; Pandey, A. Prebiotic oligosaccharides: Special focus on fructooligosaccharides, its biosynthesis and bioactivity. Appl. Biochem. Biotechnol. 2017, 183, 613–635. [Google Scholar] [CrossRef]
- Mano, M.C.R.; Neri-Numa, I.A.; da Silva, J.B.; Paulino, B.N.; Pessoa, M.G.; Pastore, G.M. Oligosaccharide biotechnology: An approach of prebiotic revolution on the industry. Appl. Microbiol. Biotechnol. 2018, 102, 17–37. [Google Scholar] [CrossRef]
- Alou, M.T.; Lagier, J.-C.; Raoult, D. Diet influence on the gut microbiota and dysbiosis related to nutritional disorders. Hum. Microbiome J. 2016, 1, 3–11. [Google Scholar] [CrossRef]
- Hughes, S.; Shewry, P.; Li, L.; Gibson, G.; Sanz, M.; Rastall, R. In vitro fermentation by human fecal microflora of wheat arabinoxylans. J. Agric. Food Chem. 2007, 55, 4589–4595. [Google Scholar] [CrossRef]
- Rumpagaporn, P.; Reuhs, B.L.; Kaur, A.; Patterson, J.A.; Keshavarzian, A.; Hamaker, B.R. Structural features of soluble cereal arabinoxylan fibers associated with a slow rate of in vitro fermentation by human fecal microbiota. Carbohydr. Polym. 2015, 130, 191–197. [Google Scholar] [CrossRef]
- Arora, T.; Sharma, R.; Frost, G. Propionate. Anti-obesity and satiety enhancing factor? Appetite 2011, 56, 511–515. [Google Scholar] [CrossRef]
- Scheifinger, C.C.; Wolin, M.J. Propionate formation from cellulose and soluble sugars by combined cultures of Bacteroides succinogenes and Selenomonas ruminantium. Appl. Microbiol. 1973, 26, 789–795. [Google Scholar] [CrossRef]
- El Hage, R.; Hernandez-Sanabria, E.; Calatayud Arroyo, M.; Props, R.; Van de Wiele, T. Propionate-producing consortium restores antibiotic-induced dysbiosis in a dynamic in vitro model of the human intestinal microbial ecosystem. Front. Microbiol. 2019, 10, 1206. [Google Scholar] [CrossRef]
- Costabile, A.; Bergillos-Meca, T.; Landriscina, L.; Bevilacqua, A.; Gonzalez-Salvador, I.; Corbo, M.R.; Petruzzi, L.; Sinigaglia, M.; Lamacchia, C. An in vitro fermentation study on the effects of gluten friendlyTM bread on microbiota and short chain fatty acids of fecal samples from healthy and celiac subjects. Front. Microbiol. 2017, 8, 1722. [Google Scholar] [CrossRef]
- Russell, W.R.; Hoyles, L.; Flint, H.J.; Dumas, M.-E. Colonic bacterial metabolites and human health. Curr. Opin. Microbiol. 2013, 16, 246–254. [Google Scholar] [CrossRef]
- Rosa, N.N.; Barron, C.; Gaiani, C.; Dufour, C.; Micard, V. Ultra-fine grinding increases the antioxidant capacity of wheat bran. J. Cereal Sci. 2013, 57, 84–90. [Google Scholar] [CrossRef]
- Rose, D.J.; Patterson, J.A.; Hamaker, B.R. Structural differences among alkali-soluble arabinoxylans from maize (Zea mays), rice (Oryza sativa), and wheat (Triticum aestivum) brans influence human fecal fermentation profiles. J. Agric. Food Chem. 2010, 58, 493–499. [Google Scholar] [CrossRef]
- Kaur, A.; Rose, D.J.; Rumpagaporn, P.; Patterson, J.A.; Hamaker, B.R. In vitro batch fecal fermentation comparison of gas and short-chain fatty acid production using “slowly fermentable” dietary fibers. J. Food Sci. 2011, 76, H137–H142. [Google Scholar] [CrossRef]
- Kim, K.N.; Yao, Y.; Ju, S.Y. Short chain fatty acids and fecal microbiota abundance in humans with obesity: A systematic review and meta-analysis. Nutrients 2019, 11, 2512. [Google Scholar] [CrossRef] [PubMed]
- Kotzampassi, K.; Giamarellos-Bourboulis, E.J.; Stavrou, G. Obesity as a consequence of gut bacteria and diet interactions. Int. Sch. Res. Not. 2014, 2014. [Google Scholar] [CrossRef]
- Ley, R.E.; Turnbaugh, P.J.; Klein, S.; Gordon, J.I. Human gut microbes associated with obesity. Nature 2006, 444, 1022–1023. [Google Scholar] [CrossRef]
- Turnbaugh, P.J.; Ley, R.E.; Mahowald, M.A.; Magrini, V.; Mardis, E.R.; Gordon, J.I. An obesity-associated gut microbiome with increased capacity for energy harvest. Nature 2006, 444, 1027. [Google Scholar] [CrossRef] [PubMed]
- Maslowski, K.M.; Mackay, C.R. Diet, gut microbiota and immune responses. Nat. Immunol. 2011, 12, 5–9. [Google Scholar] [CrossRef] [PubMed]
- Hu, H.-J.; Park, S.-G.; Jang, H.B.; Choi, M.-G.; Park, K.-H.; Kang, J.H.; Park, S.I.; Lee, H.-J.; Cho, S.-H. Obesity alters the microbial community profile in Korean adolescents. PLoS ONE 2015, 10, e0134333. [Google Scholar] [CrossRef] [PubMed]
- Schwiertz, A.; Taras, D.; Schäfer, K.; Beijer, S.; Bos, N.A.; Donus, C.; Hardt, P.D. Microbiota and SCFA in lean and overweight healthy subjects. Obesity 2010, 18, 190–195. [Google Scholar] [CrossRef]
- Magne, F.; Gotteland, M.; Gauthier, L.; Zazueta, A.; Pesoa, S.; Navarrete, P.; Balamurugan, R. The Firmicutes/Bacteroidetes Ratio: A Relevant Marker of Gut Dysbiosis in Obese Patients? Nutrients 2020, 12, 1474. [Google Scholar] [CrossRef]
- Chakraborti, C.K. New-found link between microbiota and obesity. World J. Gastrointest. Pathophysiol. 2015, 6, 110. [Google Scholar] [CrossRef]
- Binda, C.; Lopetuso, L.R.; Rizzatti, G.; Gibiino, G.; Cennamo, V.; Gasbarrini, A. Actinobacteria: A relevant minority for the maintenance of gut homeostasis. Dig. Liver Dis. 2018, 50, 421–428. [Google Scholar] [CrossRef]
- Liu, X.; Mao, B.; Gu, J.; Wu, J.; Cui, S.; Wang, G.; Zhao, J.; Zhang, H.; Chen, W. Blautia—A new functional genus with potential probiotic properties? Gut Microbes 2021, 13, 1–21. [Google Scholar]
- Larsen, N.; Vogensen, F.K.; Van Den Berg, F.W.; Nielsen, D.S.; Andreasen, A.S.; Pedersen, B.K.; Al-Soud, W.A.; Sørensen, S.J.; Hansen, L.H.; Jakobsen, M. Gut microbiota in human adults with type 2 diabetes differs from non-diabetic adults. PLoS ONE 2010, 5, e9085. [Google Scholar] [CrossRef]
- Song, M.Y.; Kim, B.S.; Kim, H. Influence of Panax ginseng on obesity and gut microbiota in obese middle-aged Korean women. J. Ginseng Res. 2014, 38, 106–115. [Google Scholar] [CrossRef]
- Finegold, S.M. State of the art; microbiology in health and disease. Intestinal bacterial flora in autism. Anaerobe 2011, 17, 367–368. [Google Scholar] [CrossRef]
- Lv, W.; Liu, C.; Ye, C.; Sun, J.; Tan, X.; Zhang, C.; Qu, Q.; Shi, D.; Guo, S. Structural modulation of gut microbiota during alleviation of antibiotic-associated diarrhea with herbal formula. Int. J. Biol. Macromol. 2017, 105, 1622–1629. [Google Scholar] [CrossRef]
- Hiippala, K.; Kainulainen, V.; Kalliomäki, M.; Arkkila, P.; Satokari, R. Mucosal prevalence and interactions with the epithelium indicate commensalism of Sutterella spp. Front. Microbiol. 2016, 7, 1706. [Google Scholar] [CrossRef]
- Paesani, C.; Sciarini, L.S.; Moiraghi, M.; Salvucci, E.; Prado, S.B.; Pérez, G.T.; Fabi, J.P. Human colonic in vitro fermentation of water-soluble arabinoxylans from hard and soft wheat alters Bifidobacterium abundance and short-chain fatty acids concentration. LWT 2020, 134, 110253. [Google Scholar] [CrossRef]
- Van der Meulen, T.A.; Harmsen, H.J.; Bootsma, H.; Spijkervet, F.K.; Kroese, F.G.; Vissink, A. The microbiome–systemic diseases connection. Oral Dis. 2016, 22, 719–734. [Google Scholar] [CrossRef]
- Turroni, F.; Ventura, M.; Buttó, L.F.; Duranti, S.; O’Toole, P.W.; Motherway, M.O.C.; van Sinderen, D. Molecular dialogue between the human gut microbiota and the host: A Lactobacillus and Bifidobacterium perspective. Cell. Mol. Life Sci. 2014, 71, 183–203. [Google Scholar] [CrossRef]
- Grootaert, C.; Delcour, J.A.; Courtin, C.M.; Broekaert, W.F.; Verstraete, W.; Van de Wiele, T. Microbial metabolism and prebiotic potency of arabinoxylan oligosaccharides in the human intestine. Trends Food Sci. Technol. 2007, 18, 64–71. [Google Scholar] [CrossRef]
- Van Craeyveld, V.; Swennen, K.; Dornez, E.; Van de Wiele, T.; Marzorati, M.; Verstraete, W.; Delaedt, Y.; Onagbesan, O.; Decuypere, E.; Buyse, J.; et al. Structurally different wheat-derived arabinoxylooligosaccharides have different prebiotic and fermentation properties in rats. J. Nutr. 2008, 138, 2348–2355. [Google Scholar] [CrossRef]
- Cloetens, L.; Broekaert, W.F.; Delaedt, Y.; Ollevier, F.; Courtin, C.M.; Delcour, J.A.; Rutgeerts, P.; Verbeke, K. Tolerance of arabinoxylan-oligosaccharides and their prebiotic activity in healthy subjects: A randomised, placebo-controlled cross-over study. Br. J. Nutr. 2010, 103, 703–713. [Google Scholar] [CrossRef]
- Rivière, A.; Moens, F.; Selak, M.; Maes, D.; Weckx, S.; De Vuyst, L. The ability of bifidobacteria to degrade arabinoxylan oligosaccharide constituents and derived oligosaccharides is strain dependent. Appl. Environ. Microbiol. 2014, 80, 204–217. [Google Scholar] [CrossRef]


Publisher’s Note: MDPI stays neutral with regard to jurisdictional claims in published maps and institutional affiliations. |
© 2021 by the authors. Licensee MDPI, Basel, Switzerland. This article is an open access article distributed under the terms and conditions of the Creative Commons Attribution (CC BY) license (https://creativecommons.org/licenses/by/4.0/).