
Cholesterol and Egg Intakes with Cardiometabolic and All-Cause Mortality among Chinese and Low-Income Black and White Americans

 ,
,  ,
, 
Abstract
1. Introduction
2. Materials and Methods
2.1. Study Population
2.2. Assessment of Dietary Intakes
2.3. Outcome Ascertainment
2.4. Covariate Assessments
2.5. Statistical Analyses
3. Results
3.1. Characteristics of Study Participants
3.2. Association between Dietary Cholesterol Intake and Mortality
3.3. Association between Egg Intake and Mortality
3.4. Sensitivity Analyses
4. Discussion
5. Conclusions
Supplementary Materials
Author Contributions
Funding
Institutional Review Board Statement
Informed Consent Statement
Data Availability Statement
Acknowledgments
Conflicts of Interest
References
- GBD 2017 Causes of Death Collaborators. Global, regional, and national age-sex-specific mortality for 282 causes of death in 195 countries and territories, 1980–2017: A systematic analysis for the Global Burden of Disease Study 2017. Lancet 2018, 392, 1736–1788. [Google Scholar] [CrossRef]
- Ley, S.H.; Hamdy, O.; Mohan, V.; Hu, F.B. Prevention and management of type 2 diabetes: Dietary components and nutritional strategies. Lancet 2014, 383, 1999–2007. [Google Scholar] [CrossRef]
- Yu, E.; Malik, V.S.; Hu, F.B. Cardiovascular disease prevention by diet modification: JACC Health Promotion Series. J. Am. Coll. Cardiol. 2018, 72, 914–926. [Google Scholar] [CrossRef]
- US Department of Health and Human Services and US Department of Agriculture. 2015–2020 Dietary Guidelines for Americans, 8th ed.; US Department of Health and Human Services and US Department of Agriculture: Washington, DC, USA, 2015; Available online: https://health.gov/our-work/food-nutrition/previous-dietary-guidelines/2015 (accessed on 10 February 2021).
- Piepoli, M.F.; Hoes, A.W.; Agewall, S.; Albus, C.; Brotons, C.; Catapano, A.L.; Cooney, M.T.; Corra, U.; Cosyns, B.; Deaton, C.; et al. 2016 European guidelines on cardiovascular disease prevention in clinical practice. Eur. Heart J. 2016, 37, 2315–2381. [Google Scholar] [CrossRef]
- Carson, J.A.S.; Lichtenstein, A.H.; Anderson, C.A.M.; Appel, L.J.; Kris-Etherton, P.M.; Meyer, K.A.; Petersen, K.; Polonsky, T.; Van Horn, L.; American Heart Association Nutrition Committee of the Council on Lifestyle and Cardiometabolic Health; et al. Dietary cholesterol and cardiovascular risk: A science advisory from the American Heart Association. Circulation 2020, 141, e39–e53. [Google Scholar] [CrossRef] [PubMed]
- Rong, Y.; Chen, L.; Zhu, T.; Song, Y.; Yu, M.; Shan, Z.; Sands, A.; Hu, F.B.; Liu, L. Egg consumption and risk of coronary heart disease and stroke: Dose-response meta-analysis of prospective cohort studies. BMJ 2013, 346, e8539. [Google Scholar] [CrossRef] [PubMed]
- Shin, J.Y.; Xun, P.; Nakamura, Y.; He, K. Egg consumption in relation to risk of cardiovascular disease and diabetes: A systematic review and meta-analysis. Am. J. Clin. Nutr. 2013, 98, 146–159. [Google Scholar] [CrossRef]
- Xu, L.; Lam, T.H.; Jiang, C.Q.; Zhang, W.S.; Zhu, F.; Jin, Y.L.; Woo, J.; Cheng, K.K.; Thomas, G.N. Egg consumption and the risk of cardiovascular disease and all-cause mortality: Guangzhou Biobank Cohort Study and meta-analyses. Eur. J. Nutr. 2019, 58, 785–796. [Google Scholar] [CrossRef] [PubMed]
- Berger, S.; Raman, G.; Vishwanathan, R.; Jacques, P.F.; Johnson, E.J. Dietary cholesterol and cardiovascular disease: A systematic review and meta-analysis. Am. J. Clin. Nutr. 2015, 102, 276–294. [Google Scholar] [CrossRef]
- Drouin-Chartier, J.-P.; Chen, S.; Li, Y.; Schwab, A.L.; Stampfer, M.J.; Sacks, F.M.; Rosner, B.; Willett, W.C.; Hu, F.B.; Bhupathiraju, S.N. Egg consumption and risk of cardiovascular disease: Three large prospective US cohort studies, systematic review, and updated meta-analysis. BMJ 2020, 368, 513. [Google Scholar] [CrossRef]
- Zhong, V.W.; Van Horn, L.; Cornelis, M.C.; Wilkins, J.T.; Ning, H.; Carnethon, M.R.; Greenland, P.; Mentz, R.J.; Tucker, K.L.; Zhao, L.; et al. Associations of dietary cholesterol or egg consumption with incident cardiovascular disease and mortality. JAMA 2019, 321, 1081–1095. [Google Scholar] [CrossRef]
- Zhuang, P.; Wu, F.; Mao, L.; Zhu, F.; Zhang, Y.; Chen, X.; Jiao, J.; Zhang, Y. Egg and cholesterol consumption and mortality from cardiovascular and different causes in the United States: A population-based cohort study. PLoS Med. 2021, 18, e1003508. [Google Scholar] [CrossRef]
- Chen, G.C.; Chen, L.H.; Mossavar-Rahmani, Y.; Kamensky, V.; Shadyab, A.H.; Haring, B.; Wild, R.A.; Silver, B.; Kuller, L.H.; Sun, Y.; et al. Dietary cholesterol and egg intake in relation to incident cardiovascular disease and all-cause and cause-specific mortality in postmenopausal women. Am. J. Clin. Nutr. 2020, 113, 948–959. [Google Scholar] [CrossRef]
- Micha, R.; Khatibzadeh, S.; Shi, P.; Fahimi, S.; Lim, S.; Andrews, K.G.; Engell, R.E.; Powles, J.; Ezzati, M.; Mozaffarian, D.; et al. Global, regional, and national consumption levels of dietary fats and oils in 1990 and 2010: A systematic analysis including 266 country-specific nutrition surveys. BMJ 2014, 348, g2272. [Google Scholar] [CrossRef] [PubMed]
- Roth, G.A.; Johnson, C.; Abajobir, A.; Abd-Allah, F.; Abera, S.F.; Abyu, G.; Ahmed, M.; Aksut, B.; Alam, T.; Alam, K.; et al. Global, regional, and national burden of cardiovascular diseases for 10 Causes, 1990 to 2015. J. Am. Coll. Cardiol. 2017, 70, 1–25. [Google Scholar] [CrossRef]
- Signorello, L.B.; Hargreaves, M.K.; Blot, W.J. The Southern Community Cohort Study: Investigating health disparities. J. Health Care Poor Underserved 2010, 21, 26–37. [Google Scholar] [CrossRef] [PubMed]
- Zheng, W.; Chow, W.-H.; Yang, G.; Jin, F.; Rothman, N.; Blair, A.; Li, H.-L.; Wen, W.; Ji, B.-T.; Li, Q.; et al. The Shanghai Women’s Health Study: Rationale, study design, and baseline characteristics. Am. J. Epidemiol. 2005, 162, 1123–1131. [Google Scholar] [CrossRef] [PubMed]
- Shu, X.-O.; Li, H.; Yang, G.; Gao, J.; Cai, H.; Takata, Y.; Zheng, W.; Xiang, Y.B. Cohort Profile: The Shanghai Men’s Health Study. Int. J. Epidemiol. 2015, 44, 810–818. [Google Scholar] [CrossRef] [PubMed]
- Signorello, L.B.; Munro, H.M.; Buchowski, M.S.; Schlundt, D.G.; Cohen, S.S.; Hargreaves, M.K.; Blot, W.J. Estimating nutrient intake from a food frequency questionnaire: Incorporating the elements of race and geographic region. Am. J. Epidemiol. 2009, 170, 104–111. [Google Scholar] [CrossRef]
- Banna, J.C.; McCrory, M.A.; Fialkowski, M.K.; Boushey, C. Examining Plausibility of Self-Reported Energy Intake Data: Considerations for Method Selection. Front. Nutr. 2017, 4, 45. [Google Scholar] [CrossRef]
- Buchowski, M.S.; Schlundt, D.G.; Hargreaves, M.K.; Hankin, J.H.; Signorello, L.B.; Blot, W.J. Development of a culturally sensitive food frequency questionnaire for use in the Southern Community Cohort Study. Cell. Mol. Biol. 2003, 49, 1295–1304. [Google Scholar] [PubMed]
- Shu, X.O.; Yang, G.; Jin, F.; Liu, D.; Kushi, L.; Wen, W.; Gao, Y.T.; Zheng, W. Validity and reproducibility of the food frequency questionnaire used in the Shanghai Women’s Health Study. Eur. J. Clin. Nutr. 2004, 58, 17–23. [Google Scholar] [CrossRef]
- Villegas, R.; Yang, G.; Liu, D.; Xiang, Y.B.; Cai, H.; Zheng, W.; Shu, X.O. Validity and reproducibility of the food-frequency questionnaire used in the Shanghai Men’s Health Study. Br. J. Nutr. 2007, 97, 993–1000. [Google Scholar] [CrossRef]
- Schlundt, D.G.; Buchowski, M.S.; Hargreaves, M.K.; Hankin, J.H.; Signorello, L.B.; Blot, W.J. Separate estimates of portion size were not essential for energy and nutrient estimation: Results from the Southern Community Cohort food-frequency questionnaire pilot study. Public Health Nutr. 2007, 10, 245–251. [Google Scholar] [CrossRef] [PubMed]
- Yu, D.; Sonderman, J.; Buchowski, M.S.; McLaughlin, J.K.; Shu, X.-O.; Steinwandel, M.; Signorello, L.B.; Zhang, X.; Hargreaves, M.K.; Blot, W.J.; et al. Healthy eating and risks of total and cause-specific death among low-income populations of African-Americans and other adults in the southeastern United States: A prospective cohort study. PLoS Med. 2015, 12, e1001830. [Google Scholar] [CrossRef]
- Yang, Y.; Wang, G.; Pan, X. China Food Composition Tables; Beijing Medical University Press: Beijing, China, 2002. [Google Scholar]
- Yu, D.; Shu, X.-O.; Li, H.; Xiang, Y.-B.; Yang, G.; Gao, Y.-T.; Zheng, W.; Zhang, X. Dietary carbohydrates, refined grains, glycemic load, and risk of coronary heart disease in Chinese adults. Am. J. Epidemiol. 2013, 178, 1542–1549. [Google Scholar] [CrossRef]
- Yu, D.; Zhang, X.; Shu, X.O.; Cai, H.; Li, H.; Ding, D.; Hong, Z.; Xiang, Y.B.; Gao, Y.T.; Zheng, W.; et al. Dietary glycemic index, glycemic load, and refined carbohydrates are associated with risk of stroke: A prospective cohort study in urban Chinese women. Am. J. Clin. Nutr. 2016, 104, 1345–1351. [Google Scholar] [CrossRef]
- Xia, P.F.; Pan, X.F.; Chen, C.; Wang, Y.; Ye, Y.; Pan, A. Dietary intakes of eggs and cholesterol in relation to all-cause and heart disease mortality: A prospective cohort study. J. Am. Heart Assoc. 2020, 9, e015743. [Google Scholar] [CrossRef] [PubMed]
- Zhuang, P.; Jiao, J.; Wu, F.; Mao, L.; Zhang, Y. Egg and egg-sourced cholesterol consumption in relation to mortality: Findings from population-based nationwide cohort. Clin. Nutr. 2020, 39, 3520–3527. [Google Scholar] [CrossRef]
- Griffin, J.D.; Lichtenstein, A.H. Dietary Cholesterol and Plasma Lipoprotein Profiles: Randomized-Controlled Trials. Curr. Nutr. Rep. 2013, 2, 274–282. [Google Scholar] [CrossRef]
- Xu, Z.; McClure, S.T.; Appel, L.J. Dietary cholesterol intake and sources among U.S adults: Results from National Health and Nutrition Examination Surveys (NHANES), 2001–2014. Nutrients 2018, 10, 771. [Google Scholar] [CrossRef] [PubMed]
- Su, C.; Jia, X.; Wang, Z.; Wang, H.; Zhang, B. Trends in dietary cholesterol intake among Chinese adults: A longitudinal study from the China Health and Nutrition Survey, 1991–2011. BMJ Open 2015, 5, e007532. [Google Scholar] [CrossRef] [PubMed]
- Soliman, G.A. Dietary cholesterol and the lack of evidence in cardiovascular disease. Nutrients 2018, 10, 780. [Google Scholar] [CrossRef] [PubMed]
- Weggemans, R.M.; Zock, P.L.; Katan, M.B. Dietary cholesterol from eggs increases the ratio of total cholesterol to high-density lipoprotein cholesterol in humans: A meta-analysis. Am. J. Clin. Nutr. 2001, 73, 885–891. [Google Scholar] [CrossRef]
- Dehghan, M.; Mente, A.; Rangarajan, S.; Mohan, V.; Lear, S.; Swaminathan, S.; Wielgosz, A.; Seron, P.; Avezum, A.; Lopez-Jaramillo, P.; et al. Association of egg intake with blood lipids, cardiovascular disease, and mortality in 177,000 people in 50 countries. Am. J. Clin. Nutr. 2020, 111, 795–803. [Google Scholar] [CrossRef]
- Qin, C.; Lv, J.; Guo, Y.; Bian, Z.; Si, J.; Yang, L.; Chen, Y.; Zhou, Y.; Zhang, H.; Liu, J.; et al. Associations of egg consumption with cardiovascular disease in a cohort study of 0.5 million Chinese adults. Heart 2018, 104, 1756–1763. [Google Scholar] [CrossRef]
- Verges, B. Pathophysiology of diabetic dyslipidaemia: Where are we? Diabetologia 2015, 58, 886–899. [Google Scholar] [CrossRef]
- Ertel, N.H. Diabetes and cholesterol metabolism: The succinate hypothesis. Diabetes Care 2003, 26, 549–550. [Google Scholar] [CrossRef][Green Version]


| Blacks, n = 47,789 | Whites, n = 20,360 | Chinese, n = 134,280 | |
|---|---|---|---|
| Age, years | 50.0 (45.0–56.0) | 52.0 (46.0–59.0) | 51.0 (45.0–61.0) |
| Men, % | 41.5 | 39.9 | 45.5 |
| Educational attainment, % | |||
| <High school graduation | 31.1 | 23.3 | 50.2 |
| High school graduation | 34.0 | 32.0 | 31.6 |
| Some college | 24.9 | 25.9 | 10.4 |
| ≥University degree | 10.0 | 18.8 | 7.8 |
| Cohort-specific income level 2, % | |||
| Low | 59.6 | 47.4 | 14.4 |
| Lower-middle | 22.4 | 18.5 | 40.3 |
| Upper-middle | 12.7 | 16.5 | 31.3 |
| High | 5.4 | 17.6 | 14.0 |
| Married, % | 29.4 | 49.2 | 92.8 |
| Smoking status, % | |||
| Never smoker | 37.4 | 33.5 | 66.8 |
| Former smoker | 19.9 | 27.7 | 5.2 |
| Current smoker | 42.7 | 38.8 | 28.0 |
| Smoking pack-years, among ever-smokers | 14.1 (6.8–25.0) | 26.3 (13.0–42.3) | 21.6 (12.3–31.5) |
| Alcohol consumption 3, % | |||
| None | 45.2 | 49.2 | 83.9 |
| Moderate drinking | 35.4 | 38.0 | 9.9 |
| Heavy drinking | 19.4 | 12.8 | 6.2 |
| Total physical activity, MET-hours/week | 124.8 (64.4–218.4) | 120.4 (63.0–208.2) | 78.9 (51.1–111.7) |
| Body mass index, kg/m2 | 29.3 (25.1–34.7) | 28.7 (24.7–33.8) | 23.7 (21.6–25.9) |
| Menopause, among women, % | 64.1 | 74.3 | 49.2 |
| HRT, among women, % | 7.8 | 13.9 | 2.1 |
| Medical conditions at baseline, % | |||
| Diabetes | 22.0 | 19.2 | 5.2 |
| Hypertension | 57.4 | 48.2 | 27.1 |
| Dyslipidemia | 29.5 | 40.8 | 1.9 |
| Coronary heart disease | 5.6 | 9.2 | 6.4 |
| Stroke | 6.0 | 6.6 | 2.3 |
| Dietary factors | |||
| Total energy, kcal/day | 2301 (1566–3457) | 1988 (1435–2800) | 1728 (1469–2038) |
| Dietary cholesterol intake, mg/day | 321.1 (197.7–511.5) | 248.5 (162.0–389.4) | 290.9 (188.2–399.8) |
| Cholesterol from eggs | 91.5 (21.4–183.1) | 38.6 (22.5–118.5) | 106.3 (53.1–186.0) |
| Cholesterol from non-egg sources | 219.3 (140.2–346.6) | 175.8 (118.8–266.4) | 177.4 (123.8–241.4) |
| No. of eggs per week | 3.4 (0.8–6.9) | 1.5 (0.9–4.5) | 4.0 (2.0–7.0) |
| Healthy Eating Index | 57.4 (49.4–65.7) | 56.8 (48.0–66.2) | 34.0 (30.7–36.7) |
| Outcomes | |||
| Follow-up, years | 12.0 (10.0–14.0) | 12.0 (9.0–13.0) | 15.5 (12.7–18.8) |
| Deaths, n (per 100,000 person years) | 9849 (1782.0) | 4347 (1977.4) | 16,703 (805.9) |
| Cardiometabolic disease | 3917 (708.7) | 1432 (651.4) | 6764 (326.4) |
| Cardiovascular disease | 3282 (593.8) | 1253 (570.0) | 5846 (282.1) |
| Coronary heart disease | 1179 (213.3) | 595 (270.7) | 2182 (105.3) |
| Stroke | 557 (100.8) | 142 (64.6) | 2955 (142.6) |
| Diabetes | 635 (114.9) | 179 (81.4) | 918 (44.3) |
| Blacks, n = 47,789 | Whites, n = 20,360 | Chinese, n = 134,280 | |
|---|---|---|---|
| HR (95% CI) 1 | HR (95% CI) 1 | HR (95% CI) 1,2 | |
| All causes | |||
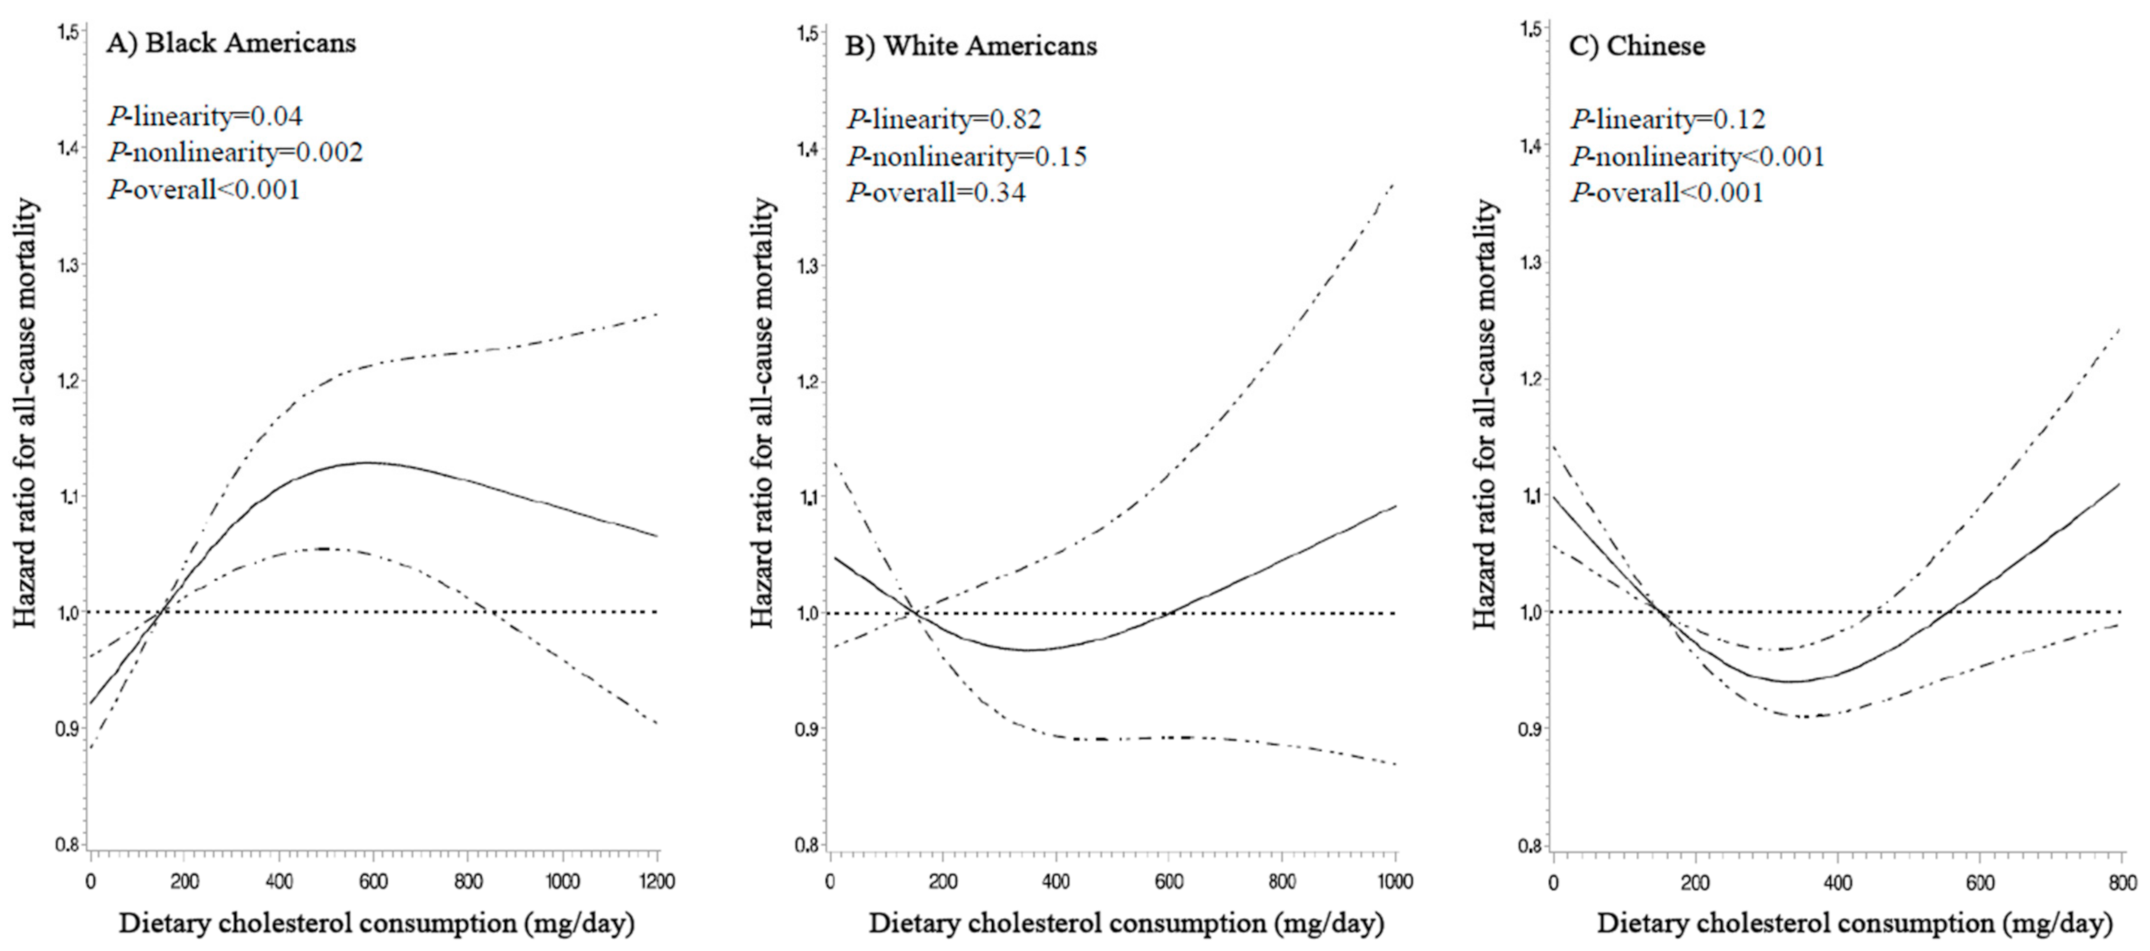
| 150 mg/day | 1 (reference) | 1 (reference) | 1 (reference) |
| 300 mg/day | 1.07 (1.03–1.11) | 0.97 (0.91–1.03) | 0.94 (0.92–0.97) |
| 450 mg/day | 1.12 (1.05–1.19) | 0.97 (0.89–1.06) | 0.96 (0.92–1.00) |
| 600 mg/day | 1.13 (1.05–1.21) | 1.00 (0.89–1.12) | 1.02 (0.95–1.09) |
| 750 mg/day | 1.12 (1.02–1.22) | 1.03 (0.89–1.20) | 1.09 (0.98–1.20) |
| P-linearity 3 | 0.04 | 0.82 | 0.12 |
| P-nonlinearity 4 | 0.002 | 0.15 | <0.001 |
| P-overall 5 | <0.001 | 0.34 | <0.001 |
| Cardiometabolic disease | |||
| 150 mg/day | 1 (reference) | 1 (reference) | 1 (reference) |
| 300 mg/day | 1.10 (1.03–1.16) | 0.97 (0.87–1.08) | 0.91 (0.87–0.95) |
| 450 mg/day | 1.17 (1.06–1.28) | 1.02 (0.87–1.19) | 0.90 (0.85–0.96) |
| 600 mg/day | 1.21 (1.08–1.36) | 1.12 (0.92–1.36) | 0.94 (0.85–1.05) |
| 750 mg/day | 1.23 (1.07–1.42) | 1.25 (0.97–1.62) | 0.99 (0.84–1.17) |
| P-linearity 3 | 0.007 | 0.13 | 0.003 |
| P-nonlinearity 4 | 0.07 | 0.06 | 0.001 |
| P-overall 5 | 0.005 | 0.05 | <0.001 |
| Coronary heart disease | |||
| 150 mg/day | 1 (reference) | 1 (reference) | 1 (reference) |
| 300 mg/day | 1.03 (0.92–1.14) | 1.10 (0.93–1.29) | 0.96 (0.89–1.04) |
| 450 mg/day | 1.05 (0.88–1.24) | 1.23 (0.96–1.56) | 0.98 (0.87–1.10) |
| 600 mg/day | 1.06 (0.85–1.30) | 1.39 (1.03–1.89) | 1.02 (0.85–1.24) |
| 750 mg/day | 1.06 (0.82–1.37) | 1.59 (1.07–2.36) | 1.07 (0.80–1.44) |
| P-linearity 3 | 0.69 | 0.02 | 0.75 |
| P-nonlinearity 4 | 0.73 | 0.74 | 0.26 |
| P-overall 5 | 0.87 | 0.08 | 0.51 |
| Stroke | |||
| 150 mg/day | 1 (reference) | 1 (reference) | 1 (reference) |
| 300 mg/day | 1.09 (0.94–1.28) | 0.91 (0.65–1.26) | 0.85 (0.80–0.91) |
| 450 mg/day | 1.17 (0.91–1.50) | 0.89 (0.54–1.45) | 0.81 (0.73–0.89) |
| 600 mg/day | 1.23 (0.90–1.67) | 0.91 (0.46–1.77) | 0.81 (0.68–0.97) |
| 750 mg/day | 1.27 (0.88–1.84) | 0.94 (0.37–2.36) | 0.82 (0.63–1.07) |
| P-linearity 3 | 0.23 | 0.78 | <0.001 |
| P-nonlinearity 4 | 0.42 | 0.84 | <0.001 |
| P-overall 5 | 0.59 | 0.61 | 0.01 |
| Diabetes | |||
| 150 mg/day | 1 (reference) | 1 (reference) | 1 (reference) |
| 300 mg/day | 1.21 (1.04–1.40) | 0.88 (0.65–1.19) | 1.00 (0.89–1.12) |
| 450 mg/day | 1.36 (1.07–1.73) | 0.81 (0.51–1.28) | 1.04 (0.87–1.23) |
| 600 mg/day | 1.44 (1.07–1.95) | 0.77 (0.42–1.41) | 1.10 (0.83–1.45) |
| 750 mg/day | 1.47 (1.01–2.14) | 0.74 (0.33–1.66) | 1.16 (0.76–1.78) |
| P-linearity 3 | 0.05 | 0.42 | 0.65 |
| P-nonlinearity 4 | 0.10 | 0.70 | 0.60 |
| P-overall 5 | 0.04 | 0.67 | 0.79 |
| Blacks, n = 47,789 | Whites, n = 20,360 | Chinese, n = 134,280 | |
|---|---|---|---|
| HR (95% CI) 1 | HR (95% CI) 1 | HR (95% CI) 1,2 | |
| All causes | |||
| 1 egg/week | 1 (reference) | 1 (reference) | 1 (reference) |
| 3 eggs/week | 1.04 (1.01–1.06) | 1.01 (0.97–1.05) | 0.95 (0.93–0.98) |
| 5 eggs/week | 1.06 (1.02–1.10) | 1.02 (0.96–1.08) | 0.96 (0.92–0.99) |
| 7 eggs/week | 1.07 (1.02–1.12) | 1.03 (0.97–1.10) | 0.99 (0.96–1.03) |
| 10 eggs/week | 1.07 (1.02–1.12) | 1.05 (0.97–1.14) | 1.06 (1.01–1.11) |
| P-linearity 3 | 0.02 | 0.23 | 0.09 |
| P-nonlinearity 4 | 0.05 | 0.88 | <0.001 |
| P-overall 5 | 0.01 | 0.48 | <0.001 |
| Cardiometabolic disease | |||
| 1 egg/week | 1 (reference) | 1 (reference) | 1 (reference) |
| 3 eggs/week | 1.01 (0.97–1.05) | 0.96 (0.89–1.04) | 0.95 (0.91–0.99) |
| 5 eggs/week | 1.03 (0.96–1.09) | 0.97 (0.87–1.08) | 0.95 (0.90–1.00) |
| 7 eggs/week | 1.04 (0.97–1.12) | 1.02 (0.91–1.14) | 0.98 (0.92–1.03) |
| 10 eggs/week | 1.07 (0.99–1.15) | 1.14 (1.00–1.30) | 1.03 (0.95–1.11) |
| P-linearity 3 | 0.07 | 0.07 | 0.78 |
| P-nonlinearity4 | 0.88 | 0.05 | 0.008 |
| P-overall 5 | 0.18 | 0.03 | 0.03 |
| Coronary heart disease | |||
| 1 egg/week | 1 (reference) | 1 (reference) | 1 (reference) |
| 3 eggs/week | 1.05 (0.97–1.13) | 1.00 (0.89–1.12) | 0.96 (0.90–1.04) |
| 5 eggs/week | 1.07 (0.95–1.20) | 1.03 (0.87–1.21) | 0.97 (0.88–1.07) |
| 7 eggs/week | 1.06 (0.93–1.21) | 1.08 (0.91–1.28) | 1.01 (0.92–1.12) |
| 10 eggs/week | 1.01 (0.88–1.16) | 1.20 (0.98–1.47) | 1.08 (0.95–1.24) |
| P-linearity 3 | 0.85 | 0.09 | 0.34 |
| P-nonlinearity 4 | 0.16 | 0.44 | 0.15 |
| P-overall 5 | 0.36 | 0.18 | 0.22 |
| Stroke | |||
| 1 egg/week | 1 (reference) | 1 (reference) | 1 (reference) |
| 3 eggs/week | 1.01 (0.90–1.12) | 0.93 (0.73–1.19) | 0.94 (0.88–1.00) |
| 5 eggs/week | 1.02 (0.86–1.20) | 0.96 (0.69–1.34) | 0.91 (0.84–0.99) |
| 7 eggs/week | 1.03 (0.85–1.24) | 1.07 (0.75–1.51) | 0.91 (0.84–0.99) |
| 10 eggs/week | 1.05 (0.86–1.28) | 1.34 (0.89–2.02) | 0.92 (0.81–1.03) |
| P-linearity 3 | 0.58 | 0.20 | 0.08 |
| P-nonlinearity 4 | 0.92 | 0.25 | 0.18 |
| P-overall 5 | 0.86 | 0.22 | 0.09 |
| Diabetes | |||
| 1 egg/week | 1 (reference) | 1 (reference) | 1 (reference) |
| 3 eggs/week | 1.05 (0.95–1.16) | 0.93 (0.75–1.15) | 0.99 (0.88–1.11) |
| 5 eggs/week | 1.10 (0.93–1.29) | 0.91 (0.67–1.22) | 1.02 (0.88–1.19) |
| 7 eggs/week | 1.13 (0.95–1.35) | 0.91 (0.66–1.24) | 1.09 (0.93–1.27) |
| 10 eggs/week | 1.18 (0.97–1.42) | 0.93 (0.63–1.38) | 1.20 (0.99–1.46) |
| P-linearity 3 | 0.10 | 0.68 | 0.08 |
| P-nonlinearity 4 | 0.75 | 0.61 | 0.37 |
| P-overall 5 | 0.24 | 0.81 | 0.14 |
Publisher’s Note: MDPI stays neutral with regard to jurisdictional claims in published maps and institutional affiliations. |
© 2021 by the authors. Licensee MDPI, Basel, Switzerland. This article is an open access article distributed under the terms and conditions of the Creative Commons Attribution (CC BY) license (https://creativecommons.org/licenses/by/4.0/).
Share and Cite
Pan, X.-F.; Yang, J.-J.; Lipworth, L.P.; Shu, X.-O.; Cai, H.; Steinwandel, M.D.; Blot, W.J.; Zheng, W.; Yu, D. Cholesterol and Egg Intakes with Cardiometabolic and All-Cause Mortality among Chinese and Low-Income Black and White Americans. Nutrients 2021, 13, 2094. https://doi.org/10.3390/nu13062094
Pan X-F, Yang J-J, Lipworth LP, Shu X-O, Cai H, Steinwandel MD, Blot WJ, Zheng W, Yu D. Cholesterol and Egg Intakes with Cardiometabolic and All-Cause Mortality among Chinese and Low-Income Black and White Americans. Nutrients. 2021; 13(6):2094. https://doi.org/10.3390/nu13062094
Chicago/Turabian StylePan, Xiong-Fei, Jae-Jeong Yang, Loren P. Lipworth, Xiao-Ou Shu, Hui Cai, Mark D. Steinwandel, William J. Blot, Wei Zheng, and Danxia Yu. 2021. "Cholesterol and Egg Intakes with Cardiometabolic and All-Cause Mortality among Chinese and Low-Income Black and White Americans" Nutrients 13, no. 6: 2094. https://doi.org/10.3390/nu13062094
APA StylePan, X.-F., Yang, J.-J., Lipworth, L. P., Shu, X.-O., Cai, H., Steinwandel, M. D., Blot, W. J., Zheng, W., & Yu, D. (2021). Cholesterol and Egg Intakes with Cardiometabolic and All-Cause Mortality among Chinese and Low-Income Black and White Americans. Nutrients, 13(6), 2094. https://doi.org/10.3390/nu13062094