
Salt Reduction Initiatives in the Eastern Mediterranean Region and Evaluation of Progress towards the 2025 Global Target: A Systematic Review

 , ,
, ,  ,
,
Abstract
:1. Introduction
2. Materials and Methods
2.1. Search Strategy
2.2. Inclusion and Exclusion Criteria
2.3. Data Extraction
2.4. Seeking Supplementary Information
2.5. Analysis
3. Results
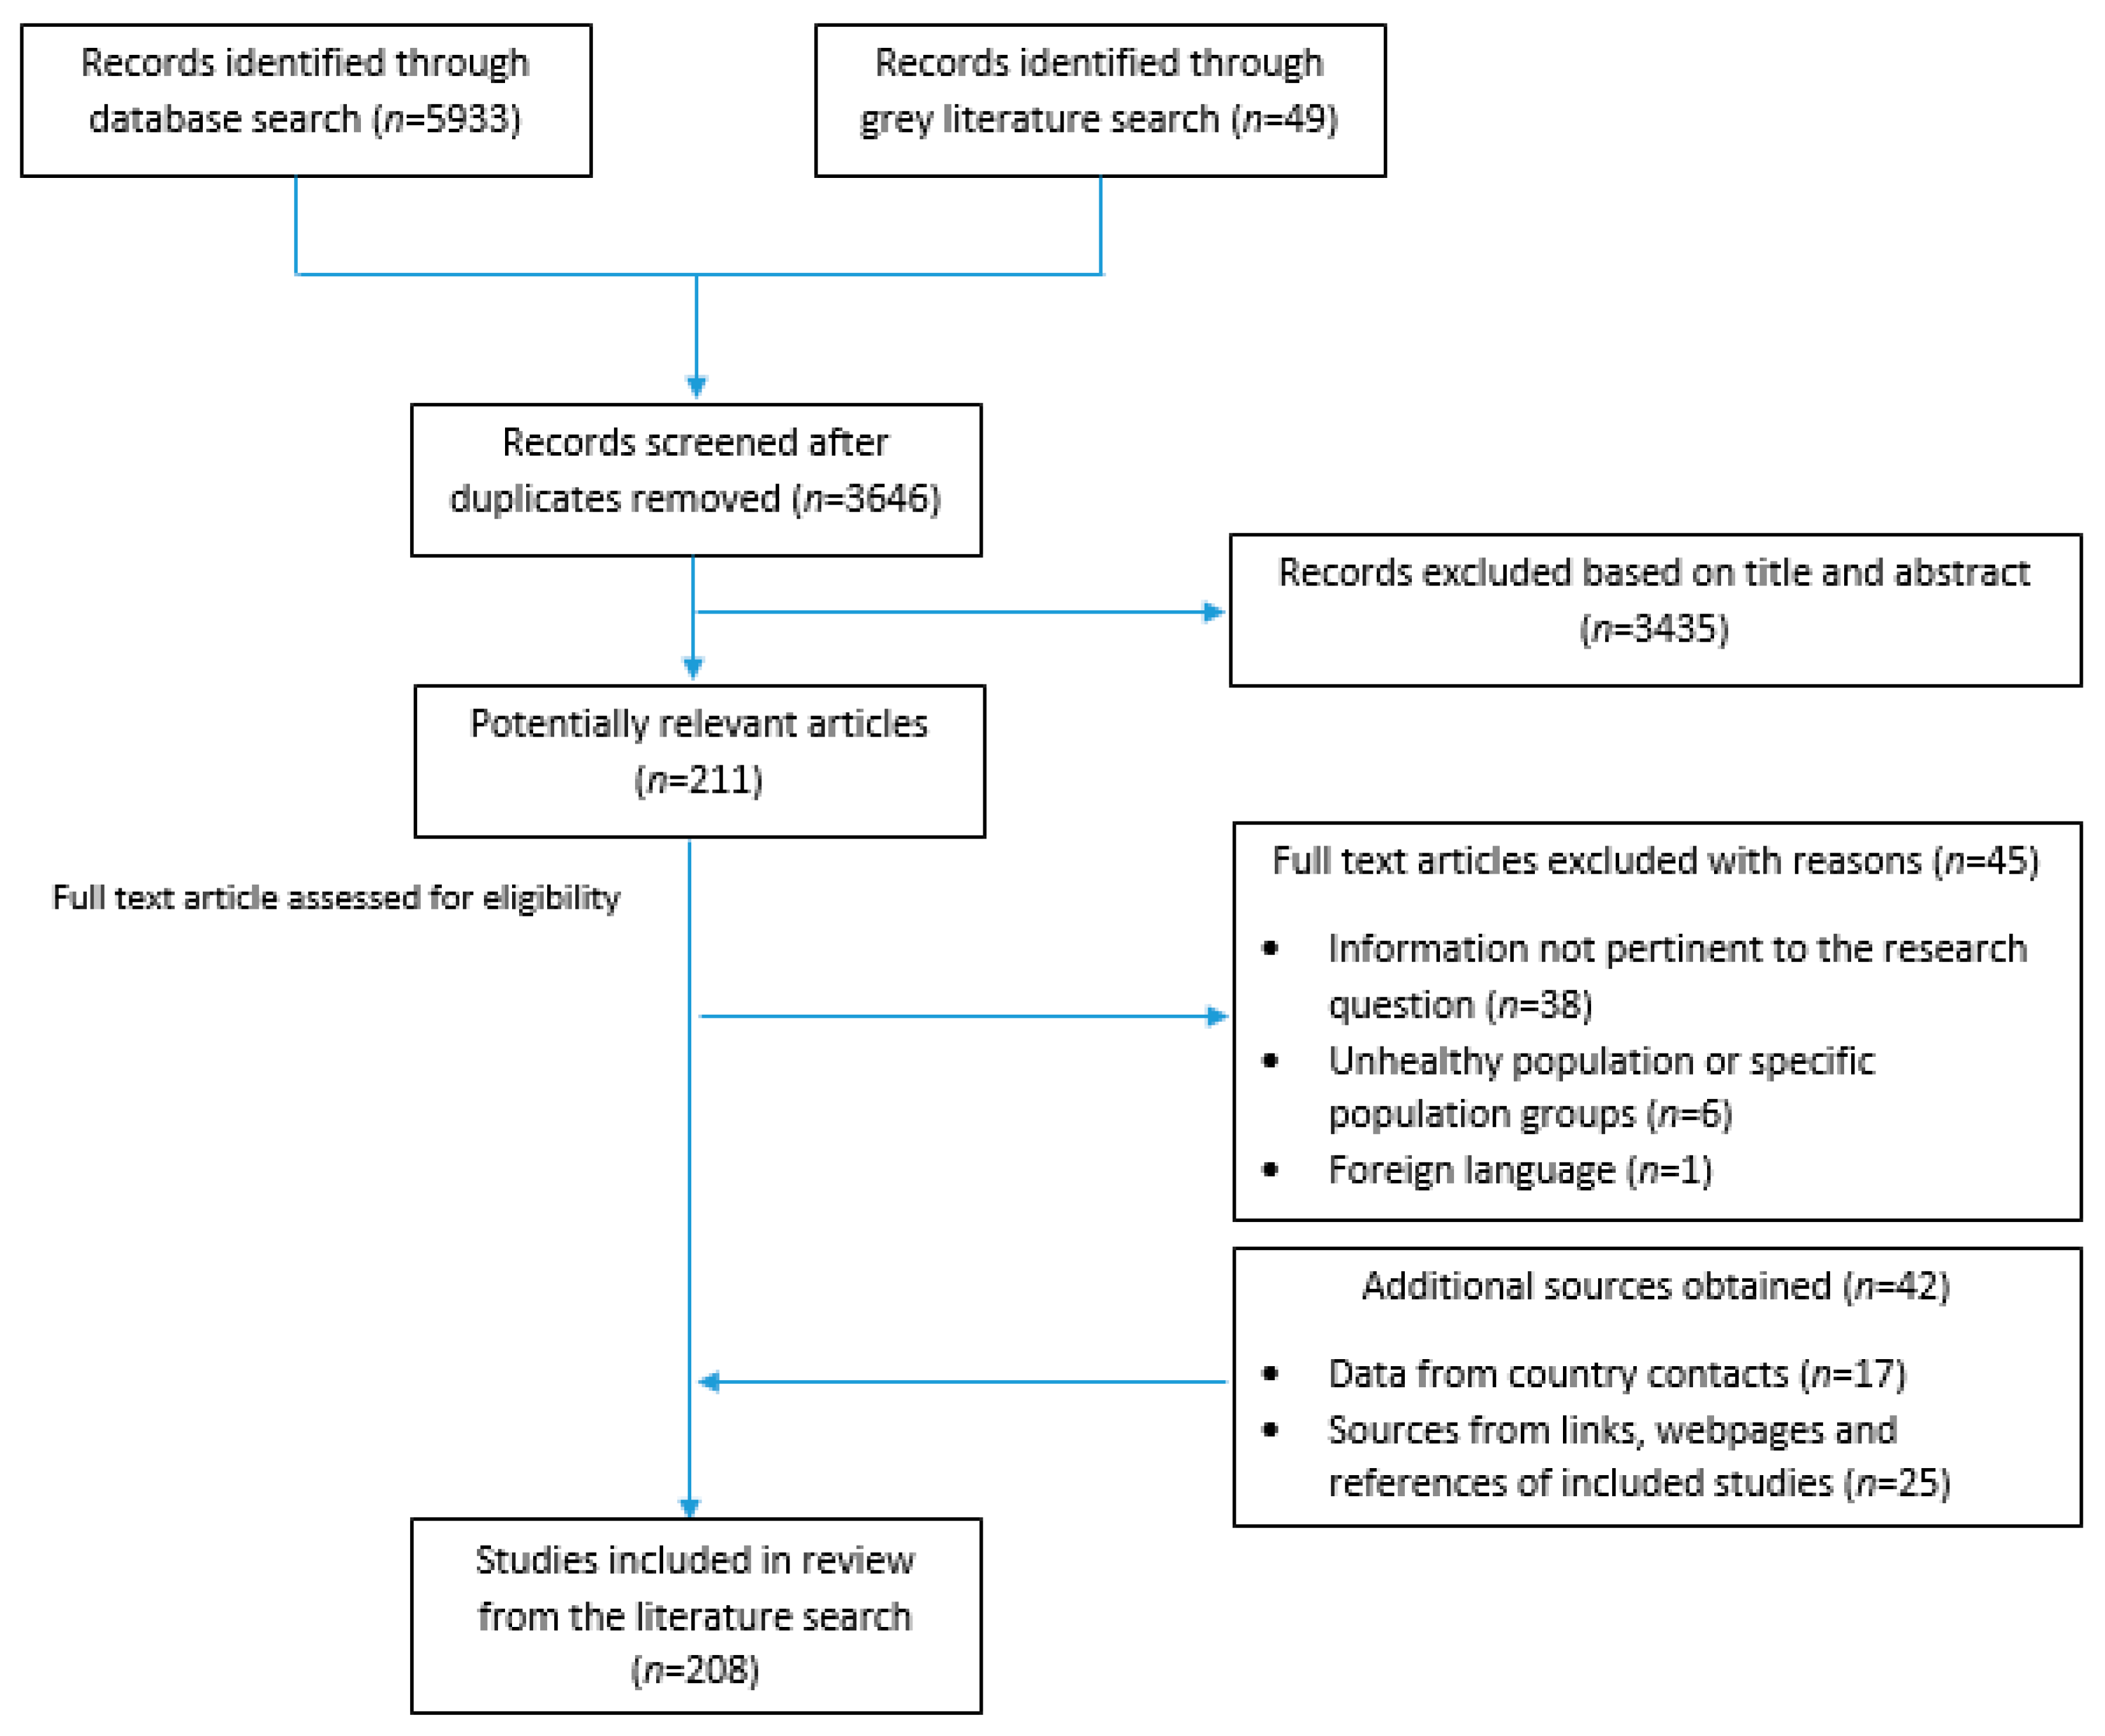
3.1. Search Results
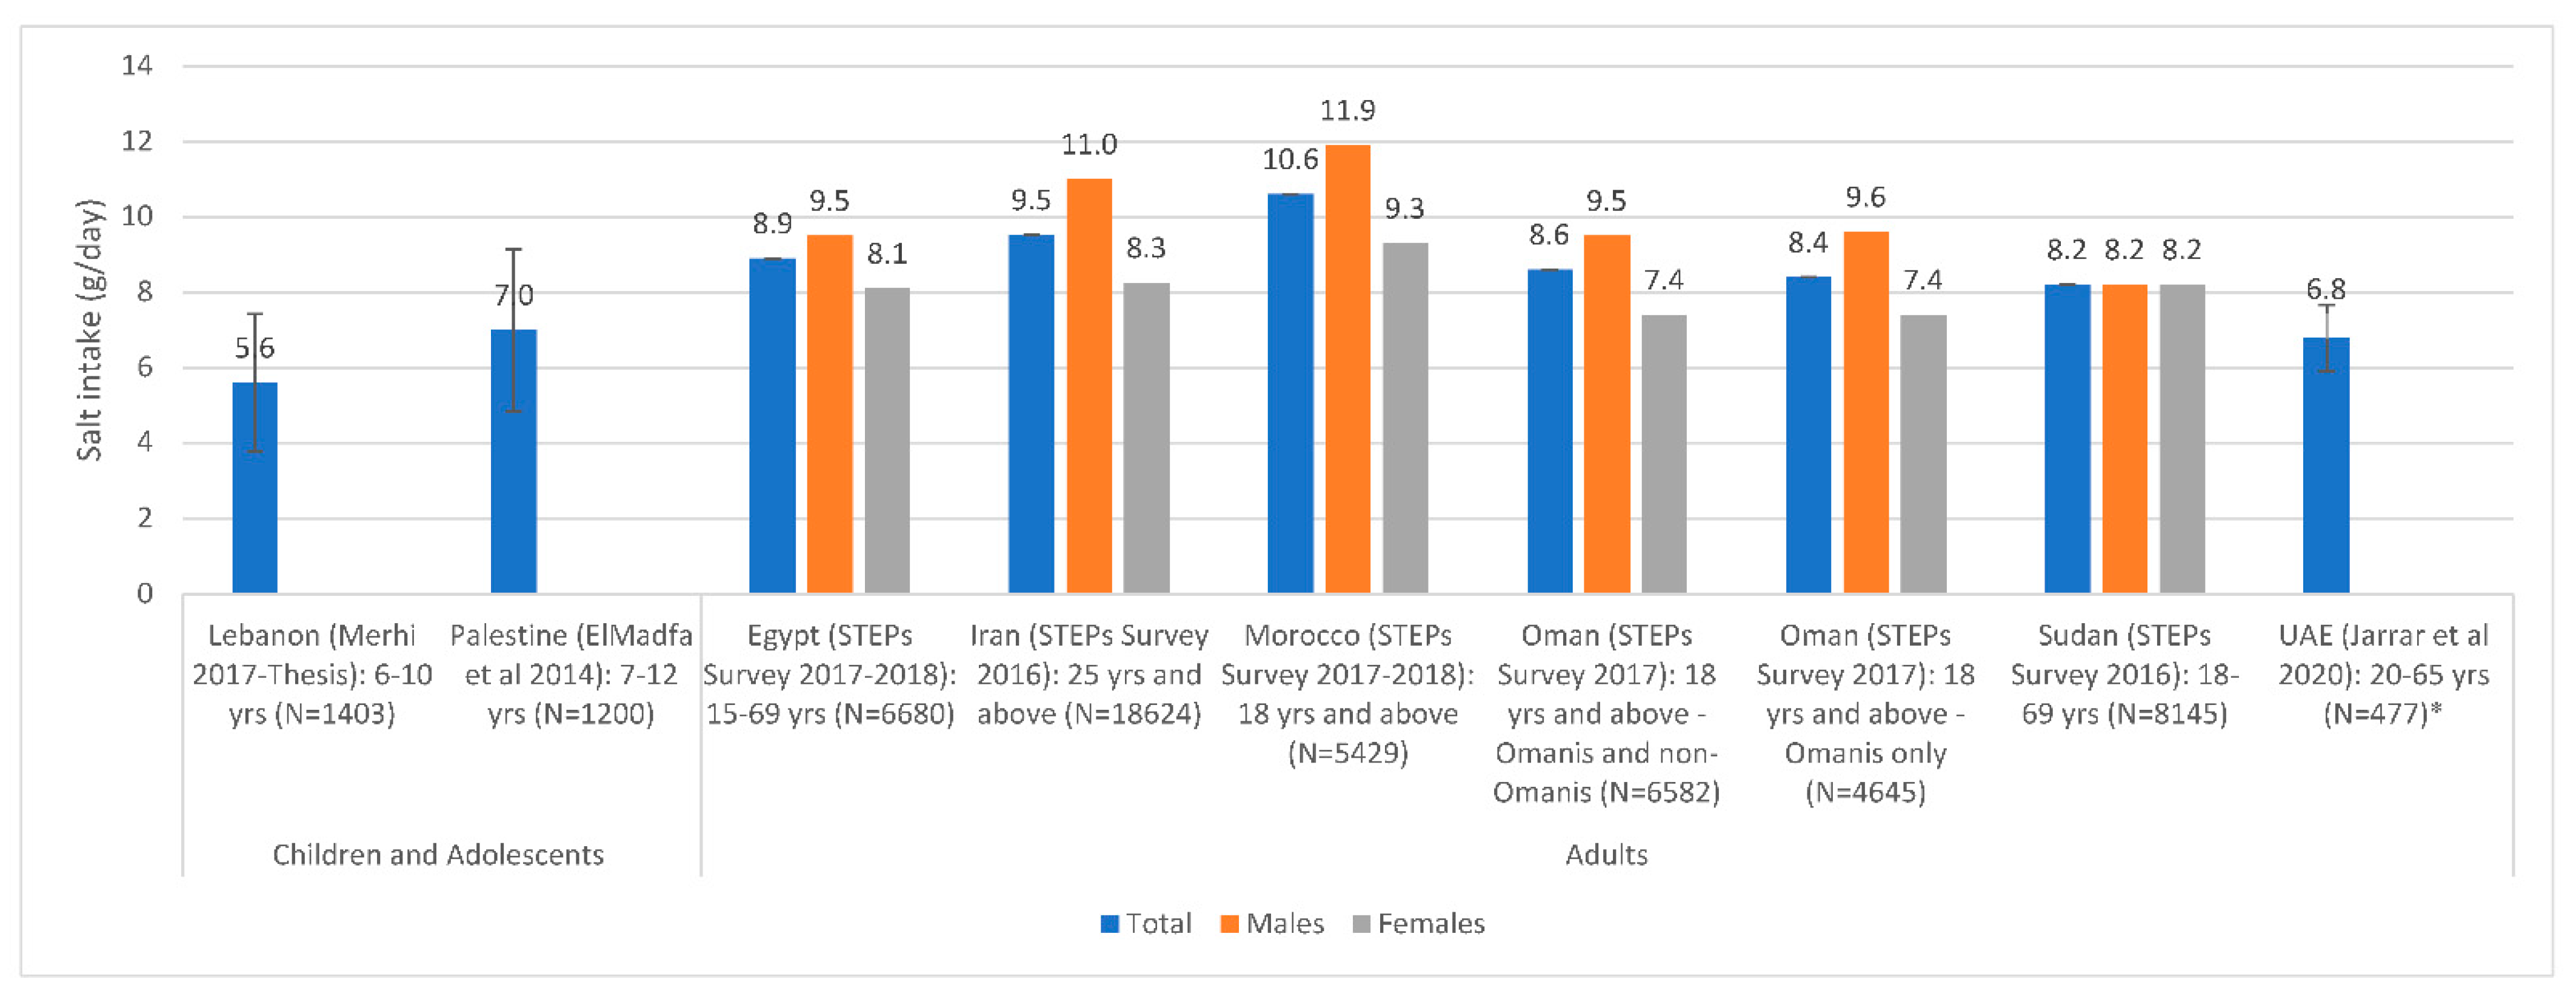
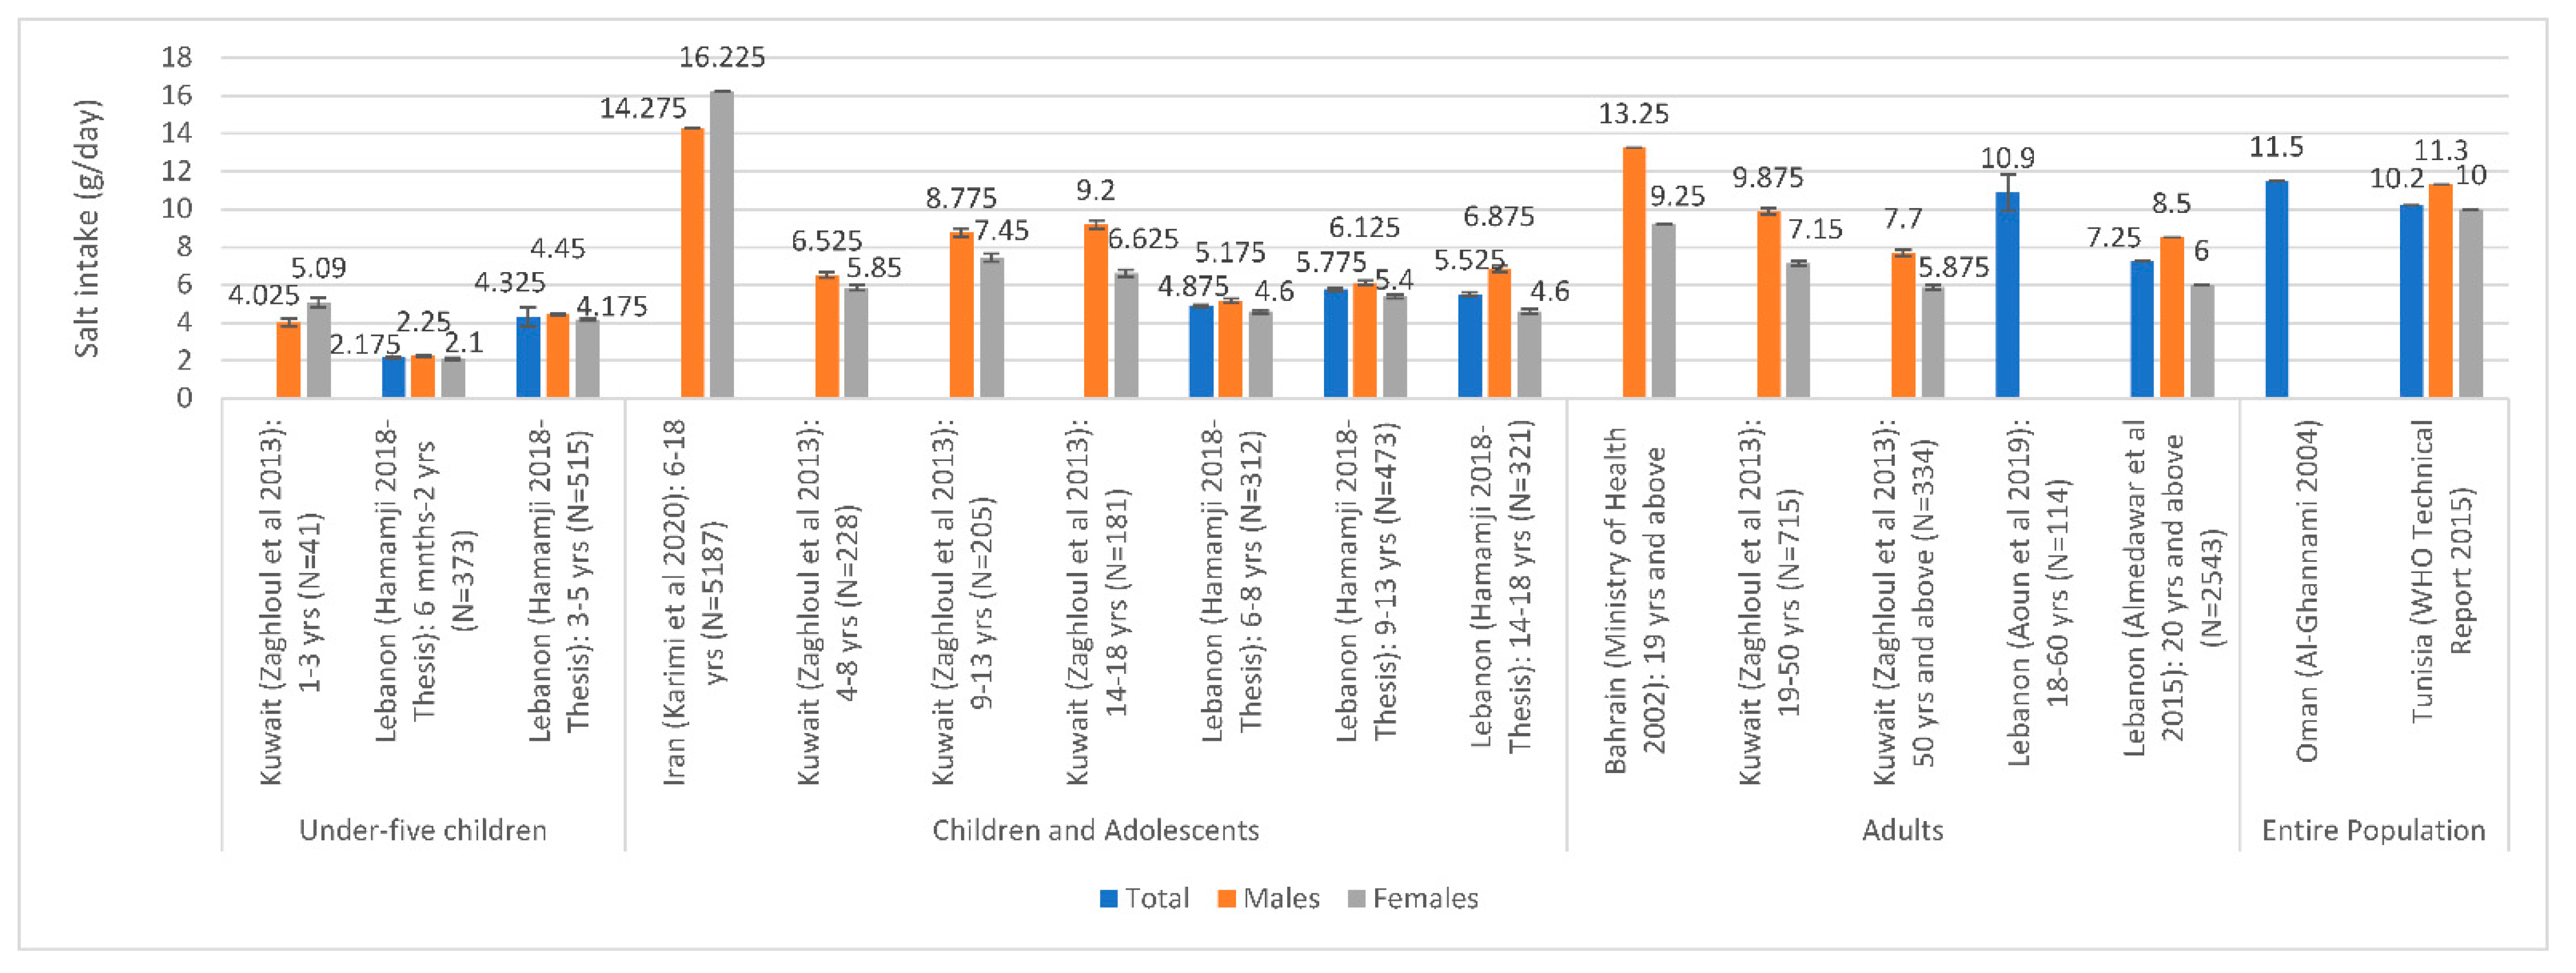
3.2. Salt Intake Assessment
3.3. Assessment of Salt Levels in Food and Salt-Related KAB
3.4. Countries with National Salt Reduction Strategies
3.5. Leadership and Strategic Approach
3.6. Implementation Strategies
3.6.1. Reformulation
3.6.2. Consumer Education
3.6.3. Front of Pack Labelling
3.6.4. Interventions in Specific Settings
3.7. Monitoring
3.8. Impact Assessment
4. Discussion
5. Conclusions
Supplementary Materials
Author Contributions
Funding
Institutional Review Board Statement
Informed Consent Statement
Data Availability Statement
Conflicts of Interest
Abbreviations
Appendix A

| Salt | salt* OR *sodium OR Na OR NaCl OR MSG |
| AND | |
| Reduction | reduce* OR reduction* OR reducing OR decreas* OR limit OR limits OR limitation* OR limiting OR restrict* OR reformulat* OR low* |
| OR | |
| Intake | consumption OR consuming OR consume OR consumes OR intake* OR food* OR nutrition OR diet* OR urinary OR excret* |
| AND | |
| Strategy/policy | standard* OR polic* OR initiative* OR tax* OR program* OR regulation* OR strateg* OR guideline* OR practice* OR legislat* OR action* OR plan OR plans OR intervention* |
| AND | |
| EMR | Afghan* OR Bahrain* OR Iran* OR Persia* OR Iraq* OR Jordan* OR Kuwait* OR Lebanon* OR Lebanese OR Libya* OR Oman* OR Palestin* OR Gaza* OR “West Bank” OR Qatar* OR Saud* OR KSA OR Syria* OR Tunis* OR “United Arab Emirate*” OR UAE OR Djibouti* OR Egypt* OR Morocc* OR Pakistan* OR Somal* OR Sudan* OR Yemen* OR Levant* OR “East* Mediterranean” OR Gulf OR GCC OR Arab OR Arabia OR Arabs OR EMR OR “Middle East*” OR MENA OR “North* Africa*” OR “East* Africa*” OR “Near East*” OR “Abu Dhabi” OR Dubai OR Ajman OR Fujaira* OR Sharja* OR *Khaima* OR *Qaiwain OR *Quwain |
References
- World Health Organization. Cardiovascular Diseases. Available online: https://www.who.int/health-topics/cardiovascular-diseases#tab=tab_1 (accessed on 25 January 2021).
- The World Medical Association. WMA. Statement on Hypertension and Cardiovascular Disease. Adopted by the 71st WMA General Assembly (Online); The World Medical Association: Cordoba, Spain, 2020; Available online: https://www.wma.net/policies-post/wma-statement-on-hypertension-and-cardiovascular-disease/ (accessed on 25 January 2021).
- He, F.J.; Li, J.; MacGregor, G.A. Effect of longer-term modest salt reduction on blood pressure. Cochrane Database Syst. Rev. 2013. [Google Scholar] [CrossRef]
- Global Burden of Disease 2017 Risk Factor Collaborators. Global, regional, and national comparative risk assessment of 84 behavioural, environmental and occupational, and metabolic risks or clusters of risks for 195 countries and territories, 1990–2017: A systematic analysis for the global burden of disease study 2017. Lancet 2018, 392, 1923–1994. [Google Scholar]
- World Health Organization. Global Status Report on Noncommunicable Diseases 2010; World Health Organization: Geneva, Switzerland, 2010; Available online: https://apps.who.int/iris/bitstream/handle/10665/44579/9789240686458_eng.pdf;jsessionid=7959C23C4871A39C6BD04E2EC915B66D?sequence=1 (accessed on 25 January 2021).
- Mente, A.; O’Donnell, M.J.; Rangarajan, S.; McQueen, M.J.; Poirier, P.; Wielgosz, A.; Morrison, H.; Li, W.; Wang, X.; Di, C. Association of urinary sodium and potassium excretion with blood pressure. N. Engl. J. Med. 2014, 371, 601–611. [Google Scholar] [CrossRef] [PubMed] [Green Version]
- O’Donnell, M.; Mente, A.; Rangarajan, S.; McQueen, M.J.; Wang, X.; Liu, L.; Yan, H.; Lee, S.F.; Mony, P.; Devanath, A. Urinary sodium and potassium excretion, mortality, and cardiovascular events. N. Engl. J. Med. 2014, 371, 612–623. [Google Scholar] [CrossRef] [PubMed] [Green Version]
- Campbell, N.; Lackland, D.T.; Niebylski, M.L.; Nilsson, P.M. Is reducing dietary sodium controversial? Is it the conduct of studies with flawed research methods that is controversial? A perspective from the World Hypertension League Executive Committee. J. Clin. Hypertens. 2014, 17, 85–86. [Google Scholar] [CrossRef] [Green Version]
- Alderman, M.H. Sodium and cardiovascular disease. N. Engl. J. Med. 2014, 371, 2137. [Google Scholar] [CrossRef]
- Trieu, K.; Neal, B.; Hawkes, C.; Dunford, E.; Campbell, N.; Rodriguez-Fernandez, R.; Legetic, B.; McLaren, L.; Barberio, A.; Webster, J. Salt reduction initiatives around the world–a systematic review of progress towards the global target. PLoS ONE 2015, 10, e0130247. [Google Scholar] [CrossRef] [PubMed] [Green Version]
- Milajerdi, A.; Djafarian, K.; Shab-Bidar, S. Dose–response association of dietary sodium intake with all-cause and cardiovascular mortality: A systematic review and meta-analysis of prospective studies. Public. Health Nutr. 2019, 22, 295–306. [Google Scholar] [CrossRef]
- Sadler, K.; Nicholson, S.; Steer, T.; Gill, V.; Bates, B.; Tipping, S. National Diet & Nutrition Survey—Assessment of Dietary Sodium in Adults (Aged 19 to 64 Years) in England, 2011; Department of Health: London, UK, 2011; Available online: https://assets.publishing.service.gov.uk/government/uploads/system/uploads/attachment_data/file/213420/Sodium-Survey-England-2011_Text_to-DH_FINAL1.pdf (accessed on 27 January 2021).
- He, F.J.; Pombo-Rodrigues, S.; MacGregor, G.A. Salt reduction in England from 2003 to 2011: Its relationship to blood pressure, stroke and ischaemic heart disease mortality. BMJ Open 2014, 4, e004549. [Google Scholar] [CrossRef] [Green Version]
- World Health Organization. Noncommunicable Diseases: Campaign for Action—Meeting the NCD Targets. Available online: https://www.who.int/beat-ncds/take-action/targets/en/ (accessed on 25 January 2021).
- World Health Organization. Noncommunicable Diseases and Mental Health. NCD Global Monitoring Framework. Available online: https://www.who.int/nmh/global_monitoring_framework/en/ (accessed on 25 January 2021).
- United Nations Statistics Division. Sustainable Development Goals. SDG Indicators. Available online: https://unstats.un.org/sdgs/metadata/?Text=&Goal=3&Target=3.4 (accessed on 25 January 2021).
- World Development Indicators Database. Gross National Income per Capita 2015, Atlas Method and PPP. Available online: https://databank.worldbank.org/data/download/GNIPC.pdf (accessed on 25 January 2021).
- Global Burden of Disease 2015 Eastern Mediterranean Region Cardiovascular Disease Collaborators. Burden of cardiovascular diseases in the Eastern Mediterranean Region, 1990–2015: Findings from the Global Burden of Disease 2015 study. Int. J. Public Health 2017, 63, 137–149. [Google Scholar]
- Al-Jawaldeh, A.; Hammerich, A.; Doggui, R.; Engesveen, K.; Lang, K.; McColl, K. Implementation of WHO recommended policies and interventions on healthy diet in the countries of the eastern mediterranean region: From policy to action. Nutrients 2020, 12, 3700. [Google Scholar] [CrossRef]
- World Health Organization Regional Office for the Eastern Mediterranean. Regional Strategy on Nutrition 2010–2019 and Plan of Action; World Health Organization: Cairo, Egypt, 2011; Available online: https://apps.who.int/iris/handle/10665/116694 (accessed on 27 January 2021).
- World Health Organization Regional Office for the Eastern Mediterranean. Strategy on Nutrition for the Eastern Mediterranean Region 2020–2030; World Health Organization: Cairo, Egypt, 2019; Available online: https://applications.emro.who.int/docs/9789290222996-eng.pdf (accessed on 27 January 2021).
- Santos, J.A.; Tekle, D.; Rosewarne, E.; Flexner, N.; Cobb, L.; Al-Jawaldeh, A.; Kim, W.J.; Breda, J.; Whiting, S.; Campbell, N. A Systematic Review of Salt Reduction Initiatives around the World: A Midterm Evaluation of Progress Towards the 2025 Global Non-Communicable Diseases Salt Reduction Target. Adv. Nutr. 2021. [Google Scholar] [CrossRef]
- Webster, J.L.; Dunford, E.K.; Hawkes, C.; Neal, B.C. Salt reduction initiatives around the world. J. Hypertens. 2011, 29, 1043–1050. [Google Scholar] [CrossRef] [PubMed]
- Powles, J.; Fahimi, S.; Micha, R.; Khatibzadeh, S.; Shi, P.; Ezzati, M.; Engell, R.E.; Lim, S.S.; Danaei, G.; Mozaffarian, D. Global, regional and national sodium intakes in 1990 and 2010: A systematic analysis of 24 h urinary sodium excretion and dietary surveys worldwide. BMJ Open 2013, 3, e003733. [Google Scholar] [CrossRef] [Green Version]
- Abdul Wahab, A.; Moosa, K.; Gharib, N.; Al-Sairafi, M.; Al-Raees, G.; Al-Amer, M. National Nutrition Survey for Adult Bahrainis Aged 19 Years and Above; Ministry of Health: Manama, Kingdom of Bahrain, 2002; Available online: https://www.semanticscholar.org/paper/NATIONAL-NUTRITION-SURVEY-FOR-ADULT-BAHRAINIS-AGED-Wahab-Sairafi/b5cfd2ef26840b94a1f317300303f5d389c5009e (accessed on 27 January 2021).
- AbdEl Aal, A.; Abdul-Aziz, A.; Zaghloul, S. Construct validity of 24 hour recall estimating accuracy of energy and sodium intake. Egypt J. Nutr. 2018, 33, 1–28. [Google Scholar]
- Brouzes, C.M.C.; Darcel, N.; Tomé, D.; Dao, M.C.; Bourdet-Sicard, R.; Holmes, B.A.; Lluch, A. Urban Egyptian women aged 19–30 years display nutrition transition-like dietary patterns, with high energy and sodium intakes, and insufficient iron, vitamin D., and folate intakes. Curr. Dev. Nutr. 2020, 4. [Google Scholar] [CrossRef] [PubMed]
- Zaghloul, S.; Mogeid, A.-E.; ElAal, A.; Fattah, N. Sources of dietary sodium among Egyptian adults. Egypt. J. Nutr. 2018, 3, 81–91. [Google Scholar]
- Central Agency for Public Mobilization and Statistics; Ministry of Health and Prevention; World Health Organization. Egypt National STEPwise Survey for Noncommunicable Diseases Risk Factors Report 2017. 2018. Available online: https://www.who.int/ncds/surveillance/steps/Egypt_STEPS_Survey_2017_Fact_Sheet.pdf?ua=1 (accessed on 27 January 2021).
- Tayel, D.I.; Amine, A.K.; El-Amina, K. Dietary intake of nutrients related to bone health among Alexandria University female students, Egypt. Food Public Health 2013, 3, 329–335. [Google Scholar]
- World Health Organization Global Database on the Implementation of Nutrition Action (GINA). Policy—Egypt National Multisectoral Action Plan for Prevention and Control of Noncommunicable Diseases (EgyptMAP-NCD)—Egypt. 2017. Available online: https://extranet.who.int/nutrition/gina/en/node/25915 (accessed on 29 January 2021).
- Gholami, A.; Rezaei, S.; Jahromi, L.M.; Baradaran, H.R.; Ghanbari, A.; Djalalinia, S.; Rezaei, N.; Naderimagham, S.; Modirian, M.; Mahmoudi, N.; et al. Is salt intake reduction a universal intervention for both normotensive and hypertensive people: A case from Iran STEPS survey 2016. Eur. J. Nutr. 2020, 59, 3149–3161. [Google Scholar] [CrossRef]
- Rezaei, S.; Mahmoudi, Z.; Sheidaei, A.; Aryan, Z.; Mahmoudi, N.; Gohari, K.; Yoosefi, M.; Hajipour, M.J.; Dilmaghani-Marand, A.; Soleimanzadehkhayat, M.; et al. Salt intake among Iranian population: The first national report on salt intake in Iran. J. Hypertens. 2018, 36, 2380–2389. [Google Scholar] [CrossRef] [PubMed]
- Khosravi, A.; Kelishadi, R.; Sarrafzadegan, N.; Boshtam, M.; Nouri, F.; Zarfeshani, S.; Esmaillzadeh, A. Impact of a community-based lifestyle intervention program on blood pressure and salt intake of normotensive adult population in a developing country. J. Res. Med Sci. Off. J. Isfahan Univ. Med Sci. 2012, 17, 1–7. [Google Scholar]
- Khosravi, A.; Toghianifar, N.; Sarrafzadegan, N.; Gharipour, M.; Azadbakht, L. Salt intake, obesity, and pre-hypertension among iranian adults: A cross-sectional study. Pak. J. Med. Sci. 2012, 28, 297–302. [Google Scholar]
- Ministry of Health and Medical Education; Tehran University of Medical Sciences; National Institute of Health Research-Iran. Atlas of Non-Communicable Diseases Risk- Factors Surviellance in the Islamic Republic of Iran–STEPS 2016. 2016. Available online: https://www.who.int/ncds/surveillance/steps/STEPS_2016_Atlas_EN.pdf?ua=1 (accessed on 29 January 2021).
- Arsang-Jang, S.; Mansourian, M.; Mohammadifard, N.; Khosravi, A.; Oveis-Gharan, S.; Nouri, F.; Sarrafzadegan, N. Temporal trend analysis of stroke and salt intake: A 15-year population-based study. Nutr. Neurosci. 2019. [Google Scholar] [CrossRef]
- Mohammadifard, N.; Khosravi, A.; Salas-Salvadó, J.; Becerra-Tomás, N.; Nouri, F.; Abdollahi, Z.; Jozan, M.; Bahonar, A.; Sarrafzadegan, N. Trend of salt intake measured by 24-hour urine collection samples among Iranian adults population between 1998 and 2013: The Isfahan salt study. Nutr. Metab. Cardiovasc. Dis. 2019, 29, 1323–1329. [Google Scholar] [CrossRef] [PubMed]
- Motlagh, Z.; Mazloomy, S.; Mozaffari Khosravi, H.; Morowatisharifabad, M.; Askarshahi, M. Salt intake among women refer to medical health centers, Yazd, Iran, 2011. SSU J. 2011, 19, 550–560. [Google Scholar]
- Mirzaei, M.; Soltani, M.; Namayandeh, M.; Gharahi Ghehi, N. Sodium and potassium intake of urban dwellers: Nothing changed in Yazd, Iran. J. Health Popul. Nutr. 2014, 32, 111–117. [Google Scholar]
- Emamian, M.H.; Ebrahimi, H.; Hashemi, H.; Fotouhi, A. Salt intake and blood pressure in Iranian children and adolescents: A population-based study. BMC Cardiovasc. Disord. 2021, 21. [Google Scholar] [CrossRef]
- Kelishadi, R.; Gheisari, A.; Zare, N.; Farajian, S.; Shariatinejad, K. Salt intake and the association with blood pressure in young Iranian children: First report from the middle east and North Africa. Int. J. Prev. Med. 2013, 4, 475–483. [Google Scholar]
- Mohammadifard, N.; Khaledifar, A.; Khosravi, A.; Nouri, F.; Pourmoghadas, A.; Feizi, A.; Esmaillzadeh, A.; Sarrafzadegan, N. Dietary sodium and potassium intake and their association with blood pressure in a non-hypertensive Iranian adult population: Isfahan salt study. Nutr. Diet. J. Dietit. Assoc. Aust. 2017, 74, 275–282. [Google Scholar] [CrossRef]
- Rafiei, M.; Boshtam, M.; Sarraf-Zadegan, N.; Seirafian, S. The relation between salt intake and blood pressure among Iranians. Kuwait Med. J. 2008, 40, 191–195. [Google Scholar]
- Karimi, G.; Heidari-Beni, M.; Riahi, R.; Qorbani, M.; Kelishadi, R. Healthy eating index in a nationally representative sample of children and adolescents by socio-demographic characteristics: The Weight disorders survey of the CASPIAN-IV Study. Turk. J. Pediatr. 2020, 62, 930–939. [Google Scholar] [CrossRef]
- Mirmiran, P.; Ziadlou, M.; Karimi, S.; Hosseini-Esfahani, F.; Azizi, F. The association of dietary patterns and adherence to WHO healthy diet with metabolic syndrome in children and adolescents: Tehran lipid and glucose study. BMC Public Health 2019, 19. [Google Scholar] [CrossRef]
- Shahriarpour, Z.; Nasrabadi, B.; Shariati-Bafghi, S.E.; Karamati, M.; Rashidkhani, B. Adherence to the dietary approaches to stop hypertension (DASH) dietary pattern and osteoporosis risk in postmenopausal Iranian women. Osteoporos. Int. 2020, 31, 2179–2188. [Google Scholar] [CrossRef]
- Azizi, F.; Rahmani, M.; Allahverdian, S.; Hedayati, M. Effects of salted food consumption on urinary iodine and thyroid function tests in two provinces in the Islamic Republic of Iran. East. Mediterr. Health J. 2001, 7, 115–120. [Google Scholar] [PubMed]
- Rahmani, M.; Koohkan, A.; Allahverdian, S.; Hedayati, M. Comparison of dietary iodine intake and Urinary excretion in urban and rural Households of Ilam in 2000. Iran. J. Endocrinol. Metab. 2000, 2, 31–37. [Google Scholar]
- Kooshki, A.; Golafrooz, M. Nutrient intakes affecting bone formation compared with dietary reference intake (DRI) in Sabzevar elderly subjects. Pak. J. Nutr. 2009, 8, 218–221. [Google Scholar] [CrossRef]
- Ministry of Health-Iraq; World Health Organization. Noncommunicable Diseases Risk Factors STEPS Survey Iraq 2015. 2015. Available online: https://www.who.int/ncds/surveillance/steps/Iraq_2015_STEPS_Report.pdf?ua=1 (accessed on 8 February 2021).
- Alawwa, I.; Dagash, R.; Saleh, A.; Ahmad, A. Dietary salt consumption and the knowledge, attitudes and behavior of healthy adults: A cross-sectional study from Jordan. Libyan J. Med. 2018, 13. [Google Scholar] [CrossRef] [PubMed]
- Al-Wa’l, T.; Takruri, H. Sodium and potassium intakes in a sample of students and employees in the University of Jordan aged (20–40 years) using 3-day food diaries. Nutr. Food Sci. 2016, 46, 43–50. [Google Scholar] [CrossRef]
- Ministry of Health-Jordan. Jordan National Stepwise Survey (STEPs) for Noncommunicable Diseases Risk Factors 2019. 2020. Available online: https://www.moh.gov.jo/Echobusv3.0/SystemAssets/42e9a4d5-b719-4047-9fb6-c2b60adfee3a.pdf (accessed on 8 February 2021).
- Alkurd, R.A. Estimated intakes of fats, cholesterol, fiber, sodium, calcium, potassium, and magnesium in Jordan. Aust. J. Basic. Appl. Sci. 2011, 5, 3171–3178. [Google Scholar]
- Takruri, H.R.; Alkurd, R.A. Intakes of Fats, Cholesterol, Fiber and Micronutrients as Risk Factors for Cardiovascular Disease in Jordan. Jordan J. Biol. Sci. 2014, 7, 119–126. [Google Scholar] [CrossRef]
- Alkhunaizi, A.M.; Al, J.H.; Al, S.Z. Salt intake in Eastern Saudi Arabia. East. Mediterr. Health J. 2013, 19, 915–918. [Google Scholar] [CrossRef] [PubMed]
- Al-Khathaami, A.; Roaa, A.; Sara, Q.; Azhar, A.; Bashayer, A.; Alaa, A. Evaluation of dietary salt intake among healthy students in Riyadh, Saudi Arabia. J. Health Inform. Dev. Ctries. 2019, 13, 1–13. [Google Scholar]
- Zaghloul, S.; Al-Hooti, S.N.; Al-Hamad, N.; Al-Zenki, S.; Alomirah, H.; Alayan, I.; Al-Attar, H.; Al-Othman, A.; Al-Shami, E.; Al-Somaie, M. Evidence for nutrition transition in Kuwait: Over-consumption of macronutrients and obesity. Public Health Nutr. 2013, 16, 596–607. [Google Scholar] [CrossRef] [PubMed] [Green Version]
- Alomirah, H.; Al-Zenki, S.; Husain, A. Assessment of Acrylamide Levels in Heat-Processed Foodstuffs Consumed by Kuwaitis. Libr. Kuwait Inst. Sci. Res. Essays 2008, KISR. No. 9316. Available online: https://www.kuwaitresearch.com/ar/publication/title/assessment-acrylamide-levels-heat-processed-foodstuffs-consumed-kuwaitis (accessed on 8 February 2021).
- The Public Authority for Food and Nutrition-Kuwait. The Case for Investment in Prevention and Control of Non-Communicable Diseases in Kuwait; The Public Authority for Food and Nutrition: Sabah Al Salem, Kuwait, 2020. [Google Scholar]
- World Health Organization. Kuwaitis Lower Blood Pressure by Reducing Salt in Bread. Available online: https://www.who.int/features/2014/kuwait-blood-pressure/en/#:~:text=But%20in%20Kuwait%2C%20cutting%20the,most%20popular%20type%20of%20bread (accessed on 4 March 2021).
- Merhi, K.A. Urinary Sodium and Potassium Status of Lebanese School Aged Children; American University of Beirut: Beirut, Lebanon, 2017. [Google Scholar]
- Nasreddine, L.; Hwalla, N.; Ismaeel, H. Validation of a Food Frequency Questionnaire for the Assessment of Sodium Dietary Intake Using 24-Hour Urine Sodium Excretion in Lebanese Adults; American University of Beirut: Beirut, Lebanon, 2014; unpublished. [Google Scholar]
- Chouccair, S.R. Validation of a Food Frequency Questionnaire and a Spot Urine Sample for the Assessment of Dietary Sodium Intake in Lebanese Adults; American University of Beirut: Beirut, Lebanon, 2016. [Google Scholar]
- Helou, R.M. Development and Validation of a Food Frequency Questionnaire for the Assessment of Sodium Dietary Intake in Lebanese Adults; American University of Beirut: Beirut, Lebanon, 2014. [Google Scholar]
- Hamamji, S.E. Intakes and Sources of Fat, Free Sugars and Salt Among Lebanese Children and Adolescents; American University of Beirut: Beirut, Lebanon, 2018. [Google Scholar]
- Aoun, C.; Daher, R.B.; Osta, N.E.; Papazian, T.; Khabbaz, L.R. Reproducibility and relative validity of a food frequency questionnaire to assess dietary intake of adults living in a Mediterranean country. PLoS ONE 2019, 14. [Google Scholar] [CrossRef] [Green Version]
- Almedawar, M.M.; Nasreddine, L.; Olabi, A.; Hamade, H.; Awad, E.; Toufeili, I.; Arnaout, S.; Ismaeel, H.A. Sodium intake reduction efforts in Lebanon. Cardiovasc. Diagn. Ther. 2015, 5, 178–185. [Google Scholar]
- Ministry of Health-Morocco. National Survey on Common Risk Factors for Non- Communicable Diseases 2017–2018. 2018. Available online: https://www.sante.gov.ma/Publications/Etudes_enquete/Pages/default.aspx (accessed on 4 March 2021).
- Saeid, N.; Elmzibri, M.; Hamrani, A.; Latifa, Q.; Belghiti, H.; El Berri, H.; Benjeddou, K.; Bouziani, A.; Benkirane, H.; Taboz, Y.; et al. Assessment of Sodium and Potassium Intakes in Children Aged 6 to 18 Years by 24 h Urinary Excretion in City of Rabat, Morocco. J. Nutr. Metab. 2018, 2018. [Google Scholar] [CrossRef]
- Derouiche, A.; El-Kardi, Y.; Mohtadi, K.; Jafri, A. Estimation of the Daily Salt Intake by 24-Hour Urinary Sodium Excretion in Morocco: A Pilot Study. Nutrition 2016. [Google Scholar] [CrossRef] [Green Version]
- Derouiche, A.; El-kardi, Y.; Mohtadi, K.; Jafri, A. Salt intake assessed by 24 hour urinary sodium excretion of Moroccan adults: A pilot study. Nutr. Clin. Metab. 2017, 31, 207–211. [Google Scholar] [CrossRef]
- Anzid, K.; Baali, A.; Vimard, P.; Levy-Desroches, S.; Cherkaoui, M.; López, P.M. Inadequacy of vitamins and minerals among high-school pupils in Ouarzazate, Morocco. Public Health Nutr. 2014, 17, 1786–1795. [Google Scholar] [CrossRef] [Green Version]
- Al-Mawali, A.; D’Elia, L.; Jayapal, S.K.; Morsi, M.; Al-Shekaili, W.N.; Pinto, A.D.; Al-Kharusi, H.; Al-Balushi, Z.; Idikula, J.; Al-Harrasi, A.; et al. National survey to estimate sodium and potassium intake and knowledge attitudes and behaviours towards salt consumption of adults in the Sultanate of Oman. BMJ Open 2020, 10. [Google Scholar] [CrossRef] [PubMed]
- Al-Mawali, A.; Jayapal, S.K.; Morsi, M.; Al-Shekaili, W.; Pinto, A.D.; Al-Kharusi, H.; Al-Harrasi, A.; Al-Balushi, Z.; Idikula, J. Prevalence of Risk Factors of Non-Communicable Diseases in the Sultanate of Oman: STEPS Survey 2017. Res. Sq. 2020. [Google Scholar] [CrossRef]
- Al-Ghannami, S. National Nutrition Survey; Library of Ministry of Health, Ministry of Health: Muscat, Oman, 2004. [Google Scholar]
- Ministry of Health-Oman. MOH Announces NCDs National Survey Results. 2018. Available online: https://www.moh.gov.om/en/-/---896 (accessed on 4 March 2021).
- Saqib, M.A.N.; Rafique, I.; Ansar, M.; Rahat, T. Daily Salt Intake, its Discretionary Use and Validation of Methods for Estimation using Spot Urine, Findings from Islamabad, Pakistan. medRxiv 2020. [Google Scholar] [CrossRef]
- Rifat uz, Z.; Iqbal, Z.; Ali, U. Dietary intakes of urban adolescents of Sialkot, Pakistan do not meet the standards of adequacy. Pak. J. Nutr. 2013, 12, 460–467. [Google Scholar] [CrossRef] [Green Version]
- Elmadfa, A.; Ben-Abdullah, K.; Meyer, A.; Ramlawi, A.; Bahar, L.; Rizkallah, N.; Skaik, A.; Zakout, Z.; El-Aissaw, F. Palestine Micronutrient Survey 2013; UNICEF, University of Vienna: Vienna, Austria, 2014. [Google Scholar]
- Ministry of Health-Sudan; World Health Organization. Sudan STEPwise Survey for Non-Communicable Disease Risk Factors 2016 Report. 2016. Available online: https://www.who.int/ncds/surveillance/steps/Sudan_STEPwise_SURVEY_final_2016.pdf?ua=1 (accessed on 4 March 2021).
- Doggui, R.; El Ati, J.; Sassi, S.; Ben Gharbia, H.; Al-Jawaldeh, A.; El Ati-Hellal, M. Unbalanced intakes of sodium and potassium among Tunisian adults: A cross-sectional study. Food Sci. Nutr. 2021. [Google Scholar] [CrossRef]
- World Health Organization. Report on the Technical Consultation on Salt and Fat Reduction Strategies in the Eastern Mediterranean Region, Tunis, Tunisia 30–31 March 2015; World Health Organization, Regional Office for the Eastern Mediterranean: Cairo, Egypt, 2015. [Google Scholar]
- Aounallah-Skhiri, H.; Traissac, P.; El Ati, J.; Eymard-Duvernay, S.; Landais, E.; Achour, N.; Delpeuch, F.; Romdhane, H.B.; Maire, B. Nutrition transition among adolescents of a south-Mediterranean country: Dietary patterns, association with socio-economic factors, overweight and blood pressure. A cross-sectional study in Tunisia. Nutr. J. 2011, 10, 1–17. [Google Scholar] [CrossRef] [PubMed] [Green Version]
- World Health Organization Global Database on the Implementation of Nutrition Action (GINA). Policy—Stratégie Nationale Multisectorielle de Prévention et Contrôle des Maladies Non Transmissibles (MNT)—Tunisia. 2018. Available online: https://extranet.who.int/nutrition/gina/en/node/39424 (accessed on 8 March 2021).
- Jarrar, A.H.; Stojanovska, L.; Apostolopoulos, V.; Ismail, L.C.; Feehan, J.; Ohuma, E.O.; Ahmad, A.Z.; Alnoaimi, A.A.; Al Khaili, L.S.; Allowch, N.H.; et al. Assessment of sodium knowledge and urinary sodium excretion among regions of the united arab emirates: A cross-sectional study. Nutrients 2020, 12, 2747. [Google Scholar] [CrossRef]
- Cheikh Ismail, L.; Hashim, M.; H Jarrar, A.; N Mohamad, M.; T Saleh, S.; Jawish, N.; Bekdache, M.; Albaghli, H.; Kdsi, D.; Aldarweesh, D. Knowledge, attitude, and practice on salt and assessment of dietary salt and fat intake among University of Sharjah students. Nutrients 2019, 11, 941. [Google Scholar] [CrossRef] [Green Version]
- Kingdom of Morocco and World Health Organization. National Survey on Common Risk Factors for Non-Communicable Diseases 2017–2018, in STEP Wise Survey 2017–2018; Kingdom of Morocco: Rabat, Morocco, 2018. [Google Scholar]
- Ministry of Health-Oman. National Health Survey of Non-Communicable Diseases Risk Factors; Sultanate of Oman STEPS Survey Report 2017; Center of Studies and Research: Seeb, Muscat, Oman, 2017. [Google Scholar]
- Al Jawaldeh, A.; Al-Khamaiseh, M. Assessment of salt concentration in bread commonly consumed in the eastern mediterranean region. East. Mediterr. Health J. 2018, 24, 18–24. [Google Scholar] [CrossRef] [PubMed]
- Alhamad, N.; Almalt, E.; Alamir, N.; Subhakaran, M. An overview of salt intake reduction efforts in the Gulf Cooperation Council countries. Cardiovasc. Diagn. Ther. 2015, 5, 172–177. [Google Scholar]
- Musaiger, A.O.; D’Souza, R. Nutritional profile of local and western fast foods consumed in Bahrain. Ecol. Food Nutr. 2007, 46, 143–161. [Google Scholar] [CrossRef]
- Musaiger, A.O.; D’Souza, R. The effects of different methods of cooking on proximate, mineral and heavy metal composition of fish and shrimps consumed in the Arabian Gulf. Arch. Latinoam. Nutr. 2008, 58, 103–109. [Google Scholar]
- Zibaeenezhad, M.J.; Hooshangi, M.; Abtahi, F.; Heydari, S.T. A study of salt (sodium chloride) content in different bread consumed in shiraz city in spring/summer 2009. Iran. Cardiovasc. Res. J. 2010, 4, 17–21. [Google Scholar]
- Ghajarbeygi, P.; Kazeminia, M.; Mahmoudi, R. Determine the quality of bread samples used in Qazvin, Iran. J. Chem. Health Risks. 2018, 8, 1–8. [Google Scholar]
- Rezaiimofrad, M.; Jeddi, F.R.; Azarbad, Z. Baking soda and salt in bakeries of Mehrdasht (Najafabad), Isfahan, Iran: A survey on a typical rural population in a developing country. J. Prev. Med. Hyg. 2013, 54, 53–56. [Google Scholar]
- Hashemi, M.; Afshari, A.; Aminzare, M.; Raeisi, M.; Sahranavard, T. Evaluation of pH and common salt content in bread samples produced in Mashhad, Iran. J. Food Qual. Hazards Control 2016, 3, 73–75. [Google Scholar]
- Malakootian, M.; Dowlatshahi, S.H.; Malakootian, M. The quality of the manufactured bread and hygienic conditions of bakeries. Iran. J. Environ. Health Sci. Eng. 2005, 2, 72–78. [Google Scholar]
- Namayandeh, S.M.; Lotfi, M.H.; Jafari, V.; Dad, V.; Biabani, J.; Razi, M.H.; Sangsefidi, Z.S. Salt content in traditional and nontraditional breads in Yazd city, Iran, 2015–2016. J. Nutr. Food. Sec. 2018, 3, 185–192. [Google Scholar] [CrossRef]
- Habibi, N.; Fatemi, A. Survey amount of salt in consumptional bread of Sanandaj. Aust. J. Basic. Appl. Sci. 2012, 6, 90–93. [Google Scholar]
- Hadian, Z.; Feizollahi, E.; Khosravi, K.; Mofid, V.; Rasekhi, H. Salt intake from traditional breads: A public health challenge for decreasing non-communicable diseases in Iran. Curr. Nutr. Food. Sci. 2020, 16, 1278–1284. [Google Scholar] [CrossRef]
- Babaali, E.; Rahmdel, S.; Berizi, E.; Akhlaghi, M.; Götz, F.; Mazloomi, S.M. Dietary intakes of zinc, copper, magnesium, calcium, phosphorus, and sodium by the general adult population aged 20–50 years in Shiraz, Iran: A total diet study approach. Nutrients 2020, 12, 3370. [Google Scholar] [CrossRef]
- Rasheed, M.S.; Saeed, A.A.M. Evaluation of sodium concentration in different bread types in Sulaimanyah Province, Iraqi Kurdistan. Plant Arch. 2020, 20, 836–839. [Google Scholar]
- Mbdulrahman, M.A. A study of sodium concentration in different bread consumed in Duhok city-Kurdistan region-Iraq. Duhok Med. J. 2016, 10, 20–30. [Google Scholar]
- Hussain, F.M.A.; Takruri, H.R. A Study of Salt Content of Different Bread Types Marketed in Amman, Jordan. J. Agric. Sci. 2016, 8, 169–178. [Google Scholar] [CrossRef]
- El-Qudah, J.M.; Dababneh, B.F.; Al-Bakheit, A.A.; Al-Qudah, M.M.; Al-Rawashdeh, A.; Khataibeh, M.; Abu-Alruz, K.; Ereifej, K.I. Nutrient contents per serving of twelve varieties of cooked rice marketed in Jordan. Am. J. Agric. Biol. Sci. 2008, 3, 617–622. [Google Scholar] [CrossRef] [Green Version]
- Dashti, B.; Al-Awadi, F.; AlKandari, R.; Ali, A.; Al-Otaibi, J. Macro-and microelements contents of 32 Kuwaiti composite dishes. Food Chem. 2004, 85, 331–337. [Google Scholar] [CrossRef]
- World Health Organization. Summary Report on the Technical Workshop on Salt and Fat Intake Reduction, Cairo, Egypt, 10–11 April 2013; WHO: Cairo, Egypt, 2013. [Google Scholar]
- Barakat, N.G. An Assessment of Sodium Levels in Different Breads and Bread Intake in the Lebanese Population; American University of Beirut: Beirut, Lebanon, 2015. [Google Scholar]
- Al-Jawaldeh, A.; Hoteit, M.; Zoghbi, E.; Al Iskandarani, M.; Rady, A.; Shankiti, I.; Matta, J. Nutritional value of the Middle Eastern diet: Analysis of total sugar, salt, and iron in Lebanese traditional dishes. F1000Res 2020, 9. [Google Scholar] [CrossRef]
- Derouiche, A.; Jafri, A.; ElKardi, Y.; Jabari, M.; Habbal, R.; El Attaoui, K.; Alami, M. Should bread be targeted as a vector to reduce sodium intake in Morocco? PeerJ Prep. 2014, 2, e188v181. [Google Scholar]
- Jafri, A.; El-Kardi, Y.; Derouiche, A. Sodium chloride composition of commercial white bread in Morocco. East. Mediterr. Health J. 2017, 23, 708–710. [Google Scholar] [CrossRef]
- Waseem, A.; Nafees, M.; Murtaza, G.; Sajjad, A.; Mehmood, Z.; Siddiqi, A.R. Salt toxicity (sodium intake): A serious threat to infants and children of Pakistan. Iran J. Public Health 2014, 43, 1204. [Google Scholar] [PubMed]
- Ramlawi, A.; Rub, A.A.; Materia, E.; Rossi, L.; Shuabi, N.; Barone, M.; Racalbuto, V. Reducing dietary salt consumption in the occupied Palestinian territory: A cross-sectional survey. Lancet 2018, 391, S4. [Google Scholar] [CrossRef]
- AbuKhader, M.; Abdelraziq, R.; Al-Azawi, M.; Ali, S.K. A comparative examination of dietary sodium content in bread and its public consumption pattern in Muscat, Oman. Nutr. Food Sci. 2019, 50, 116–130. [Google Scholar] [CrossRef]
- Musaiger, A.O.; Ahmed, M.A.; Rao, M.V. Chemical composition of some traditional dishes of Oman. Food Chem. 1998, 61, 17–22. [Google Scholar] [CrossRef]
- Soomro, S.I.; Memon, N.; Bhanger, M.I.; Memon, S.; Memon, A.A. Mineral content of Pakistani foods: An update of food composition database of Pakistan through indirect method. J. Food Compos. Anal. 2016, 51, 45–54. [Google Scholar] [CrossRef]
- ElObeid, T.; Phoboo, S.; Magdad, Z. Proximate and mineral composition of indigenous Qatari dishes: Comparative study with similar Middle Eastern dishes. J. Food. Chem. Nutr. 2015, 3, 27–34. [Google Scholar]
- Saudi Food and Drug Authority. Report Clear Boundaries of Salt Saudi Standard: Maximum Guideline Limits for Salt in “Food Products”; SFDA: Riyadh, Saudi Arabia, 2019. [Google Scholar]
- Saudi Food and Drug Authority. Healthy Food Recipes for School Lunch Bag; SFDA: Riyadh, Saudi Arabia, 2020. [Google Scholar]
- Habib, H.M.; Ali, H.I.; Ibrahim, W.H.; Afifi, H.S. Nutritional value of 10 traditional dishes of the United Arab Emirates. Ecol. Food. Nutr. 2011, 50, 526–538. [Google Scholar] [CrossRef] [PubMed]
- Ministry of Health-UAE. Healthy Recipes for School Lunch Bag. MA’KOM for a Balanced Diet, 1st ed.; Health Education and Promotion Department: Dubai, United Arab Emirates, 2019. [Google Scholar]
- Al-Mussali, M.S.; Al-Gahri, M.A. Nutritive value of commonly consumed bread in Yemen. J. Chem. 2009, 6, 437–444. [Google Scholar] [CrossRef] [Green Version]
- Bouhamida, M.; Nada, B.; Guennoun, Y.; Lachguer, S.A.; Elhaloui, N.E.; Zahrou, F.E.; Mounach, S.; Kari, K.E.; Al-Jawaldeh, A.; Barkat, A.; et al. Implementing the national strategy of salt reduction in Morocco: The baker’s perspective. Pan. Afr. Med. J. 2020, 37. [Google Scholar] [CrossRef]
- Pirasteh, A.; Pouraram, H.; Kholdi, N.; Abtahi, M. Discretionary salt intake and readiness for behavioral change among women in Tehran. Int. J. Prev. Med. 2019, 10. [Google Scholar] [CrossRef]
- Jahangard, L.; Behmanesh, H.; Ahmadpanah, M.; Poormoosavi, S.M.; Solitanian, A.; Highighi, M. Risky behaviors and health-promoting behaviors in young adults: An epidemiological study. Iran. J. Psychiatry 2019, 14, 302–308. [Google Scholar] [CrossRef]
- Ministry of Public Health-Lebanon; World Health Organization. WHO STEPwise Approach for Non-Communicable Diseases Risk Factor Surveillance Lebanon, 2016–2017. 2017. Available online: https://www.who.int/ncds/surveillance/steps/Lebanon_STEPS_report_2016-2017.pdf?ua=1 (accessed on 15 March 2021).
- Bou-Mitri, C.; Khnaisser, L.; Ghanem, M.B.; Merhi, S.; Fares, J.E.; Doumit, J.; Farhat, A.G. Consumers’ exposure to claims on pre-packed bread: The case of a developing country, Lebanon. Nutr. Food Sci. 2020, 50, 1033–1051. [Google Scholar] [CrossRef]
- Nasreddine, L.; Akl, C.; Al-Shaar, L.; Almedawar, M.M.; Isma’eel, H. Consumer knowledge, attitudes and salt-related behavior in the Middle-East: The case of Lebanon. Nutrients 2014, 6, 5079–5102. [Google Scholar] [CrossRef] [Green Version]
- Al-Riyami, H.; Al-Abdulsalam, Q.; Al-Khayari, A.; Al-Mushrafi, H.; Al-Alawi, Z.; Al-Hashmi, K.; Nadar, S.K. Awareness of the dangers of high salt intake among the urban omani population. Sultan Qaboos Univ. Med. J. 2020, 20, e352–e356. [Google Scholar] [CrossRef]
- Manickavasagan, A.; Al-Mahdouri, A.A.; Al-Mufargi, A.M.S.; Al-Souti, A.; Al-Mezeini, A.S.M.; Essa, M.M. Healthy eating knowledge among college students in Muscat: A self reported survey. Pak. J. Nutr. 2014, 13, 397–403. [Google Scholar] [CrossRef] [Green Version]
- Saeedi, M.; AlMadani, A.; Alsafi, Y.; Arif, S.; Mustafa, S.; Jamo, A. Estimation of Sodium and Potassium Intake in 24-Hours Urine, Aljouf Region, Northern Saudi Arabia. Chronic. Dis. Int. 2017, 4, 1026. [Google Scholar]
- Hanbazaza, M.A.; Mumena, W.A. Knowledge and practices related to salt intake among saudi adults. Int. J. Environ. Res. Public Health 2020, 17, 5749. [Google Scholar] [CrossRef] [PubMed]
- Alfaifi, A.H.; Al-Harthi, D.A.; Al-Omran, G.H.; Algorashi, R.A.; Assiri, S.A.A.; Alsufyani, A.A.; Ali, M.M.; Baabbad, H.S. Knowledge, perceptions, and lifestyle behavior modifications and changes related to hypertension in Taif city, Saudi Arabia. Indo. Am. J. Pharm. Sci. 2018, 5, 15973–15984. [Google Scholar] [CrossRef]
- Attlee, A.; Abu-Qiyas, S.; Obaid, R.S. Assessment of nutrition knowledge of a university community in Sharjah, United Arab Emirates. Malays. J. Nutr. 2014, 20, 327–337. [Google Scholar]
- Shaikh, R.B.; Mathew, E.; Sreedharan, J.; Muttappallymyalil, J.; Sharbatti, S.A.; Basha, S.A. Knowledge regarding risk factors of hypertension among entry year students of a medical university. J. Fam. Community Med. 2011, 18, 124–129. [Google Scholar] [CrossRef]
- El Rhazi, K.; Bennani, B.; El Fakir, S.; Boly, A.; Bekkali, R.; Zidouh, A.; Nejjari, C. Public awareness of cancer risk factors in the Moroccan population: A population-based cross-sectional study. BMC Cancer 2014, 14. [Google Scholar] [CrossRef] [PubMed] [Green Version]
- Ministry of Health and Prevention-UAE. UAE Nutritional Status Study; Statistic and Research Center: Abu Dhabi, United Arab Emirates, 2020. [Google Scholar]
- Alkhalaf, M.; Edwards, C.; Combet, E. Validation of a food frequency questionnaire specific for salt intake in Saudi Arabian adults using urinary biomarker and repeated multiple pass 24-hour dietary recall. Proc. Nutr. Soc. 2015, 74. [Google Scholar] [CrossRef] [Green Version]
- Lachat, C.; Otchere, S.; Roberfroid, D.; Abdulai, A.; Seret, F.M.A.; Milesevic, J.; Xuereb, G.; Candeias, V.; Kolsteren, P. Diet and Physical Activity for the Prevention of Noncommunicable Diseases in Low- and Middle-Income Countries: A Systematic Policy Review. PLoS Med. 2013, 10. [Google Scholar] [CrossRef] [Green Version]
- World Health Organization Global Health Observatory. Policies, Strategies and Action Plans: Data by Country. Available online: https://apps.who.int/gho/data/view.main.2473 (accessed on 3 March 2021).
- World Health Organization Global Database on the Implementation of Nutrition Action (GINA). First Amendment/2016 Iraqi Standard 1989/1967 for (Bread)—Iraq. 2016. Available online: https://extranet.who.int/nutrition/gina/en/node/39495 (accessed on 3 March 2021).
- World Health Organization Regional Office for the Eastern Mediterranean. WHO-EM/NUT/268/E—Report on the Technical Consultation on Salt and Fat Reduction Strategies in the Eastern Mediterranean Region; World Health Organization: Tunis, Tunisia, 2015; Available online: https://applications.emro.who.int/docs/IC_Meet_Rep_2015_EN_16339.pdf (accessed on 3 March 2021).
- Ministry of Health-Bahrain. Determining the Percentage of Additives of Table Salt in Popular and Automatic Bakery Products; Ministry of Health-Bahrain: Manama, Bahrein, 2018. [Google Scholar]
- World Health Organization Global Database on the Implementation of Nutrition Action (GINA). Policy—Resolution No. (28) of 2018 Determining the Proportions of Adding Table Salt in Popular and Automatic Bakery Products—Bahrain. 2018. Available online: https://extranet.who.int/nutrition/gina/en/node/39382 (accessed on 3 March 2021).
- Morocco, O. Moving forward on salt and fat reduction in the Region. East. Mediterr. Health J. 2015, 21, 374. [Google Scholar]
- Al Jawaldeh, A.; Rafii, B.; Nasreddine, L. Salt intake reduction strategies in the Eastern Mediterranean Region. East. Mediterr. Health J. 2018, 24, 1172–1180. [Google Scholar] [CrossRef]
- Hajifaraji, M.; Abdollahi, Z. The Challenges and Successes of Salt, Sugar and Fat Reduction Program to Prevent Ncds (IRAN EXPERIENCES). In Annals of Nutrition and Metabolism; Karger: Basel, Switzerland, 2017; p. 345. [Google Scholar]
- Tehran: Iranian National Standardization Organization. Traditional Breads: Specifications and Test Methods. INSO A1-2628. Amendment No. 1; 2016. Available online: http://isiri.gov.ir/en/portal/home/?331765/ISIRI-Portal (accessed on 12 April 2021).
- Tehran: Iranian National Standardization Organization. Bulk Breads-Specifications and Test Methods. INSO 2338. Second Revision; 2017. Available online: http://standard.isiri.gov.ir/StandardView.aspx?Id=49200 (accessed on 12 April 2021).
- Moslemi, M.; Kheirandish, M.; Mazaheri, N.; Hosseini, H.; Jannat, B.; Mofid, V. National food policies in the Islamic Republic of Iran aimed at prevention of noncommunicable diseases. East. Mediterr. Health J. 2020, 26, 1556–1564. [Google Scholar] [CrossRef]
- Tehran: Iranian National Standardization Organization. Milk and Milk Products—Fresh Cheese: Specifications and Test Methods. INSO 6629. First Revision; 2015. Available online: http://standard.isiri.gov.ir/StandardView.aspx?Id=47440 (accessed on 12 April 2021).
- Tehran: Iran Food and Drug Administration. Production and Expiration Date of Dairies. Circular Letter 122509/675. FB-Ci-1394–0107; 2015. Available online: http://isiri.gov.ir/en/portal/home/?331765/ISIRI-Portal (accessed on 12 April 2021).
- Tehran: Iranian National Standardization Organization. Probiotic Yoghurt: Specifications and Test Methods. INSO A2-11325. Amendment No. 2; 2018. Available online: http://standard.isiri.gov.ir/StandardView.aspx?Id=49953 (accessed on 12 April 2021).
- Jordanian Standards and Metrology Organization. JS 19: 2019—Cereals, Pulses and Derived Products—Bread. 2019. Available online: http://www.jsmo.gov.jo/En/EServices/Standards/Pages/stdDetails.aspx?mfn=5883 (accessed on 12 April 2021).
- Saudi Food and Drug Authority. SFDA.FD 59: Salt Limits In Food Products; SFDA: Riyadh, Saudi Arabia, 2018. [Google Scholar]
- Saudi Food and Drug Authority. Technical Production of Bread Requirements; SFDA: Riyadh, Saudi Arabia, 2018. [Google Scholar]
- Saudi Food and Drug Authority. Healthy Food Strategy; SFDA: Riyadh, Saudi Arabia, 2018. [Google Scholar]
- Saudi Food and Drug Authority. SFDA.FD 57: Laban, Flavoured Laban and Laban Drink; SFDA: Riyadh, Saudi Arabia, 2018. [Google Scholar]
- Saudi Food and Drug Authority. Consumer Education and Behavior. 2018. Available online: https://old.sfda.gov.sa/ar/awareness/Campaigns/Pages/HFStrategy.aspx (accessed on 31 May 2021).
- Ministry of Health-Saudi Arabia. MOH Warns of Salt Excessive Consumption, Presents Substitutes. MOH News, 28 March 2017. [Google Scholar]
- Saudi Food and Drug Authority. Awareness Campaign: Salt. Available online: https://www.sfda.gov.sa/ar/awarenesscampaign/74342 (accessed on 31 May 2021).
- Saudi Food and Drug Authority. Guide for Manufacturers and Importers: Salt Limits in Food Products. 2020. Available online: https://www.sfda.gov.sa/sites/default/files/2020-01/Giud04.pdf (accessed on 31 May 2021).
- Saudi Food and Drug Authority. Guide for Bread Manufacturers and Importers: Applying the SFDA.FD 2362 “Technical Production of Bread Requirements”. 2020. Available online: https://www.sfda.gov.sa/sites/default/files/2020-12/ReduceSaltBbread.pdf (accessed on 31 May 2021).
- Saudi Food and Drug Authority. SFDA.FD 42: Traffic Light Labeling; SFDA: Riyadh, Saudi Arabia, 2018. [Google Scholar]
- Al-Jawaldeh, A.; Rayner, M.; Julia, C.; Elmadfa, I.; Hammerich, A.; McColl, K. Improving nutrition information in the eastern Mediterranean region: Implementation of front-of-pack nutrition labelling. Nutrients 2020, 12, 330. [Google Scholar] [CrossRef]
- Saudi Food and Drug Authority. Initiative to Promote Public Health through Food in a Work Environment. 2018. Available online: https://old.sfda.gov.sa/ar/awareness/Campaigns/Documents/FOOD-PublicHealth.pdf (accessed on 31 May 2021).
- Administration of Food and Nutrition, Ministry of Health-Kuwait. The Role of Administration of Food and Nutrition Ministry of Health in Controlling and Prevention of Non-Communicable Diseases in Kuwait; Ministry of Health: Kuwait City, Kuwait, 2021. [Google Scholar]
- American University of Beirut Medical Center. Lebanese Action on Sodium and Health. Available online: https://www.aub.edu.lb/fm/vmp/Pages/Lebanese-Action-on-Sodium-and-Health-.aspx (accessed on 19 January 2021).
- World Health Organization Global Database on the Implementation of Nutrition Action (GINA). Policy–Non Communicable Disease Prevention and Control Plan (NCD-PCP) for Lebanon 2015–2020—Lebanon. 2014. Available online: https://extranet.who.int/nutrition/gina/en/node/26377 (accessed on 3 March 2021).
- World Health Organization Global Database on the Implementation of Nutrition Action (GINA). Policy–Prevention des Maladies Non Transmissibles: Plan D’action Multisectoriel Pour la Promotion d’un Mode de vie sain 2015–2020—Morocco. 2015. Available online: https://extranet.who.int/nutrition/gina/en/node/36194 (accessed on 3 March 2021).
- Ministry of Health-Oman. Omani Standard for Bread; Ministry of Health: Muscat, Oman, 2019. [Google Scholar]
- World Health Organization. Oman’s Experience on Salt Reduction in Bread. Available online: https://www.who.int/beat-ncds/countries/oman/salt-reduction/en/ (accessed on 16 April 2021).
- World Health Organization Global Database on the Implementation of Nutrition Action (GINA). Ministerial Decision No. 2019/95 Omani Standard for Bread–Oman. 2019. Available online: https://extranet.who.int/nutrition/gina/en/node/39755 (accessed on 3 March 2021).
- Ministry of Health-Oman. National Nutrition Strategy 2020–2030; Ministry of Health: Muscat, Oman, 2016. [Google Scholar]
- Ministry of Health-Oman. World Salt Awareness Week. Available online: https://www.moh.gov.om/documents/10194/569871/%D8%A7%D9%84%D8%A8%D9%88%D8%B3%D8%AA%D8%B1+%D8%B9%D9%86+%D8%A7%D8%B3%D8%A8%D9%88%D8%B9+%D8%A7%D9%84%D8%AA%D9%88%D8%B9%D9%8A%D8%A9+%D8%B9%D9%86+%D8%A7%D9%84%D9%85%D9%84%D8%AD+%281%29.pdf/aa45b36a-eef2-7e22-a7a5-203706ec5993 (accessed on 4 March 2021).
- World Health Organization Global Database on the Implementation of Nutrition Action (GINA). Policy—National Plan for the Prevention and Control of Chronic Non-Communicable Diseases 2016–2025—Oman. 2016. Available online: https://extranet.who.int/nutrition/gina/en/node/39383 (accessed on 3 March 2021).
- Ministry of Health-Palestine. National Health Strategy 2021–2023. 2019. Available online: http://site.moh.ps/Content/Books/Byh2ENRn64uTVaLncGL6AjD1Z3dzHMEuLvgQDEC55ujpNihg8YPEVv_OTxQv6uPfFIRmT9xs7dwgvatwShEN8VoqHs83y5NWwua3THGRD73OO.pdf (accessed on 3 March 2021).
- World Health Organization Global Database on the Implementation of Nutrition Action (GINA). Policy—National Nutrition and Physical Activity Action Plan—Qatar. 2011. Available online: https://extranet.who.int/nutrition/gina/sites/default/filesstore/QAT%202011%20National%20Nutrition%20and%20Physical%20Activity%20Action%20Plan.pdf (accessed on 3 March 2021).
- World Action on Salt and Health. Qatar. Available online: http://www.worldactiononsalt.com/worldaction/middle-east/qatar/ (accessed on 16 April 2021).
- El Ati, J.; Doggui, R.; Ati-Hellal, M.E. A successful pilot experiment of salt reduction in tunisian bread: 35% gradual decrease of salt content without detection by consumers. Int. J. Environ. Res. Public Health 2021, 18, 1590. [Google Scholar] [CrossRef]
- World Health Organization Global Database on the Implementation of Nutrition Action (GINA). Policy—Stratégie de Prévention et de Lutte contre l’Obésité—Tunisia. 2013. Available online: https://extranet.who.int/nutrition/gina/en/node/23769 (accessed on 3 March 2021).
- Buse, K.; Aftab, W.; Akhter, S.; Phuong, L.B.; Chemli, H.; Dahal, M.; Feroz, A.; Hofiani, S.; Pradhan, N.A.; Anwar, I. The state of diet-related NCD policies in Afghanistan, Bangladesh, Nepal, Pakistan, Tunisia and Vietnam: A comparative assessment that introduces a ‘policy cube’approach. Health Policy Plan. 2020, 35, 503–521. [Google Scholar] [CrossRef] [PubMed] [Green Version]
- World Health Organization Global Database on the Implementation of Nutrition Action (GINA). Policy—National Action Plan in Nutrition—UAE. 2017. Available online: https://extranet.who.int/nutrition/gina/en/node/37425 (accessed on 3 March 2021).
- World Health Organization Global Database on the Implementation of Nutrition Action (GINA). Policy—National Plan for Prevention and Response For noncommunicable diseases State of United Arab Emirates—UAE. 2017. Available online: https://extranet.who.int/nutrition/gina/en/node/38165 (accessed on 3 March 2021).
- Ministry of Health and Prevention-UAE. Exclude Salt from Your Food Menu. 2019. Available online: https://www.instagram.com/p/BulORCQBQdc/ (accessed on 4 March 2021).
- Ministry of Health and Prevention-UAE. Pay Attention to the Dangers of Excessive Salt Intake! 2018. Available online: https://www.instagram.com/p/BglH1-lH2XI/?taken-by=mohapuae (accessed on 4 March 2021).
- World Health Organization Global Database on the Implementation of Nutrition Action (GINA). Policy—Bahrain’s Health Agenda. Health Improvement Strategy—Bahrain. 2012. Available online: https://extranet.who.int/nutrition/gina/en/node/17830 (accessed on 4 March 2021).
- World Health Organization Global Database on the Implementation of Nutrition Action (GINA). Policy—National Document for Prevention and Control of Non Communicable Diseases and the Related Risk Factors in the Islamic Republic of Iran, 2015–2025—Iran. 2015. Available online: https://extranet.who.int/nutrition/gina/en/node/40358 (accessed on 4 March 2021).
- World Health Organization Global Database on the Implementation of Nutrition Action (GINA). Policy—The National Strategy and Plan of Action Against Diabetes, Hypertension, Dyslipidemia and Obesity in Jordan—Jordan. 2015. Available online: https://extranet.who.int/nutrition/gina/en/node/25926 (accessed on 4 March 2021).
- Derouiche, A.; El-Kardi, Y.; Farhloul, F.-Z.; Mokhantar, K.; Jafri, A. Impact of awareness campaigns on lowering sodium levels in commercial white bread in Morocco. In Proceedings of the IUNS 21st International Congress of Nutrition, Buenos Aires, Argentina, 15–20 October 2017; Volume 71, p. 1237. [Google Scholar]
- Khalil, G.M.; Azqul, M.M. Assessment of Dietary Sodium Intake among Adolescent School Students at Met-Ghamer City, Al-Dakahlia Governorate, Egypt. Zagazig Univ. Med. J. 2018. [Google Scholar] [CrossRef]
- Beaglehole, R.; Bonita, R.; Horton, R.; Adams, C.; Alleyne, G.; Asaria, P.; Baugh, V.; Bekedam, H.; Billo, N.; Casswell, S. Priority actions for the non-communicable disease crisis. Lancet 2011, 377, 1438–1447. [Google Scholar] [CrossRef]
- Mason, H.; Shoaibi, A.; Ghandour, R.; O’Flaherty, M.; Capewell, S.; Khatib, R.; Jabr, S.; Unal, B.; Sözmen, K.; Arfa, C. A cost effectiveness analysis of salt reduction policies to reduce coronary heart disease in four Eastern Mediterranean countries. PLoS ONE 2014, 9, e84445. [Google Scholar] [CrossRef]
- Wilcox, M.L.; Mason, H.; Fouad, F.M.; Rastam, S.; Al Ali, R.; Page, T.F.; Capewell, S.; O’Flaherty, M.; Maziak, W. Cost-effectiveness analysis of salt reduction policies to reduce coronary heart disease in Syria, 2010–2020. Int. J. Public Health 2015, 60, 23–30. [Google Scholar] [CrossRef] [PubMed]
- Hyseni, L.; Elliot-Green, A.; Lloyd-Williams, F.; Kypridemos, C.; O’Flaherty, M.; McGill, R.; Orton, L.; Bromley, H.; Cappuccio, F.P.; Capewell, S. Systematic review of dietary salt reduction policies: Evidence for an effectiveness hierarchy? PLoS ONE 2017, 12, e0177535. [Google Scholar] [CrossRef] [PubMed] [Green Version]
- Nghiem, N.; Blakely, T.; Cobiac, L.J.; Pearson, A.L.; Wilson, N. Health and economic impacts of eight different dietary salt reduction interventions. PLoS ONE 2015, 10, e0123915. [Google Scholar] [CrossRef] [PubMed]
- Hope, S.F.; Webster, J.; Trieu, K.; Pillay, A.; Ieremia, M.; Bell, C.; Snowdon, W.; Neal, B.; Moodie, M. A systematic review of economic evaluations of population-based sodium reduction interventions. PLoS ONE 2017, 12, e0173600. [Google Scholar] [CrossRef]
- Webster, J.; Trieu, K.; Dunford, E.; Hawkes, C. Target salt 2025: A global overview of national programs to encourage the food industry to reduce salt in foods. Nutrients 2014, 6, 3274–3287. [Google Scholar] [CrossRef] [Green Version]
- McLean, R.M. Measuring population sodium intake: A review of methods. Nutrients 2014, 6, 4651–4662. [Google Scholar] [CrossRef]
- World Health Organization. Reducing Salt Intake in Populations: Report of a WHO Forum and Technical Meeting, 5–7 October 2006, Paris, France; World Health Organization: Geneva, Switzerland, 2007; Available online: https://www.who.int/dietphysicalactivity/Salt_Report_VC_april07.pdf (accessed on 4 March 2021).
- Trieu, K.; Michael, V.; Mustapha, F.; Lo, Y.-R.; Webster, J. Midterm Evaluation of Malaysia’s National Salt Reduction Strategy–Lessons Learned on Adapting Salt Reduction ‘Best Buys’ to the Local Context. Curr. Dev. Nutr. 2020, 4, 288. [Google Scholar] [CrossRef]
- World Health Organization. Oman STEPS Survey: Data Book. Noncommunicable Disease Risk Factor Surveillance. 2017. Available online: https://www.who.int/ncds/surveillance/steps/Oman_STEPS_2017_Data_Book.pdf?ua=1 (accessed on 4 March 2021).
- Ministry of Health-Malaysia; World Health Organization Representative Office for Malaysia BD and Singapore. Reducing Salt Intake in Malaysia: An Interim Evaluation of What Works; Ministry of Health: Putrajaya, Malaysia, 2019; Available online: https://www.moh.gov.my/moh/resources/Penerbitan/Rujukan/NCD/Garam/CaseStudy-SALT-High-Print.pdf (accessed on 4 March 2021).
- John, K.A.; Cogswell, M.E.; Campbell, N.R.; Nowson, C.A.; Legetic, B.; Hennis, A.J.; Patel, S.M. Accuracy and usefulness of select methods for assessing complete collection of 24-hour urine: A systematic review. J. Clin. Hypertens. 2016, 18, 456–467. [Google Scholar] [CrossRef] [Green Version]


| Country | Engagement with Industries and Reformulation | Consumer Education | Front of Pack Labelling | Work in Specific Settings |
|---|---|---|---|---|
| Bahrain | Name of initiative: Determining the percentage of table salt to be added to bakery products Year: 2018 Leadership: Led by the government (MOH) Approach: Salt reduction in Arabic breads: Mandatory (supported by ministerial decree): A 20% annual reduction of salt level in traditional Arab breads from their current levels for five years until reaching the required percentage of 0.5% salt on a dry flour weight basis [144] Mandatory: Reduction in the amount of added salt in baked products during three years starting in 2018 and reaching a percentage of 0.5% salt [145,146] Cheese is under study [144] | Name of initiative: Determining the percentage of table salt to be added to bakery products Year: 2018 Leadership: Led by the government (MOH) Approach: Mandatory: Nutrition labels of baked products (traditional and European) should specify the amount of added salt [146] | ||
| Egypt | Name of initiative: NA Year: 2017 Leadership: Led by government (MOHAP) Approach: Mandatory: ministerial decree to reduce by 30% the salt content of subsidized Baladi Bread—Planned target [31] Other initiatives: Voluntary: Training of bakeries on 20% reduction of salt in bread (Information provided by NFP) | Name of initiative: Pilot Implementation of 20% Salt Reduction in Subsidized Baladi Bread in Great Cairo Year: 2018–2019 Leadership: Led by the government Approach: Awareness campaigns (Information provided by NFP) Name of initiative: Brief Health Education sessions Year: NA Leadership: NA Approach: Awareness activities to increase consumers’ awareness towards hazards of high salt consumption and motivate them to reduce salt consumption (Information provided by NFP) | Name of initiative: 100 Million Health Initiative Year: 2019 Leadership: Led by the government (MOH) Approach: Education Setting: Hospital, school, workplace (Information provided by NFP) | |
| Iran | Name of initiative: Adopted legislation for salt levels in several products Leadership: Led by the government Approach: Mandatory 2015: Establishing maximum salt levels in most commonly consumed canned foods such as tomato paste and salty snacks, and all types of bread (1.8%) [91,147,148] 2016–2017: The standard of salt in bread was further decreased to 1% [149,150,151,152]. 2015: The standard of salt in cheese was decreased from 4% to 3% [152,153] 2015: The standard of salt in dough (fermented drink) was decreased from 1% to 0.8% [152,154] 2018: Salt use has been banned in probiotic yogurts [152,155] Improvement of nutrition in public places through policies for reduced salt in food industries and restaurants; sensitizing food producers regarding the reduction of salt in food products [141] (No further details found) | Public education through TV regarding low salt consumption [141] (No further details found) | Name of initiative: Nutritional traffic light labelling Year: 2016 Leadership: Led by the government Approach: Mandatory for all imported and domestic packaged foods, except for products that are not chemically processed or formulated, such as vegetables, spices, vinegar, lemon juice, tea, infusions, coffee, honey, dates, flour, and barberry [152] | |
| Jordan | Name of initiative: Reduction of salt in Arabic bread Year: 2019 Leadership: Led by the government (part of reducing salt, sugar, trans fat consumption) Approach: Mandatory for bread; based on partnership with bakeries Target for breads: Less than 1% of dry weight [156] (planned) Name of initiative: NA Year: NA Leadership: Led by the government Approach: Revised already existing legislation to develop benchmarks for salt content in highly consumed foods, including cheeses [144,148] (No further details found) | Name of initiative: Low salt, sugar, and trans-fat consumption Year: 2018 Leadership: Led by the government (MOH) Approach: Social marketing (e.g., awareness campaigns), dietary guidelines health promotion campaign (No further details found) Information provided by NFP Develop national recommendations for the reduction of salt intake [141] (No further details found) | ||
| KSA | Name of initiative: Healthy Food Strategy, vision 2030 Year: 2018 Leadership: Led by the government (SFDA) Approach: Voluntary: SFDA.FD 59 “salt limits in food product” Mandatory: SFDA.FD 2362 “General requirements for bread production” Mandatory: SFDA.FD 57 “Yogurt, Flavoured Yogurt, and Yogurt Drink” Food categories reformulated: Breads, processed meats, ready meals, breakfast cereals, cheeses, butter and margarines, salty snacks, biscuits and cakes, and soups and sauces Targets for breads (mandatory): 1.0 g/100 g of bread (all types of bread) [157,158,159,160] Mandatory salt limit for yogurt drink (Ayran Laban): 1 g/100 mL [160] | Name of initiative: Healthy Food Strategy, vision 2030 Year: 2018 Leadership: Led by the government (SFDA) Approach: Social marketing, events, social media posts [159,161] Name of initiative: Warns of Salt Excessive Consumption, Presents Substitutes Year: 2017–2020 Leadership: Led by the government (MOH and SFDA) Approach: Awareness video, guides and campaigns [162,163,164,165] | Name of initiative: Healthy Food Strategy, vision 2030 [159] Year: 2018 Leadership: Led by the government (SFDA) Approach: Voluntary for all food categories SFDA.FD 42 “Traffic light labeling” [166,167]
| Name of initiative: Healthy Food Strategy, vision 2030 [159] Promoting healthy life style in work environment [168] Year: 2018 Leadership: Led by the government (SFDA) Approach: Voluntary; procurement policy and education Setting: Workplace, schools, and hospitals [121] |
| Kuwait | Name of initiative: Kuwaitis lower blood pressure by reducing salt in bread [62] Year: 2013 Leadership: Led by the government (MOH), in partnership with Kuwait Flour Mills and Bakeries Co (KFMB) Approach: Voluntary—implementation of a 10% reduction of salt in pita bread, which was achieved in March 2013, followed by another 10% reduction 6 months later in August 2013. The reduction included other white and whole wheat bread varieties [61] Revision of salt standard for cheese [144,148] Name of initiative: Strategy to promote and support nutrition in school children (6–18 years old) Year: 2017 Leadership: Led by the government—Community Nutrition Promotion Sector (CNPS) of the Public Authority for Food and Nutrition (PAFN) Approach: Mandatory: 6 corn and potato crisp companies were targeted Target of salt content ≤ 1.5 g/100 g [61] | Name of initiative: The role of Administration of Food and Nutrition MOH in controlling and prevention of non-communicable diseases in Kuwait Year: 2021 Leadership: Led by the government (Food and Nutrition Administration (FNA) on behalf of the Kuwait MOH)), in cooperation with Patient Helping Fund Society (PHFS) Approach: Mandatory- Apply the traffic light system on food items sold in governmental hospital cafeterias and canteens). Revision of hospital menus to decrease the levels of salt [169] | ||
| Lebanon | Name of initiative: Lebanese Action on Sodium and Health (LASH) Year: 2012 Leadership: Led by academia in collaboration with the government Approach: Voluntary—assesses intake and sources of salt; assesses baseline salt knowledge and improved knowledge; collaborating with the Ministry of Industry and MOH to develop national salt standards in bread [144,170]. Legislation on salt reduction should have been proposed to concerned members of Parliament) [171] | Name of initiative: Lebanese Action on Sodium and Health (LASH) Year: 2012 Leadership: Led by academia in collaboration with the government Approach: Aims to partner with a communications company to develop and launch a national salt reduction campaign in order to raise awareness on salt hazards and empower consumers to make better dietary choices [170] | ||
| Morocco | Name of initiative: Reduction of salt content in food products Year: 2015 Leadership: Led by the government (MOH) [172] Voluntary for bread (No further details were identified) | Name of initiative: Salt awareness campaign for bakers Year: 2014 Leadership: Led by the government Approach: Awareness campaign for bakers (around 300 bakeries) in Grand Casablanca region; 70% committed to implement reduction [144,147,148] Name of initiative: Reduction of salt intake via campaigns Year: 2015 Leadership: Led by the government (MOH) Approach: Awareness campaign [172] | Name of initiative: Moroccan Nutrition Program and action plan 2017–2021 Year: NA Leadership: Led by the government Approach: Mandatory—FOP Nutrition logos, Nutri-Score (planned) [167] | |
| Oman | Name of initiative: Omani Standard for Bread [173] Year: 2019 Leadership: Led by the government (MOCI) Approach: The reduction of 10% of salt content started, as voluntary, in late 2015 and it was followed by another 10% to a total of 20% in the main three bakeries supplying most of the bread in the country [174,175] It became mandatory as of May 2019: 0.5% (0.5 g of salt in 100 g of bread) for flat bread (Arabic bread) [175] For other kinds of bread such as sliced bread or French bread: 1% (1 g of salt in 100 g of bread) [175] 30% reduction of salt in food products (planned) [144,175,176] | Name of initiative: Campaign for reduction of Salt consumption Year: Planned for 2021–2022 Leadership: Led by the government and NGOs Approach: Social marketing campaigns, TV advertising, and events (planned) (Information provided by NFP) Name of initiative: World Salt Awareness Week Year: 2018 Leadership: Led by the government (MOH, Nutrition department) Approach: In line with the world’s celebration of the World Salt Awareness Week, awareness activities are organized during the 12th to the 18th of March [177] | Name of initiative: NA Year: 2016 Leadership: Led by the government (MOH) Approach: Limit the availability of high salt items Setting: Schools (not adopted yet) [178] | |
| Palestine | Name of initiative: National Health Strategy, 2021–2023 Year: 2019 Leadership: Led by the government (MOH) Approach: Food categories reformulated: gradual reduction of salt content in bread—mandatory; Targets set by year: 2019—0.9 g/100 g, 2021—0.8 g/100 g, 2022—0.7 g/100 g, 2023—0.6 g/100 g [179] | |||
| Qatar | Name of initiative: WHO Salt Reduction in Bread Initiative Year: 2013 Leadership: Led by the government (MOPH) (part of Nutrition & Physical Activity Action Plan 2011–2016) [180] Approach: A 20% salt reduction in bread has already been initiated in the main national bakery (Mesaieed Bakery or Qbake). This reduction has also been achieved in other main bakeries of the country [92,144,148,181]. The aim is to reduce salt content in bread samples that contain more than 0.8% of salt [148] Targets set for bread are mandatory Name of initiative: Initiative to reduce fat, sugar, and salt consumption in Qatar Year: 2019 Leadership: Led by the government (MOPH) Approach: Approach done through meetings with the food industry to set voluntary commitments to fat, salt, and sugar reduction. Targets for salt levels in foods, and (Information provided by NFP) | Name of initiative: Food and Beverage Labelling and Calories Count Initiative at Restaurants and Coffee Shops Year: 2018 Leadership: Led by the government (MOPH and MOCI) Approach: Social marketing (e.g., campaigns, meetings with food industries, press releases, events (Information provided by NFP) Name of initiative: Salt Awareness Week (annually) Leadership: Led by the government (MOPH) Approach: Social marketing (e.g., campaigns, TV advertising (conducted TV and radio interviews), events (Information provided by NFP) Name of initiative: Initiative to reduce fat, sugar and salt consumption in Qatar Year: 2019 Leadership: Led by the government (MOPH) Approach: Social marketing (e.g., campaigns, TV advertising (conducted TV and radio interviews), events (Information provided by NFP) | Name of initiative: Food & Beverage Guidelines; School Canteen Guidelines for Cafeterias and Vending Machines; Educational sessions in schools and workplaces Year: Ongoing Leadership: Led by the government (MOPH) Approach: Education, guidelines Setting: School, hospital, workplace, and public places such as grocery stores and shopping malls (Information provided by NFP) | |
| Tunisia | Name of initiative: Salt reduction program Year: 2015 Leadership: Led by the government Approach: Salt reduction program has already started in Bizerte city with the 22 bakeries; the program aims to progressively reduce the salt content of bread by 30%, voluntarily [144,147,182]. This is considered a pilot phase of the national action plan Name of initiative: Proposed reformulation of food products to contain less salt Year: 2018 Leadership: Led by the government (MOH) [86] (planned) | Name of initiative: Reducing salt intake and helping consumers make healthier choices that include less salt intakes Year: 2012 Leadership: Led by the government (MOH) Approach: NA [183] Name of initiative: Media campaigns to promote change in the intake of salt Year: 2018 Leadership: Led by the government (MOH) Approach: Not adopted [86] | Name of initiative: NA Year: 2018 Leadership: Led by the government (MOH) Approach: Mandatory—Recommend having salt content on the FOP (planned) [86,167,184]. | Name of initiative: NA Year: 2018 Leadership: Led by the government (MOH) Approach: Create supportive environments in public places by offering low-salt options Setting: Public places, schools, workplaces (not adopted yet) [86] |
| UAE | Name of initiative: Reformulate food products (National Action Plan) Year: 2017 Leadership: Led by the government (MOHAP) Approach: Voluntary—reformulate breads to have less than 0.5% salt content and reduce salt levels in other food products such as pickles, cheeses, fast foods, snacks and other processed food (National Action Plan) (MOHAP Task Force on Reduction of Salt already established) [185] | Name of the initiative: Reduction of salt intake by 30% (National Action Plan) Year: 2017 Leadership: Led by the government (MOHAP) Approach: Recommendations for media campaigns and programs to spread awareness in the population (including nutrition labelling) and food industries, catering businesses including restaurants cafes, kiosk etc. (MOHAP Task Force on Reduction of Salt already established) [185,186] Name of initiative: Exclude salt from your food menu Year: 2019 Leadership: Led by the government (MOHAP) Approach: Instagram posts about high, medium and low salt foods [187] Name of initiative: Pay attention to the dangers of excessive salt intake! Year: 2018 Leadership: Led by the government (MOHAP) Approach: Instagram posts about food preparation tips to decrease salt [188] | Name of initiative: NA Year: 2020 Leadership: Led by the government Approach: Voluntary—traffic light labelling (Planned)—to become mandatory as of 2022 [167] | Name of initiative: Healthy recipes for school lunch bag Year: 2019 Leadership: Led by government Approach: Voluntary Setting: Schools [123] |
| Country | National Strategy and/or Action Plan |
|---|---|
| Bahrain | Reduce intake of salt-containing foods to less than 5 g/day amongst adults (>18 years)—2012 (MOH) (National Action Plan for 15 years, for the Reduction of NCDs) [189] |
| Egypt | Reach a target of 20% relative reduction by 2021 and 10% relative reduction (9 g/day) by 2025 for adults—2017 (MOHP) (National Multisectoral Action Plan for Prevention and Control of NCDs 2017–2021) [31] |
| Iran | A 30% relative reduction in mean population intake of salt/sodium—2015 (Iranian National Committee for NCDs Prevention and Control) [190] |
| Jordan | Reduction of salt intake in the population to <5 g/day—2015 (MOH) (National Strategy And Plan Of Action Against Diabetes, Hypertension, Dyslipidemia And Obesity in Jordan) [191] |
| KSA | Salt reduction as per the WHO recommendation (no more than 5 g/day or 2000 mg of sodium/day)—2018 (SFDA) (Healthy Food Strategy, vision 2030) [157,159] |
| Kuwait | WHO recommended maximum of 5 g/day per adult—2013 (MOH) (Kuwaitis lower blood pressure by reducing salt in bread) [62] |
| Morocco | A reduction in population salt intake by 10% by 2025—2015 (MOH) (Prevention of NCDs: Multisectoral Action Plan for a Healthy Lifestyle 2015–2020) [172] |
| Oman | Recommended salt intake: 5 g/day—2019 (MOH) (National Nutrition Strategy 2020–2030, National Plan for Prevention of NCD 2016–2025) [173] |
| Qatar | Salt intake as per the WHO recommended maximum of 5 g/day for adults—2013 (MOPH) (Part of Nutrition & Physical Activity Action Plan 2011–2016) [180] |
| Tunisia | Reduce mean salt intake by 30% by 2025 amongst 15 year olds and above—2018 (MOH) (National Multisectoral Strategy for Prevention and Control of NCDs) [86] |
| UAE | Reduce population salt intake by 30%—2017 (MOHAP) (National Action Plan in Nutrition) [185] |
Publisher’s Note: MDPI stays neutral with regard to jurisdictional claims in published maps and institutional affiliations. |
© 2021 by the authors. Licensee MDPI, Basel, Switzerland. This article is an open access article distributed under the terms and conditions of the Creative Commons Attribution (CC BY) license (https://creativecommons.org/licenses/by/4.0/).
Share and Cite
Al-Jawaldeh, A.; Taktouk, M.; Chatila, A.; Naalbandian, S.; Al-Thani, A.-A.M.; Alkhalaf, M.M.; Almamary, S.; Barham, R.; Baqadir, N.M.; Binsunaid, F.F.; et al. Salt Reduction Initiatives in the Eastern Mediterranean Region and Evaluation of Progress towards the 2025 Global Target: A Systematic Review. Nutrients 2021, 13, 2676. https://doi.org/10.3390/nu13082676
Al-Jawaldeh A, Taktouk M, Chatila A, Naalbandian S, Al-Thani A-AM, Alkhalaf MM, Almamary S, Barham R, Baqadir NM, Binsunaid FF, et al. Salt Reduction Initiatives in the Eastern Mediterranean Region and Evaluation of Progress towards the 2025 Global Target: A Systematic Review. Nutrients. 2021; 13(8):2676. https://doi.org/10.3390/nu13082676
Chicago/Turabian StyleAl-Jawaldeh, Ayoub, Mandy Taktouk, Aya Chatila, Sally Naalbandian, Al-Anoud Mohammed Al-Thani, Majid M. Alkhalaf, Salima Almamary, Rawhieh Barham, Nimah M. Baqadir, Faisal F. Binsunaid, and et al. 2021. "Salt Reduction Initiatives in the Eastern Mediterranean Region and Evaluation of Progress towards the 2025 Global Target: A Systematic Review" Nutrients 13, no. 8: 2676. https://doi.org/10.3390/nu13082676