
Effects of Amino Acids Supplementation on Lipid and Glucose Metabolism in HepG2 Cells


Abstract
:
1. Introduction
2. Materials and Methods
2.1. Cell Culture
2.2. Amino Acids Treatments
2.3. Glucose and Lipid Treatments
2.4. Cell Viability Assays
2.5. Oil Red O Staining
2.6. Quantitative PCR
2.7. Statistical Analysis
3. Results
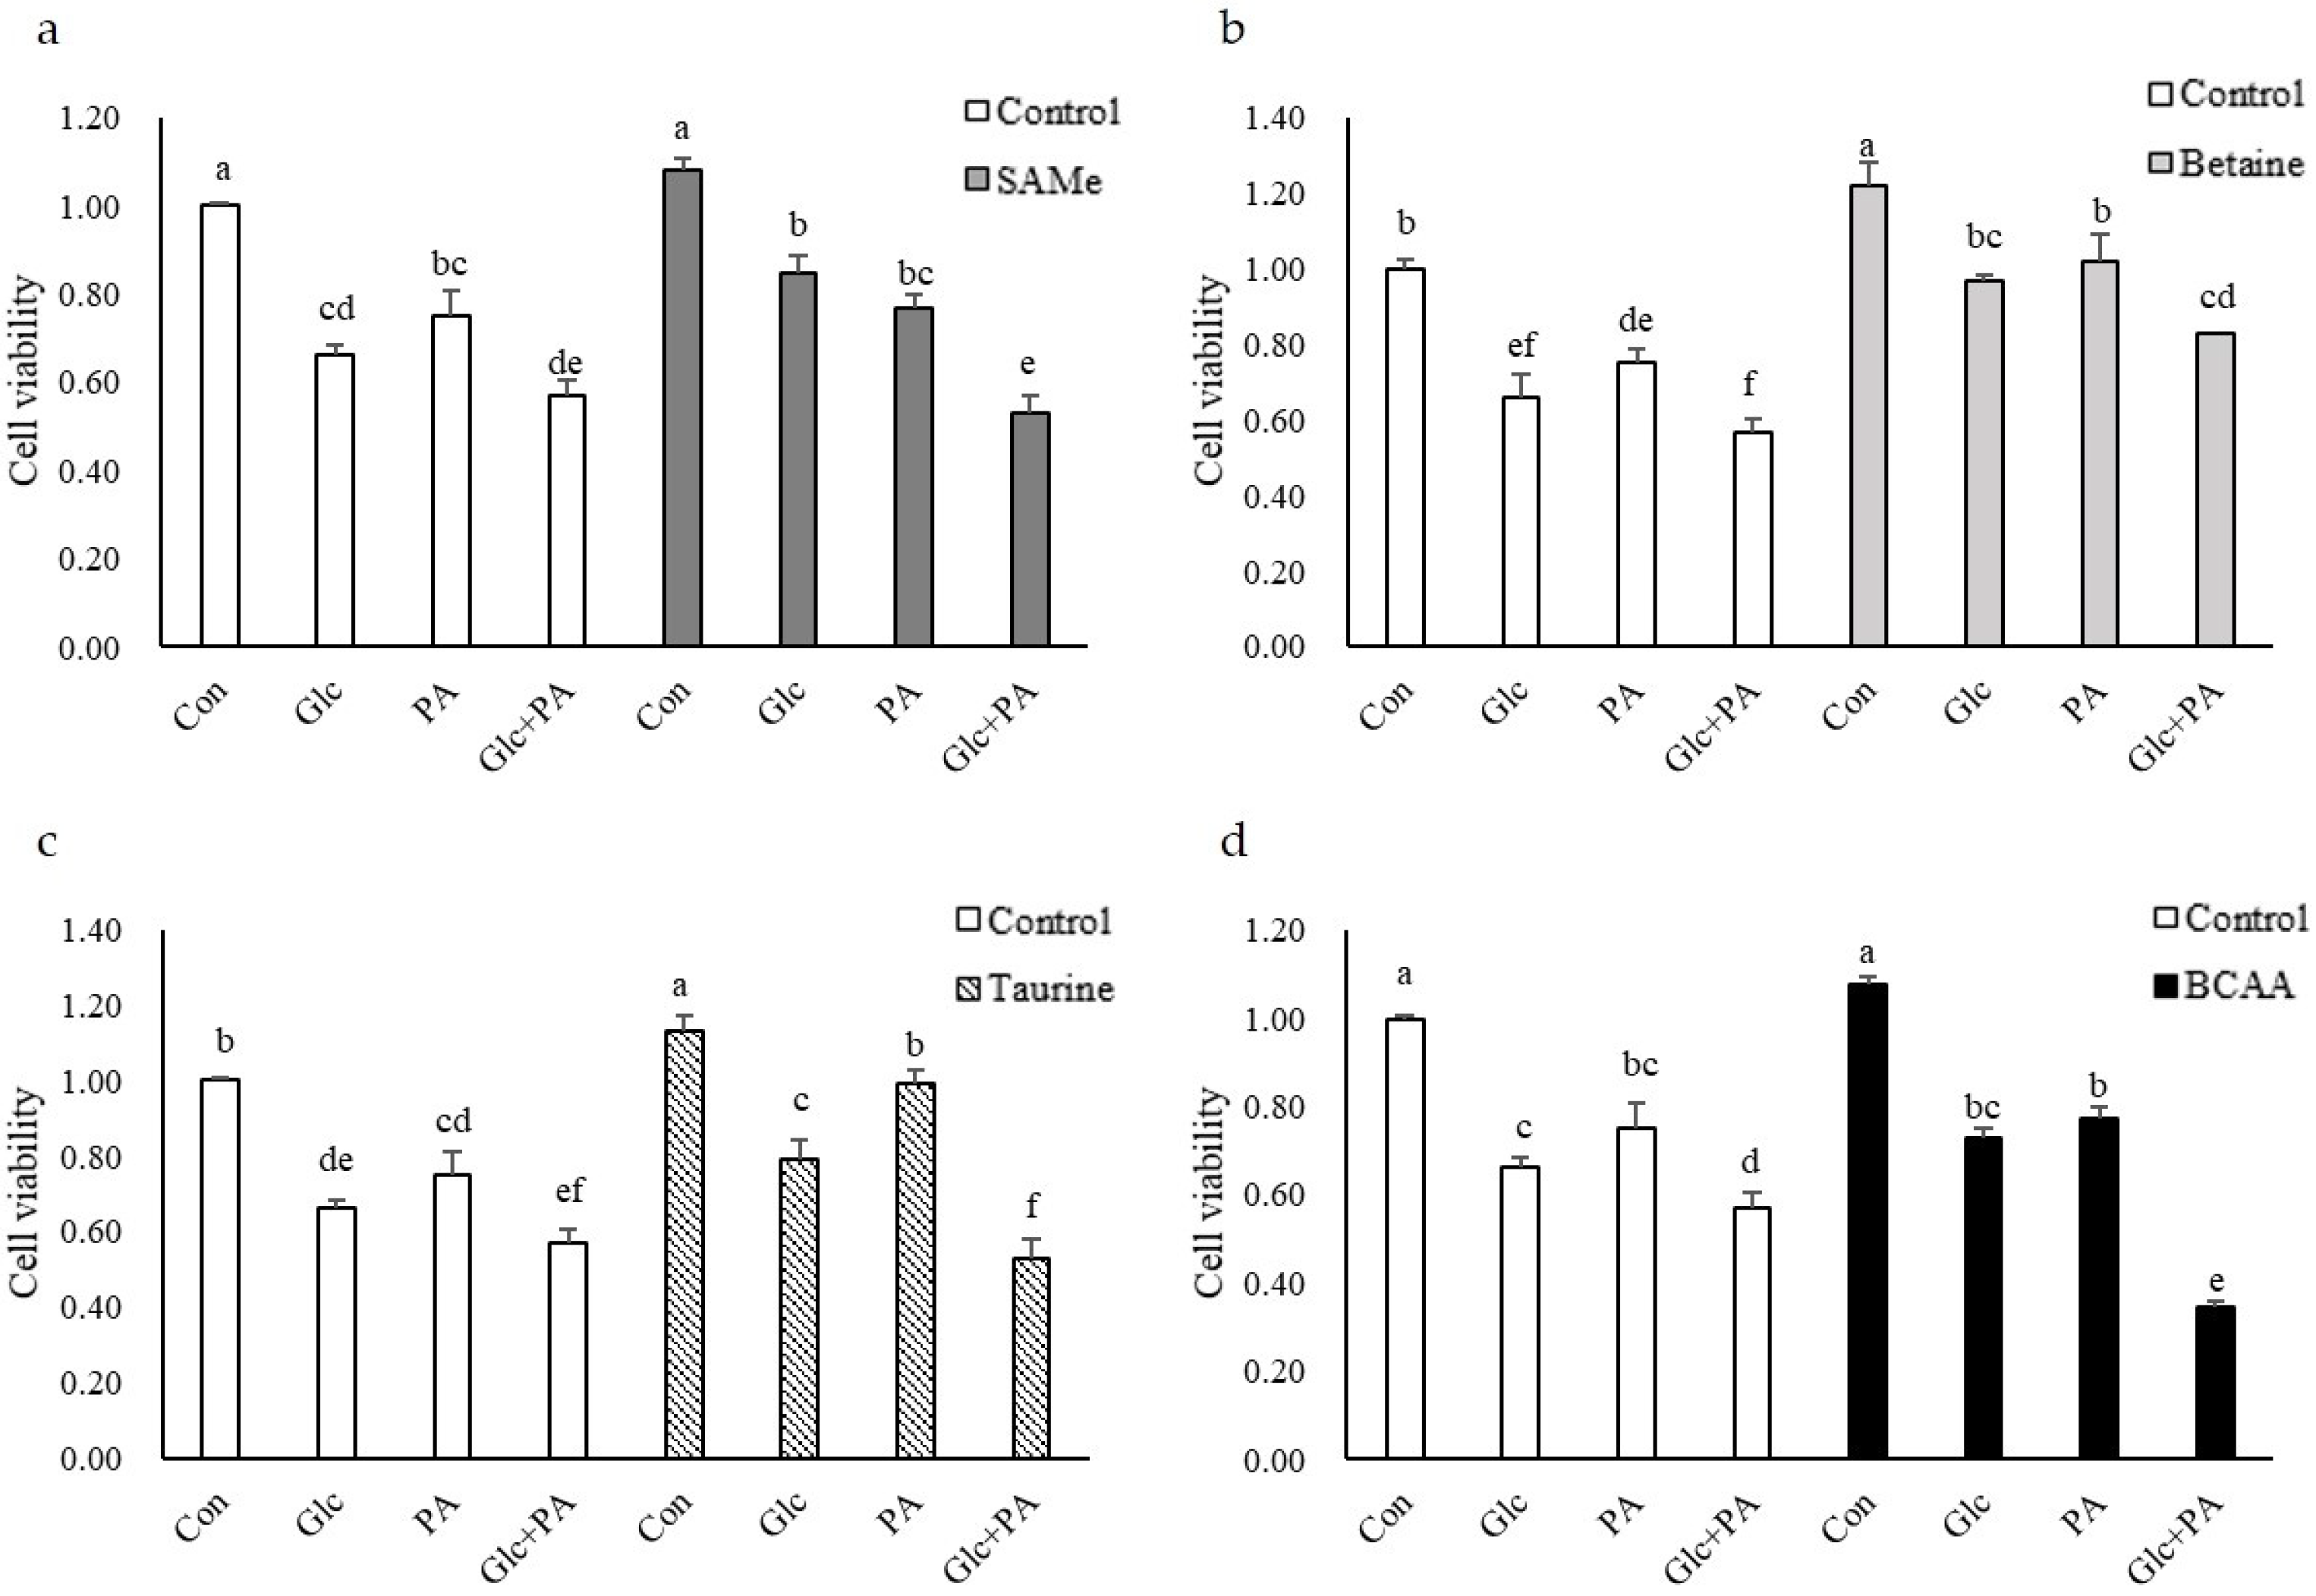
3.1. Cell Viability
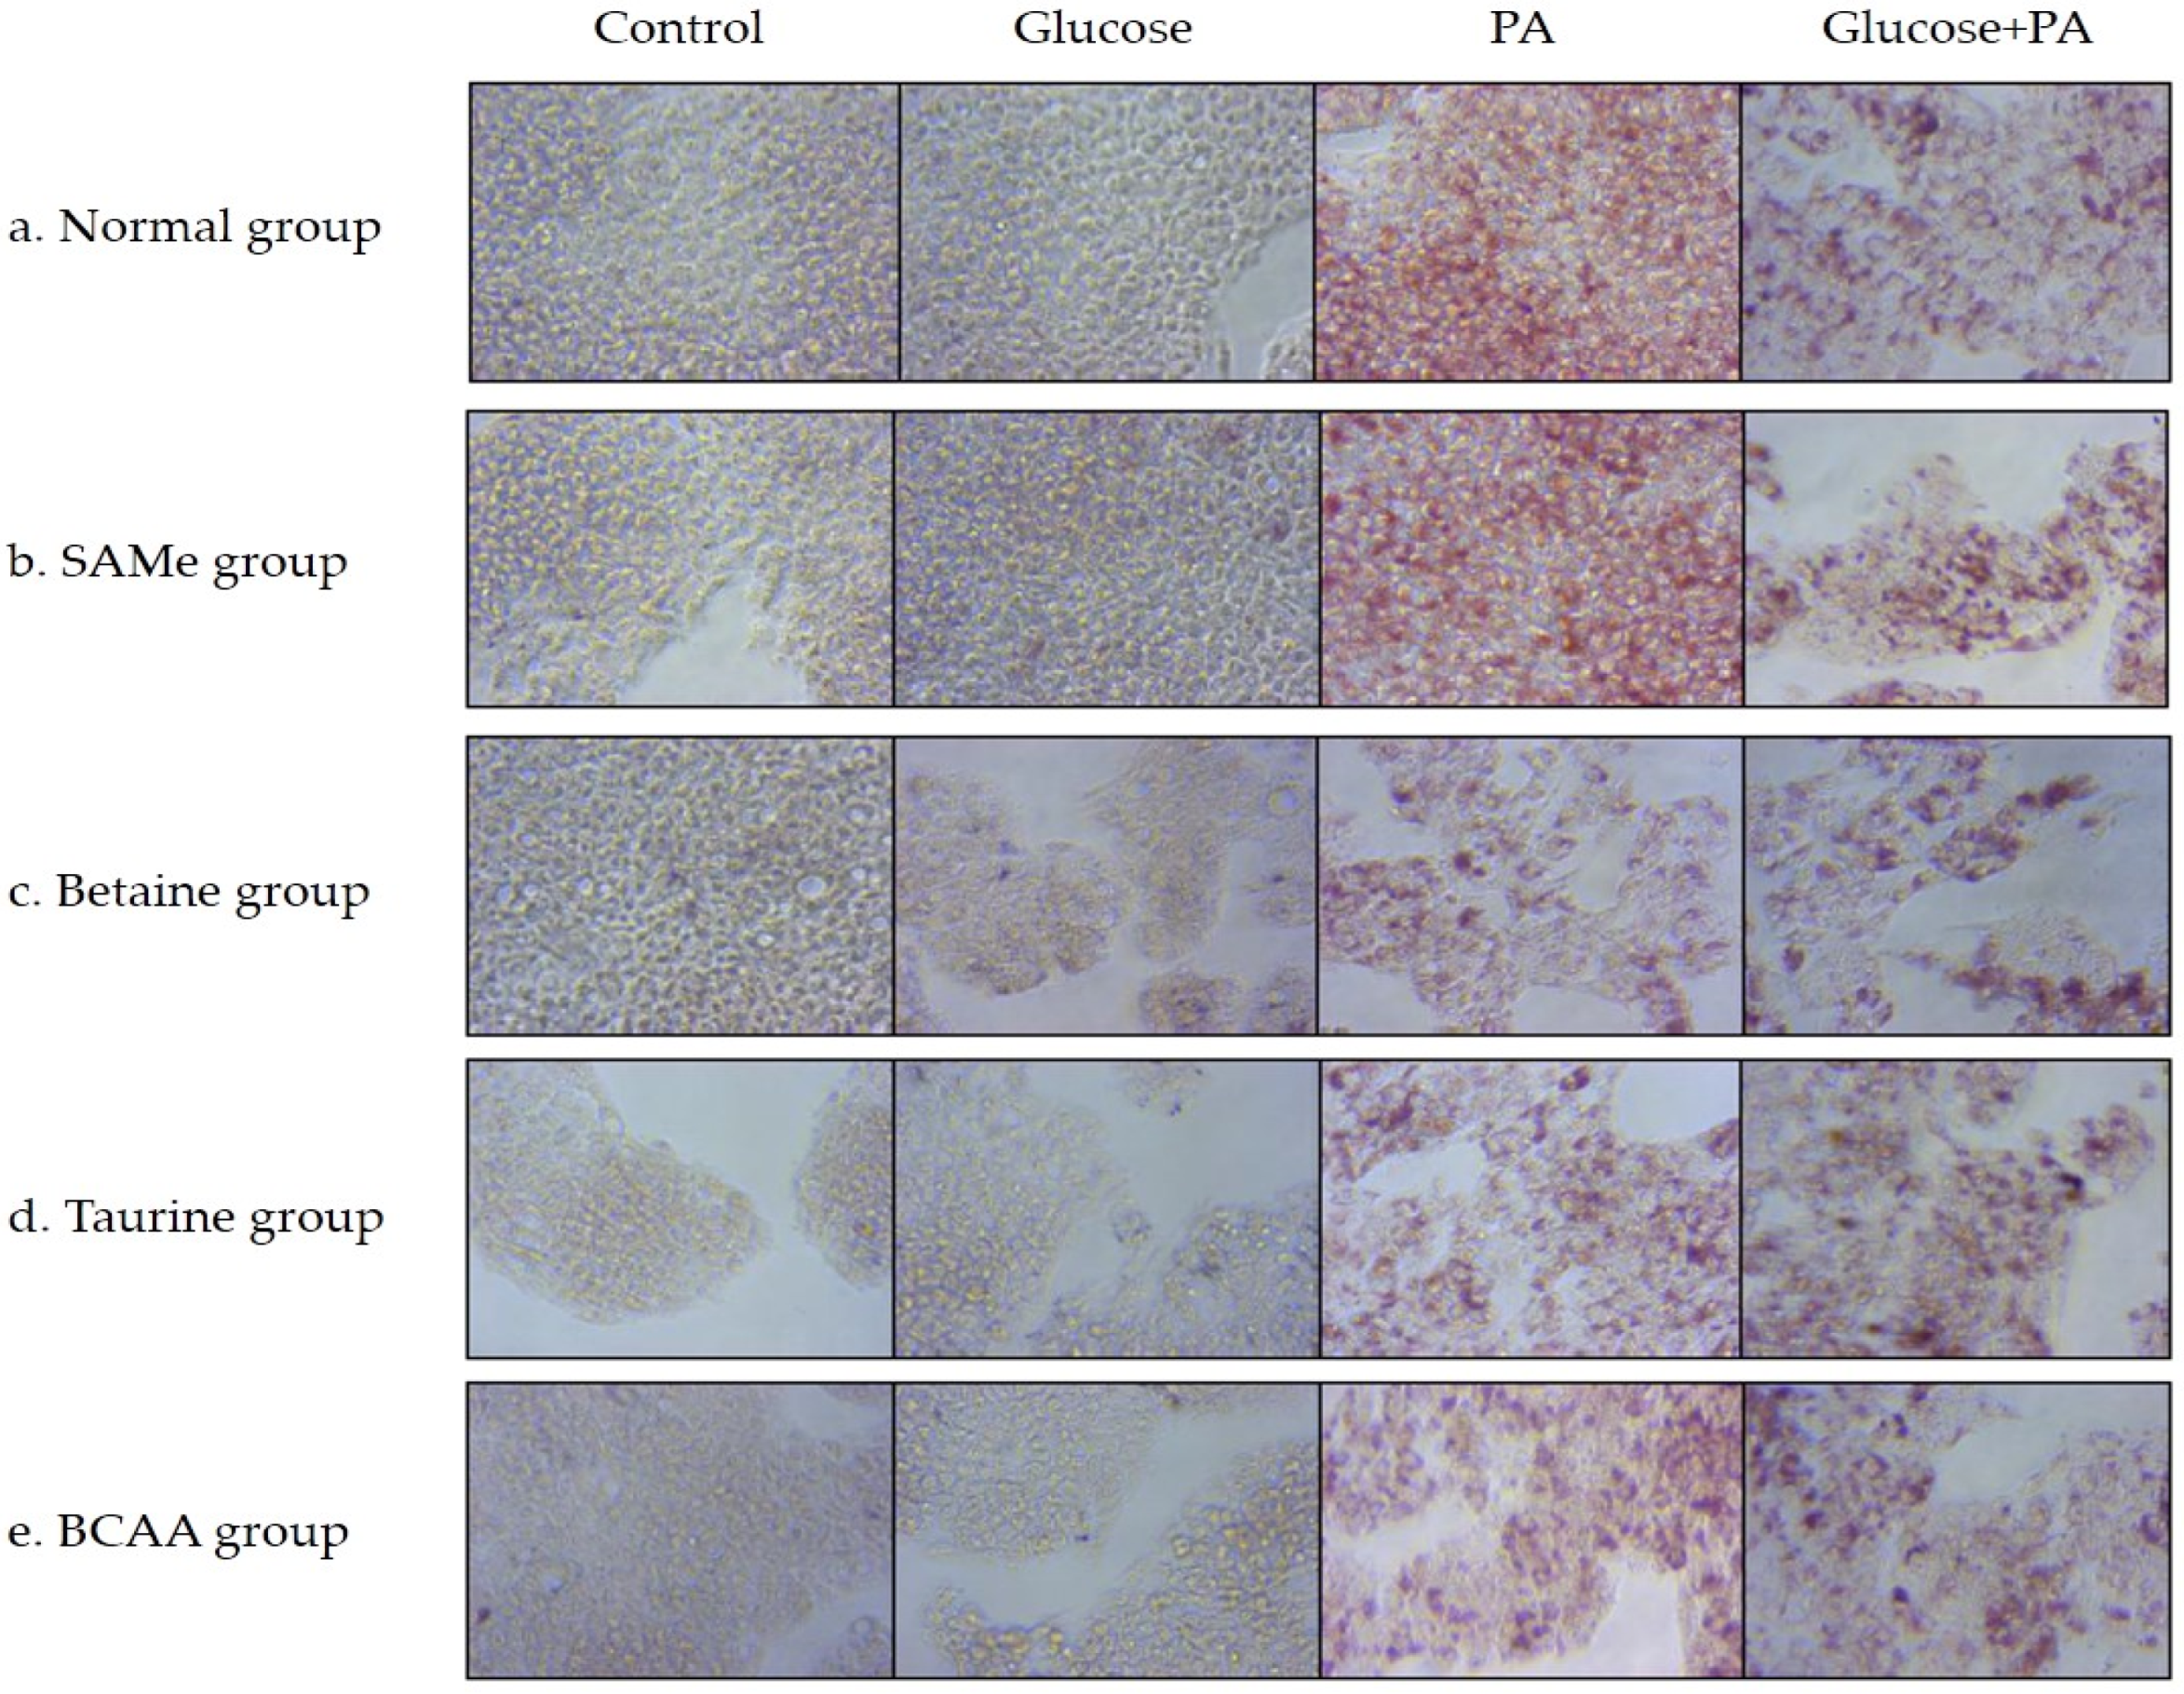
3.2. Effects of Amino Acids on TG Accumulation in Glucose- and/or PA-Treated HepG2 Cells
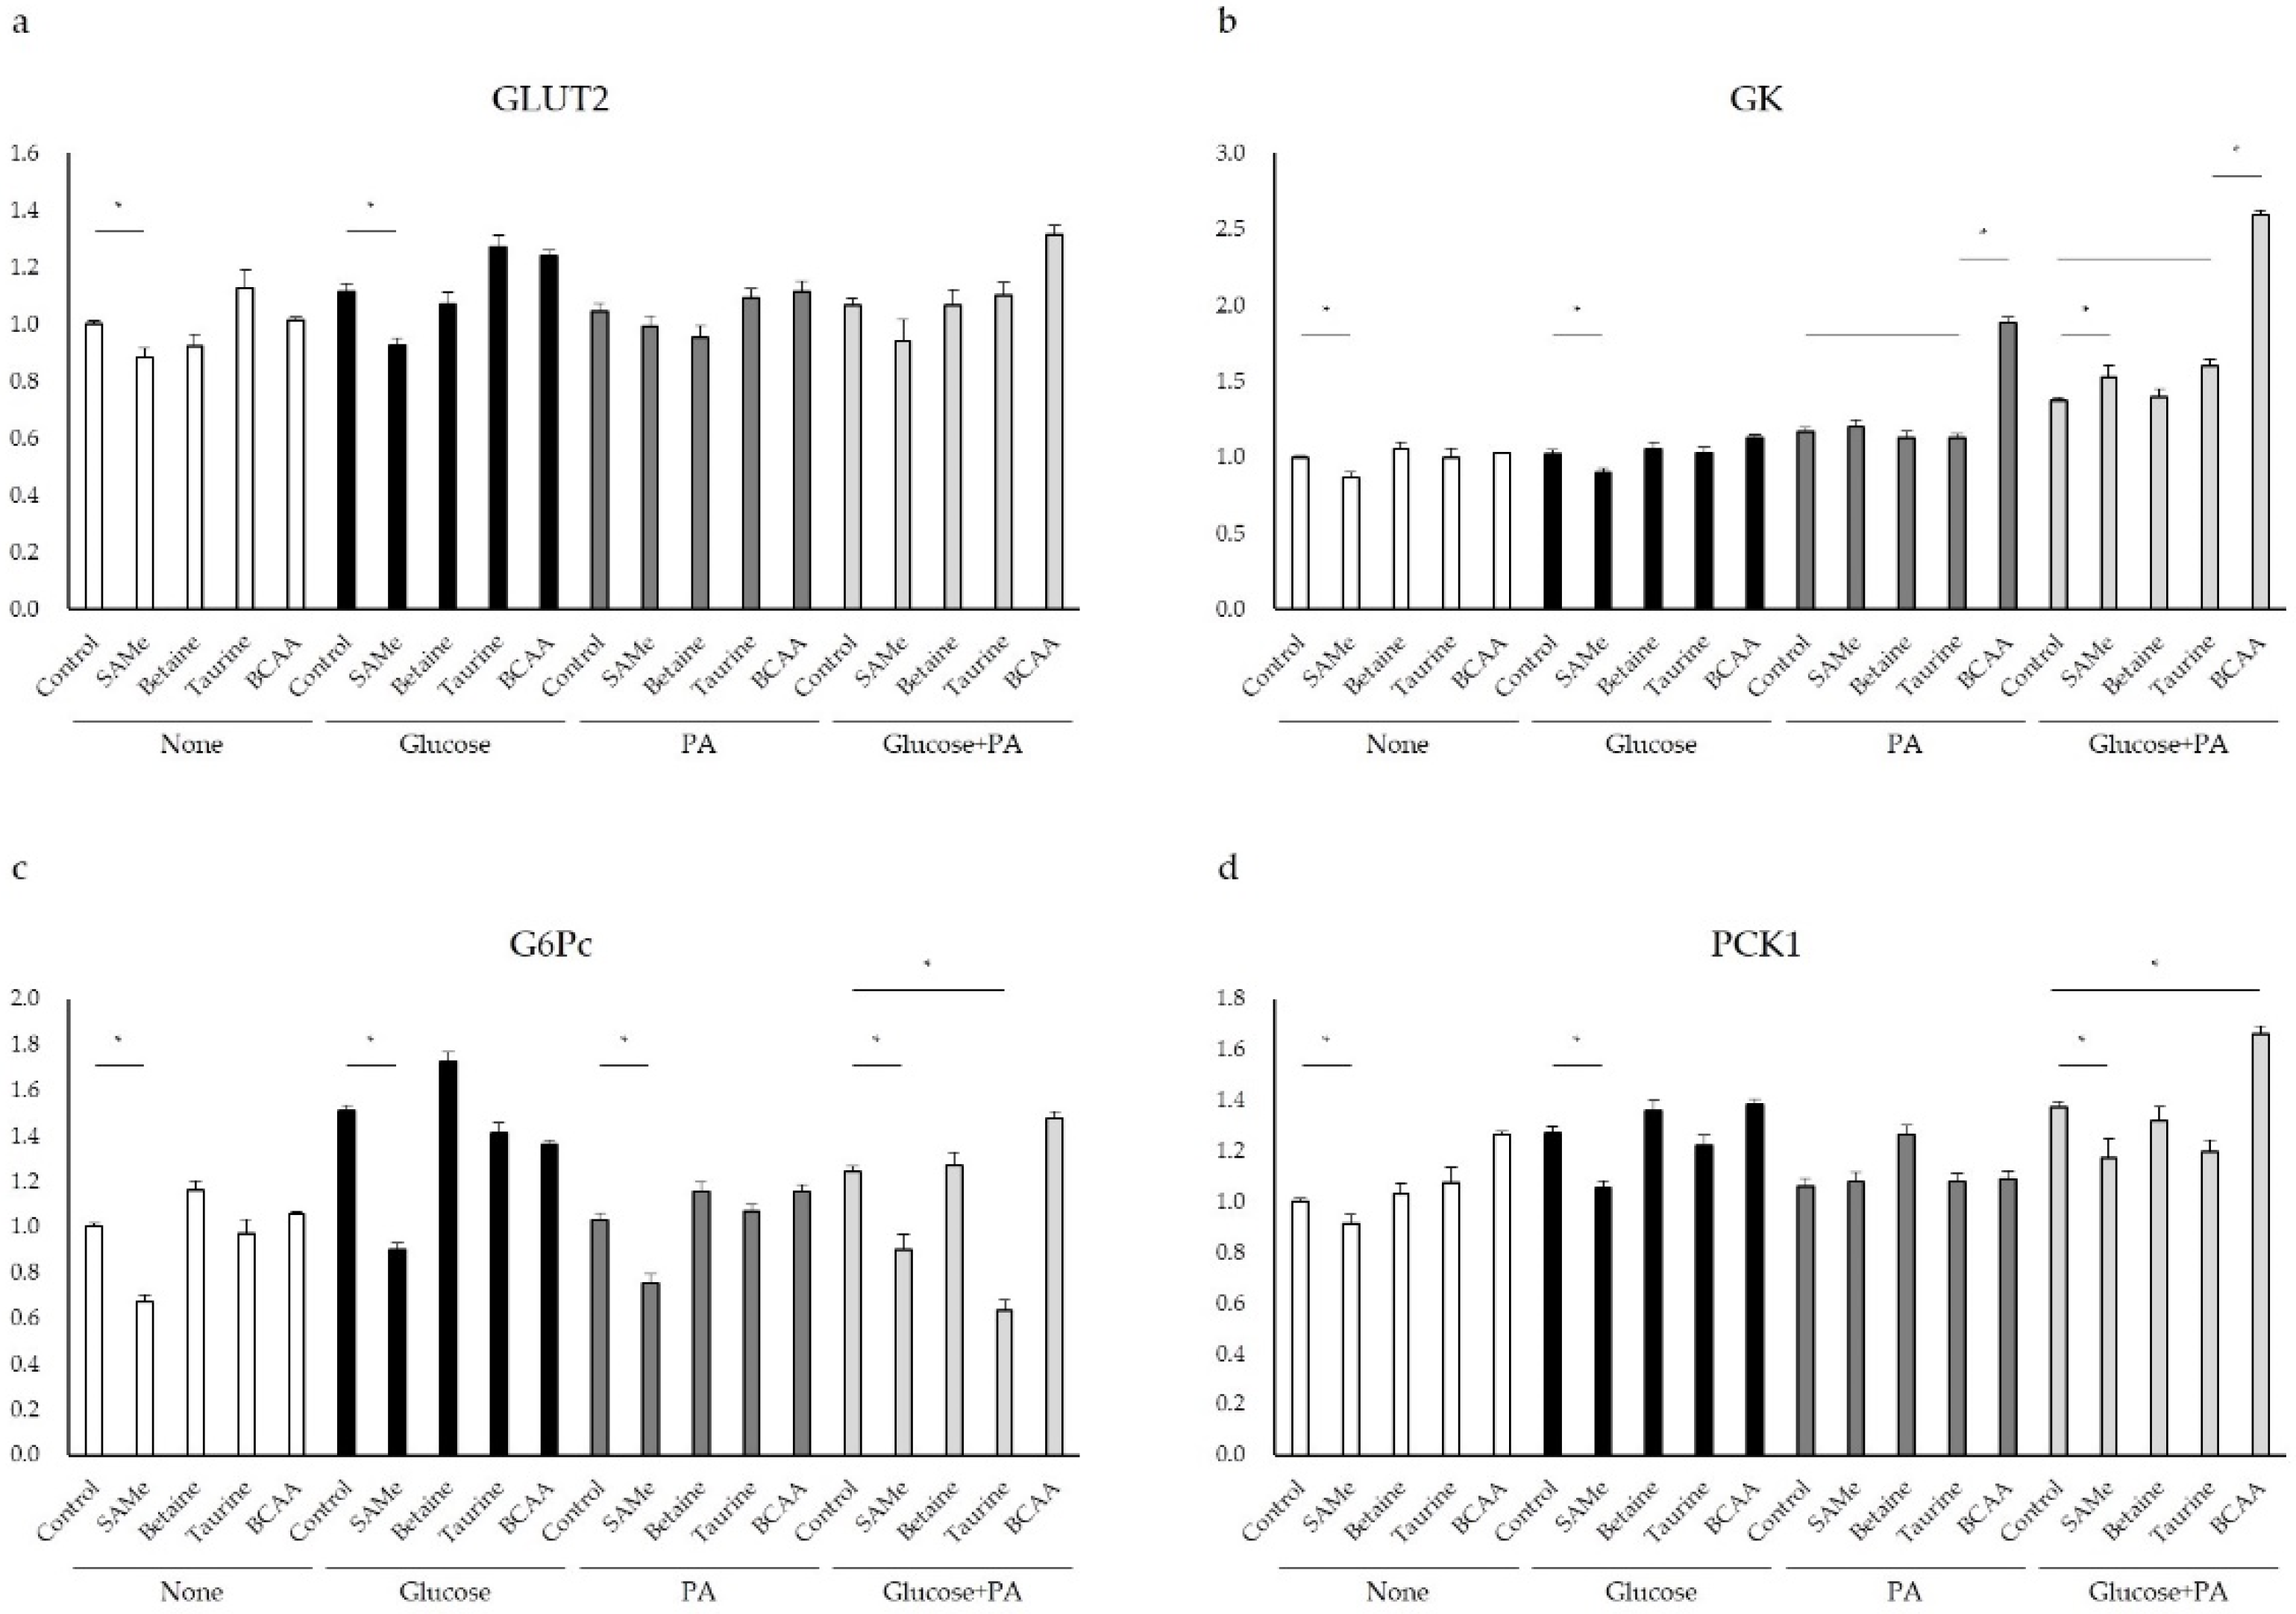
3.3. Glucose Metabolism after Amino Acids Pretreatment with Glucose and/or PA Treatment
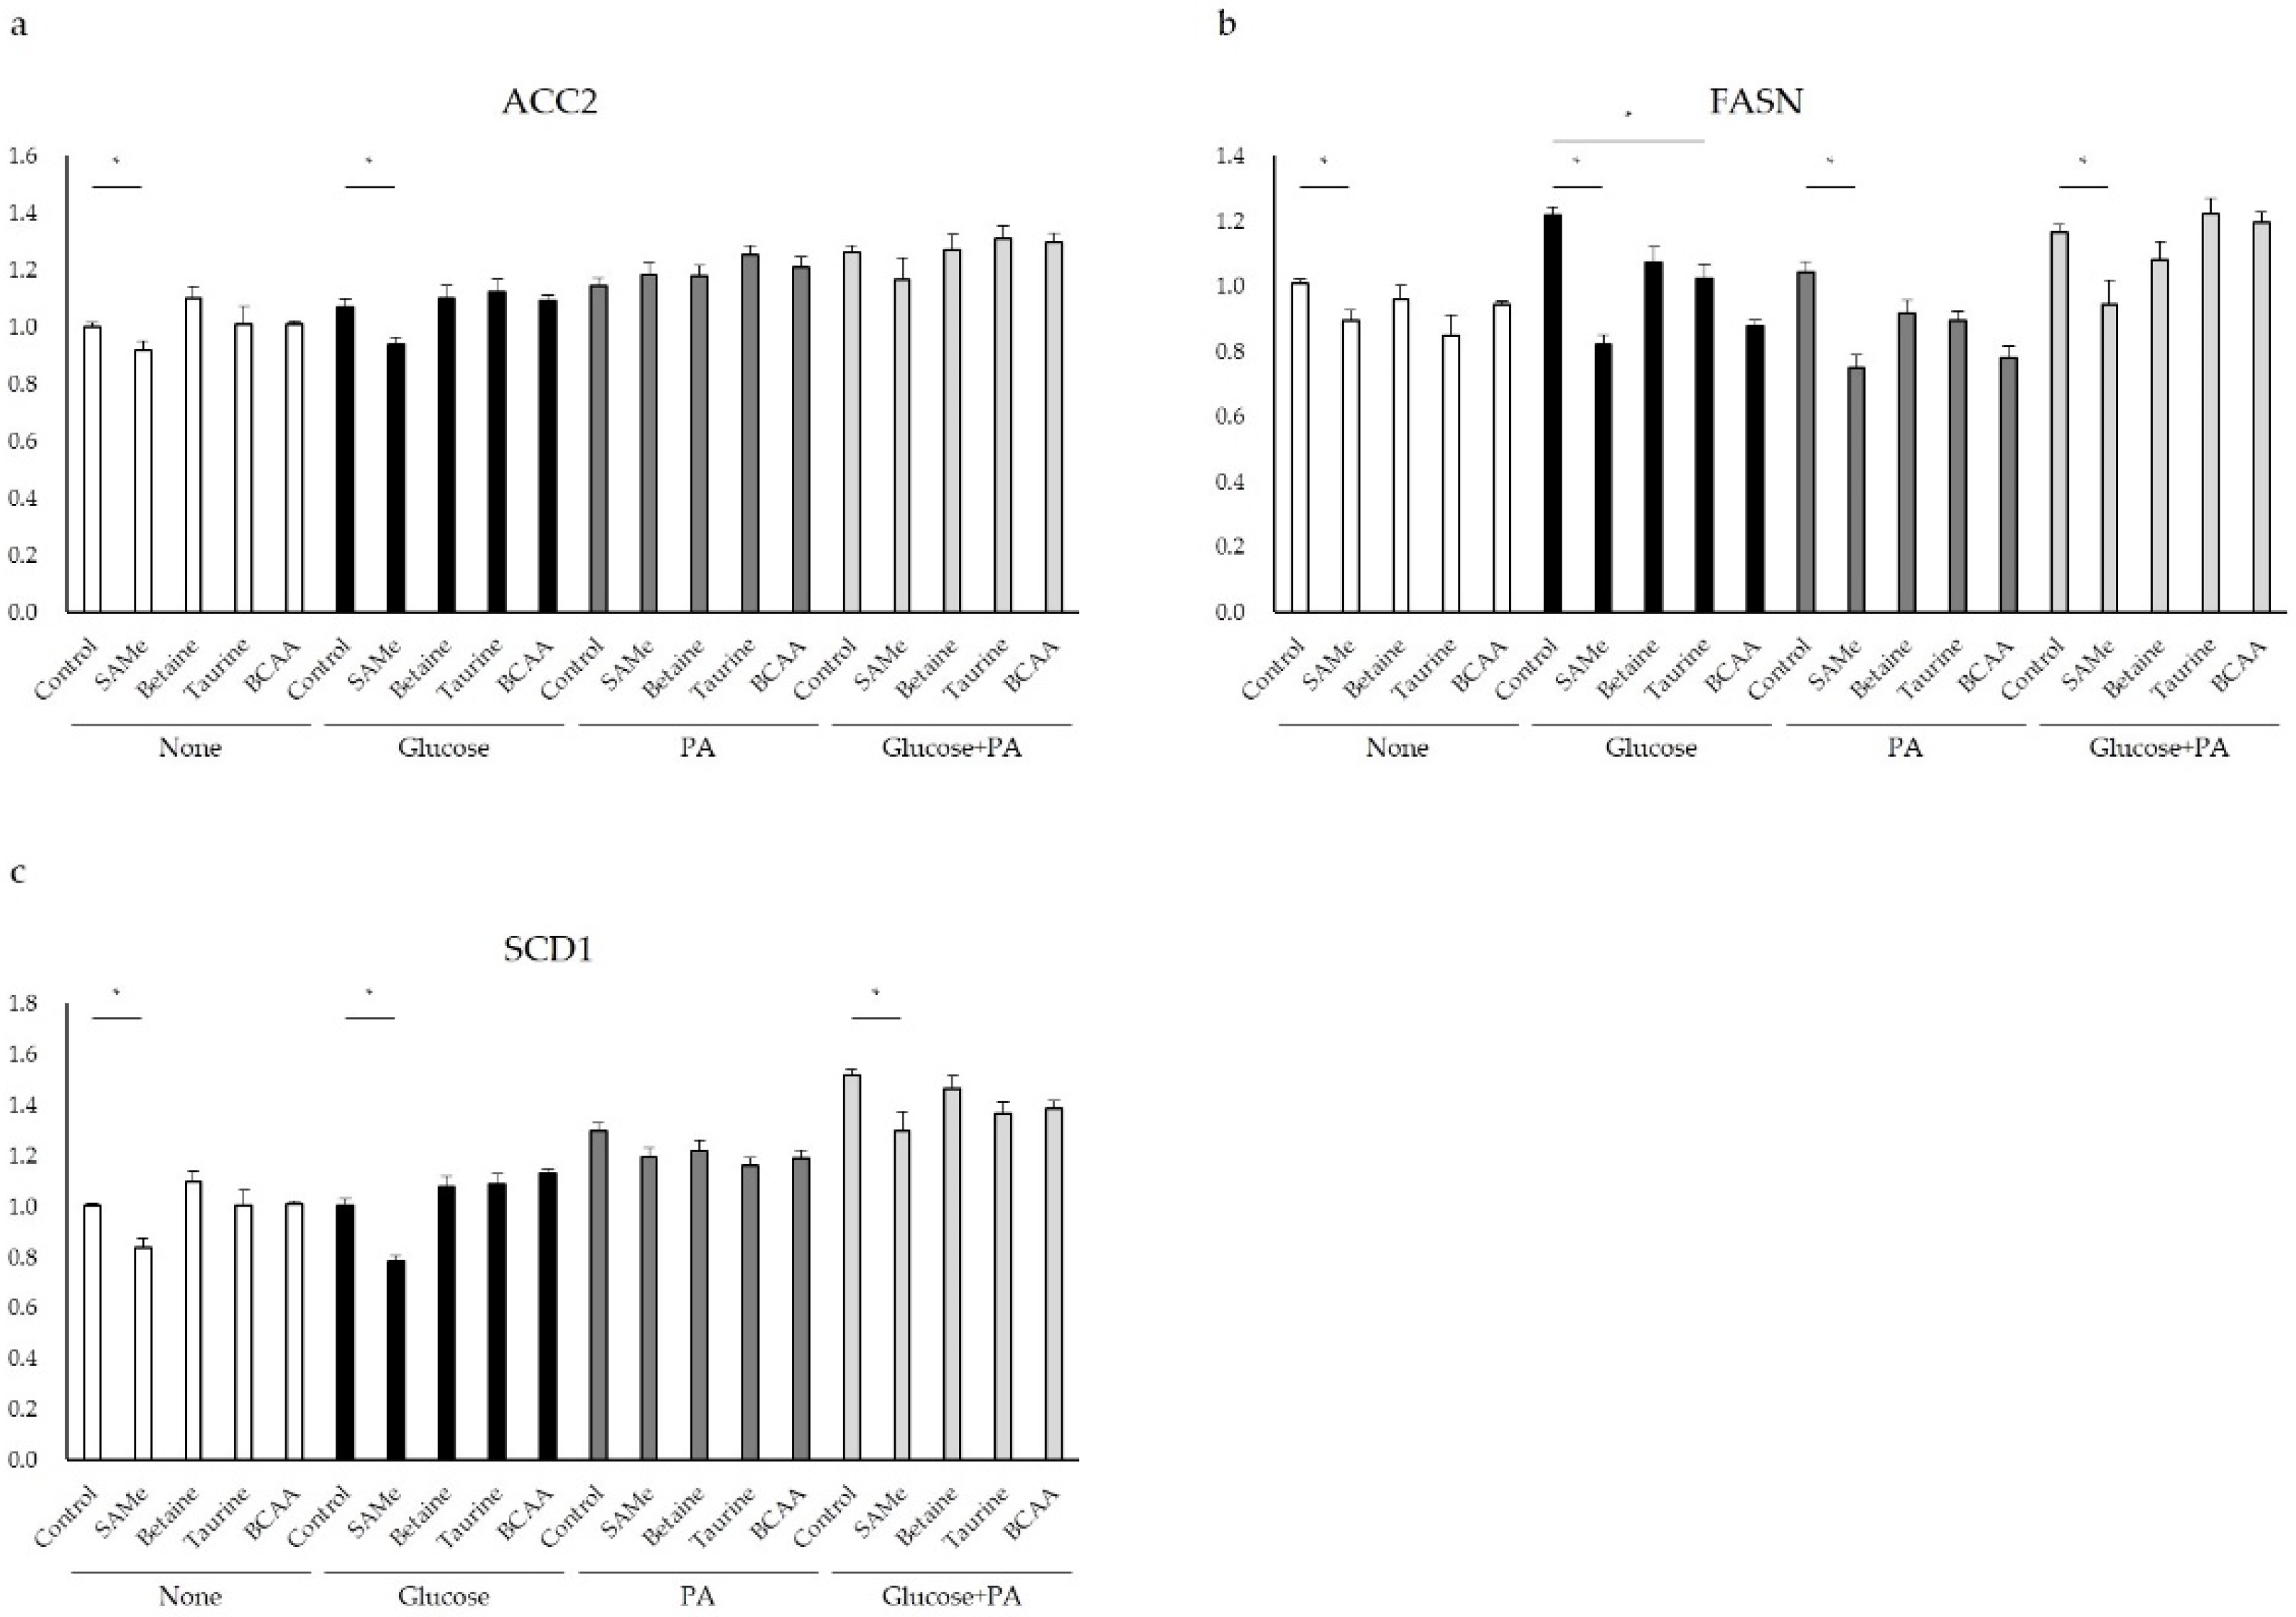
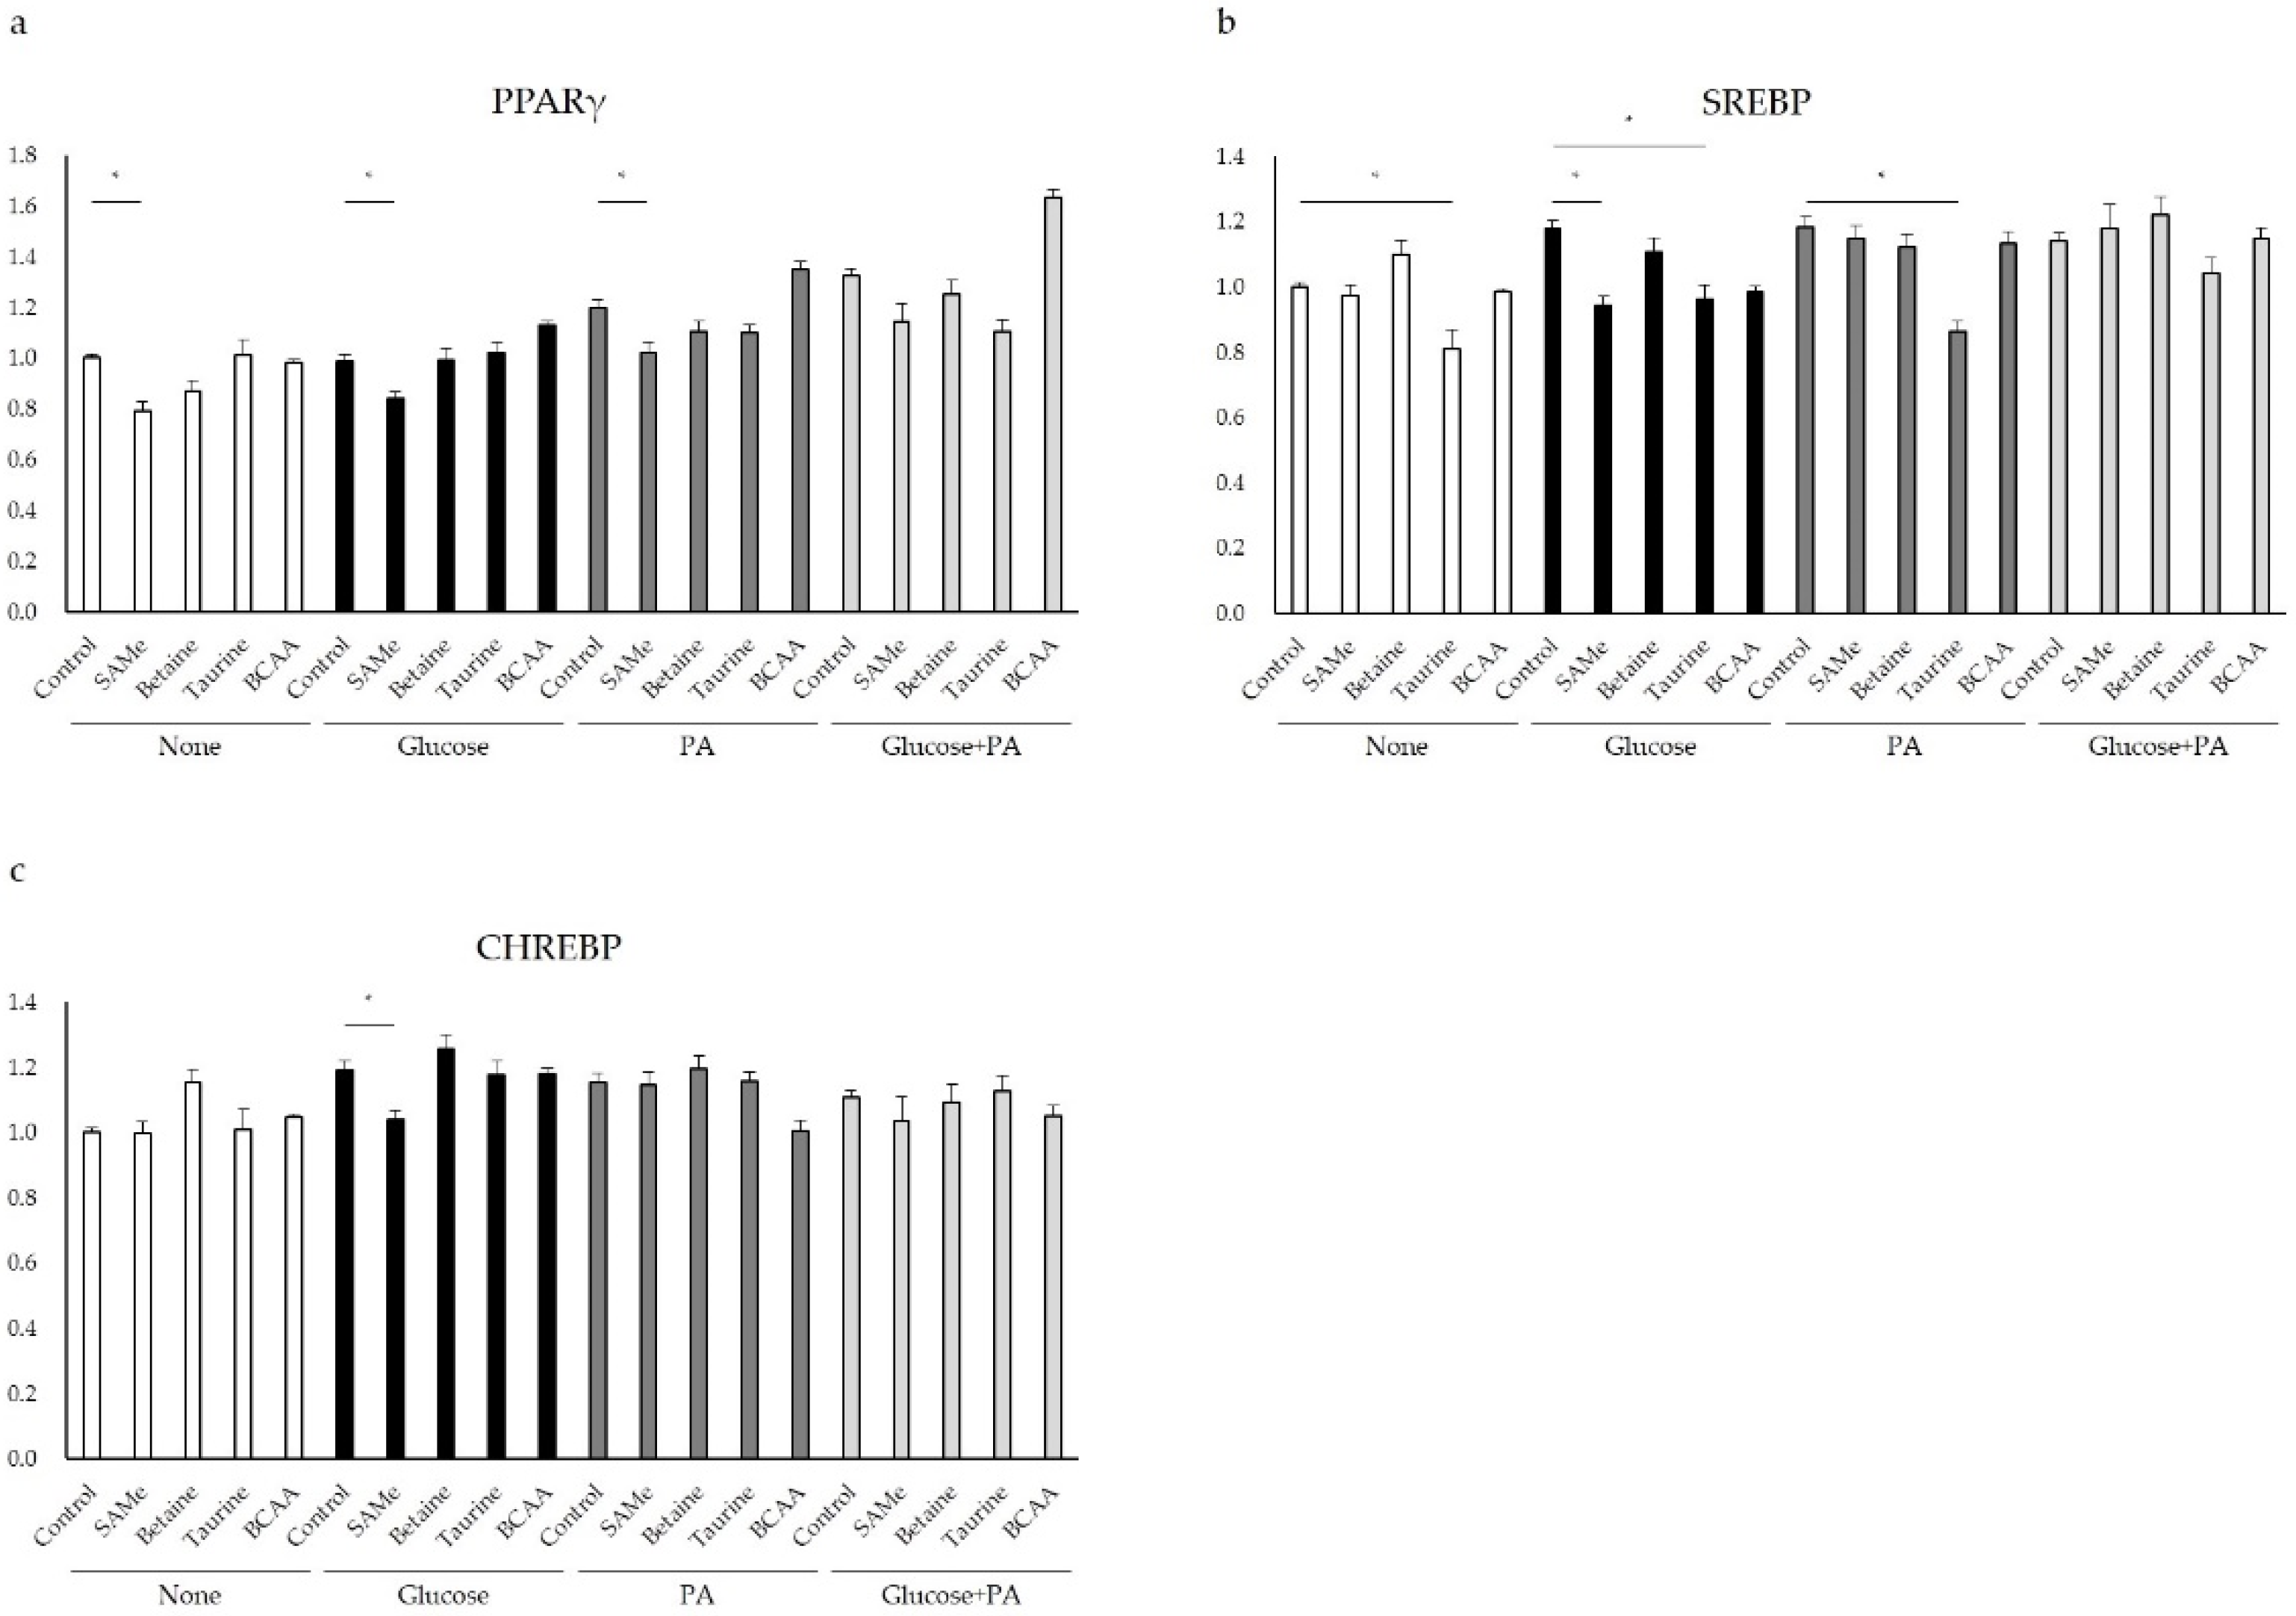
3.4. Genes Involved in Lipid Metabolism after Amino Acids Pretreatment and Glucose and/or PA Treatment
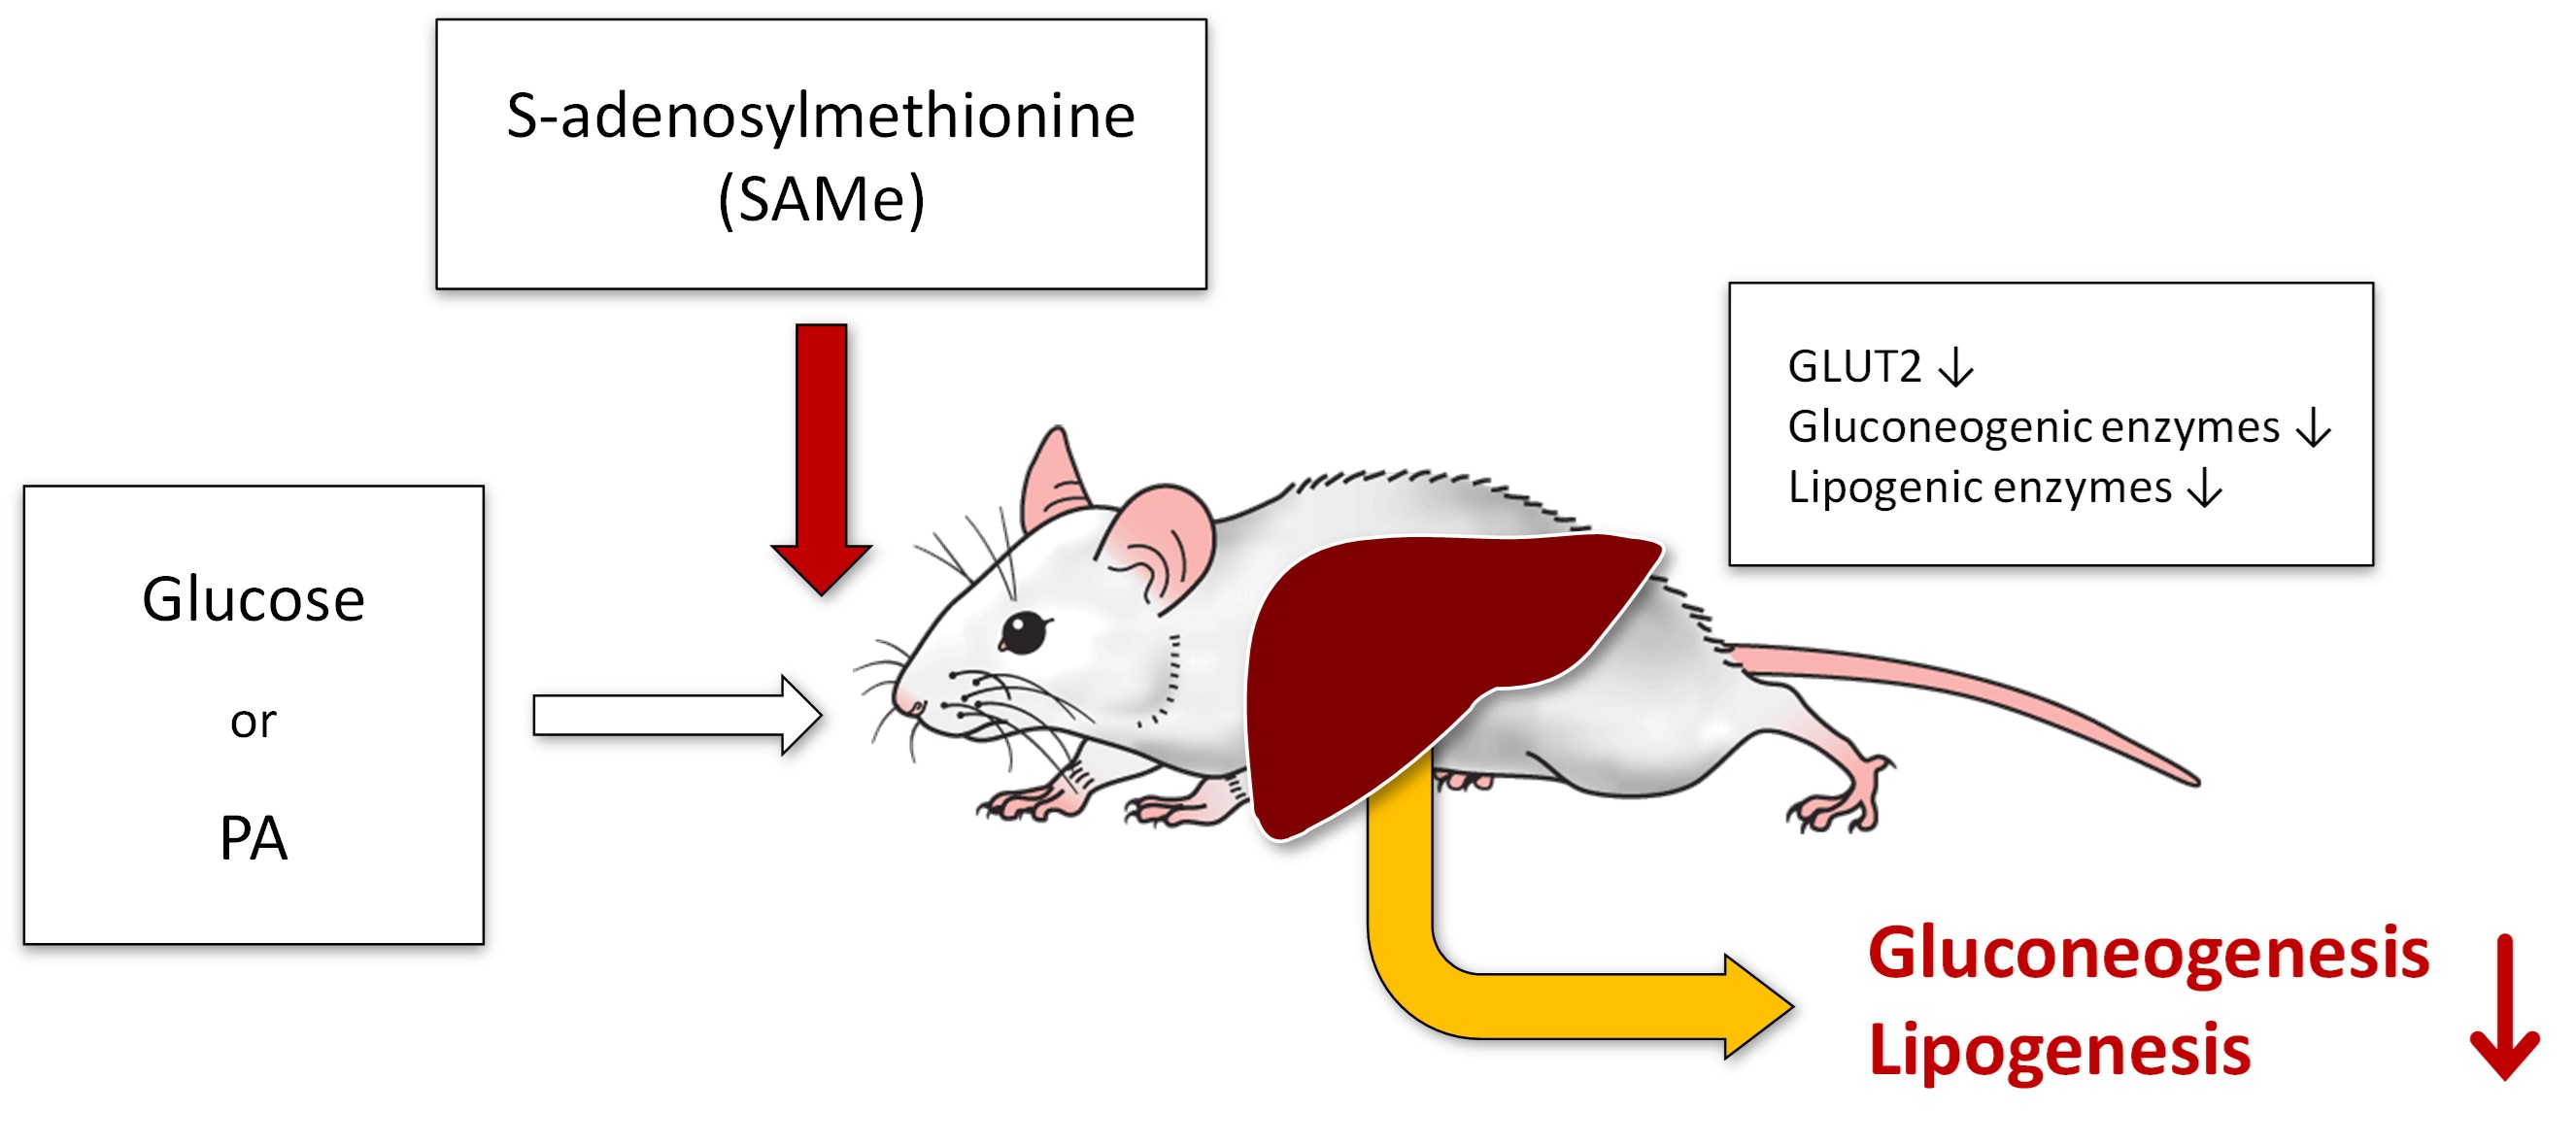
3.5. Regulation of Glucose and Lipid Metabolism after Amino Acids Pretreatment and Glucose and/or PA Treatment
4. Discussion
5. Conclusions
Author Contributions
Funding
Institutional Review Board Statement
Informed Consent Statement
Data Availability Statement
Conflicts of Interest
References
- Kaur, J. A Comprehensive Review on Metabolic Syndrome. Cardiol. Res. Pract. 2014, 2014, 943162. [Google Scholar] [CrossRef]
- Cornier, M.; Dabelea, D.; Hernandez, T.L.; Lindstrom, R.C.; Steig, A.J.; Stob, N.R.; Van Pelt, R.E.; Wang, H.; Eckel, R.H. The Metabolic Syndrome. Endocr. Rev. 2008, 29, 777–822. [Google Scholar] [CrossRef] [PubMed]
- Järvinen, H. Non-alcoholic fatty liver disease as a cause and a consequence of metabolic syndrome. Lancet Diabetes Endocrinol. 2014, 2, 901–910. [Google Scholar] [CrossRef]
- De Koning, L.; Malik, V.S.; Kellogg, M.D.; Rimm, E.B.; Willett, W.C.; Hu, F.B. Sweetened beverage consumption, incident coronary heart disease, and biomarkers of risk in men. Circulation 2012, 125, 1735–1741. [Google Scholar] [CrossRef] [PubMed] [Green Version]
- Jump, D.B.; Clarke, S.D. Regulation of gene expression by dietary fat. Ann. Rev. Nutr. 1999, 19, 63–90. [Google Scholar] [CrossRef]
- Jung, Y.S. Metabolism of Sulfur-Containing Amino Acids in the Liver: A Link between Hepatic Injury and Recovery. Biol Pharm Bull. 2015, 38, 971–974. [Google Scholar] [CrossRef] [Green Version]
- Mato, J.M.; Martínez-Chantar, M.L.; Lu, S.C. S-adenosylmethionine metabolism and liver disease. Ann. Hepatol. 2013, 12, 183–189. [Google Scholar] [CrossRef]
- Zhang, W.; Wang, L.W.; Wang, L.K.; Li, X.; Zhang, H.; Luo, L.P.; Gong, Z.J. Betaine Protects Against High-Fat-Diet-Induced Liver Injury by Inhibition of High-Mobility Group Box 1 and Toll-Like Receptor 4 Expression in Rats. Dig. Dis. Sci. 2013, 58, 3198–3206. [Google Scholar] [CrossRef]
- Deminice, R.; Da Silva, R.P.; Lamarre, S.G.; Kelly, K.B.; Jacobs, R.L.; Brosnan, M.E.; Brosnan, J.T. Betaine supplementation prevents fatty liver induced by a high-fat diet: Effects on one carbon metabolism. Amino Acids 2015, 47, 839–846. [Google Scholar] [CrossRef] [PubMed]
- Kathirvel, E.; Morgan, K. Betaine improves nonalcoholic fatty liver and associated hepatic insulin resistance: A potential mechanism for hepatoprotection by betaine. Am. J. Physiol. Gastrointest. Liver Physiol. 2010, 299, 1068–1077. [Google Scholar] [CrossRef] [Green Version]
- Ejaz, A.; Martinez-Guino, L.; Goldfine, A.B.; Ribas-Aulinas, F.; De Nigris, V.; Ribó, S.; Lerin, C. Dietary Betaine Supplementation Increases Fgf21 Levels to Improve Glucose Homeostasis and Reduce Hepatic Lipid Accumulation in Mice. Diabetes 2016, 65, 902–912. [Google Scholar] [CrossRef] [Green Version]
- Lee, J.Y.; Da, W.J.; Park, H.A.; Kim, S.J.; Chung, J.H.; Moon, C.K.; Kim, Y.C. Effect of taurine on biliary excretion and metabolism of acetaminophen in male hamsters. Biol. Pharm. Bull. 2004, 27, 1792–1796. [Google Scholar] [CrossRef] [PubMed] [Green Version]
- Shimada, K.; Jong, C.J.; Takahashi, K.; Schaffer, S.W. Role of ROS production and turnover in the antioxidant activity of taurine. Adv. Exp. Med. Biol. 2015, 803, 581–596. [Google Scholar] [PubMed]
- McCarty, M.F. Supplementation with Phycocyanobilin, Citrulline, Taurine, and Supranutritional Doses of Folic Acid and Biotin-potential for Preventing or Slowing the Progression of Diabetic Complications. Healthcare 2017, 5, 15. [Google Scholar] [CrossRef] [Green Version]
- Chen, W.; Guo, J.; Zhang, Y.; Zhang, J. The beneficial effects of taurine in preventing metabolic syndrome. Food Funct. 2016, 7, 1849–1863. [Google Scholar] [CrossRef] [PubMed]
- Ito, T.; Yoshikawa, N.; Ito, H.; Schaffer, S.W. Impact of taurine depletion on glucose control and insulin secretion in mice. J. Pharmacol. Sci. 2015, 1, 59–64. [Google Scholar] [CrossRef] [PubMed] [Green Version]
- Yamori, Y.; Taguchi, T.; Mori, H.; Mori, M. Low cardiovascular risks in the middle aged males and females excreting greater 24-hour urinary taurine and magnesium in 41 WHO-CARDIAC study populations in the world. J. Biomed. Sci. 2010, 17, 21. [Google Scholar] [CrossRef] [Green Version]
- Arakawa, M.; Masaki, T.; Nishimura, J.; Seike, M.; Yoshimatsu, H. The effects of branched-chain amino acid granules on the accumulation of tissue triglycerides and uncoupling proteins in diet-induced obese mice. Endocr. J. 2011, 58, 161–170. [Google Scholar] [CrossRef] [Green Version]
- Nishitani, S.; Matsumura, T.; Fujitani, S.; Sonaka, I.; Miura, Y.; Yagasaki, K. Leucine promotes glucose uptake in skeletal muscles of rats. Biochem. Biophys. Res. Commun. 2002, 299, 693–696. [Google Scholar] [CrossRef]
- Higuchi, N.; Kato, M.; Miyazaki, M.; Tanaka, M.; Kohjima, M.; Ito, T.; Takayanagi, R. Potential Role of Branched-Chain Amino Acids in Glucose Metabolism through the Accelerated Induction of the Glucose-Sensing Apparatus in the Liver. J. Cell. Biochem. 2011, 112, 30–38. [Google Scholar] [CrossRef] [PubMed]
- Cano, A.; Buqué, X.; Martínez-Uña, M.; Aurrekoetxea, I.; Menor, A.; García-Rodríguez, J.L.; Aspichueta, P. Methionine adenosyltransferase 1A gene deletion disrupts hepatic very low density lipoprotein assembly in mice. Hepatology 2011, 54, 1975–1986. [Google Scholar] [CrossRef] [PubMed] [Green Version]
- Giesbertz, P.; Daniel, H. Branched-chain amino acids as biomarkers in diabetes. Curr. Opin. Clin. Nutr. Metab. Care 2016, 19, 48–54. [Google Scholar] [CrossRef] [PubMed]
- Hu, W.; Sun, L.; Gong, Y.; Zhou, Y.; Yang, P.; Ye, Z.; Zhou, H. Relationship between Branched-Chain Amino Acids, Metabolic Syndrome, and Cardiovascular Risk Profile in a Chinese Population: A Cross-Sectional Study. Int. J. Endocrinol. 2016, 2016, 8173905. [Google Scholar] [CrossRef] [PubMed] [Green Version]
- Ricchi, M.; Odoardi, M.R.; Carulli, L.; Anzivino, C.; Ballestri, S.; Pinetti, A.; Loria, P. Differential effect of oleic and palmitic acid on lipid accumulation and apoptosis in cultured hepatocytes. J. Gastroenterol. Hepatol. 2009, 24, 830–840. [Google Scholar] [CrossRef]
- Baumgartner-Parzer, S.M.; Wagner, L.; Pettermann, M.; Grillari, J.; Gessl, A.; Waldhäusl, W. High-Glucose–Triggered Apoptosis in Cultured Endothelial Cells. Diabetes 1995, 44, 1323–1327. [Google Scholar] [CrossRef]
- Di Wu, Q.; Wang, J.H.; Fennessy, F.; Redmond, H.P.; Bouchier-Hayes, D. Taurine prevents high-glucose-induced human vascular endothelial cell apoptosis. Am. J. Phys.-Cell Phys. 1999, 227, c1229. [Google Scholar] [CrossRef] [PubMed]
- Hagar, H.; Al Malki, W. Betaine supplementation protects against renal injury induced by cadmium intoxication in rats: Role of oxidative stress and caspase-3. Environ. Toxicol. Pharmacol. 2014, 37, 803–811. [Google Scholar] [CrossRef] [PubMed]
- Ansorena, E.; Garcıa-Trevijano, E.R.; Martınez-Chantar, M.L.; Huang, Z.Z.; Chen, L.; Mato, J.M.; Avila, M.A. S-adenosylmethionine and methylthioadenosine are antiapoptotic in cultured rat hepatocytes but proapoptotic in human hepatoma cells. Hepatology 2002, 35, 274–280. [Google Scholar] [CrossRef] [PubMed] [Green Version]
- Radziuk, J.; Pye, S. Hepatic glucose uptake, gluconeogenesis and the regulation of glycogen synthesis. Diabetes Metab. Res. 2001, 17, 250–272. [Google Scholar] [CrossRef]
- Weinstein, S.P.; O’Boyle, E.; Fisher, M.; Haber, R.S. Regulation of GLUT2 glucose transporter expression in liver by thyroid hormone: Evidence for hormonal regulation of the hepatic glucose transport system. Endocrinology 1994, 135, 649–654. [Google Scholar] [CrossRef] [PubMed]
- Postic, C.; Burcelin, R.; Rencurel, F.; Pegorier, J.P.; Loizeau, M.; Girard, J.; Leturque, A. Evidence for a transient inhibitory effect of insulin on GLUT2 expression in the liver: Studies In Vivo and In Vitro. Biochem. J. 1993, 293, 119–124. [Google Scholar] [CrossRef] [Green Version]
- Belfiore, F.; Romeo, F.; Iannello, S.; Salamone, C. The glucose-6-phosphatase/glucokinase ratio in the liver of obese-diabetic subjects. Biochem. Med. Metab. Biol. 1989, 41, 77–80. [Google Scholar] [CrossRef]
- Huupponen, R.; Karvonen, I.; Sotaniemi, E. Activity of hepatic glucose phosphorylating and NADPH generating enzymes in Zucker rat. Diabetes Res. 1989, 10, 143–146. [Google Scholar] [PubMed]
- Hakimi, P.; Johnson, M.T.; Yang, J.; Lepage, D.F.; Conlon, R.A.; Kalhan, S.C.; Hanson, R.W. Phosphoenolpyruvate carboxykinase and the critical role of cataplerosis in the control of hepatic metabolism. Nutr. Metab. 2005, 2, 33. [Google Scholar] [CrossRef] [PubMed] [Green Version]
- Gautier-Stein, A. Glucotoxicity Induces Glucose-6-Phosphatase Catalytic Unit Expression by Acting on the Interaction of HIF-1a with CREB-Binding Protein. Diabetes 2012, 61, 2451–2460. [Google Scholar] [CrossRef] [PubMed] [Green Version]
- Clore, J.N. Glucose-6-phosphatase flux In Vitro is increased in type 2 diabetes. Diabetes 2000, 49, 969–974. [Google Scholar] [CrossRef] [Green Version]
- Dentin, R.; Girard, J.; Postic, C. Carbohydrate responsive element binding protein (ChREBP) and sterol regulatory element binding protein-1c (SREBP-1c): Two key regulators of glucose metabolism and lipid synthesis in liver. Biochimie 2005, 87, 81–86. [Google Scholar] [CrossRef]
- Linden, A.G.; Li, S.; Choi, H.Y.; Fang, F.; Fukasawa, M.; Uyeda, K.; Liang, G. Interplay between ChREBP and SREBP-1c coordinates postprandial glycolysis and lipogenesis in livers of mice. J. Lipid Res. 2018, 59, 475–487. [Google Scholar] [CrossRef] [Green Version]
- Shimomura, I.; Matsuda, M.; Hammer, R.E.; Bashmakov, Y.; Brown, M.S.; Goldstein, J.L. Decreased IRS-2 and increased SREBP-1c lead to mixed insulin resistance and sensitivity in livers of lipodystrophic and ob/ob mice. Mol. Cell 2000, 6, 77–86. [Google Scholar] [CrossRef]
- Higuchi, N.; Kato, M.; Shundo, Y.; Tajiri, H.; Tanaka, M.; Yamashita, N.; Enjoji, M. Liver X receptor in cooperation with SREBP-1c is a major lipid synthesis regulator in nonalcoholic fatty liver disease. Hepatol. Res. 2008, 38, 1122–1129. [Google Scholar] [CrossRef]
- Kota, B.P.; Huang, T.H.W.; Roufogalis, B.D. Roufogalis BD: An overview of biological mechanisms of PPARs. Pharmacol. Res. 2005, 51, 85–94. [Google Scholar] [CrossRef] [PubMed]
- Yu, S.; Matsusue, K.; Kashireddy, P.; Cao, W.Q.; Yeldandi, V.; Yeldandi, A.V.; Reddy, J.K. Adipocyte-specific gene expression and adipogenic steatosis in the mouse liver due to peroxisome proliferator-activated receptor gamma1 (PPARgamma1) overexpression. J. Biol. Chem. 2003, 278, 498–505. [Google Scholar] [CrossRef] [PubMed] [Green Version]
- Coleman, R.A.; Lee, D.P. Enzymes of triacylglycerol synthesis and their regulation. Prog. Lipid Res. 2004, 43, 134–176. [Google Scholar] [CrossRef]
- Okekunle, A.P.; Zhang, M.; Wang, Z.; Onwuka, J.U.; Wu, X.; Feng, R.; Li, C. Dietary branched-chain amino acids intake exhibited a different relationship with type 2 diabetes and obesity risk: A meta-analysis. Acta Diabetol. 2019, 56, 187–195. [Google Scholar] [CrossRef]
- Matsusue, K.; Haluzik, M.; Lambert, G.; Yim, S.H.; Gavrilova, O.; Ward, J.M.; Gonzalez, F.J. Liver specific disruption of PPARγ in leptin-deficient mice improves fatty liver but aggravates diabetic phenotypes. J. Clin. Investig. 2003, 111, 737–747. [Google Scholar] [CrossRef] [PubMed] [Green Version]
- Kim, S.Y.; Kim, H.I.; Kim, T.H.; Im, S.S.; Park, S.K.; Lee, I.K.; Ahn, Y.H. SREBP-1c mediates the insulin dependent hepatic glucokinase expression. J. Biol. Chem. 2004, 279, 30823–30829. [Google Scholar] [CrossRef] [Green Version]

| Gene | mRNA No. | Primer Sequence | |
|---|---|---|---|
| ACTB | NM_001101.5 | Forward | GGACTTCGAGCAAGAGATGG |
| Reverse | AGGAAGGAAGGCTGGAAGAG | ||
| GLUT2 | NM_000340.2 | Forward | GCGACGTTCTCTCTTTCTAAT |
| Reverse | GGCTATCATGCTCACATAACT | ||
| GK | NM_000167.5 | Forward | GAAACTACACTGTCCCATCTC |
| Reverse | GGATTGAGGTGTTGCCTATC | ||
| PCK1 | NM_002591.4 | Forward | GCCTGGATGAAGTTTGACGC |
| Reverse | ATGGCATTGGGGTTGGTCTT | ||
| G6PC | NM_000151.4 | Forward | GCAATGGGCACTGGTATT |
| Reverse | GGAGTCACACATGGGAATAAG | ||
| ACC2 | NM_001093.4 | Forward | GGAACATCCCTACGCTAAAC |
| Reverse | GACAAGGTGGAGTGAATGAG | ||
| SCD1 | NM_005063.5 | Forward | CAACTACCACCACTCCTTTC |
| Reverse | GAGACTTTCTTCCGGTCATAG | ||
| FASN | NM_004104.5 | Forward | GGTTTGATGCCTCCTTCTT |
| Reverse | GGAGTGAATCTGGGTTGATG | ||
| SREBP-1 | NM_001018067.2 | Forward | TACCGCTCCTCCATCAAT |
| Reverse | GTGTTGCAGAAAGCGAATG | ||
| ChREBP | NM_032951.3 | Forward | GACAGCTGAGTACATCCTTATG |
| Reverse | TGCTGGCACAGGTTAATG | ||
| PPARγ | NM_001330615.1 | Forward | GTCGTGTCTGTGGAGATAAAG |
| Reverse | GGATCCGACAGTTAAGATCAC | ||
Publisher’s Note: MDPI stays neutral with regard to jurisdictional claims in published maps and institutional affiliations. |
© 2022 by the authors. Licensee MDPI, Basel, Switzerland. This article is an open access article distributed under the terms and conditions of the Creative Commons Attribution (CC BY) license (https://creativecommons.org/licenses/by/4.0/).
Share and Cite
Wang, S.; Jung, S.; Ko, K.S. Effects of Amino Acids Supplementation on Lipid and Glucose Metabolism in HepG2 Cells. Nutrients 2022, 14, 3050. https://doi.org/10.3390/nu14153050
Wang S, Jung S, Ko KS. Effects of Amino Acids Supplementation on Lipid and Glucose Metabolism in HepG2 Cells. Nutrients. 2022; 14(15):3050. https://doi.org/10.3390/nu14153050
Chicago/Turabian StyleWang, Shuang, Soohan Jung, and Kwang Suk Ko. 2022. "Effects of Amino Acids Supplementation on Lipid and Glucose Metabolism in HepG2 Cells" Nutrients 14, no. 15: 3050. https://doi.org/10.3390/nu14153050