
Dietary Acid Load in Gluten-Free Diets: Results from a Cross-Sectional Study


Abstract
:
1. Introduction
2. Materials and Methods
2.1. The NHANES
2.2. Dietary Acid Load Calculations
(mg/day)) − (0.026 × magnesium (mg/day)) − (0.013 × calcium (mg/day)
2.3. Nutrient Intake Assessment
2.4. Dietary Pattern Assessment
2.5. Inclusion and Exclusion Criteria
2.6. Statistical Analysis
3. Results
4. Discussion
5. Conclusions
Author Contributions
Funding
Institutional Review Board Statement
Informed Consent Statement
Data Availability Statement
Conflicts of Interest
Abbreviations
| CD | celiac disease |
| DAL | dietary acid load |
| GFD | gluten-free diet |
| NEAP | net endogenous acid production |
| NHANES | National Health and Nutrition Examination Survey |
| OA | organic acid |
| PRAL | potential renal acid load |
References
- Fasano, A.; Catassi, C. Clinical Practice. Celiac Disease. N. Engl. J. Med. 2012, 367, 2419–2426. [Google Scholar] [CrossRef] [PubMed]
- El Khoury, D.; Balfour-Ducharme, S.; Joye, I.J. A Review on the Gluten-Free Diet: Technological and Nutritional Challenges. Nutrients 2018, 10, 1410. [Google Scholar] [CrossRef] [PubMed] [Green Version]
- Shewry, P. What Is Gluten—Why Is It Special? Front. Nutr. 2019, 6, 101. [Google Scholar] [CrossRef] [PubMed]
- Diez-Sampedro, A.; Olenick, M.; Maltseva, T.; Flowers, M. A Gluten-Free Diet, Not an Appropriate Choice without a Medical Diagnosis. J. Nutr. Metab. 2019, 2019, e2438934. [Google Scholar] [CrossRef] [PubMed]
- Caio, G.; Volta, U.; Sapone, A.; Leffler, D.A.; De Giorgio, R.; Catassi, C.; Fasano, A. Celiac Disease: A Comprehensive Current Review. BMC Med. 2019, 17, 142. [Google Scholar] [CrossRef] [Green Version]
- Volta, U.; Caio, G.; Stanghellini, V.; De Giorgio, R. The Changing Clinical Profile of Celiac Disease: A 15-Year Experience (1998–2012) in an Italian Referral Center. BMC Gastroenterol. 2014, 14, 194. [Google Scholar] [CrossRef] [Green Version]
- Jericho, H.; Sansotta, N.; Guandalini, S. Extraintestinal Manifestations of Celiac Disease: Effectiveness of the Gluten-Free Diet. J. Pediatr. Gastroenterol. Nutr. 2017, 65, 75–79. [Google Scholar] [CrossRef]
- Itzlinger, A.; Branchi, F.; Elli, L.; Schumann, M. Gluten-Free Diet in Celiac Disease—Forever and for All? Nutrients 2018, 10, 1796. [Google Scholar] [CrossRef] [Green Version]
- Tanpowpong, P.; Ingham, T.R.; Lampshire, P.K.; Kirchberg, F.F.; Epton, M.J.; Crane, J.; Camargo, C.A. Coeliac Disease and Gluten Avoidance in New Zealand Children. Arch. Dis. Child. 2012, 97, 12–16. [Google Scholar] [CrossRef]
- Choung, R.S.; Unalp-Arida, A.; Ruhl, C.E.; Brantner, T.L.; Everhart, J.E.; Murray, J.A. Less Hidden Celiac Disease but Increased Gluten Avoidance without a Diagnosis in the USA: Findings from the National Health and Nutrition Examination Surveys from 2009 to 2014. Mayo Clin. Proc. 2016, 92, 30–38. [Google Scholar] [CrossRef]
- Verma, A.K. Nutritional Deficiencies in Celiac Disease: Current Perspectives. Nutrients 2021, 13, 4476. [Google Scholar] [CrossRef] [PubMed]
- Vici, G.; Belli, L.; Biondi, M.; Polzonetti, V. Gluten Free Diet and Nutrient Deficiencies: A Review. Clin. Nutr. 2016, 35, 1236–1241. [Google Scholar] [CrossRef] [PubMed]
- Nikniaz, Z.; Mahdavi, R.; Akhavan Sabbagh, M.; Nikniaz, L.; Shirmohammadi, M. Comparison of Dietary Acid Load Score between Celiac Patients and Healthy Population. BMC Nutr. 2022, 8, 18. [Google Scholar] [CrossRef]
- Parmenter, B.H.; Dymock, M.; Banerjee, T.; Sebastian, A.; Slater, G.J.; Frassetto, L.A. Performance of Predictive Equations and Biochemical Measures Quantifying Net Endogenous Acid Production and the Potential Renal Acid Load. Kidney Int. Rep. 2020, 5, 1738–1745. [Google Scholar] [CrossRef] [PubMed]
- Gannon, R.H.T.; Millward, D.J.; Brown, J.E.; Macdonald, H.M.; Lovell, D.P.; Frassetto, L.A.; Remer, T.; Lanham-New, S.A. Estimates of Daily Net Endogenous Acid Production in the Elderly UK Population: Analysis of the National Diet and Nutrition Survey (NDNS) of British Adults Aged 65 Years and Over. Br. J. Nutr. 2008, 100, 615–623. [Google Scholar] [CrossRef] [PubMed] [Green Version]
- Storz, M.A.; Ronco, A.L. Reduced Dietary Acid Load in U.S. Vegetarian Adults: Results from the National Health and Nutrition Examination Survey. Food Sci. Nutr. 2022, 10, 2091–2100. [Google Scholar] [CrossRef] [PubMed]
- NHANES—About the National Health and Nutrition Examination Survey. Available online: https://www.cdc.gov/nchs/nhanes/about_nhanes.htm (accessed on 29 June 2022).
- Storz, M.A.; Rizzo, G.; Müller, A.; Lombardo, M. Bowel Health in U.S. Vegetarians: A 4-Year Data Report from the National Health and Nutrition Examination Survey (NHANES). Nutrients 2022, 14, 681. [Google Scholar] [CrossRef]
- Mazidi, M.; Shivappa, N.; Wirth, M.D.; Hebert, J.R.; Vatanparast, H.; Kengne, A.P. The Association between Dietary Inflammatory Properties and Bone Mineral Density and Risk of Fracture in US Adults. Eur. J. Clin. Nutr. 2017, 71, 1273–1277. [Google Scholar] [CrossRef]
- Stookey, J.D. Analysis of 2009–2012 Nutrition Health and Examination Survey (NHANES) Data to Estimate the Median Water Intake Associated with Meeting Hydration Criteria for Individuals Aged 12–80 in the US Population. Nutrients 2019, 11, 657. [Google Scholar] [CrossRef] [Green Version]
- Unalp-Arida, A.; Liu, R.; Ruhl, C.E. Nutrient Intake Differs among Persons with Celiac Disease and Gluten-Related Disorders in the United States. Sci. Rep. 2022, 12, 5566. [Google Scholar] [CrossRef] [PubMed]
- Sattgast, L.H.; Gallo, S.; Frankenfeld, C.L.; Moshfegh, A.J.; Slavin, M. Nutritional Intake and Bone Health Among Adults With Probable Undiagnosed, Untreated Celiac Disease: What We Eat in America and NHANES 2009–2014. J. Am. Coll. Nutr. 2020, 39, 112–121. [Google Scholar] [CrossRef] [PubMed]
- Remer, T.; Manz, F. Potential Renal Acid Load of Foods and Its Influence on Urine PH. J. Am. Diet. Assoc. 1995, 95, 791–797. [Google Scholar] [CrossRef]
- Frassetto, L.A.; Todd, K.M.; Morris, R.C.; Sebastian, A. Estimation of Net Endogenous Noncarbonic Acid Production in Humans from Diet Potassium and Protein Contents. Am. J. Clin. Nutr. 1998, 68, 576–583. [Google Scholar] [CrossRef] [PubMed] [Green Version]
- Parmenter, B.H.; Slater, G.J.; Frassetto, L.A. Accuracy and Precision of Estimation Equations to Predict Net Endogenous Acid Excretion Using the Australian Food Database. Nutr. Diet. 2017, 74, 308–312. [Google Scholar] [CrossRef]
- Centers for Disease Control and Prevention; National Center for Health Statistics. National Health and Nutrition Examination Survey MEC In-Person Dietary Interviewers Procedure Manual; Department of Health and Human Services, Centers for Disease Control and Prevention: Hyattsville, MD, USA, 2008. Available online: http://www.cdc.gov/nchs/data/nhanes/nhanes_07_08/manual_dietarymec.pdf (accessed on 5 February 2022).
- Learn More about Energy Adjustment | Dietary Assessment Primer. Available online: https://dietassessmentprimer.cancer.gov/learn/adjustment.html (accessed on 29 June 2022).
- Lemann, J. Relationship between Urinary Calcium and Net Acid Excretion as Determined by Dietary Protein and Potassium: A Review. Nephron 1999, 81 (Suppl. S1), 18–25. [Google Scholar] [CrossRef]
- Melini, V.; Melini, F. Gluten-Free Diet: Gaps and Needs for a Healthier Diet. Nutrients 2019, 11, 170. [Google Scholar] [CrossRef] [Green Version]
- Dietary Acid Loads for Celiac Patients Lower than General Population. Available online: https://www.celiac.com/articles.html/dietary-acid-loads-for-celiac-patients-lower-than-general-population-r5841/ (accessed on 1 July 2022).
- Müller, A.; Zimmermann-Klemd, A.M.; Lederer, A.-K.; Hannibal, L.; Kowarschik, S.; Huber, R.; Storz, M.A. A Vegan Diet Is Associated with a Significant Reduction in Dietary Acid Load: Post Hoc Analysis of a Randomized Controlled Trial in Healthy Individuals. Int. J. Environ. Res. Public Health 2021, 18, 9998. [Google Scholar] [CrossRef] [PubMed]
- Kahleova, H.; McCann, J.; Alwarith, J.; Rembert, E.; Tura, A.; Holubkov, R.; Barnard, N.D. A Plant-Based Diet in Overweight Adults in a 16-Week Randomized Clinical Trial: The Role of Dietary Acid Load. Clin. Nutr. ESPEN 2021, 44, 150–158. [Google Scholar] [CrossRef]
- Cosgrove, K.; Johnston, C.S. Examining the Impact of Adherence to a Vegan Diet on Acid-Base Balance in Healthy Adults. Plant Foods Hum. Nutr. 2017, 72, 308–313. [Google Scholar] [CrossRef]
- Deriemaeker, P.; Aerenhouts, D.; Hebbelinck, M.; Clarys, P. Nutrient Based Estimation of Acid-Base Balance in Vegetarians and Non-Vegetarians. Plant Foods Hum. Nutr. 2010, 65, 77–82. [Google Scholar] [CrossRef]
- Carnauba, R.A.; Baptistella, A.B.; Paschoal, V.; Hübscher, G.H. Diet-Induced Low-Grade Metabolic Acidosis and Clinical Outcomes: A Review. Nutrients 2017, 9, 538. [Google Scholar] [CrossRef] [PubMed] [Green Version]
- Osuna-Padilla, I.A.; Leal-Escobar, G.; Garza-García, C.A.; Rodríguez-Castellanos, F.E. Dietary Acid Load: Mechanisms and Evidence of Its Health Repercussions. Nefrologia (Engl. Ed.) 2019, 39, 343–354. [Google Scholar] [CrossRef]
- Ostrowska, J.; Janiszewska, J.; Szostak-Węgierek, D. Dietary Acid Load and Cardiometabolic Risk Factors—A Narrative Review. Nutrients 2020, 12, 3419. [Google Scholar] [CrossRef] [PubMed]
- Ronco, A.L.; Martínez-López, W.; Calderón, J.M.; Storz, M.A. Dietary Acid Load and Risk of Head and Neck and Oral Cavity Cancers: An Epidemiologic Study. Oral Sci. Int. 2022. [Google Scholar] [CrossRef]


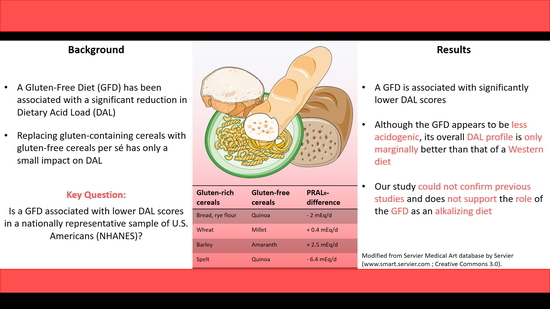
| Gluten-Containing Foods | PRAL Value per 100 g | Gluten-Free Foods | PRAL Value per 100 g |
|---|---|---|---|
| Rye | +4.4 mEq/d | Quinoa | +2.4 mEq/d |
| Wheat | +8.2 mEq/d | Millet | +8.6 mEq/d |
| Spelt | +8.8 mEq/d | Corn | +3.8 mEq/d |
| Barley | +5 mEq/d | Amaranth | +7.5 mEq/d |
| No Special Diet (n = 12,252) | Gluten-Free Diet (n = 187) | p-Value | |
|---|---|---|---|
| Age (years) | 46.79 (0.37) | 47.87 (2.01) | p = 0.595 |
| Sex | p = 0.005 | ||
| - Males (n(%)) | 6130 (50.02) | 73 (34.29) a | |
| - Females (n(%)) | 6122 (49.98) | 114 (65.71) a | |
| Body Mass Index (kg/m²) | 28.43 (0.11) | 27.04 (0.41) | p = 0.002 |
| Race/Ethnicity | p = 0.441 | ||
| - Mexican American | 1765 (8.78) | 14 (4.94) b | |
| - Other Hispanic | 1151 (5.59) | 17 (4.34) b | |
| - Non-Hispanic White | 5433 (67.17) | 83 (72.10) | |
| - >Non-Hispanic Black | 2533 (11.17) | 43 (9.99) | |
| - Other Race | 1370 (7.29) | 30 (8.63) b | |
| Marital Status | p = 0.48 | ||
| - Married/living with partner | 7238 (61.88) | 104 (56.30) | |
| - Widowed/divorced/separated | 2590 (18.08) | 42 (17.86) | |
| - Never married | 2424 (20.05) | 41 (25.84) | |
| Education Level | p = 0.009 | ||
| - Less than 9th grade | 1123 (5.02) | 9 (2.33) a,b | |
| - 9–11th Grade | 1815 (11.57) | 15 (7.44) b | |
| - High School Grad/GED | 2819 (22.01) | 33 (13.60) b | |
| - Some College or AA degree | 3599 (31.90) | 52 (28.15) | |
| - College Graduate or above | 2896 (29.50) | 78 (48.48) a |
| No Special Diet (n = 12,252) | Gluten-Free Diet (n = 187) | p-Value | |
|---|---|---|---|
| Calories (kcal/day) | 2180.89 (8.72) | 1890.42 (70.26) | p = <0.001 |
| Carbohydrate (g/1000 kcal) | 122.40 (0.32) | 112.80 (3.45) | p = 0.008 |
| Carbohydrate total (g/day) | 263.87 (1.22) | 213.77 (10.31) | p = <0.001 |
| Protein (g/1000 kcal) | 38.69 (0.23) | 42.60 (1.77) | p = 0.030 |
| Protein total (g/day) | 82.82 (0.47) | 78.61 (3.89) | p = 0.287 |
| Fat (g/1000 kcal) | 37.17 (0.12) | 39.96 (1.54) | p = 0.072 |
| Fat total (g/day) | 82.29 (0.46) | 77.58 (4.56) | p =0.306 |
| Potassium (mg/1000 kcal) | 1300.32 (8.38) | 1567.17 (36.07) | p = <0.001 |
| Potassium total (mg/day) | 2725.46 (15.10) | 2892.29 (113.30) | p = 0.145 |
| Magnesium (mg/1000 kcal) | 145.28 (0.94) | 183.4 (5.43) | p = <0.001 |
| Magnesium total (mg/day) | 305.70 (1.79) | 339.84 (13.25) | p = 0.013 |
| Phosphorus (mg/1000 kcal) | 655.85 (2.89) | 702.29 (21.98) | p = 0.038 |
| Phosphorus (mg/day) | 1407.97 (6.46) | 1307.08 (56.21) | p = 0.076 |
| Calcium (mg/1000 kcal) | 462.48 (2.91) | 492.58 (26.93) | p = 0.273 |
| Calcium (mg/day) | 985.33 (6.02) | 903.89 (51.49) | p = 0.128 |
| Sodium (mg/1000 kcal) | 1680.86 (7.20) | 1638.60 (46.59) | p = 0.369 |
| Sodium (mg/day) | 3599.16 (16.26) | 3058.62 (146.65) | p = 0.001 |
| No Special Diet (n = 12,252) | Gluten-Free Diet (n = 187) | p-Value | |
|---|---|---|---|
| PRAL (mEq/day) | 14.68 (0.34) | 5.56 (2.39) | p = <0.001 |
| NEAPR (mEq/day) | 59.92 (0.36) | 48.67 (2.51) | p = <0.001 |
| NEAPF (mEq/day) | 57.50 (0.37) | 51.14 (2.50) | p = 0.016 |
| PRALR | Coefficient | 95% CI | p | Coefficient | 95% CI | p |
|---|---|---|---|---|---|---|
| Model 1 | Model 2 | |||||
| Diet | ||||||
| No special diet | - | - | - | |||
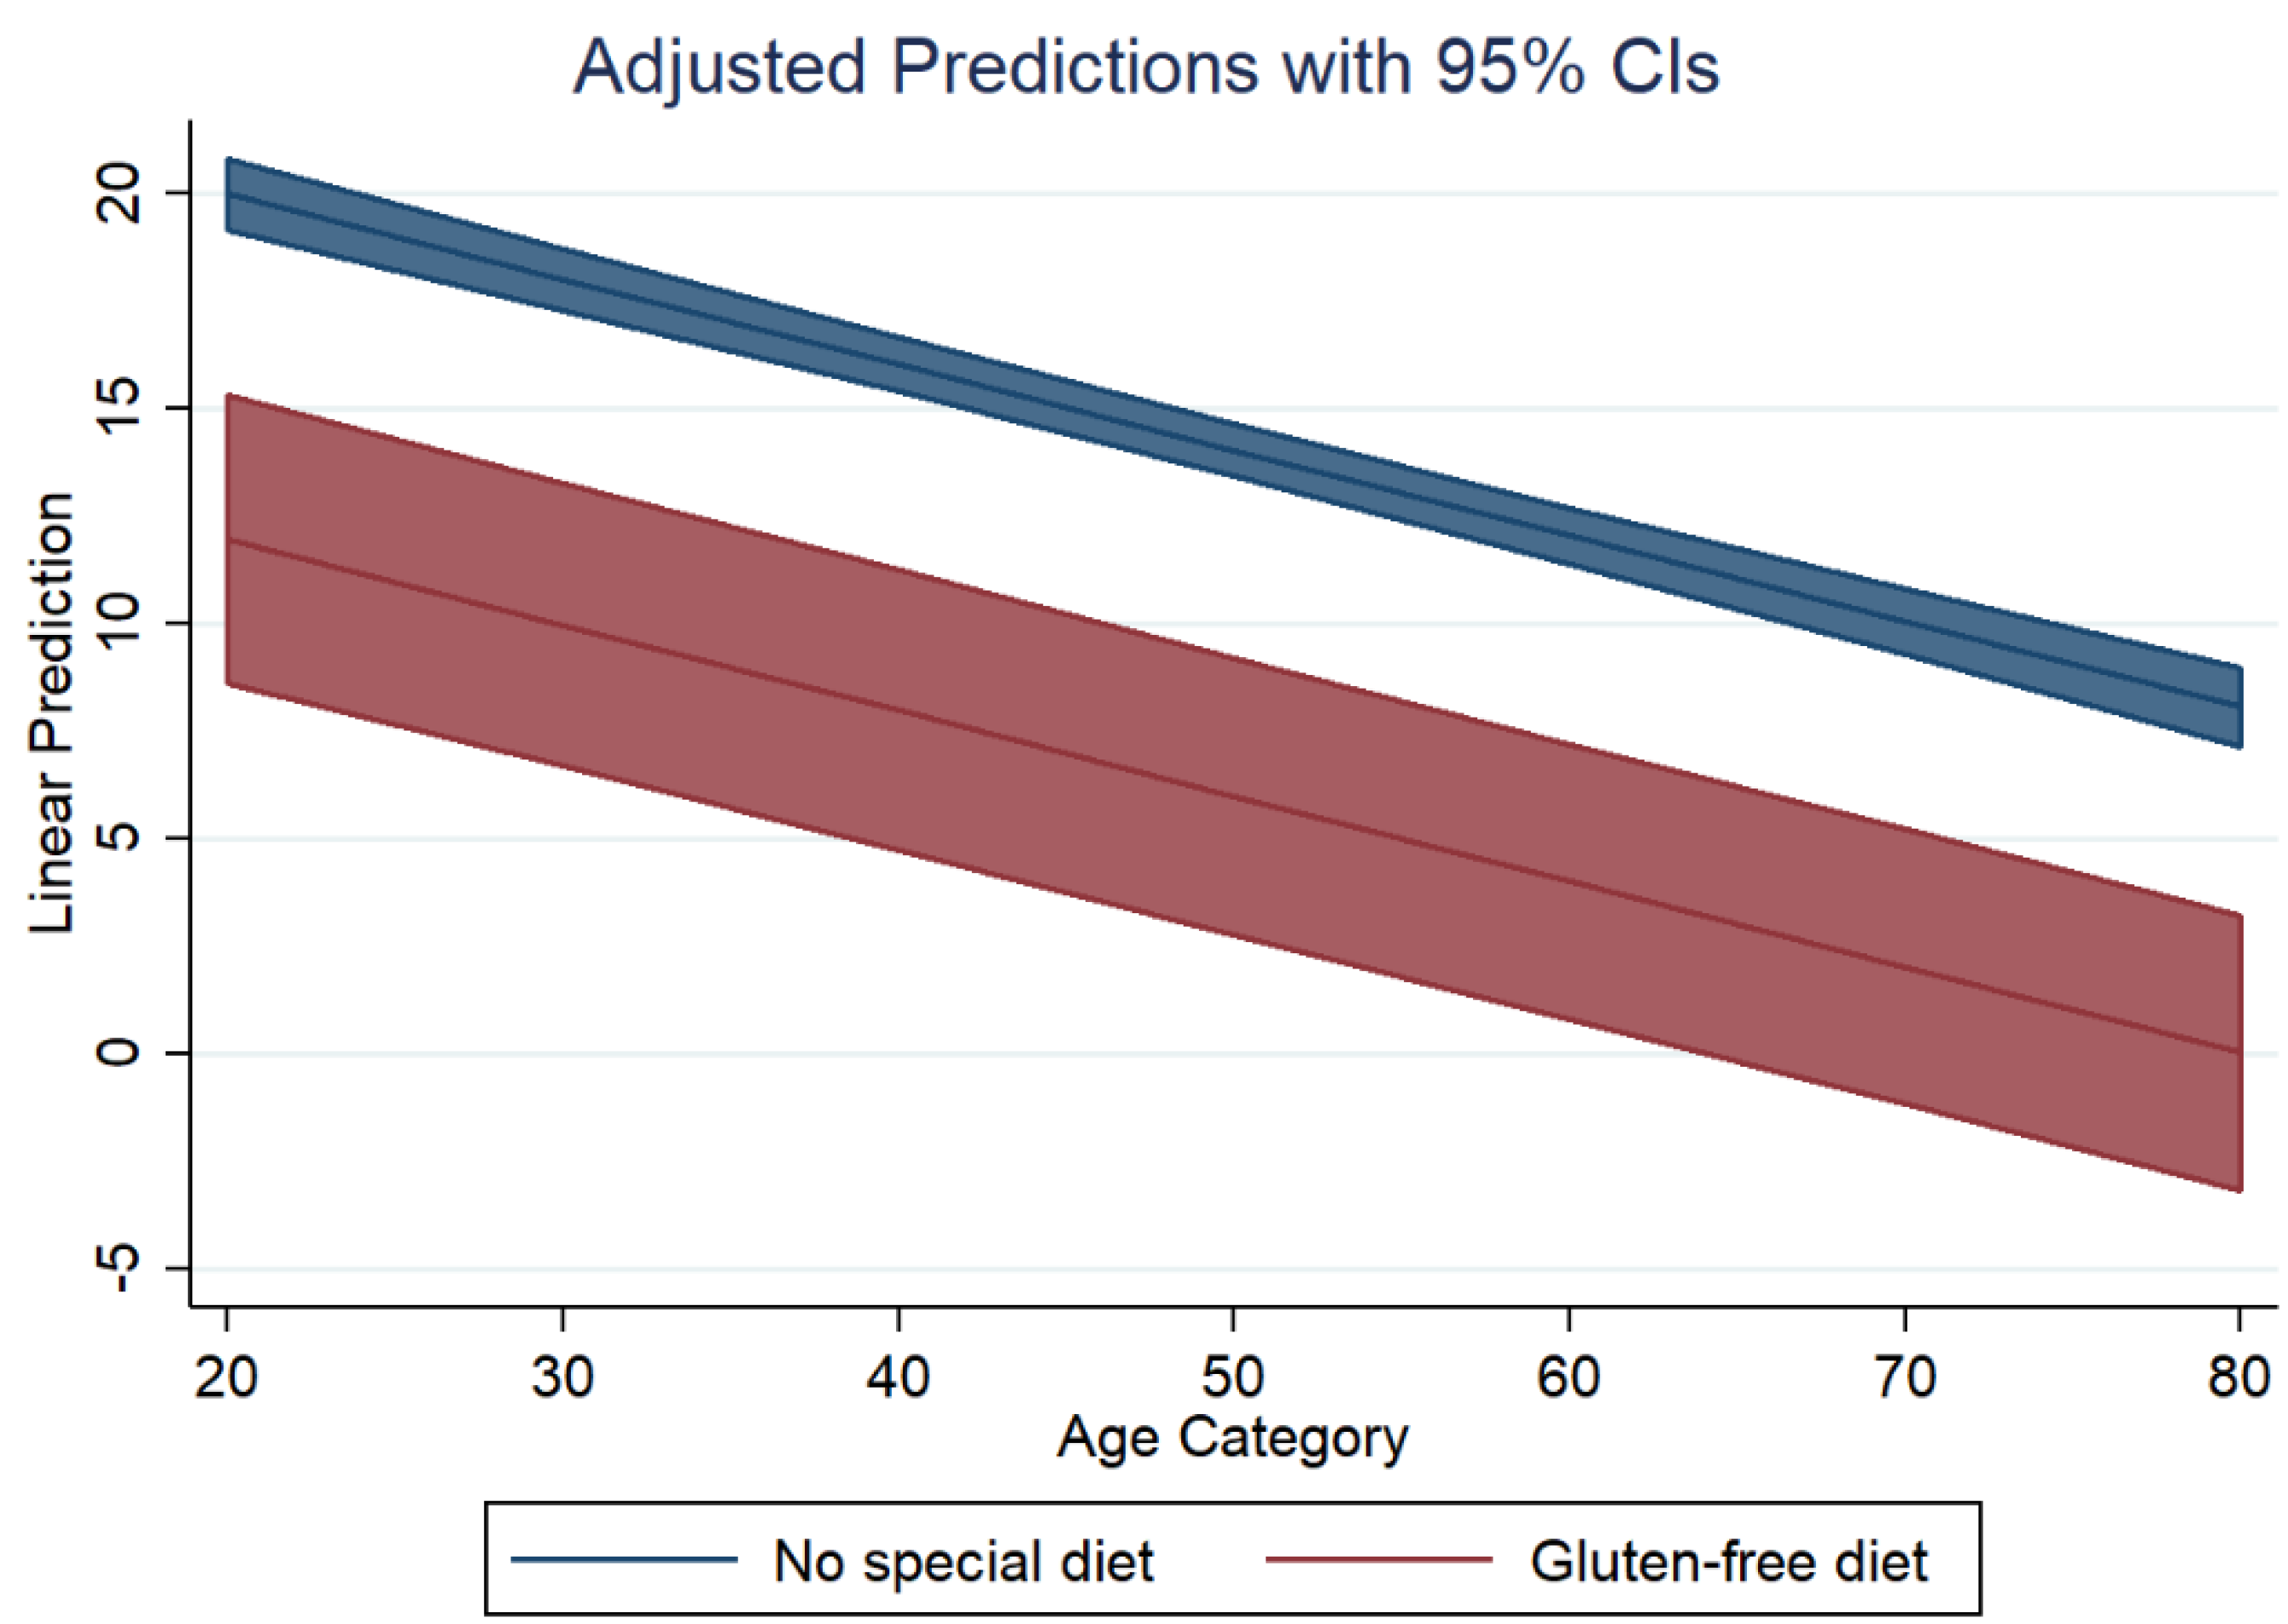
| Gluten-free diet | −5.11 | (−10.14, −0.08) | 0.047 | −8.02 | (−11.2, −4.84) | <0.001 |
| Gender | ||||||
| Male | - | - | - | - | ||
| Female | −3.24 | (−4.24, −2.25) | <0.001 | 0.06 | (−0.75, 0.88) | 0.878 |
| Body Mass Index | 0.27 | (0.18, 0.36) | <0.001 | 0.22 | (0.14, 0.31) | <0.001 |
| Age | −0.19 | (−0.21, −0.16) | <0.001 | −0.20 | (−0.22, −0.18) | <0.001 |
| Race/Ethnicity | ||||||
| Mexican American | 4.12 | (2.43, 5.80) | <0.001 | 1.92 | (0.37, 3.48) | 0.016 |
| Other Hispanic | 2.88 | (1.25, 4.50) | 0.001 | 0.24 | (−1.12, 1.61) | 0.722 |
| Non-Hispanic White | - | - | ||||
| Non-Hispanic Black | 3.68 | (2.32, 5.04) | <0.001 | 2.64 | (1.09, 4.18) | <0.001 |
| Other Race—Including Multiracial | 1.48 | (−0.15, 3.10) | 0.074 | −0.70 | (−2.05, 0.65) | 0.305 |
| Energy intake (kcal/day) | 0.009 | (0.009, 0.01) | <0.001 | −0.005 | (−0.006, −0.004) | <0.001 |
| Protein intake (g/day) | 0.47 | (0.44, 0.49) | <0.001 | |||
| NEAPF | Coefficient | 95% CI | p | Coefficient | 95% CI | p |
|---|---|---|---|---|---|---|
| Model 1 | Model 2 | |||||
| Diet | ||||||
| No special diet | - | - | - | |||
| Gluten-free diet | −4.25 | (−9.23, 0.72) | 0.092 | −6.74 | (−10.12, −3.29) | <0.001 |
| Gender | ||||||
| Male | - | - | - | - | ||
| Female | −4.57 | (−5.44, −3.70) | <0.001 | −1.74 | (−2.59, −0.89) | <0.001 |
| Body Mass Index | 0.348 | (0.25, 0.44) | <0.001 | 0.31 | (0.21, 0.40) | <0.001 |
| Age | −0.27 | (−0.30, −0.25) | <0.001 | −0.29 | (−0.31, −0.26) | <0.001 |
| Race/Ethnicity | ||||||
| Mexican American | 2.40 | (0.29, 4.50) | 0.026 | 0.52 | (−1.65, 2.69) | 0.630 |
| Other Hispanic | 4.23 | (2.36, 6.10) | <0.001 | 1.98 | (0.07, 3.90) | 0.043 |
| Non-Hispanic White | - | - | ||||
| Non-Hispanic Black | 8.38 | (6.93, 9.82) | <0.001 | 9.01 | (7.76, 10.27) | <0.001 |
| Other Race—Including Multiracial | 3.17 | (1.28, 5.07) | 0.002 | 1.32 | (−0.33, 2.97) | 0.116 |
| Energy intake (kcal/day) | 0.001 | (0.001, 0.002) | <0.001 | −0.01 | (−0.01, −0.01) | <0.001 |
| Protein intake (g/day) | 0.40 | (0.37, 0.43) | <0.001 | |||
Publisher’s Note: MDPI stays neutral with regard to jurisdictional claims in published maps and institutional affiliations. |
© 2022 by the authors. Licensee MDPI, Basel, Switzerland. This article is an open access article distributed under the terms and conditions of the Creative Commons Attribution (CC BY) license (https://creativecommons.org/licenses/by/4.0/).
Share and Cite
Storz, M.A.; Ronco, A.L.; Lombardo, M. Dietary Acid Load in Gluten-Free Diets: Results from a Cross-Sectional Study. Nutrients 2022, 14, 3067. https://doi.org/10.3390/nu14153067
Storz MA, Ronco AL, Lombardo M. Dietary Acid Load in Gluten-Free Diets: Results from a Cross-Sectional Study. Nutrients. 2022; 14(15):3067. https://doi.org/10.3390/nu14153067
Chicago/Turabian StyleStorz, Maximilian Andreas, Alvaro Luis Ronco, and Mauro Lombardo. 2022. "Dietary Acid Load in Gluten-Free Diets: Results from a Cross-Sectional Study" Nutrients 14, no. 15: 3067. https://doi.org/10.3390/nu14153067
APA StyleStorz, M. A., Ronco, A. L., & Lombardo, M. (2022). Dietary Acid Load in Gluten-Free Diets: Results from a Cross-Sectional Study. Nutrients, 14(15), 3067. https://doi.org/10.3390/nu14153067