1. Introduction
The prevalence of food allergies in Europe is increasing rapidly. Currently, in adults, self-reported symptoms after ingesting different varieties of food are reported by 5.7–61.6% of people, and physician-diagnosed hypersensitivities are reported by 0.2–4.2% of people [
1]. Diagnosing a suspected food allergy accurately is of great importance, both to prevent severe allergic reactions and to avoid unnecessary dietary restrictions caused by inaccurate diagnosis. The diagnosis of food allergy involves the use of skin prick tests (SPTs), allergen specific immunoglobulin E (sIgE), and oral food challenges (OFC) as a gold standard [
2]. It is generally agreed that the core diagnostic step for type I mediated allergy, the SPT, should be further standardized, and further studies are necessary to define worldwide standards for allergen extracts [
3]. In a recent EAACI position paper about in vivo diagnostic test allergens, the importance of reliable allergens was also stressed [
4].
The evaluation of patients with a possible food allergy starts with an extensive food specific medical history and a physical examination. The focus should be on possible dietary triggers, the quantity and quality of the ingested food, possible facilitating co-factors around the time of the reaction (exercise, illness, use of medication), and the specific symptoms that led to the allergic reaction [
5]. Knowledge of cross-reactivity within protein families would help to decide the ensuing pathway.
The next step in the diagnosis of a food allergy is measuring sensitization to the suspected food allergen by either performing an SPT with the suspected food allergen, and/or measuring serum sIgE. SPTs are a quick, reliable, and cheap method to measure sensitization. Although the negative predictive value (NPV) of SPTs often reaches 90% or more [
5], false negative SPTs may occur if the used extracts are not standardized or have insufficient quantities of the allergen. In commercially available extracts of fruits and vegetables, the proteins might be destroyed during the manufacturing process, e.g., heating, giving less reliable results [
6]. Generally, SPTs with food allergens have high sensitivity but low specificity, and must be interpreted with caution [
6], and neither SPT nor sIgE are sufficient to diagnose food allergies on their own [
7]. Soares-Weiser et al. (2014) also concluded that SPT and sIgE appear to be sensitive but not specific enough for diagnosing IgE-mediated food allergy, although this may differ between foods [
8]. The availability of commercial food allergen extracts is limited, which leads to a need for alternative methods for the extraction of food allergens. One of the alternatives for commercial extracts might be to prepare homemade (HM) extracts through standardized protocols, but the quality of these extracts is unknown. Thus, the objective of this study was to compare SPT results of HM food allergen extracts and commercially available extracts.
3. Results
3.1. Study Population
Fifty-four adult patients (mean age 36; range 19-69 years) with a suspected food allergy were included. All participants reported one or more inhalant allergies: 40 (74%) to grass pollen, 51 (94%) to birch pollen, and 31 (57%) to house dust mites. Fifty participants (93%) reported OAS with or without GI symptoms, fourteen participants (26%) reported a skin reaction, and eighteen participants (33%) reported respiratory symptoms after ingestion of the suspected food allergen. Forty-six participants (85%) use any kind of anti-allergic medication. Of this group, forty-five (83%) use anti-histamines, seventeen (31%) use a nose spray, four (7%) use eye drops, thirteen (24%) use lung medication, and six (11%) of the participants need rescue medication (adrenalin). In
Table 1, all patient characteristics are summarized.
The total numbers of patients that ever experienced symptoms after ingestion of the specific food allergen were: 16/27 for almond, 17/21 for apple, 36/44 for hazelnut, 16/23 for peach, 11/28 for peanut, and 22/31 for walnut. In total, forty SPTs (23%) were performed in patients who experienced no symptoms at all after consumption of the specific food allergen. Sixteen SPTs (9%) were performed in patients who could not answer the question as to whether they experienced symptoms after consumption of a specific food allergen, because they were on a strict diet free from the food for a long time, caused by, e.g., a positive sIgE in the past during routine testing. The results of any symptoms ever experienced after consumption of the specific food allergen gathered from the questionnaire are shown in
Table 2.
3.2. Skin Prick Tests
One hundred and seventy-four SPTs were performed with the six included food allergens: 27 (16%) with almond, 21 (12%) with apple, 44 (25%) with hazelnut, 23 (13%) with peach, 28 (16%) with peanut, and 31 (18%) with walnut.
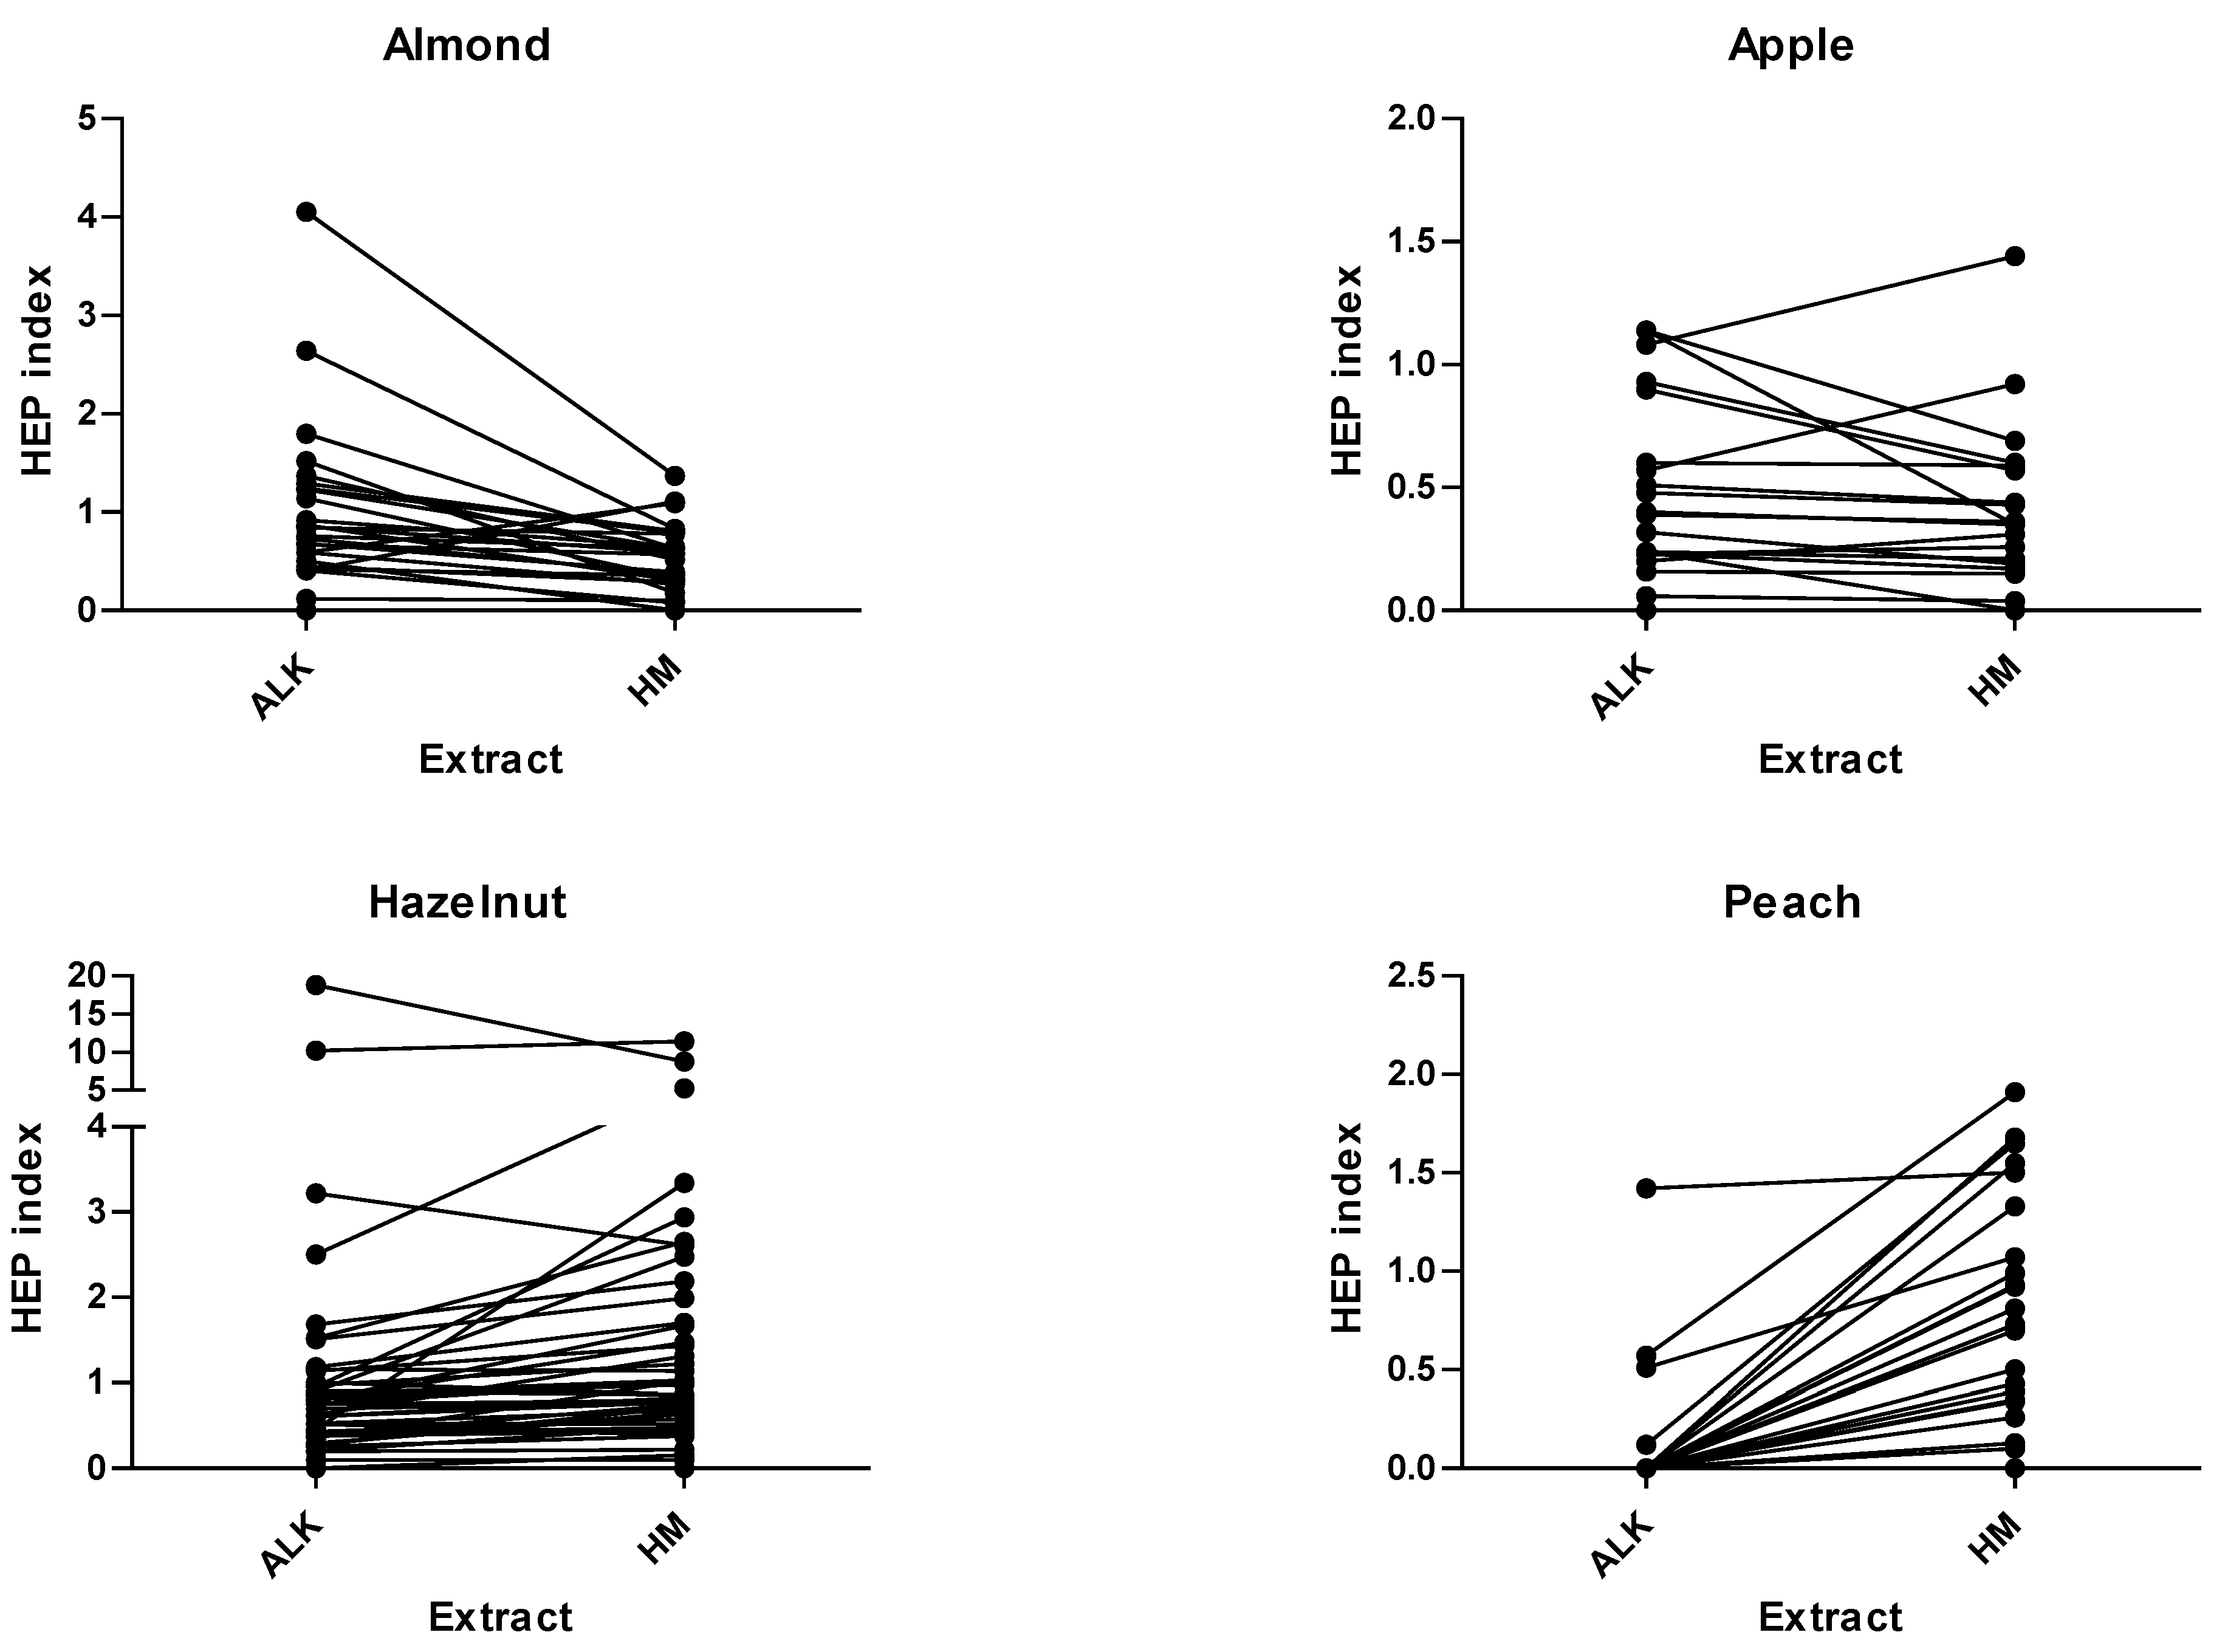
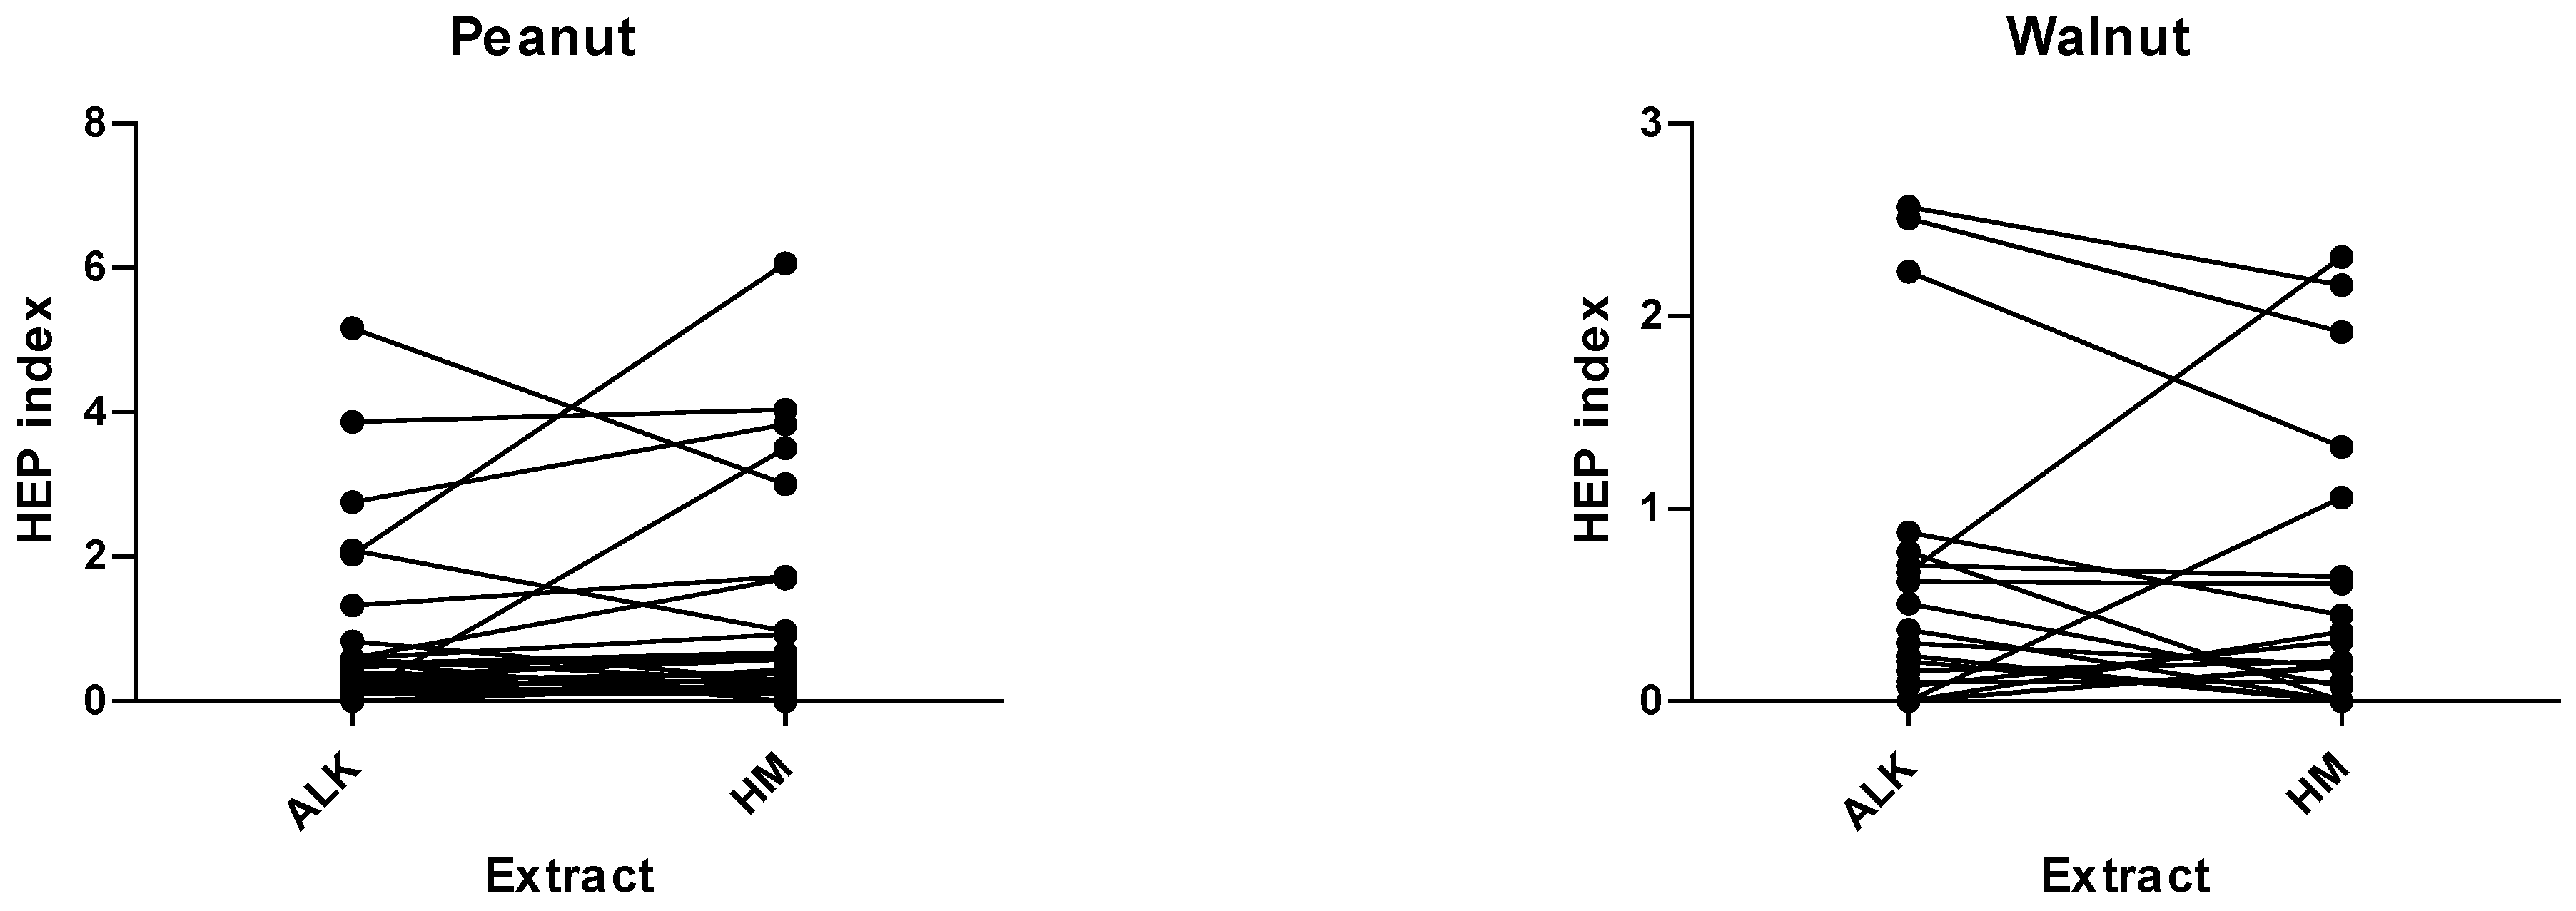
The mean HEP index with ALK food allergen extracts vs. HM extracts was; 0.96 vs. 0.51 for almond, 0.47 vs. 0.38 for apple, 1.40 vs. 1.61 for hazelnut, 0.11 vs. 0.83 for peach, 0.86 vs. 1.13 for peanut, and 0.42 vs. 0.39 for walnut, respectively. P-values for the comparison of the number of positive SPTs (≥ 3mm) were: 0.5 for almond, 0.5 for apple, 1.0 for hazelnut, <0.001 for peach, 0.63 for peanut, and 1.0 for walnut. The SPT-HEP results and ICC of the six food allergens are shown in
Table 3.
The differences in the SPT-HEP results with both extracts are also depicted in
Figure 1.
The ICCs between the SPT-HEP results for both extract methods, HM and commercial, were all significant; 0.36 (weak) for almond, 0.74 (moderate) for apple, 0.79 (strong) for hazelnut, 0.17 (weak) for peach, 0.66 (moderate) for peanut, and 0.78 (strong) for walnut.
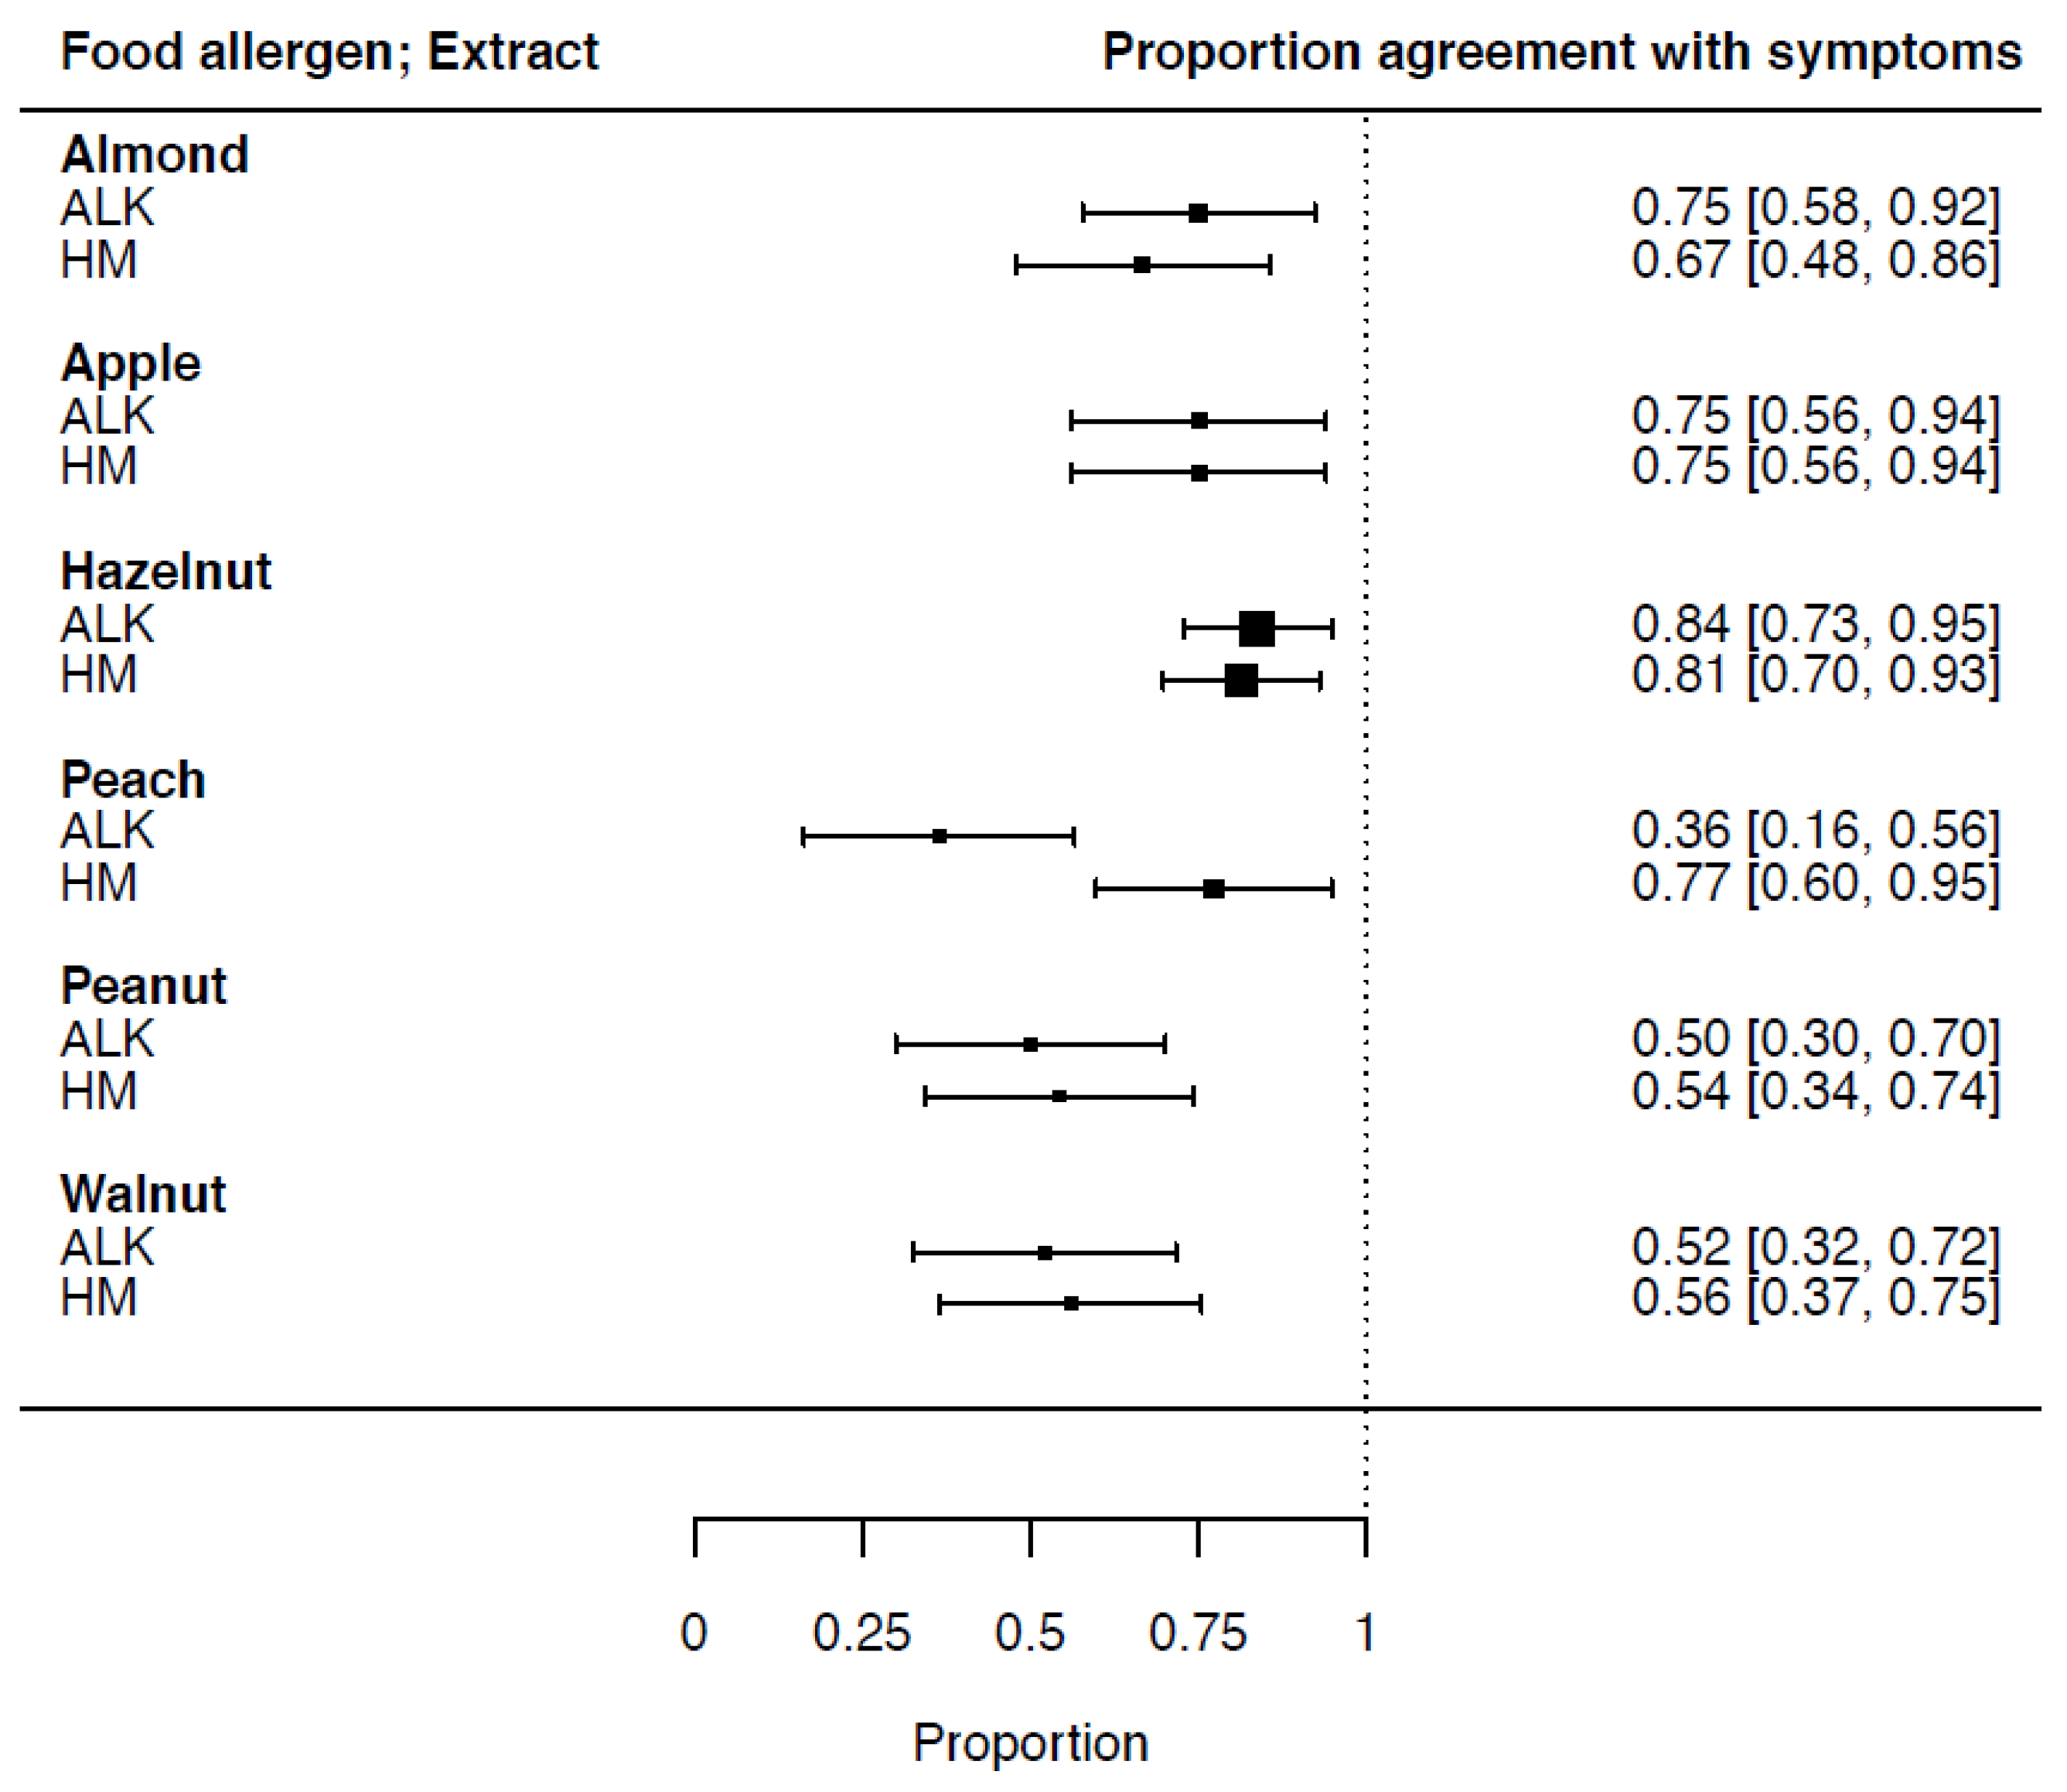
3.3. Proportion of Agreement of SPT-HEP Results with Symptoms
Sensitization in relation to food-specific symptoms (proportion of agreement) and the confidence interval (CI) for ALK vs. HM extracts was calculated: for almond, 0.75 (CI 0.58–0.92) and 0.67 (CI 0.48–0.86), respectively; apple, 0.75 (CI 0.56–0.94) and 0.75 (CI 0.56–0.94), respectively; hazelnut, 0.84 (CI 0.73–0.95) and 0.81 (CI 0.70–0.93), respectively; peach, 0.36 (CI 0.16–0.56) and 0.77 (CI 0.60–0.95), respectively; peanut, 0.50 (CI 0.30–0.70) and 0.54 (CI 0.34–0.74), respectively; and walnut, 0.52 (CI 0.32–0.72) and 0.56 (CI 0.37–0.75), respectively. The sensitization in relation to the symptoms and CI of all six food allergen extracts is shown in
Figure 2.
3.4. Serum-Specific IgE Measurements
Serum-specific IgE measured by ImmunoCAP™ (monoplex, Thermo Fisher Scientific, Uppsala, Sweden) for almond was positive in 10/27 cases. Specific IgE measured by ISAC (multiplex, Thermo Fisher Scientific, Uppsala, Sweden) was positive in all 42 sera. Specific IgE was positive in 18/20 for Mal d1 (apple), 40/42 for Cor a1 (hazelnut), 20/22 for Pru p1 (peach), 19/28 for Ara h8 (peanut), and 3/30 for Jug r 1 (walnut). The median and range of all sIgE measurements are shown in
Table 4.
It appeared that other allergen components were only positive in a few cases; hazelnut Cor a8 and peach Pru p3 (both lipid transfer proteins [LTP]) were only positive in two and one patients, respectively, while major 2S albumins hazelnut Cor a 14 and peanut Ara h2 and Ara h6 were only positive in three, five and five cases, respectively. Proportion of agreement calculations were not feasible for these allergen components due to low power.
The proportion of agreement of specific IgE measurements in relation to symptoms and CI was calculated: for almond: 0.29 (CI 0.11–0.47); apple (Mal d1; PR10): 0.79 (CI 0.61–0.97); hazelnut (Cor a1; PR10): 0.80 (CI 0.68–0.93); peach (Pru p1; PR–10): 0.73 (CI 0.54–0.91); peanut (Ara h8; PR10): 0.71 (CI 0.53–0.89); and for walnut (Jug r1; 2S albumine): 0.21 (CI 0.05–0.37).
3.5. Accuracy of Sensitization Measurements in Relation to Reported Symptoms
Sensitivity and specificity measurements as well as the PPV, NPV and LR of SPT results in comparison to the reported symptoms were obtained (
Table 5.) The mean sensitivity of SPT HM extracts and ALK extracts was 0.84 and 0.73, respectively. The mean specificity of SPT HM extracts and ALK extracts was 0.38 and 0.37, respectively.
4. Discussion
In this study, we compared SPT results for HM food allergen extracts with results for commercially available extracts, in patients with reported food-specific allergic symptoms, e.g., OAS, GI symptoms, skin symptoms, and/or respiratory symptoms, after ingestion of the suspected food. We performed SPTs in 54 patients, using both the HM extract and the commercially available extract of the same food allergen, within the same patient, at the same time. We found a strong correlation between both extract methods for hazelnut and walnut, moderate correlation for peanut and apple, and weak correlation for almond and peach. This indicates that these HM food allergen extracts are a good to moderate alternative in the absence of standardized commercially available extracts.
We found comparable sensitivity and specificity results for HM and ALK food allergen extracts. As expected, the mean sensitivity was high (0.84 and 0.73, respectively), but the specificity is considerably low for both extracts (0.38 and 0.37, respectively). Asero et al. described this low specificity earlier for food allergen extracts [
14]. In particular, the hazelnut extract performed poorly in both extracts. One reason might be that we compared the results with doctor-diagnosed allergies without performing DBPCFCs. Another reason might be that most patients are sensitized to Cor a1, and consequently we lose these labile proteins during extraction. Interestingly, the sensitivity of the HM peach extract (0.94) performed very well, in contrast to the ALK extract, which has a sensitivity of 0.19. These results are in line with previous studies with fruit allergens, which point out that, in commercially available extracts of fruit and vegetables, the proteins may be destroyed during the manufacturing process [
6]. A review by Foong and Santos in 2020 established higher sensitivity and specificity of SPTs with fresh fruit and vegetables, compared to commercial extracts, and acknowledged their importance in patients with pollen sensitization [
15].
The considerable differences between SPT-HEP results of the HM and the commercially available extract of almond (mean HEP 0.51, range 0–1.37 vs. mean HEP 0.96, range 0–4.05, respectively) and the proportion of agreement for almond (0.67 vs. 0.75) must be seen in perspective. The sIgE measurements in relation to symptoms (proportion of agreement) and CI for almond (0.29 (CI 0.29–0.47)) were low. However, the perception of the patients with symptoms due to almond consumption can be argued; being sensitization to almond is often followed by a negative food challenge. In a cohort study by Arends et al., 189 almond challenges among a group of Dutch children were analyzed. A positive SPT with almond was found in 148 children (78%); 97/101 double blind placebo-controlled food challenges (DBPCFC) were negative [
16].
In the 28 SPTs we performed with the peanut extract, we found 21 (75%) positive SPT(≥3mm) results with the commercially available extract vs. 23 (82%) with the HM extract (p-value 0.63). Thirteen patients (46%) could consume peanut without experiencing allergic symptoms. These outcomes were established in earlier studies; in 2005, Mortz et al. investigated the prevalence of peanut sensitization in an unselected population of adolescents and evaluated the clinical relevance of a positive sIgE or SPT to peanut, and the possible correlation between peanut and pollen sensitization. In a group of Danish adolescents, a peanut sensitization evaluated by ImmunoCAP™ and SPT of 5.8% and 3.4%, respectively, was found, while the point of prevalence of a peanut allergy, confirmed by oral challenge, was estimated to be 0.5%. Most peanut-sensitized adolescents had atopic diseases; intermittent allergic rhinitis was seen in 58–74%. The possibility of correlation between peanut and pollen (grass) sensitization was suggested [
17]. Food challenge is still the gold standard for diagnosing food allergies, including suspected reaction to peanut [
17,
18,
19,
20].
HM food allergen extracts are prepared by standardized protocols. The HM allergen extracts of nuts and peanut are in all cases defatted during pre-processing. The removal of fat and oils, which are able to cause false positive type IV skin reactions, and other small particles, e.g., minerals, improves the exposure of allergenic proteins and extraction efficiency, and removes components that are insoluble in water [
12,
21].
Defatted and dried HM allergen material (dry powder) can be stored at −20 °C, which improves the long-term stability. De Jong et al. showed good stability results with the same method (HM), comparing fresh, 3-month-old, and 6-month-old extracts. In this earlier study, batch-to-batch comparisons with coriander, hazelnut, peach, and sesame seed gave coefficients of variation of 39%, 33%, 37%, and 26%, respectively. Overall, pair wise comparison of dose response SPT results with the four different HM extracts using 5%, 10%, and 20% were significant in all cases [
12]. Secondly, the HM extracts appeared to be safe, as no adverse events occurred in the 2004 study, as well as in the current study. Finally, the method of preparing HM extracts is clearly extremely cost-effective. An analyst can prepare the material in the hospital laboratory, using food from the local grocery, and even more rare sources (e.g., new food sources such as seaweed, tropical fruits such as papaya, and new legumes such as lentils) can be extracted easily at a low cost.
There are some limitations to this study: first, most patients included in this study suffer from an inhalant allergy (sensitization birch pollen: 94%, grass pollen: 74%). We did not specifically select these patients, but as we performed the study in a peripheral hospital (second line), the population differs from, e.g., an Academic Center. Consequently, the suspected food allergy in these patients was most likely caused by cross reactivity, which could be confirmed by a high percentage of sensitization to several PR-10-specific allergens (Cor a 1, Ara h 8, Pru p 1, Mal d 1). This might cause some bias, as we therefore did not test the allergen extracts in patients with a primary food allergy. The low sIgE found for LTP proteins (Cor a8, Ara h9, Jug r3, and Pru p3) confirms the population of the included patients. Consequently, the proportion of agreement for walnut Jug r1 is low (0.24). Finally, in a peripheral hospital, we did not perform the gold standard for the diagnosis of food allergy; the DBPCFC. Comparing SPT results with suspected food allergy is not in accordance to the guidelines, but must be seen as a first step in the diagnosis of a food allergy [
2].


 ,
, 


