
The Lunchbox Study: A Pilot Examination of Packed Lunches of Children with Autism Spectrum Disorder

Abstract
:1. Introduction
2. Methods
2.1. Participants
2.2. Procedures
2.3. Dietary Coding
2.4. Evaluation of Lunch Quality
- 1/2 cup of fruit (excludes fruit juice);
- 3/4 cup of vegetables (excludes vegetable juice and vegetables “carried” in another item, such as lettuce on a sandwich because the contribution to total vegetable portion size was negligible);
- One ounce of grains from bread, rice, pasta, cereal and granola (excludes grains from snack foods and desserts);
- One ounce of meat/meat alternate (from sandwiches with protein filling, nuts/seeds, eggs, peanut/nut butter, hummus, leftover meat, cheese and yogurt);
- One cup of fluid milk.
2.5. Evaluation of FV Consumption
3. Results
3.1. Descriptive Statistics
3.2. Student Demographics and FV Consumption
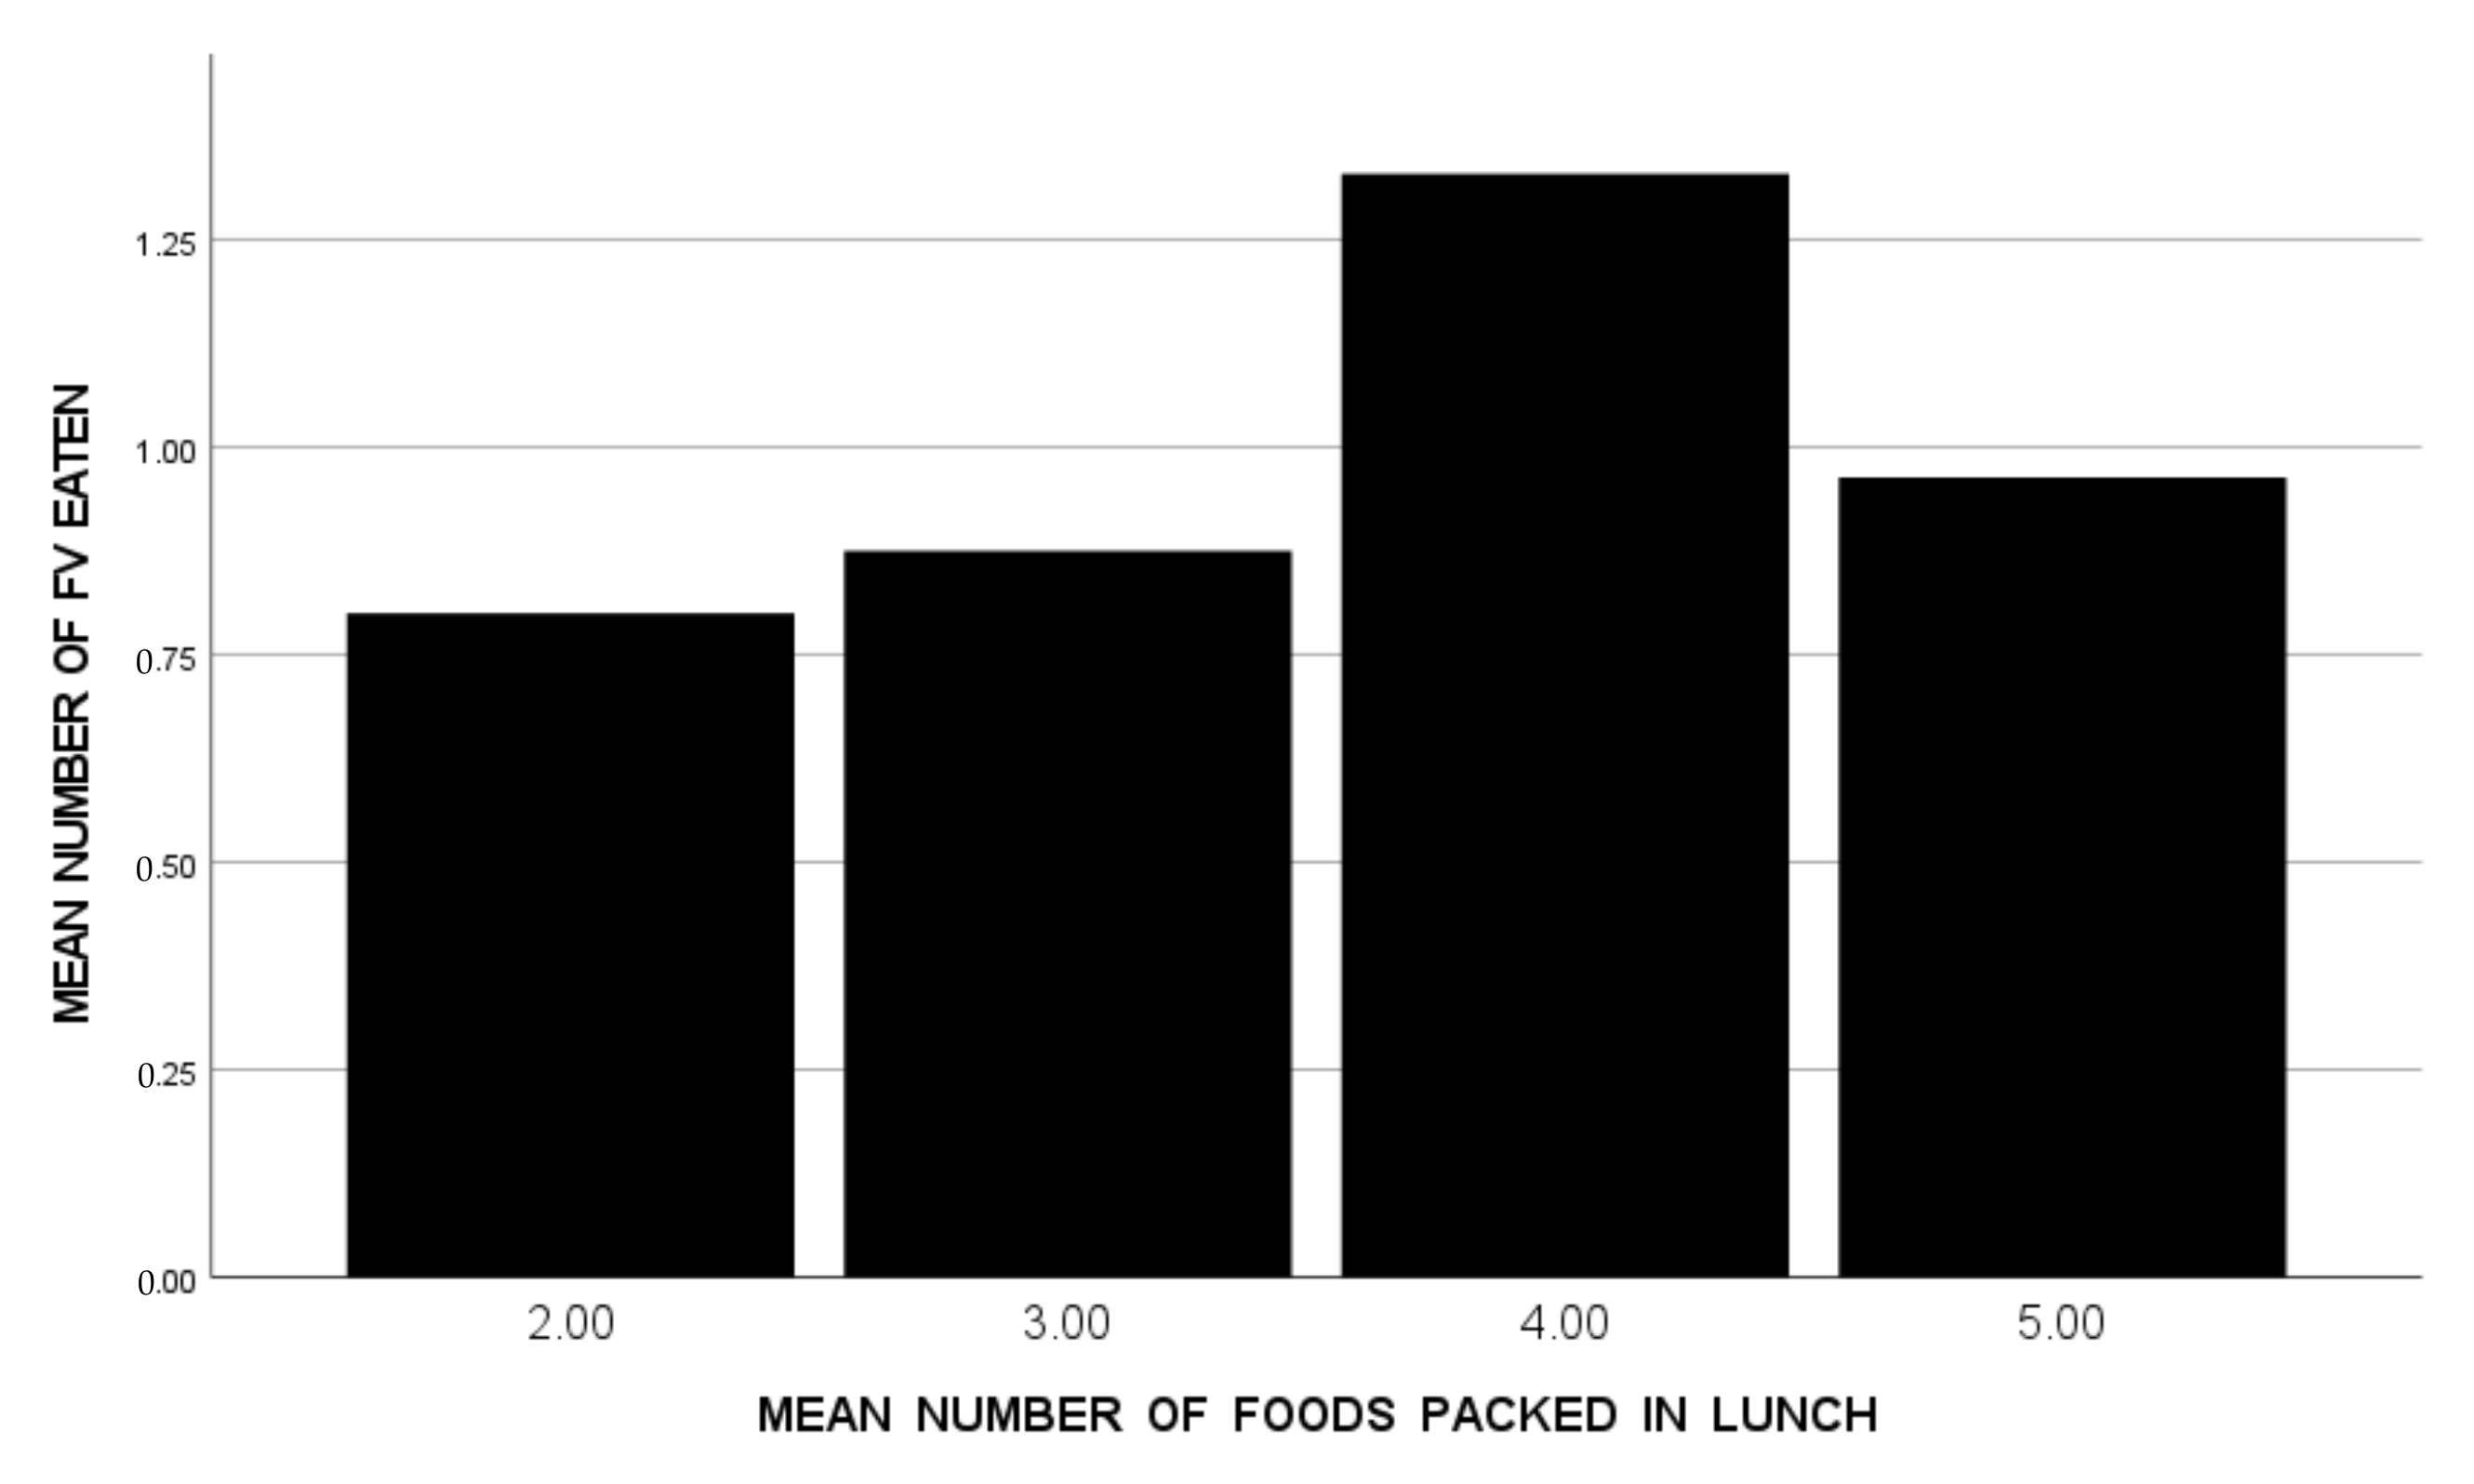
3.3. Number and Type of Foods Packed and Student FV Consumption
4. Discussion
5. Conclusions
Author Contributions
Funding
Institutional Review Board Statement
Informed Consent Statement
Data Availability Statement
Conflicts of Interest
References
- Romo-Palafox, M.J.; Ranjit, N.; Sweitzer, S.J.; Roberts-Gray, C.; Byrd-Williams, C.E.; Briley, M.E.; Hoelscher, D. Adequacy of Parent-Packed Lunches and Preschooler’s Consumption Compared to Dietary Reference Intake Recommendations. J. Am. Coll. Nutr. 2017, 36, 169–176. [Google Scholar] [CrossRef] [PubMed]
- Dresler-Hawke, E.; Whitehead, D.; Coad, J. What are New Zealand children eating at school? A content analysis of ‘consumed versus unconsumed’ food groups in a lunch-box survey. Health Educ. J. 2009, 68, 3–13. [Google Scholar] [CrossRef]
- Hubbard, K.L.; Must, A.; Eliasziw, M.; Folta, S.C.; Goldberg, J. What’s in Children’s Backpacks: Foods Brought from Home. J. Acad. Nutr. Diet. 2014, 114, 1424–1431. [Google Scholar] [CrossRef] [PubMed] [Green Version]
- Marcason, W. What Are the New National School Lunch and Breakfast Program Nutrition Standards? J. Acad. Nutr. Diet. 2012, 112, 1112. [Google Scholar] [CrossRef] [PubMed]
- Bandini, L.G.; Anderson, S.E.; Curtin, C.; Cermak, S.; Evans, E.W.; Scampini, R.; Maslin, M.; Must, A. Food Selectivity in Children with Autism Spectrum Disorders and Typically Developing Children. J. Pediatr. 2010, 157, 259–264. [Google Scholar] [CrossRef] [PubMed] [Green Version]
- Curtin, C.; Hubbard, K.L.; Anderson, S.E.; Mick, E.O.; Must, A.; Bandini, L.G. Food Selectivity, Mealtime Behavior Problems, Spousal Stress, and Family Food Choices in Children with and without Autism Spectrum Disorder. J. Autism Dev. Disord. 2015, 45, 3308–3315. [Google Scholar] [CrossRef] [PubMed] [Green Version]
- Schreck, K.A.; Williams, K.; Smith, A.F. A Comparison of Eating Behaviors between Children with and without Autism. J. Autism Dev. Disord. 2004, 34, 433–438. [Google Scholar] [CrossRef] [PubMed]
- Yeung, S.S.Y.; Chan, R.; Li, L.; Chan, D.; Leung, J.; Leung, T.-F. Eating Behaviors and Diet Quality in Chinese Preschoolers with and without Autism Spectrum Disorder: A Case–Control Study. J. Pediatr. 2021, 237, 258–266.e5. [Google Scholar] [CrossRef] [PubMed]
- United States of Agriculture. Food and Nutrition Service. Nutrition Standards in the National School Lunch and School Breakfast Programs. 7 CFR Parts 210 and 220. Fed. Regist. 2012, 77. Available online: https://www.federalregister.gov/documents/2012/01/26/2012-1010/nutrition-standards-in-the-national-school-lunch-and-school-breakfast-programs (accessed on 1 March 2022).
- Hendy, H.M.; Williams, K.E.; Camise, T.S.; Eckman, N.; Hedemann, A. The Parent Mealtime Action Scale (PMAS). Development and association with children’s diet and weight. Appetite 2009, 52, 328–339. [Google Scholar] [CrossRef] [PubMed]
- Nathan, N.; Janssen, L.; Sutherland, R.; Hodder, R.K.; Evans, C.E.L.; Booth, D.; Yoong, S.L.; Reilly, K.; Finch, M.; Wolfenden, L. The effectiveness of lunchbox interventions on improving the foods and beverages packed and consumed by children at centre-based care or school: A systematic review and meta-analysis. Int. J. Behav. Nutr. Phys. Act. 2019, 16, 38. [Google Scholar] [CrossRef] [PubMed] [Green Version]
- Prescott, M.P.; Burg, X.; Metcalfe, J.J.; Lipka, A.E.; Herritt, C.; Cunningham-Sabo, L. Healthy Planet, Healthy Youth: A Food Systems Education and Promotion Intervention to Improve Adolescent Diet Quality and Reduce Food Waste. Nutrients 2019, 11, 1869. [Google Scholar] [CrossRef] [PubMed] [Green Version]
- Taylor, J.C.; Zidenberg-Cherr, S.; Linnell, J.D.; Feenstra, G.; Scherr, R.E. Impact of a multicomponent, school-based nutrition intervention on students’ lunchtime fruit and vegetable availability and intake: A pilot study evaluating the Shaping Healthy Choices Program. J. Hunger Environ. Nutr. 2018, 13, 415–428. [Google Scholar] [CrossRef]


| Variable | % | ||
| School location | |||
| 1 | 15.3% | ||
| 2 | 11.9% | ||
| 3 | 23.7% | ||
| 4 | 18.6% | ||
| 5 | 30.5% | ||
| Male gender | 78.0% | ||
| Variable | M | SD | Range |
| Student age (years) | 13.80 | 5.09 | 5.00 to 20.00 |
| BMI z-score | 0.46 | 1.46 | –3.45 to 2.98 |
| Mean number foods packed | 3.75 | 1.19 | 2.00 to 8.20 |
| Mean number FV packed | 1.22 | 0.87 | 0.00 to 4.60 |
| Mean number FV consumed | 1.00 | 0.77 | 0.00 to 2.80 |
| Fruits | % | Vegetables | % |
|---|---|---|---|
| Bananas | 77.8% | Potatoes | 66.7% |
| Apples | 83.3% | Tomatoes | 44.4% |
| Grapes | 74.1% | Onions | 29.6% |
| Strawberries | 72.2% | Carrots | 64.8% |
| Oranges | 70.4% | Lettuce | 50.0% |
| Watermelon | 74.1% | Peppers | 46.3% |
| Blueberries | 59.3% | Celery | 35.2% |
| Peaches | 61.1% | Cucumbers | 59.3% |
| Pineapple | 59.3% | Corn | 64.8% |
| Cherries | 37.0% | Sweet potatoes | 50.0% |
| Pears | 70.4% | Green beans | 53.7% |
| Raisins | 57.4% | Cauliflower | 42.6% |
| Plums | 46.3% | Peas | 46.3% |
| Nectarines | 61.1% | Squash | 33.3% |
| Grapefruit | 22.2% | Lima beans | 24.1% |
| Top Seven Fruits: | % | Top Seven Vegetables: | % |
| Apples | 83.3% | Potatoes | 66.7% |
| Bananas | 77.8% | Carrots | 64.8% |
| Grapes | 74.1% | Corn | 64.8% |
| Watermelon | 74.1% | Cucumbers | 59.3% |
| Strawberries | 72.2% | Green beans | 53.7% |
| Oranges | 70.4% | Lettuce | 50.0% |
| Pears | 70.4% | Sweet potatoes | 50.0% |
| Categories | Mean Foods Packed | Mean Foods Consumed | % (Consumed/Packed) |
|---|---|---|---|
| Beverages | |||
| Water | 1.03 | 0.83 | 84% |
| Sugar-sweetened | 0.92 | 0.91 | 986% |
| Milk | 0.14 | 0.12 | 83% |
| Juice | 0.60 | 0.58 | 100% |
| Calorie-free | 0.03 | 0.03 | 100% |
| Sandwiches | |||
| Protein filling | 1.03 | 1.00 | 93% |
| Fat or carb filling | 1.02 | 1.00 | 98% |
| Snack foods | |||
| Chips, pretzels | 1.28 | 1.22 | 98% |
| Crackers | 0.78 | 0.74 | 99% |
| Nuts, seeds | 0.12 | 0.12 | 100% |
| Fruits | |||
| Fresh | 2.45 | 2.31 | 95% |
| Canned | 0.58 | 0.51 | 80% |
| Dried | 0.09 | 0.09 | 100% |
| Desserts | |||
| Cookies | 1.11 | 1.08 | 98% |
| Baked goods | 0.74 | 0.71 | 98% |
| Other desserts | 0.34 | 0.28 | 85% |
| Leftovers | |||
| Grains | 1.23 | 1.17 | 96% |
| Meat, protein | 1.38 | 1.37 | 99% |
| Mixed dish | 0.43 | 0.42 | 93% |
| Pizza | 0.49 | 0.49 | 100% |
| Dairy foods | |||
| Yogurt | 0.88 | 0.83 | 96% |
| Cheese | 0.28 | 0.25 | 91% |
| Vegetables | |||
| Green, orange, red | 0.83 | 0.74 | 95% |
| Starchy, other | 0.29 | 0.29 | 100% |
| National School Lunch Guideline | Present Study: % of Packed Lunches Meeting the Guideline | Previous Study: % of Packed Lunches Meeting the Guideline |
|---|---|---|
| ½ cup fruit | 38% | 32% |
| ¾ cup vegetable | 14% | 6% |
| 1 oz. grains | 67% | 65% |
| 1 oz. protein | 77% | 66% |
| 8 oz. milk | 0% | 15% |
| Total Number of Lunch Guidelines Met: | ||
| 0 | 5% | 20% |
| 1 | 21% | 38% |
| 2 | 50% | 38% |
| 3 | 24% | 23% |
| 4 | 1% | 5% |
| 5 | 0% | 0% |
| Met 3 or more guidelines | 25% | 27% |
| Variable | Beta | t | p |
|---|---|---|---|
| Mean Number of Foods Packed | –0.177 | 2.30 | 0.027 |
| Mean Number FV Packed | 0.765 | 9.92 | 0.001 |
| R2 = 0.695 | |||
| F(2,56) = 63.94 | |||
| p < 0.001 | |||
Publisher’s Note: MDPI stays neutral with regard to jurisdictional claims in published maps and institutional affiliations. |
© 2022 by the authors. Licensee MDPI, Basel, Switzerland. This article is an open access article distributed under the terms and conditions of the Creative Commons Attribution (CC BY) license (https://creativecommons.org/licenses/by/4.0/).
Share and Cite
Seiverling, L.; Felber, J.; Howard, M.; Williams, K.; Hendy, H.M. The Lunchbox Study: A Pilot Examination of Packed Lunches of Children with Autism Spectrum Disorder. Nutrients 2022, 14, 1338. https://doi.org/10.3390/nu14071338
Seiverling L, Felber J, Howard M, Williams K, Hendy HM. The Lunchbox Study: A Pilot Examination of Packed Lunches of Children with Autism Spectrum Disorder. Nutrients. 2022; 14(7):1338. https://doi.org/10.3390/nu14071338
Chicago/Turabian StyleSeiverling, Laura, Jennifer Felber, Monica Howard, Keith Williams, and Helen M. Hendy. 2022. "The Lunchbox Study: A Pilot Examination of Packed Lunches of Children with Autism Spectrum Disorder" Nutrients 14, no. 7: 1338. https://doi.org/10.3390/nu14071338
APA StyleSeiverling, L., Felber, J., Howard, M., Williams, K., & Hendy, H. M. (2022). The Lunchbox Study: A Pilot Examination of Packed Lunches of Children with Autism Spectrum Disorder. Nutrients, 14(7), 1338. https://doi.org/10.3390/nu14071338