Abstract
Objectives: To investigate the association between dietary purine intake and mortality among Chinese adults. Methods: Based on data from the 2004–2015 China Health and Nutrition Survey (CHNS) and the corresponding edition of China Food Composition, the average purine intake per day (mg/day) from 2004 to 2011 was calculated, and the surveyed population was divided into five groups by quintiles. The outcome event and timepoint of concern were defined as death and time, respectively, as reported by family members, recorded until the 2015 survey. Cox proportional hazards regression was used to estimate the hazard ratios (HRs) with 95% confidence intervals (CIs) for death. The possibly nonlinear relationship between purine intake and mortality was examined with restricted cubic splines. Results: We included 17,755 subjects, and the average purine intake among them was 355.07 ± 145.32 mg/day. Purine intake was inversely associated with mortality (Ptrend < 0.001). Compared with the lowest quintiles of purine intake, the highest quintiles (HR = 0.60; 95% CI: 0.46, 0.77) showed a significant association with lower mortality. The negative association with mortality was mainly found in plant-derived purine (Ptrend = 0.001) and, weakly, in animal-derived purine (Ptrend = 0.052). In addition, a U-shaped relationship between purine intake and mortality was observed in males; however, there was no statistically significant dose–response relationship in females. Conclusion: Considering the low-purine-intake levels of the Chinese population, we observed a U-shaped relationship between purine intake and mortality in males, but purine intake may not relate to mortality in females. Future studies should investigate the causal relationship between purine intake and disease burden in China.
1. Introduction
As key compounds in cellular signal transduction, purines play important roles in various physiological processes, such as cell proliferation, differentiation, and apoptosis [1]. Hyperuricemia and gout can result from the accumulation of uric acid caused by abnormal purine metabolism. Therefore, to prevent and treat hyperuricemia and gout, it is recommended to eat fewer purine-rich foods [2,3].
The incidence and frequency of gout and hyperuricemia increase globally with economic growth and lifestyle changes. According to statistics on Europeans and Americans, the incidence of gout is 3–6% in males and 1–2% in females [4]. According to a systematic review, the prevalence of gout is 0.4–1.5% in China [5]. In addition, the increased risk of comorbidities and mortality due to hyperuricemia and gout cannot be ignored. A 2007–2008 study showed that 74% of gout patients had hypertension and 10% had a stroke history in the US [6]. Gout may increase the risk of death, especially from cardiovascular disease [7].
In recent years, many studies have shown the link between the consumption of purine-rich foods and these two diseases. Studies have shown that the intake of purine-rich foods such as meat and seafood is associated with elevated blood uric acid levels and an increased risk of gout and hyperuricemia [8,9]. However, purine-rich vegetables did not affect gout or serum uric acid levels [8,10]. A cross-sectional study in China suggested that purine-rich soy products were associated with a lower prevalence of hypouricemia, while animal products and seafood were associated with a higher prevalence of hyperuricemia [11,12].
Nevertheless, most relevant studies have focused on the relationship between dietary purine intake and hyperuricemia and gout, and few have been conducted with a focus on mortality. Since death is the ultimate manifestation of ill health, studying the relationship between purine intake and death can help clarify the role of purines in human health. In addition, the conclusions of these studies may not apply to the Chinese population due to differences in dietary habits, ethnicity, and genetics between China and other countries. Furthermore, most of the aforementioned studies have examined the relationship between purine-rich foods and disease, but quantitative studies on purine intake and health outcomes are lacking.
This study uses data from the China Nutrition and Health Survey (CHNS), a nationally representative cohort study [13], to explore the relationship between quantitative dietary purine intake and mortality in Chinese adults.
2. Methods
2.1. Study Design and Participants
The CHNS is a nationally representative long-term-follow-up survey project. The content of the survey includes general demographics, lifestyle, health status, diet, etc. Since its establishment in 1989, CHNS has been used to collect 10-panel data in 1989, 1991, 1993, 1997, 2000, 2004, 2006, 2009, 2011, and 2015, and has been used to survey 42,829 participants cumulatively from 12 provinces and three megacities in China (three new cities were added in 2011, and three new provinces were added in 2015). These areas vary in levels of economic development, public resources, geographic location, and citizen health. A multistage random-cluster sampling method was used to obtain research samples in each province or city for representativeness.
Our study included adults who participated in at least one dietary recall during the four waves of CHNS from 2004 to 2011. We used survey data from 2004 to 2011 to measure cumulative average dietary purine intake individually. The data recorded until the 2015 survey were used to determine the survival status and times of the subjects we included. Between 2004 and 2011, a total of 22,683 subjects participated in the survey. Participants under the age of 18 (n = 4408) and those who died before 2004 (n = 50) were excluded. Due to unreliable dietary intake data, subjects with excessively low or high energy intake (<500 kcal/day or >4000 kcal/day, n = 105) were excluded [14,15]. Furthermore, subjects with stroke, cancer, or myocardial infarction at baseline (n = 365) were excluded. Finally, 17,755 subjects were included in the analysis. Figure 1 shows the flow chart of the subject-selection process.
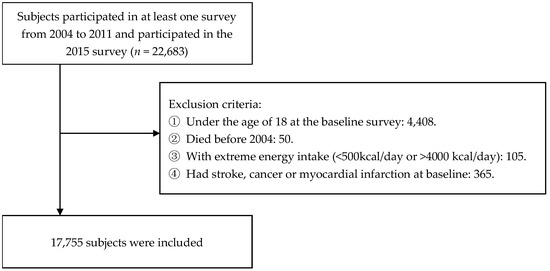
Figure 1.
Flow chart of subject exclusion.
2.2. Assessment of Purine Intake
Dietary data were collected using three consecutive 24-h recalls at the individual level and a food inventory at the household level [16,17]. The three consecutive days were randomly allocated in a week and were almost equally balanced across the seven days for each sampling unit. Participants reported the consumption of all foods on each of the previous three days individually. The consumption of food at the household level was determined by the weighing method. All foods in the household were weighed and recorded at the beginning and the end of each survey day. Well-trained investigators compared the data between household surveys and individual surveys to determine whether they were consistent. If they were not, investigators revisited. Finally, the type of food (identified by a unique food-ID) and consumption were recorded each day.
The cumulative average daily purine intakes were used to reflect long-term diet. According to the sixth edition of the Chinese Food Composition Table [18] and the dietary intake data of the four surveys in 2004, 2006, 2009, and 2011, we first calculated the daily average purine intake in each wave. Next, the cumulative average daily purine intake (mg/day) was calculated as the sum of daily average intake per wave from the first survey to the last survey year divided by the number of waves. For any food lacking a specific measurement value of purine content, the average purine content of its food category was used [19]. We also calculated the cumulative daily purine intake from animal food sources (livestock meat, poultry meat, milk, eggs, and seafood) and plant food sources (cereals, tubers, beans, vegetables, fungi and algae, fruits, nuts, and seeds). Moreover, to explore the relationship between the intake of purine-rich foods and mortality, we calculated the cumulative average daily consumption of purine-rich foods (red meat, poultry, seafood, legumes, purine-rich vegetables, and fungi).
2.3. Ascertainment of Deaths
In each survey, family members reported whether the participants had died and recorded the date of death. The death status of each subject was determined by the report of household members. The first report was chosen when reported repeatedly in different waves. Because the survey did not report specific causes of death, we used all-cause mortality as the outcome. Person-years were calculated from the first survey year to the year of death or the end of follow-up (2015).
2.4. Assessment of Covariates
Based on the literature and prior knowledge [20,21,22], we considered the following covariates: age at baseline, sex, residence, income, years of education, smoking status, drinking status, physical activity, BMI, energy intake, macronutrient intake, hypertension status, and diabetes status. These general demographic characteristics and lifestyle variables were all collected from adult questionnaires at baseline. Ages at baseline were divided into three groups: 18–40 years old, 40–60 years old, and over 60 years old. Physical activity was converted into metabolic equivalents according to the compendium of physical activities [23]. The energy and macronutrient intake were calculated by the 24-h diet-recall data and the Chinese Food Composition Table. BMI was calculated as weight divided by the square of the height (kg/m2). The prevalence of hypertension and diabetes was determined by self-reported previous diagnosis by a physician. Uric acid was measured only in the 2009 wave by a blood sample test.
2.5. Statistical Analysis
The purine intake was energy-adjusted by the residual method [24]. Subjects were categorized into five groups according to the quintiles of purine intake. Continuous variables are presented as the means ± SDs; categorical variables are presented as percentages. The differences across quintiles were analyzed by the Jonckheere–Terpstra test for continuous variables or the Cochran–Armitage trend test for categorical variables.
We performed multiple imputations of residence (27.02% missing), income (27.02% missing), years of education (1.21% missing), smoking status (1.13% missing), drinking status (1.14% missing), physical activity (17.03% missing), BMI (6.61% missing), hypertension status (1.47% missing), and diabetes status (1.41% missing) using the FCS method [25]. Twenty imputed datasets were produced, and the parameters of each imputed dataset computed by the standard statistical procedure were combined to generate the final results. Multivariate Cox proportional hazard models were used to calculate the hazard ratios (HRs) and 95% CIs for death to evaluate the association between dietary purine intake and mortality. We used Schoenfeld residual plots to assess the proportional hazards assumption. The same methods were used to determine the relationships between animal-derived purine intake, plant-derived purine intake, and five types of purine-rich food and mortality. Model 1 was adjusted for age (18–40 years, 40–60 years, or over 60 years) and sex. Model 2 was additionally adjusted for residence (urban or rural), income (continuous variable, CNY/year), years of education (continuous variable, year), smoking status (yes or no), drinking status (yes or no), physical activity (continuous variable, MET-h/day), BMI (continuous variable, kg/m2), and energy intake (continuous variable, kcal/day). Model 3 was further adjusted for disease status, including for hypertension (yes or no) and diabetes (yes or no). The possibly nonlinear relationship between purine intake and mortality was examined with restricted cubic splines (adjusted for age, sex, residence, income, years of education, smoking status, drinking status, physical activity, BMI, energy intake, hypertension status, and diabetes status). Based on Model 3, Model 4 included adjusted protein intake (continuous variable, g/day) to explore whether the association was related to protein. A subgroup analysis was conducted to assess whether the association differed by sex.
All analyses were conducted with SAS 9.4 software. Statistical significance was set at p < 0.05 (two-tailed).
3. Results
3.1. Baseline Characteristics
In total, 17,755 subjects were included in this research, with 9350 (52.66%) females and 8405 (47.34%) males. The average purine intake was 355.07 ± 145.32 mg/day. In total, 758 deaths were documented, with 426 deaths in males and 332 deaths in females. Table 1 shows the baseline characteristics of the participants by quintiles of purine intake. Subjects with higher purine intake were more likely to be male, be younger, dwell in urban settings, have higher education levels, have higher income, currently smoke, currently drink alcohol, and have hypertension. For macronutrient intake, those who consumed more purine consumed fewer carbohydrates, more protein, and less fat. Groups with high purine intake also had higher blood uric acid levels.

Table 1.
Baseline characteristics of participants by quintiles of purine intake (n = 17,755) a.
3.2. Association between Total Purine Intake and Mortality
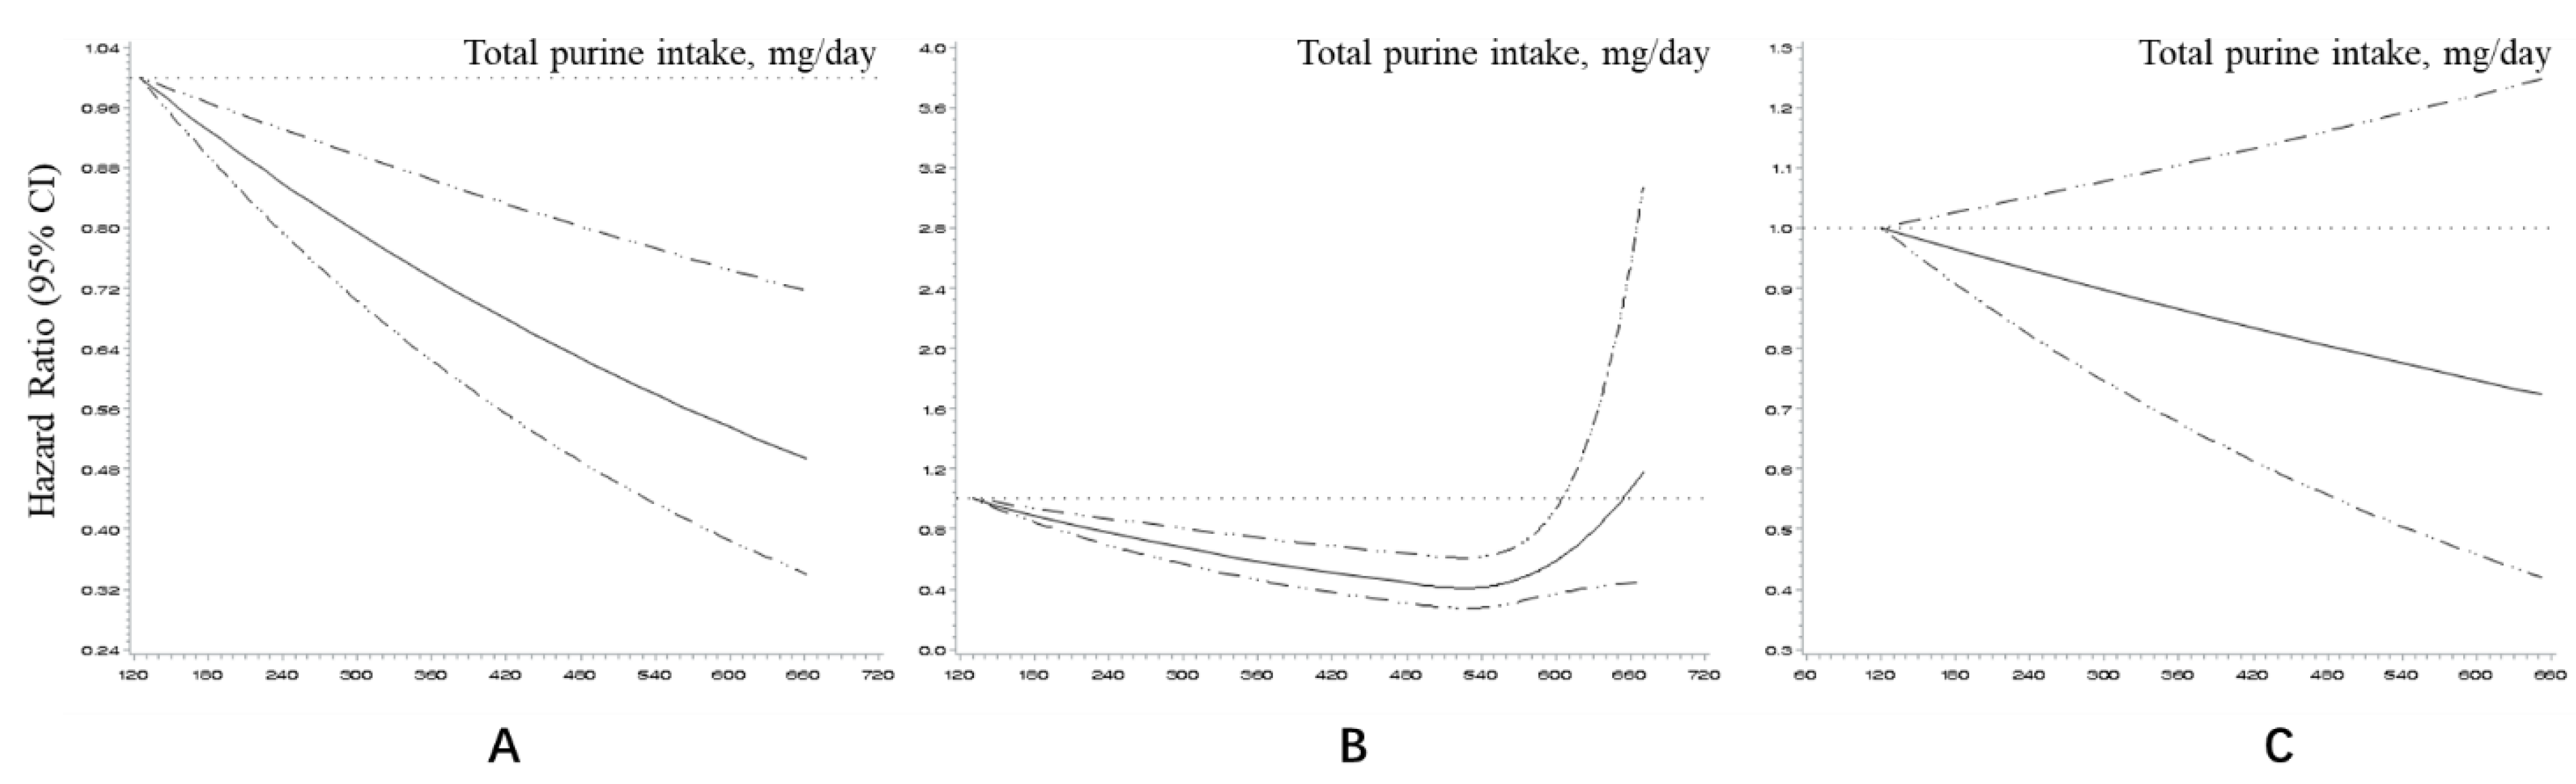
Table 2 presents the HRs and 95% CIs of mortality according to the quintiles of purine intake. For total purine, as intake increased, HR gradually decreased (Ptrend < 0.001). Compared with the lowest quintile, the highest quintile had a 40% decreased risk of death (HR = 0.60; 95% CI: 0.46–0.77). A negative linear dose–response relationship also suggested that higher purine intake was related to lower mortality (Figure 2A). With further adjustment for protein intake, the highest quintile still had a lower HR (0.74, 95% CI: 0.56–0.99), although the trend was not statistically significant (Ptrend = 0.144).
Table 2.
HRs (95% CIs) of mortality according to the quintiles of purine intake a.
Figure 2.
Dose–response relationship between total purine intake and mortality in restricted cubic splines after adjustment (for residence, income, education year, smoking status, drinking status, physical activity, BMI, energy intake, hypertension, and diabetes): (A) All participants; (B) Male; (C) Female.
3.3. Association between Purines from Different Food Sources and Mortality
The HRs and 95% CIs of mortality according to the quintiles of animal-derived purine and plant-derived purine are shown in Table 2, separately. The trend between the purines from animal foods and mortality had a critical p value (Ptrend = 0.052). The participants in the highest quintile had a lower risk of death than those in the lowest quintile (0.71; 95% CI: 0.55–0.92). Similar to the trend for total purine intake, the trend’s p value became insignificant after adjusting for protein intake (Ptrend = 0.778).
A higher intake of purines of plant origin was related to lower mortality. It was still significant after it was adjusted for protein intake (Ptrend = 0.019). Furthermore, it was observed that the HRs decreased gradually with increasing plant-derived purine intake. Moreover, these HRs were similar to those for the total purine intake.
Table S1 shows the HRs (95% CIs) of mortality according to the quintiles of purine-rich food intake. The intake of these high-purine foods was relatively low. Compared with the lowest quintile, higher-quintile groups had HR values of less than 1. Nevertheless, as the intake increased, the HRs did not show a decreasing trend.
3.4. Association between Total Purine Intake and Mortality among Different Genders
The subgroup analysis results are presented in Table 3 (for males) and Table 4 (for females). The association of purine intake with mortality varied between males and females. Similar trends were observed in the males to those in all the participants. The total purine intake and animal-derived purine intake showed protective associations with mortality, but these disappeared after including protein intake in the model. Furthermore, plant-derived purine intake, which is less affected by protein, had a stable, negative association with mortality. However, for females, regardless of the food of origin, purines did not have a significant association with mortality (Ptrend > 0.05).
Table 3.
HRs (95% CIs) of mortality according to the quintiles of purine intake in males a.
Table 4.
HRs (95% CIs) of mortality according to the quintiles of purine intake in females a.
Figure 2 shows the dose–response relationships between the total purine intake and mortality for both sexes (B and C). A U-shaped curve was observed for the males. However, the average purine intake corresponded to the lowest point of the curve, which was approximately 540 mg/day, higher than the highest quintile’s median intake (517.37 mg/day). The dose–response relationship was not statistically significant in the females.
4. Discussion
Our research found that higher dietary purine intake may be a protective factor against death, and the dose–response relationship curve suggested that the mortality rate gradually decreased with increasing dietary purine intake. The attenuated association of purine and mortality in all the participants after adjustment for protein intake suggests that this association may have been due to increased protein intake. After a further analysis of purines from different food sources, we found that those who consume more purines derived from plant foods may have lower mortality and are not affected by protein intake. Purines derived from animal food showed a similar association with mortality, but this association was related to protein. In addition, the association between purine intake and mortality differed by sex. In the males, purine intake exhibited a negative association with mortality, and the association of animal-derived purines and mortality was related to protein, while the association of plant-derived purines and mortality was not related to protein. However, purine intake did not show a statistically significant association with mortality in the females, whether it was plant-derived or animal-derived. In the males, the dose–response relationship between purine intake and mortality was a U-shaped curve. In the females, there was a linear dose–response relationship that was not statistically significant.
Surprisingly, this is not consistent with the conclusions of many related studies. Although few studies have focused on the relationship between dietary purine intake and mortality, most existing evidence suggests that foods with high purine content are related to hyperuricemia and gout. These two diseases are risk factors for cardiovascular death [26,27,28]. A cross-sectional study using CHNS data showed that the intake of purine-rich food (not including vegetables) is associated with increased risk of hyperuricemia [12]. Similar findings have been reported in other countries or regions [8,10,29,30,31,32]. We found that the inverse association with mortality was mainly in plant-derived purines, which is consistent with previous research on plant-derived purine-rich foods. We speculate that the following possible mechanisms may explain these findings: First, uric acid is the end product of purine metabolism. Higher uric acid levels are often associated with hyperuricemia and gout and increase the risk of mortality from cardiovascular disease. Previous studies [33] have shown that the consumption of purine-rich animal foods, such as meat and seafood, increases uric acid levels; however, protein intake does not increase uric acid but instead has the effect of lowering uric acid. In our study, after adjusting for protein intake, the corresponding HR value of the animal purine intake increased, and the trend in mortality disappeared. Because purine-rich animal foods are usually rich in protein, the increase in protein intake probably weakened the increase in uric acid and the risk of death. Second, many studies have also proven that there is a J- or U-shaped relationship between uric acid levels and mortality [34,35,36,37]. According to related studies in Japan, the uric acid levels corresponding to the lowest risk of death for men and women are 7 mg/dL and 5 mg/dL, respectively. In our study, the average uric acid level of the highest quintile of purine intake in the Chinese population was 328 μmol/L, close to that at the U-shaped relationship’s low point. The U-shaped dose–response relationship in males also proves this hypothesis: the purine intake at the lowest point of the curve was 540 mg/day, which is close to the median intake of the fifth-quantile group, suggesting that the purine intake of most Chinese adults is below this threshold.
In addition, cooking methods significantly impact the purine content in foods. The high-temperature treatment of foods can reduce purine content. In this study, the effect of cooking methods on purines was not considered due to data limitations. Chinese people usually cook food at high temperatures, so their actual intake of purines may be less than that indicated by our research. Because this study found that the overall consumption of high-purine foods among Chinese people is relatively low, this association may have arisen because the intake level had not yet reached the critical value at which risk is increased. Third, our study used a quantitative method to calculate purine intake, while most previous studies used purine-rich foods for analysis, which may also be a source of the differences between the research conclusions. Perhaps the inverse association of plant-derived purine and mortality can be partially explained by plant-derived purine helping to prevent obesity and reducing insulin resistance [38]. Other protective ingredients in plant foods, such as phytochemicals, may also be responsible for the reduced risk of death owing to their anti-inflammatory and analgesic functions and hypouricemic effects [39,40].
Gender differences in the relationships among purines, diseases, and death are described in many studies [41]. Gender is a factor influencing hyperuricemia and gout: males have a higher risk and incidence than females [42,43,44,45]. Estrogens seem to promote uric acid excretion and gout prevention [46,47]. Based on this effect, it can be inferred that since males are more likely to suffer from diseases related to purine metabolism, purines in the diet affect males more noticeably. A Japanese cohort study found a U-shaped relationship between blood uric acid levels and mortality in males, and the uric acid level at the lowest point of the curve (the third quintile) in that study was similar to the uric acid level in the top quintile of our study (327.14 vs. 329.95 μmol/L, respectively) [48]. This difference also suggests that the overall level of serum uric acid in the Chinese population is low, from which it can be inferred that purine intake is low in China. A similar conclusion was reached in a study in Korea [49].
One strength of our study is that it uses a large sample of nationally representative data, so the conclusions are relatively reliable. Moreover, the quantitative calculation of purine intake adopted in our study is more accurate than those in previous studies. However, our study also has some limitations. Since the Chinese Food Composition Table does not include the purine-content measurement values of all foods, we replaced the missing values with averages for the corresponding categories to calculate the specific purine intake, which may have introduced some errors. In addition, the effects of seasoning and cooking methods were not considered in the calculation of purine intake. Finally, our study only explored the relationship between purines and all-cause mortality, but it did not further explore specific causes of mortality, such as cardiovascular disease, so further research is needed to determine whether the deaths were caused by purine intake.
Our research reveals the dose–response relationship between purine intake and death, suggesting that a higher purine intake may be related to lower mortality, depending on the food source of the purine and sex. This finding is meaningful for the development of strategies for preventing related diseases.
5. Conclusions
Considering the relatively low purine intake levels in the Chinese population, a higher purine intake was related to lower mortality, and the inverse associations with mortality were mainly found in purines derived from plant foods and in males. We observed a U-shaped relationship between purine intake and mortality in males, but purine intake may not relate to mortality in females.
Supplementary Materials
The following supporting information can be downloaded at: https://www.mdpi.com/article/10.3390/nu14091718/s1, Table S1: HRs (95% CIs) of mortality according to the quintiles of purine-rich food intake.
Author Contributions
Conceptualization, B.M.; formal analysis, M.Y.; methodology, B.M.; writing—original draft, M.Y.; writing—review and editing, Y.L., L.W., H.L., Y.W., F.C., L.P., Y.Z., L.Z., S.D., H.Y. and B.M. All authors have read and agreed to the published version of the manuscript.
Funding
This work was supported by the National Key Research and Development Program of China (2017YFC0907200, 2017YF0907201), the National Natural Science Foundation of China (82103944), and the Natural Science Basic Research Plan of Shaanxi Province (2020JQ-090).
Institutional Review Board Statement
Ethical review and approval were waived for this study due to the use of secondary de-identified publicly available data.
Informed Consent Statement
Informed consent was obtained from all subjects involved in the study.
Data Availability Statement
The data were obtained from CHNS. The original database is available at the website (http://www.cpc.unc.edu/projects/China) (accessed on 1 March 2022).
Acknowledgments
This study used data from the China Health and Nutrition Survey (CHNS). We are grateful for research-grant funding from the National Institute for Health (NIH), the Eunice Kennedy Shriver National Institute of Child Health and Human Development (NICHD) for R01 HD30880, the National Institute of Diabetes and Digestive and Kidney Diseases (NIDDK) for R01DK104371 and R01HL108427, the NIH Fogarty grant D43 TW009077 for financial support for the CHNS files on data collection and analysis since 1989, the China–Japan Friendship Hospital, Ministry of Health, for support for CHNS 2009, the Chinese National Human Genome Center at Shanghai since 2009, and the Beijing Municipal Center for Disease Prevention and Control since 2011. We thank the National Institute for Nutrition and Health, the China Center for Disease Control and Prevention, the Beijing Municipal Center for Disease Control and Prevention, and the Chinese National Human Genome Center in Shanghai.
Conflicts of Interest
The authors declare no conflict of interest.
References
- Huang, Z.; Xie, N.; Illes, P.; Di Virgilio, F.; Ulrich, H.; Semyanov, A.; Verkhratsky, A.; Sperlagh, B.; Yu, S.-G.; Huang, C.; et al. From purines to purinergic signalling: Molecular functions and human diseases. Signal Transduct. Target. Ther. 2021, 6, 162. [Google Scholar] [CrossRef] [PubMed]
- Richette, P.; Doherty, M.; Pascual, E.; Barskova, V.; Becce, F.; Castañeda-Sanabria, J.; Coyfish, M.; Guillo, S.; Jansen, T.L.; Janssens, H.; et al. 2016 updated EULAR evidence-based recommendations for the management of gout. Ann. Rheum. Dis. 2017, 76, 29–42. [Google Scholar] [CrossRef] [PubMed] [Green Version]
- Vedder, D.; Walrabenstein, W.; Heslinga, M.; De Vries, R.; Nurmohamed, M.; Van Schaardenburg, D.; Gerritsen, M. Dietary Interventions for Gout and Effect on Cardiovascular Risk Factors: A Systematic Review. Nutrients 2019, 11, 2955. [Google Scholar] [CrossRef] [PubMed] [Green Version]
- Kuo, C.-F.; Grainge, M.; Zhang, W.; Doherty, M. Global epidemiology of gout: Prevalence, incidence and risk factors. Nat. Rev. Rheumatol. 2015, 11, 649–662. [Google Scholar] [CrossRef] [PubMed]
- Liu, R.; Han, C.; Wu, D.; Xia, X.; Gu, J.; Guan, H.; Shan, Z.; Teng, W. Prevalence of Hyperuricemia and Gout in Mainland China from 2000 to 2014: A Systematic Review and Meta-Analysis. BioMed Res. Int. 2015, 2015, 762820. [Google Scholar] [CrossRef] [PubMed] [Green Version]
- Zhu, Y.; Pandya, B.J.; Choi, H.K. Comorbidities of Gout and Hyperuricemia in the US General Population: NHANES 2007–2008. Am. J. Med. 2012, 125, 679–687.e1. [Google Scholar] [CrossRef]
- Choi, H.K.; Curhan, G. Independent Impact of Gout on Mortality and Risk for Coronary Heart Disease. Circulation 2007, 116, 894–900. [Google Scholar] [CrossRef]
- Choi, H.K.; Atkinson, K.; Karlson, E.W.; Willett, W.; Curhan, G. Purine-Rich Foods, Dairy and Protein Intake, and the Risk of Gout in Men. N. Engl. J. Med. 2004, 350, 1093–1103. [Google Scholar] [CrossRef] [Green Version]
- Li, R.; Yu, K.; Li, C. Dietary factors and risk of gout and hyperuricemia: A meta-analysis and systematic review. Asia Pac. J. Clin. Nutr. 2018, 27, 1344–1356. [Google Scholar]
- Zgaga, L.; Theodoratou, E.; Kyle, J.; Farrington, S.M.; Agakov, F.; Tenesa, A.; Walker, M.; McNeill, G.; Wright, A.F.; Rudan, I.; et al. The Association of Dietary Intake of Purine-Rich Vegetables, Sugar-Sweetened Beverages and Dairy with Plasma Urate, in a Cross-Sectional Study. PLoS ONE 2012, 7, e38123. [Google Scholar] [CrossRef] [Green Version]
- Villegas, R.; Xiang, Y.-B.; Elasy, T.; Xu, W.; Cai, H.; Cai, Q.; Linton, M.; Fazio, S.; Zheng, W.; Shu, X.-O. Purine-rich foods, protein intake, and the prevalence of hyperuricemia: The Shanghai Men’s Health Study. Nutr. Metab. Cardiovasc. Dis. 2012, 22, 409–416. [Google Scholar] [CrossRef] [PubMed] [Green Version]
- Aihemaitijiang, S.; Zhang, Y.; Zhang, L.; Yang, J.; Ye, C.; Halimulati, M.; Zhang, W.; Zhang, Z. The Association between Purine-Rich Food Intake and Hyperuricemia: A Cross-Sectional Study in Chinese Adult Residents. Nutrients 2020, 12, 3835. [Google Scholar] [CrossRef] [PubMed]
- Popkin, B.M.; Du, S.; Zhai, F.; Zhang, B. Cohort Profile: The China Health and Nutrition Survey—Monitoring and understanding socio-economic and health change in China, 1989–2011. Int. J. Epidemiol. 2009, 39, 1435–1440. [Google Scholar] [CrossRef] [PubMed] [Green Version]
- Liu, M.-W.; Yu, H.-J.; Yuan, S.; Song, Y.; Tang, B.-W.; Cao, Z.-K.; Yang, X.-H.; Towne, S.D., Jr.; He, Q.-Q. Association between fruit and vegetable intake and the risk of hypertension among Chinese adults: A longitudinal study. Z. Ernährungswissenschaft 2018, 57, 2639–2647. [Google Scholar] [CrossRef]
- Zhou, J.; Leepromrath, S.; Tian, X.; Zhou, D. Dynamics of Chinese Diet Divergence from Chinese Food Pagoda and Its Association with Adiposity and Influential Factors: 2004–2011. Int. J. Environ. Res. Public Health 2020, 17, 507. [Google Scholar] [CrossRef] [Green Version]
- Popkin, B.M.; Lu, B.; Zhai, F. Understanding the nutrition transition: Measuring rapid dietary changes in transitional countries. Public Health Nutr. 2002, 5, 947–953. [Google Scholar] [CrossRef] [Green Version]
- Xu, X.; Hall, J.; Byles, J.; Shi, Z. Dietary Pattern Is Associated with Obesity in Older People in China: Data from China Health and Nutrition Survey (CHNS). Nutrients 2015, 7, 8170–8188. [Google Scholar] [CrossRef] [Green Version]
- Yang, Y. China Food Composition Tables Standard Edition, 6th ed.; Peking University Medical Press: Beijing, China, 2018. (In Chinese) [Google Scholar]
- Wu, B.; Roseland, J.M.; Haytowitz, D.B.; Pehrsson, P.R.; Ershow, A.G. Availability and quality of published data on the purine content of foods, alcoholic beverages, and dietary supplements. J. Food Compos. Anal. 2019, 84, 103281. [Google Scholar] [CrossRef]
- Stringhini, S.; Carmeli, C.; Jokela, M.; Avendano, M.; Muennig, P.; Guida, F.; Ricceri, F.; D’Errico, A.; Barros, H.; Bochud, M.; et al. Socioeconomic status and the 25 × 25 risk factors as determinants of premature mortality: A multicohort study and meta-analysis of 1·7 million men and women. Lancet 2017, 389, 1229–1237. [Google Scholar] [CrossRef] [Green Version]
- Yusuf, S.; Joseph, P.; Rangarajan, S.; Islam, S.; Mente, A.; Hystad, P.; Brauer, M.; Kutty, V.R.; Gupta, R.; Wielgosz, A.; et al. Modifiable risk factors, cardiovascular disease, and mortality in 155 722 individuals from 21 high-income, middle-income, and low-income countries (PURE): A prospective cohort study. Lancet 2020, 395, 795–808. [Google Scholar] [CrossRef] [Green Version]
- GBD 2016 Risk Factors Collaborators. Risk Factor Collaborators. Global, regional, and national comparative risk assessment of 84 behavioural, environmental and occupational, and metabolic risks or clusters of risks for 195 countries and territories, 1990–2017: A systematic analysis for the Global Burden of Disease Study 2017. Lancet 2018, 392, 1923–1994. [Google Scholar] [CrossRef] [Green Version]
- Ainsworth, B.E.; Haskell, W.L.; Herrmann, S.D.; Meckes, N.; Bassett, D.R., Jr.; Tudor-Locke, C.; Greer, J.L.; Vezina, J.; Whitt-Glover, M.C.; Leon, A.S. 2011 Compendium of Physical Activities: A Second Update of Codes and MET Values. Med. Sci. Sport. Exerc. 2011, 43, 1575–1581. [Google Scholar] [CrossRef] [PubMed] [Green Version]
- Willett, W.; Willett, W.C.; Willett, W.; Stampfer, M.J. Nutrition Epidemiology; Oxford University Press: Oxford, UK, 1998. [Google Scholar]
- Buuren, S.V. Multiple Imputation of Discrete and Continuous Data by Fully Conditional Specification. Stat. Methods Med. Res. 2007, 16, 219–242. [Google Scholar] [CrossRef] [PubMed]
- Cox, P.; Gupta, S.; Zhao, S.S.; Hughes, D.M. The incidence and prevalence of cardiovascular diseases in gout: A systematic review and meta-analysis. Rheumatol. Int. 2021, 41, 1209–1219. [Google Scholar] [CrossRef] [PubMed]
- Feig, D.I.; Kang, D.H.; Johnson, R.J. Uric acid and cardiovascular risk. N. Engl. J. Med. 2008, 359, 1811–1821. [Google Scholar] [CrossRef]
- Ragab, G.; Elshahaly, M.; Bardin, T. Gout: An old disease in new perspective—A review. J. Adv. Res. 2017, 8, 495–511. [Google Scholar] [CrossRef]
- Shahin, L.; Patel, K.M.; Heydari, M.K.; Kesselman, M.M. Hyperuricemia and Cardiovascular Risk. Cureus 2021, 13, e14855. [Google Scholar] [CrossRef]
- Rai, S.K.; Fung, T.T.; Lu, N.; Keller, S.F.; Curhan, G.C.; Choi, H.K. The Dietary Approaches to Stop Hypertension (DASH) diet, Western diet, and risk of gout in men: Prospective cohort study. BMJ 2017, 357, j1794. [Google Scholar] [CrossRef] [Green Version]
- Teng, G.G.; Pan, A.; Yuan, J.-M.; Koh, W.-P. Food Sources of Protein and Risk of Incident Gout in the Singapore Chinese Health Study. Arthritis Rheumatol. 2015, 67, 1933–1942. [Google Scholar] [CrossRef] [Green Version]
- Zhang, Y.; Chen, C.; Choi, H.; Chaisson, C.; Hunter, D.J.; Niu, J.; Neogi, T. Purine-rich foods intake and recurrent gout attacks. Ann. Rheum. Dis. 2012, 71, 1448–1453. [Google Scholar] [CrossRef] [Green Version]
- Choi, H.K.; Liu, S.; Curhan, G. Intake of purine-rich foods, protein, and dairy products and relationship to serum levels of uric acid: The Third National Health and Nutrition Examination Survey. Arthritis Rheum. 2005, 52, 283–289. [Google Scholar] [CrossRef] [PubMed]
- You, H.; Chen, K.; Han, P.; Yue, C.; Zhao, X. U-Shaped Relationship Between Cardiovascular Mortality and Serum Uric Acid May Be Attributed to Stroke- and Heart-Specific Mortality, Respectively, Among Hypertensive Patients: A Nationally Representative Cohort Study. Med Sci. Monit. 2020, 27, e928937-1. [Google Scholar] [CrossRef] [PubMed]
- Konta, T.; Ichikawa, K.; Kawasaki, R.; Fujimoto, S.; Iseki, K.; Moriyama, T.; Yamagata, K.; Tsuruya, K.; Narita, I.; Kondo, M.; et al. Association between serum uric acid levels and mortality: A nationwide community-based cohort study. Sci. Rep. 2020, 10, 6066. [Google Scholar] [CrossRef] [Green Version]
- Kim, K.; Go, S.; Son, H.E.; Ryu, J.Y.; Lee, H.; Heo, N.J.; Chin, H.J.; Park, J.H. Association between Serum Uric Acid Level and ESRD or Death in a Korean Population. J. Korean Med Sci. 2020, 35, e254. [Google Scholar] [CrossRef]
- Odden, M.C.; Amadu, A.-R.; Smit, E.; Lo, L.; Peralta, C.A. Uric Acid Levels, Kidney Function, and Cardiovascular Mortality in US Adults: National Health and Nutrition Examination Survey (NHANES) 1988–1994 and 1999–2002. Am. J. Kidney Dis. 2014, 64, 550–557. [Google Scholar] [CrossRef] [Green Version]
- Mozaffarian, D.; Hao, T.; Rimm, E.B.; Willett, W.C.; Hu, F.B. Changes in Diet and Lifestyle and Long-Term Weight Gain in Women and Men. N. Engl. J. Med. 2011, 364, 2392–2404. [Google Scholar] [CrossRef] [PubMed] [Green Version]
- Shin, S.-A.; Joo, B.J.; Lee, J.; Ryu, G.; Han, M.; Kim, W.-Y.; Park, H.H.; Lee, J.; Lee, C.S. Phytochemicals as Anti-Inflammatory Agents in Animal Models of Prevalent Inflammatory Diseases. Molecules 2020, 25, 5932. [Google Scholar] [CrossRef]
- Jakše, B.; Pajek, M. Uric Acid and Plant-Based Nutrition. Nutrients 2019, 11, 1736. [Google Scholar] [CrossRef] [Green Version]
- Evans, P.L.; Prior, J.A.; Belcher, J.; Hay, C.A.; Mallen, C.; Roddy, E. Gender-specific risk factors for gout: A systematic review of cohort studies. Adv. Rheumatol. 2019, 59, 24. [Google Scholar] [CrossRef]
- Dalbeth, N.; Merriman, T.R.; Stamp, L.K. Gout. Lancet 2016, 388, 2039–2052. [Google Scholar] [CrossRef]
- Liu, B.; Wang, T.; Zhao, H.N.; Yue, W.W.; Yu, H.P.; Liu, C.X.; Yin, J.; Jia, R.Y.; Nie, H.W. The prevalence of hyperuricemia in China: A meta-analysis. BMC Public Health 2011, 11, 832. [Google Scholar] [CrossRef] [Green Version]
- Dehlin, M.; Jacobsson, L.; Roddy, E. Global epidemiology of gout: Prevalence, incidence, treatment patterns and risk factors. Nat. Rev. Rheumatol. 2020, 16, 380–390. [Google Scholar] [CrossRef] [PubMed]
- Miao, Z.; Li, C.; Chen, Y.; Zhao, S.; Wang, Y.; Wang, Z.; Chen, X.; Xu, F.; Wang, F.; Sun, R.; et al. Dietary and lifestyle changes associated with high prevalence of hyperuricemia and gout in the Shandong coastal cities of Eastern China. J. Rheumatol. 2008, 35, 1859–1864. [Google Scholar] [PubMed]
- Hak, A.E.; Curhan, G.C.; Grodstein, F.; Choi, H.K. Menopause, postmenopausal hormone use and risk of incident gout. Ann. Rheum. Dis. 2009, 69, 1305–1309. [Google Scholar] [CrossRef] [PubMed] [Green Version]
- Sumino, H.; Ichikawa, S.; Kanda, T.; Nakamura, T.; Sakamaki, T. Reduction of serum uric acid by hormone replacement therapy in postmenopausal women with hyperuricaemia. Lancet 1999, 354, 650. [Google Scholar] [CrossRef]
- Zhang, W.; Iso, H.; Murakami, Y.; Miura, K.; Nagai, M.; Sugiyama, D.; Ueshima, H.; Okamura, T.; EPOCH-JAPAN Group. Correction:Serum Uric Acid and Mortality Form Cardiovascular Disease:EPOCH-JAPAN Study. J. Atheroscler. Thromb. 2016, 23, 1365–1366. [Google Scholar] [CrossRef] [Green Version]
- Cho, S.K.; Chang, Y.; Kim, I.; Ryu, S. U-Shaped Association Between Serum Uric Acid Level and Risk of Mortality: A Cohort Study. Arthritis Rheumatol. 2018, 70, 1122–1132. [Google Scholar] [CrossRef] [Green Version]

Publisher’s Note: MDPI stays neutral with regard to jurisdictional claims in published maps and institutional affiliations. |
© 2022 by the authors. Licensee MDPI, Basel, Switzerland. This article is an open access article distributed under the terms and conditions of the Creative Commons Attribution (CC BY) license (https://creativecommons.org/licenses/by/4.0/).