Abstract
(1) Objective: This study aimed to explore the correlation between dietary factors and physical function in Chinese elderly. (2) Methods: A cohort study was conducted on the association of long-term dietary intake status with physical function in older people based on the Chinese Longitudinal Healthy Longevity Survey (CLHLS) from 2011 to 2018. The physical function of the subjects was judged according to the scores of basic activities of daily living (BADL) and instrumental activities of daily living (IADL). The dietary diversity score was established according to the intake frequency of the food groups, and the dietary pattern score was obtained by factor analysis. The associations between dietary factors and functional impairment was investigated by logistic regressions. (3) Results: A total of 2282 subjects were included in our cohort study, 458 and 1439 of whom had BADL limitation and IADL limitation, respectively. The risk of functional impairment decreased in the consistent high dietary diversity groups compared with the consistent low dietary diversity group (p < 0.05). The fruit-egg-milk pattern, vegetable-meat-fish pattern, and condiment and tea pattern reduced the risk of functional impairment (p < 0.05). (4) Conclusions: Long-term maintenance of high dietary diversity and increasing total dietary intake can help maintain good physical function of Chinese elderly.
1. Introduction
With the development of the societal economy and the improvement of medical standards, life expectancy has been increasing, which directly leads to the rapid aging of the global population. According to one report [1], the world’s elderly aged 60 and over reached 901 million in 2015, an increase of 48% over the world in 2000. It is expected that the proportion of the world’s elderly population will reach 2.1 billion by 2030, accounting for 21.93% of the world’s total population [2]. At present, China has increasingly developed into an aging society, with 264 million people aged 60 years, of which 190 million are aged 65 years and over [3], accounting for 18.70% and 13.50% of the total population, respectively, while the number of people aged 65 years or over is expected to rise to approximately 240 million by 2030 [4].
With the aging process, the physiological and immune functions of the elderly gradually decline. Compared with middle-aged and young people, the physical health of the elderly becomes worse and worse, and the impairment of physical function is the most important health problem of the elderly [5]. Impaired physical function is closely associated with various adverse health outcomes, such as osteoporosis, falls, and fractures [6,7,8]. At the same time, it leads to frailness, loss of independence, high mortality, and low quality of life [9,10,11], which will place a serious burden on China’s medical and health expenditure [12]. Therefore, the State Council of China issued the outline of the “Healthy China 2030” plan in 2016, which pointed out the need to achieve healthy aging. In order to achieve it, it is more important to focus on the physical function proposed by the World Health Organization (WHO) as the best indicator to measure the health status of the elderly than to focus on a certain disease [13,14] because the process of physical impairment is neither inevitable nor irreversible [15] but can be intervened upon. Therefore, finding modifiable factors that can slow down, stop, or even reverse impairment and effectively control and maintain physical function are important factors to promote healthy aging [16].
It is well-known that nutrition is a key determinant of health and well-being throughout the lifecycle [17,18]. Studies have shown that high dietary quality in the elderly is associated with better health outcomes, such as the reduction of all-cause mortality, cardiovascular disease, cancer, type 2 diabetes, and neurodegenerative diseases [17,19,20]. Degenerative changes and metabolic decline in the elderly make them more sensitive to nutrient deficiency and increase their risk of malnutrition. Inadequate dietary intake is associated with many adverse health outcomes, such as impaired immune response [21], reduced antioxidant defense [22], frail [23], osteoporotic fractures [24], peripheral artery disease [25], and chronic, non-communicable diseases [26]. Optimal nutrition is important to prevent adverse health outcomes. It not only prolongs life expectancy but also improves the quality of life of the elderly, which ultimately contributes to healthy aging [27].
As an important influencing factor that can be regulated, dietary nutrition intervention is one of the main strategies for healthy aging [28,29]. However, to date, only a few studies have explored the effects of dietary diversity or dietary patterns on physical function [30,31,32,33,34], and their conclusions are not completely consistent; almost all of them focus on Western populations. What kind of diet is more suitable for the Chinese elderly is a question worth exploring. Furthermore, these studies were limited by the cross-sectional design, only using cross-sectional dietary factors, and could not observe the impact of long-term dietary habits, the high compliance of a high-quality diet, or changes in dietary factors. This study conducted a cohort study using Chinese Longitudinal Healthy Longevity Survey (CLHLS) data from 2011 to 2018 to explore the correlation between dietary factors and physical function of the elderly and put forward reasonable dietary suggestions to prevent or slow down the physical function impairment of the Chinese elderly and help them with healthy aging.
2. Materials and Methods
2.1. Data Collection and Samples
This cohort study is based on the CLHLS, which is a follow-up survey of elderly individuals organized by the Research Center for Healthy Aging and Development of Peking University/National Development Research Institute. The survey covers 23 provinces in China. The questionnaires were divided into two types: the surviving respondents’ questionnaire and the families of the dead elderly questionnaire. After the baseline survey in 1998, the project conducted follow-up surveys in 2000, 2002, 2005, 2008–2009, 2011–2012, 2014, and 2017–2018,
In this study, subjects in CLHLS who were followed in both 2011 and 2018 were included in the cohort. The research content included dietary-related data, basic activities of daily living (BADL), instrumental activities of daily living (IADL), sociodemographic information, physical health and living habits, self-rated health, and some chronic disease history of the subjects in the 2011–2018 cohort [35]. According to the inclusion and exclusion criteria in Figure 1, a total of 2282 subjects were finally included in this study.
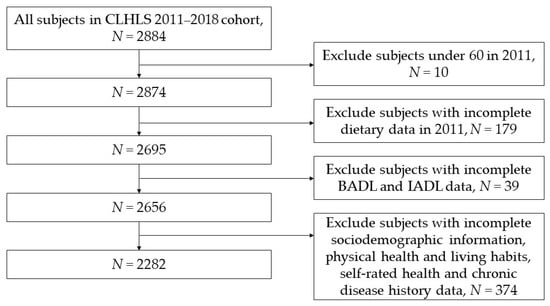
Figure 1.
Flow chart for inclusion and exclusion of research subjects.
All subjects gave their informed consent for inclusion before they participated in the study. The study was approved by the biomedical ethics committee of Peking University (IRB00001052–24713074).
2.2. Dietary Diversity and Dietary Pattern Assessment
2.2.1. Dietary Diversity Assessment
This study applied dietary diversity score (DDS) to evaluate the initial dietary diversity in 2011. The intake frequency in the CLHLS survey was used to indicate the intake status of food groups, including fresh fruit, vegetable, meat, fish, eggs, bean products, salt-preserved vegetables, sugar, garlic, milk products, nut products, mushrooms or algae, and tea. The DDS was calculated according to the intake frequency of 13 food groups. The specific intake frequency and scoring criteria are shown in Table A1.
The total DDS is the sum of the scores of 13 food groups, with the lowest score being 0 and the highest score being 13. The higher the score, the better the dietary diversity. According to the score, the level of dietary diversity was divided into two groups: low DDS (<7) and high DDS (≥7).
We also expressed changes in dietary diversity (CDD) from 2011 to 2018 using four categories: consistently low dietary diversity (low-low), consistently high dietary diversity (high-high), and inconsistent dietary diversity (low-high, high-low) (Table A2).
2.2.2. Dietary Pattern Assessment
In this study, the principal component analysis method of exploratory factor analysis was used to extract the dietary patterns of the elderly population in CLHLS research. The number of factors was determined according to the results of factor analysis of dietary intake in 2011, such as eigenvalues, gravel maps, and interpretability of each factor. We explained and named the model according to professional knowledge and reserved food or food groups.
The pattern score was calculated based on the intake frequency of each food and its weight (factor score). The higher the score of the diet pattern, the greater the preference for a specific diet pattern. According to the dietary pattern score in 2011, the subjects were divided into low- to high-quartile groups (Q1, Q2, Q3, and Q4).
2.3. Definition of Physical Function
Based on the availability of CLHLS survey data and the physiological health characteristics of the elderly, BADL scale and IADL scale were used to evaluate the physical function of the elderly in 2018.
BADL assessed by the Katz index [36] was used to evaluate physical function, which includes 6 basic abilities: bathing, dressing, toileting, indoor transferring, continence, and feeding. BADL is the sum of the scores of six indicators, and the total score varies between 0 (lack of performance) and 6 (maximum performance). According to the BADL, the subjects were divided into no-limitations in BADL group (BADL score = 6) and limitations in BADL group (BADL score = 0–5) (Table A3).
IADL was assessed with the IADL scale [37], which includes the scores of 8 items: visiting outside, shopping outside, cooking independently, washing independently, walking continuously, lifting heavy objects continuously, squatting continuously, and taking transportation independently. IADL is the sum of the scores of eight indicators, and the total score varies between 0 (lack of performance) and 8 (maximum performance). According to the IADL, the subjects were divided into no-limitations in IADL group (IADL score = 8) and limitations in IADL group (IADL score = 0–7) (Table A3).
2.4. Assessment of Covariates
According to previous studies [30,31,32,33], sociodemographic information (gender, age, residence, living conditions, and education), physical health and living habits (body mass index (BMI), alcohol consumption, smoking status, and exercise), other dietary factors (staple food, main flavor, and vitamins intake), and self-rated health and history of chronic diseases (hypertension, diabetes, heart disease, stroke or cardiovascular disease (CVD), arthritis, rheumatism or rheumatoid disease, dyslipidemia) were taken as covariates of this study.
2.5. Statistical Analysis
Independent chi-square tests were used to examine the initial basic characteristics of the groups, such as gender, age, residence, living conditions, education, BMI, alcohol consumption, smoking status, exercise, staple food intake, main flavor, vitamins intake, self-rated health, and history of chronic diseases.
We constructed multilevel logistic regression models to account for potential confounders. They were mainly analyzed by five models: Model 1 was a multiple logistic regression model of dietary factors and functional impairment without any adjustment. Model 2 was adjusted according to sociodemographic information. Model 3 was adjusted according to sociodemographic information and physical health and living habits. Model 4 was adjusted according to sociodemographic information, physical health and living habits, and other dietary factors. Model 5 was adjusted according to sociodemographic information, physical health and living habits, other dietary factors, self-rated health, and history of chronic diseases.
Data preprocessing, database establishment, and statistical analysis were all completed by SAS University edition software (Copyright © 2012–2020, SAS Institute Inc., Cary, NC, USA) unless otherwise indicated. p < 0.05 was used as the statistical index of significance test.
3. Results
3.1. Baseline Characteristics
A total of 458 subjects were limited by BADL of the 2282 subjects, while 1439 subjects were limited by IADL.
It was found that gender, age, residence, living conditions, education, BMI, alcohol consumption, smoking status, exercise, staple food intake, main flavor, self-rated health, history of hypertension, history of stroke or cerebrovascular disease, and history of rheumatism or rheumatoid disease were the influencing factors of BADL limitation (p < 0.05) (Table 1).

Table 1.
Baseline characteristics of BADL non-limitation group and BADL limitation group (n = 2282).
It was found that gender, age, education, BMI, alcohol consumption, smoking status, exercise, self-rated health, history of stroke or cerebrovascular disease, history of arthritis, history of rheumatism or rheumatoid disease were the influencing factors of IADL limitation (p < 0.05) (Table 2).
Table 2.
Baseline characteristics of IADL non-limitation group and IADL limitation group (n = 2282).
3.2. The Association of Dietary Diversity and Physical Function
Taking whether the physical function (BADL and IADL) was limited as the dependent variable and DDS in 2011 with CDD as the independent variable, multiple logistic regression analysis was conducted.
Through the BADL model, it was found that dietary diversity had no effect on the occurrence of BADL limitation. Through IADL model 1, it was found that compared with high dietary diversity, the odds ratio (OR) value of subjects with low dietary diversity for IADL limitation was 1.283 (95% confidence intervals (CI): 1.080–1.525), indicating that subjects with low dietary diversity had an increased risk of IADL restriction than subjects with high dietary diversity. However, after the adjustment of models 2, 3, 4, and 5, dietary diversity had no effect on the occurrence of IADL limitation (Table 3).
Table 3.
Logistic regression analysis between dietary diversity and physical function (n = 2282).
Through the BADL model, it was found that CDD had no effect on the occurrence of BADL limitation. Through IADL model 1, it was found that compared with consistently low dietary diversity, the OR value of subjects with consistently high dietary diversity and dietary diversity that became progressively better for IADL limitation was 0.512 (95%CI: 0.408–0.642) and 0.602 (95%CI: 0.472–0.768), indicating that subjects with consistently high dietary diversity and dietary diversity that became better had a lower risk of IADL limitation than those who with consistently low dietary diversity. After the adjustment of models 2, 3, 4, and 5, the impact still exists (p < 0.05) (Table 4).
Table 4.
Logistic regression analysis between change of dietary diversity and physical function (n = 2282).
3.3. The Association of Dietary Pattern and Physical Function
The applicability test result of exploratory factor analysis was KMO = 0.806 > 0.8, indicating that the above foods or food groups were suitable for principal component analysis. The results of Bartlett’s test of sphericity showed that χ2 = 3572.241 (p < 0.0001), indicating that the food groups were not independent of each other and had a strong correlation, so factor analysis could be carried out. According to Kaiser criteria, this study decided to retain three factors. The eigenvalues of the three factors after rotation were 2.278, 1.631, and 1.554, respectively, and the cumulative contribution rate was 42.024% (Table A4 and Table A5).
Through factor analysis, three dietary patterns were obtained. According to the food characteristics of each pattern, they were named fruit-egg-milk pattern (fresh fruit, eggs, milk products, nut products, and mushroom or algae), vegetable-meat-fish pattern (vegetable, meat, and fish), and condiment and tea pattern (salt-preserved vegetable, sugar, garlic, and tea) (Table A6).
Taking whether the physical function (BADL and IADL) was limited as the dependent variable and dietary pattern score in 2011 as the independent variable, multiple logistic regression analysis was conducted.
Through BADL model 1 and 2, it was found that compared with the subjects with the lowest quantile array of fruit-egg-milk pattern score, the subjects with the highest, third, and second quantiles of this pattern score had a lower risk of BADL limitation after 7 years (p < 0.05). Compared with the subjects in the lowest quantile array of vegetable-meat-fish pattern scores, the subjects in the highest, third, and second quantiles of this pattern score had a lower risk of BADL limitation after 7 years (p < 0.05). However, there was no correlation in condiment and tea pattern with BADL limitation (Table 5).
Table 5.
Logistic regression analysis between dietary pattern score and physical function (n = 2282).
Through IADL model 1 and 2, it was found that compared with the subjects with the lowest quantile array of fruit-egg-milk pattern score, the subjects with the highest and second quantile of this pattern score had a lower risk of IADL limitation after 7 years (p < 0.05). Compared with the subjects in the lowest quantile array of vegetable-meat-fish pattern score, the subjects in the highest, third, and second quantiles of this pattern score had a lower risk of IADL limitation after 7 years (p < 0.05). Compared with the subjects in the lowest quantile array of condiment and tea pattern score, the subjects in the highest and third quantile of this pattern score had a lower risk of IADL limitation after 7 years (p < 0.05).
4. Discussion
Dietary diversity has always been considered by nutritionists as an important factor to improve dietary quality [38]. By increasing dietary diversity, we can ensure sufficient nutrient intake and improve dietary quality so as to improve the nutritional status of the body and promote health [39]. This study used cohort data from 2011 to 2018 in CLHLS to evaluate the impact of dietary factors on the physical function of Chinese elderly. We found that long-term high dietary diversity and increasing the total intake maintains physical function.
In this study, there was no significant correlation between the initial dietary diversity and physical function after 7 years. A cross-sectional study in Japan [30] found that dietary diversity was closely related to the physical function of the elderly in the community. Some cross-sectional studies have found that [40,41,42] there was a correlation between dietary quality and the occurrence of physical function limitation. The results of this study are not consistent with those of previous studies. This may be related to the fact that the effect of the initial cross-sectional diet in our study was not sufficiently detectable, while over a cumulative period of seven years, the effect was sufficiently enough to be detectable.
Because diet is a long-term accumulation process, the impact of long-term dietary changes or long-term eating habits on physical function should be explored. Therefore, we investigated the impact of CDD on physical function from 2011 to 2018. Our study found that long-term maintenance of high dietary diversity was conducive to maintaining physical function in the Chinese elderly after adjusting for gender, age, residence, living condition, education, BMI, alcohol consumption, smoking status and exercise, self-rated health, and chronic disease history (stroke and CVD, arthritis, rheumatism or rheumatoid disease), which is similar to the results of a longitudinal study [31], which reported a 50% lower risk of impaired IADLs after 5 years in the highest quartile of diet assessed by the modified Australian diet quality index compared to the lowest quartile in 895 Australian elderly. We also found that even if the initial dietary diversity was not good, improving dietary diversity was beneficial to maintaining physical function. This meant that as long as dietary diversity was increased, it would help to maintain the physical function of the elderly, which is more practical based on the fact that it is difficult to maintain high dietary diversity for the elderly.
The internal relationship between dietary diversity and physical function may have the following explanations: first, the research showed [43] that the nutritional adequacy of diet could be predicted by calculating the number of food groups, which meant the greater the number of food groups, the richer the dietary diversity, and the more adequate the nutrition intake of the human body, which was positively helpful for the elderly to maintain better physical function. Secondly, the role of many nutrients in the body was affected by the existence and balance of other nutrients at the same time [44]. Therefore, only when there was rich dietary diversity, multiple nutrients could reach a balanced state, and the interaction of multiple nutrients could better promote the health of the body. For example, the intake of vitamin D, vitamin C, and vitamin K2 can help the body better absorb calcium [45] so as to protect physical function.
In order to explore which diet was more beneficial to maintain the physical function of the elderly, we further used exploratory factor analysis for dimensionality reduction. Three dietary patterns were found: fruit-egg-milk pattern, vegetable-meat-fish pattern, and condiment and tea pattern. Our study showed that the score of fruit-egg-milk pattern, vegetable-meat-fish pattern, and condiment and tea pattern were negatively correlated with the occurrence of physical function limitation after 7 years, which indicates that increasing the total dietary intake was the protective factor for the occurrence of physical function limitation. Our result was similar to the other results. Two cross-sectional studies [46,47] found an association between higher compliance with the Mediterranean diet pattern and better physical function. Another longitudinal study [48] found that for women, a healthy Nordic diet predicted better physical performance at 10-year follow-up. All three dietary pattern scores were negatively correlated with the occurrence of physical function limitation, possibly due to the prevalence of malnutrition among the elderly in China. Therefore, the elderly should be encouraged to intake more. No matter what kind of dietary pattern, more intake could better ensure energy intake and nutritional intake, which was more critical. However, it did not mean that each dietary pattern was the same. Although there were no more findings in this study, we still suggest that the elderly eat more favorable foods, such as high-quality protein, good fats, and a Mediterranean-style diet.
The aging of the elderly is multifactorial and the mechanism is very complex, which may be due to insufficient protein, chronic inflammation, and insufficient vitamins and minerals. It is beneficial for the elderly to supplement any food from different dimensions. The internal relationship between dietary patterns and physical function may be explained in the following ways: First, meat, fish, eggs, bean products, and milk products were the main sources of high-quality protein. Dietary protein was mainly responsible for muscle protein metabolism in the elderly [42], which was related to less muscle loss [49] and less impairment of physical function [40]. This suggests that adequate protein intake helps the elderly maintain good muscle function [50]. Second, milk products were the main source of calcium and vitamin D, which could reduce the risk of impaired physical function associated with osteoporosis, osteoporosis-related fractures, and decreased muscle strength [41]. Third, inflammation and oxidative stress were considered to be one of the main causes of aging, accelerating the loss of muscle and bone mass [51,52]. Fresh fruits, vegetable, mushroom, algae, tea, and garlic were important sources of antioxidants (such as vitamin C and carotene), which were related to enhancing skeletal muscle strength. Adequate intake could reduce impairment of physical function by reducing inflammatory response and oxidative stress [53]. Therefore, the combination of these nutrients with the food group could partially explain the protective association between dietary diversity, adequate intake, and physical function.
One of the strengths of this study was that our study was a 7-year cohort study, and we observed the effects of long-term dietary maintenance or dietary changes on physical function and not just a cross-sectional dietary intake. Second, the data come from CLHLS, covering 23 provinces or municipalities. These areas were different in geographical location, economic development level, public resources, and health indicators and were more representative of Chinese residents.
Several methodological limitations should be considered. The self-reported dietary intake frequency through the food frequency questionnaire was prone to recall bias. In addition, the questionnaire only had food intake frequency without food intake. The frequency might not completely match the total intake. There were only large food groups, which was not detailed enough. Finally, although we adjusted for many potential confounding factors and considered covariant changes, we cannot rule out the effects of residual and unmeasured confounding in this observational study.
5. Conclusions
In conclusion, long-term maintenance of high dietary diversity and increasing total dietary intake can help maintain good physical function of Chinese elderly. A good diet is never too late. Even if the previous dietary status is not good, as long as the elderly improve their dietary status, it will be helpful. This study provides a good evidence that a scientific diet is conducive to promoting healthy aging.
Author Contributions
Conceptualization, S.A., L.Z. and Z.Z.; methodology, S.A. and M.H.; software, S.A.; validation, C.Y. and X.H.; formal analysis, Z.Z.; investigation, S.A. and M.H.; writing—original draft preparation, S.A.; writing—review and editing, Z.Z., L.Z. and C.Y.; visualization, X.H. and R.W.; supervision, Z.Z.; project administration, Z.Z. All authors have read and agreed to the published version of the manuscript.
Funding
This research received no external funding.
Institutional Review Board Statement
This study was conducted according to the guidelines laid down in the Declaration of Helsinki, and all procedures involving research study participants were approved by the biomedical ethics committee of Peking University (IRB00001052–24713074).
Informed Consent Statement
Informed consent was obtained from all subjects involved in the study.
Data Availability Statement
The raw data supporting the conclusions of this article can be found here: https://opendata.pku.edu.cn/dataverse/CHADS (accessed on 20 March 2022).
Acknowledgments
This research uses data from the Chinese Longitudinal Healthy Longevity Survey (CLHLS). We thank the National Natural Science Foundation of China (71233001), United States Department of Health and Human Services, National Institutes of Health, National Institute on Aging (R01 AG023627), and National Basic Research Program of China (2013CB530700).
Conflicts of Interest
The authors declare no conflict of interest.
Abbreviations
| WHO | World Health Organization |
| CLHLS | Chinese Longitudinal Healthy Longevity Survey |
| BADL | Basic activities of daily living |
| IADL | Instrumental activities of daily living |
| BMI | Body mass index |
| CVD | Cardiovascular disease |
| DDS | Dietary diversity score |
| CDD | Change in dietary diversity |
| OR | Odds ratio |
| 95%CI | 95% confidence intervals |
Appendix A
Table A1.
Scoring criteria for dietary diversity.
Table A1.
Scoring criteria for dietary diversity.
| Food Group | DDS |
|---|---|
| Fresh fruit | “Every day/almost every day” = 1 “Often” = 1 “Sometimes” = 0 “Rarely or never” = 0 |
| Fresh vegetable | |
| Meat | “Almost every day” = 1 “At least once a week” = 1 “At least once a month” = 0 “Occasionally” = 0 “Rarely or never” = 0 |
| Fish | |
| Eggs | |
| Bean products | |
| Salt-preserved vegetable | |
| Sugar | |
| Garlic | |
| Milk products | |
| Nut products | |
| Mushrooms or algae | |
| Tea |
Table A2.
CDD from 2011 to 2018.
Table A2.
CDD from 2011 to 2018.
| CDD | DDS in 2011 | DDS in 2018 |
|---|---|---|
| Consistently low dietary diversity (low-low), | <7 | <7 |
| Dietary diversity get worse (high-low) | ≥7 | <7 |
| Dietary diversity get better (low-high) | <7 | ≥7 |
| Consistently high dietary diversity (high-high) | ≥7 | ≥7 |
Table A3.
Definition and score of body function.
Table A3.
Definition and score of body function.
| Independent Variable | Questions | Score Assignment |
|---|---|---|
| BADL | 1. Bathing 2. Dressing 3. Toileting 4. Indoor transferring 5. Continence 6. Feeding | Without assistance = 1 One-part assistance = 0 More than one-part assistance = 0 |
| IADL | 1. Able to go outside to visit neighbors? 2. Able to go shopping by yourself? 3. Able to make food by yourself? 4. Able to wash clothes? 5. Able to walk one kilometer? 6. Able to carry 5 kg weight? 7. Able to crouch and stand three times? 8. Able to take public transportation? | Yes = 1 A little difficult = 0 Unable to do so = 0 |
Table A4.
KMO and Bartlett’s Test.
Table A4.
KMO and Bartlett’s Test.
| Kaiser-Meyer-Olkin Measure of Sampling Adequacy | 0.806 | |
|---|---|---|
| Bartlett’s Test of Sphericity | Approx. chi-Square | 3572.241 |
| df | 78 | |
| Sig. | <0.0001 |
Table A5.
Total Variance Explained.
Table A5.
Total Variance Explained.
| Component | Rotation Sums of Squared Loadings | ||
|---|---|---|---|
| Total | % of Variance | Cumulative % | |
| 1 | 2.278 | 17.524 | 17.524 |
| 2 | 1.631 | 12.545 | 30.068 |
| 3 | 1.554 | 11.955 | 42.024 |
Extraction Method: Principal Component Analysis.
Table A6.
Dietary pattern factor load.
Table A6.
Dietary pattern factor load.
| Food Groups | Component | ||
|---|---|---|---|
| Plant-Derived Food Pattern | Animal-Derived Food Pattern | Egg and Bean Pattern | |
| Fresh fruit | 0.551 | 0.361 | −0.037 |
| Vegetable | −0.033 | 0.507 | 0.165 |
| Meat | 0.093 | 0.716 | −0.047 |
| Fish | 0.229 | 0.692 | −0.014 |
| Eggs | 0.659 | 0.019 | 0.084 |
| Food made from beans | 0.535 | 0.090 | 0.255 |
| Salt-preserved vegetable | −0.077 | 0.040 | 0.749 |
| Sugar | 0.291 | −0.061 | 0.461 |
| Garlic | 0.217 | 0.060 | 0.575 |
| Milk products | 0.738 | −0.041 | 0.017 |
| Nut products | 0.439 | 0.183 | 0.363 |
| Mushroom or algae | 0.556 | 0.244 | 0.245 |
| Tea | 0.089 | 0.373 | 0.395 |
Extraction Method: Principal Component Analysis. Rotation Method: Varimax with Kaiser Normalization.
References
- Acar Tek, N.; Karaçil-Ermumcu, M. Determinants of Health Related Quality of Life in Home Dwelling Elderly Population: Appetite and Nutritional Status. J. Nutr. Health Aging 2018, 22, 996–1002. [Google Scholar] [CrossRef] [PubMed]
- Beard, J.R.; Bloom, D.E. Towards a comprehensive public health response to population ageing. Lancet 2015, 385, 658–661. [Google Scholar] [CrossRef]
- National Bureau of Statistics. Bulletin of the Seventh National Census (No. 5)—Population Age Composition; China Statistics: Beijing, China, 2021; pp. 10–11.
- Aging Population: China’s Development Trend and Policy Options; China Development Research Foundation, China Development Press: Beijing, China, 2020.
- Qi, H. Study on Non-Communicable Diseases (NCDs) and Its Influence on Activities of Daily Living of the Elderly Rural China; Shandong University: Jinan, China, 2014. [Google Scholar]
- Cederholm, T.; Cruz-Jentoft, A.J.; Maggi, S. Sarcopenia and fragility fractures. Eur. J. Phys. Rehabil. Med. 2013, 49, 111–117. [Google Scholar] [PubMed]
- Pavasini, R.; Guralnik, J.; Brown, J.C.; di Bari, M.; Cesari, M.; Landi, F.; Vaes, B.; Legrand, D.; Verghese, J.; Wang, C.; et al. Short Physical Performance Battery and all-cause mortality: Systematic review and meta-analysis. BMC Med. 2016, 14, 215. [Google Scholar] [CrossRef] [PubMed]
- Cöster, M.E.; Karlsson, M.; Ohlsson, C.; Mellström, D.; Lorentzon, M.; Ribom, E.; Rosengren, B. Physical function tests predict incident falls: A prospective study of 2969 men in the Swedish Osteoporotic Fractures in Men study. Scand. J. Public Health 2020, 48, 436–441. [Google Scholar] [CrossRef] [PubMed]
- Lenzi, J.; Avaldi, V.M.; Rucci, P.; Pieri, G.; Fantini, M.P. Burden of multimorbidity in relation to age, gender and immigrant status: A cross-sectional study based on administrative data. BMJ Open 2016, 6, e012812. [Google Scholar] [CrossRef]
- Ha, N.T.; Le, N.H.; Khanal, V.; Moorin, R. Multimorbidity and its social determinants among older people in southern provinces, Vietnam. Int. J. Equity Health 2015, 14, 50. [Google Scholar] [CrossRef][Green Version]
- van Oostrom, S.H.; Picavet, H.S.; van Gelder, B.M.; Lemmens, L.C.; Hoeymans, N.; van Dijk, C.E.; Verheij, R.A.; Schellevis, F.G.; Baan, C.A. Multimorbidity and comorbidity in the Dutch population - data from general practices. BMC Public Health 2012, 12, 715. [Google Scholar] [CrossRef]
- Fang, E.F.; Scheibye-Knudsen, M.; Jahn, H.J.; Li, J.; Ling, L.; Guo, H.; Zhu, X.; Preedy, V.; Lu, H.; Bohr, V.A.; et al. A research agenda for aging in China in the 21st century. Ageing Res. Rev. 2015, 24, 197–205. [Google Scholar] [CrossRef]
- World Report on Ageing and Health; World Health Organization: Geneva, Switzerland, 2015.
- Van den Bussche, H.; Koller, D.; Kolonko, T.; Hansen, H.; Wegscheider, K.; Glaeske, G.; von Leitner, E.C.; Schäfer, I.; Schön, G. Which chronic diseases and disease combinations are specific to multimorbidity in the elderly? Results of a claims data based cross-sectional study in Germany. BMC Public Health 2011, 11, 101. [Google Scholar] [CrossRef]
- Ylitalo, K.R.; Karvonen-Gutierrez, C.A.; Fitzgerald, N.; Zheng, H.; Sternfeld, B.; El Khoudary, S.R.; Harlow, S.D. Relationship of race-ethnicity, body mass index, and economic strain with longitudinal self-report of physical functioning: The Study of Women’s Health Across the Nation. Ann. Epidemiol. 2013, 23, 401–408. [Google Scholar] [CrossRef] [PubMed]
- Gill, T.M.; Gahbauer, E.A.; Allore, H.G.; Han, L. Transitions between frailty states among community-living older persons. Arch. Intern. Med. 2006, 166, 418–423. [Google Scholar] [CrossRef] [PubMed]
- Ademowo, O.S.; Dias, H.K.I.; Pararasa, C.; Griffiths, H.R. Chapter 6—Nutritional Hormesis in a Modern Environment. In The Science of Hormesis in Health and Longevity; Rattan, S.I.S., Kyriazis, M., Eds.; Academic Press: Cambridge, MA, USA, 2019; pp. 75–86. [Google Scholar] [CrossRef]
- Black, M.; Bowman, M. Nutrition and Healthy Aging. Clin. Geriatr. Med. 2020, 36, 655–669. [Google Scholar] [CrossRef]
- Schwingshackl, L.; Bogensberger, B.; Hoffmann, G. Diet Quality as Assessed by the Healthy Eating Index, Alternate Healthy Eating Index, Dietary Approaches to Stop Hypertension Score, and Health Outcomes: An Updated Systematic Review and Meta-Analysis of Cohort Studies. J. Acad. Nutr. Diet 2018, 118, 74–100.e111. [Google Scholar] [CrossRef] [PubMed]
- Zhang, J.; Zhao, A. Dietary Diversity and Healthy Aging: A Prospective Study. Nutrients 2021, 13, 1787. [Google Scholar] [CrossRef] [PubMed]
- High, K.P. Micronutrient supplementation and immune function in the elderly. Clin. Infect. Dis. 1999, 28, 717–722. [Google Scholar] [CrossRef] [PubMed][Green Version]
- Ames, B.N.; Shigenaga, M.K.; Hagen, T.M. Oxidants, antioxidants, and the degenerative diseases of aging. Proc. Natl. Acad. Sci. USA 1993, 90, 7915–7922. [Google Scholar] [CrossRef]
- Michelon, E.; Blaum, C.; Semba, R.D.; Xue, Q.L.; Ricks, M.O.; Fried, L.P. Vitamin and carotenoid status in older women: Associations with the frailty syndrome. J. Gerontol. A Biol. Sci. Med. Sci. 2006, 61, 600–607. [Google Scholar] [CrossRef]
- Rizzoli, R. Management of the oldest old with osteoporosis. Eur. Geriatr. Med. 2010, 1, 15–21. [Google Scholar] [CrossRef]
- Lane, J.S.; Magno, C.P.; Lane, K.T.; Chan, T.; Hoyt, D.B.; Greenfield, S. Nutrition impacts the prevalence of peripheral arterial disease in the United States. J. Vasc. Surg. 2008, 48, 897–904. [Google Scholar] [CrossRef]
- Fairfield, K.M.; Fletcher, R.H. Vitamins for chronic disease prevention in adults: Scientific review. JAMA 2002, 287, 3116–3126. [Google Scholar] [CrossRef] [PubMed]
- Lorenzo-López, L.; Maseda, A.; de Labra, C.; Regueiro-Folgueira, L.; Rodríguez-Villamil, J.L.; Millán-Calenti, J.C. Nutritional determinants of frailty in older adults: A systematic review. BMC Geriatr. 2017, 17, 108. [Google Scholar] [CrossRef] [PubMed]
- Liang, Y.; Wu, W. Exploratory analysis of health-related quality of life among the empty-nest elderly in rural China: An empirical study in three economically developed cities in eastern China. Health Qual. Life Outcomes 2014, 12, 59. [Google Scholar] [CrossRef] [PubMed]
- Liu, H.; Jiao, J.; Zhu, C.; Zhu, M.; Wen, X.; Jin, J.; Wang, H.; Lv, D.; Zhao, S.; Wu, X.; et al. Associations Between Nutritional Status, Sociodemographic Characteristics, and Health-Related Variables and Health-Related Quality of Life Among Chinese Elderly Patients: A Multicenter Prospective Study. Front. Nutr. 2020, 7, 583161. [Google Scholar] [CrossRef]
- Kimura, Y.; Wada, T.; Ishine, M.; Ishimoto, Y.; Kasahara, Y.; Konno, A.; Nakatsuka, M.; Sakamoto, R.; Okumiya, K.; Fujisawa, M.; et al. Food diversity is closely associated with activities of daily living, depression, and quality of life in community-dwelling elderly people. J. Am. Geriatr. Soc. 2009, 57, 922–924. [Google Scholar] [CrossRef]
- Gopinath, B.; Russell, J.; Flood, V.M.; Burlutsky, G.; Mitchell, P. Adherence to dietary guidelines positively affects quality of life and functional status of older adults. J. Acad. Nutr. Diet. 2014, 114, 220–229. [Google Scholar] [CrossRef]
- Milaneschi, Y.; Bandinelli, S.; Corsi, A.M.; Lauretani, F.; Paolisso, G.; Dominguez, L.J.; Semba, R.D.; Tanaka, T.; Abbatecola, A.M.; Talegawkar, S.A.; et al. Mediterranean diet and mobility decline in older persons. Exp. Gerontol. 2011, 46, 303–308. [Google Scholar] [CrossRef]
- Haveman-Nies, A.; De Groot, L.C.; Van Staveren, W.A. Relation of dietary quality, physical activity, and smoking habits to 10-year changes in health status in older Europeans in the SENECA study. Am. J. Public Health 2003, 93, 318–323. [Google Scholar] [CrossRef]
- Robinson, S.M.; Westbury, L.D.; Cooper, R.; Kuh, D.; Ward, K.; Syddall, H.E.; Sayer, A.A.; Cooper, C. Adult Lifetime Diet Quality and Physical Performance in Older Age: Findings From a British Birth Cohort. J. Gerontol. A Biol. Sci. Med. Sci. 2018, 73, 1532–1537. [Google Scholar] [CrossRef]
- Center for Healthy Aging and Development Studies. The Chinese Longitudinal Healthy Longevity Survey (CLHLS)-Longitudinal Data (1998–2018). Peking University Open Research Data Platform. 2020. Available online: https://opendata.pku.edu.cn/dataset.xhtml?persistentId=doi:10.18170/DVN/WBO7LK (accessed on 20 March 2022). [CrossRef]
- Pashmdarfard, M.; Azad, A. Assessment tools to evaluate Activities of Daily Living (ADL) and Instrumental Activities of Daily Living (IADL) in older adults: A systematic review. Med. J. Islam. Repub. Iran 2020, 34, 33. [Google Scholar] [CrossRef]
- Chinese Longitudinal Healthy Longevity Survey. Available online: http://chads.nsd.pku.edu.cn/yjxm/zglnjkyxysgztc/index.htm (accessed on 20 March 2022).
- Zhang, J.; Zhao, A.; Wu, W.; Yang, C.; Ren, Z.; Wang, M.; Wang, P.; Zhang, Y. Dietary Diversity Is Associated With Memory Status in Chinese Adults: A Prospective Study. Front. Aging Neurosci. 2020, 12, 580760. [Google Scholar] [CrossRef] [PubMed]
- Ganpule-Rao, A.V.; Bhat, D.; Yajnik, C.S.; Rush, E. Dietary diversity scores, nutrient intakes and biomarkers vitamin B12, folate and Hb in rural youth from the Pune Maternal Nutrition Study. Br. J. Nutr. 2021, 126, 236–243. [Google Scholar] [CrossRef] [PubMed]
- Yokoyama, Y.; Nishi, M.; Murayama, H.; Amano, H.; Taniguchi, Y.; Nofuji, Y.; Narita, M.; Matsuo, E.; Seino, S.; Kawano, Y.; et al. Association of Dietary Variety with Body Composition and Physical Function in Community-dwelling Elderly Japanese. J. Nutr. Health Aging 2016, 20, 691–696. [Google Scholar] [CrossRef]
- Houston, D.K.; Stevens, J.; Cai, J.; Haines, P.S. Dairy, fruit, and vegetable intakes and functional limitations and disability in a biracial cohort: The Atherosclerosis Risk in Communities Study. Am. J. Clin. Nutr. 2005, 81, 515–522. [Google Scholar] [CrossRef] [PubMed]
- Duffy, M.E.; MacDonald, E. Determinants of functional health of older persons. Gerontologist 1990, 30, 503–509. [Google Scholar] [CrossRef] [PubMed]
- Schuette, L.K.; Song, W.O.; Hoerr, S.L. Quantitative use of the Food Guide Pyramid to evaluate dietary intake of college students. J. Am. Diet. Assoc. 1996, 96, 453–457. [Google Scholar] [CrossRef]
- Mirmiran, P.; Azadbakht, L.; Esmaillzadeh, A.; Azizi, F. Dietary diversity score in adolescents—A good indicator of the nutritional adequacy of diets: Tehran lipid and glucose study. Asia Pac. J. Clin. Nutr. 2004, 13, 56–60. [Google Scholar] [PubMed]
- Chinese population osteoporosis prevention and treatment manual 2013 Edition. In Proceedings of the 11th International Symposium on Bone Mineral Research and the 13th International Symposium on Osteoporosis, Guangzhou, China, 5 April 2013; pp. 167–216.
- Xu, B.; Houston, D.K.; Locher, J.L.; Ellison, K.J.; Gropper, S.; Buys, D.R.; Zizza, C.A. Higher Healthy Eating Index-2005 scores are associated with better physical performance. J. Gerontol. A Biol. Sci. Med. Sci. 2012, 67, 93–99. [Google Scholar] [CrossRef]
- León-Muñoz, L.M.; García-Esquinas, E.; López-García, E.; Banegas, J.R.; Rodríguez-Artalejo, F. Major dietary patterns and risk of frailty in older adults: A prospective cohort study. BMC Med. 2015, 13, 11. [Google Scholar] [CrossRef]
- Akbaraly, T.; Sabia, S.; Hagger-Johnson, G.; Tabak, A.G.; Shipley, M.J.; Jokela, M.; Brunner, E.J.; Hamer, M.; Batty, G.D.; Singh-Manoux, A.; et al. Does overall diet in midlife predict future aging phenotypes? A cohort study. Am. J. Med. 2013, 126, 411–419.e413. [Google Scholar] [CrossRef]
- Houston, D.K.; Nicklas, B.J.; Ding, J.; Harris, T.B.; Tylavsky, F.A.; Newman, A.B.; Lee, J.S.; Sahyoun, N.R.; Visser, M.; Kritchevsky, S.B. Dietary protein intake is associated with lean mass change in older, community-dwelling adults: The Health, Aging, and Body Composition (Health ABC) Study. Am. J. Clin. Nutr. 2008, 87, 150–155. [Google Scholar] [CrossRef] [PubMed]
- McGrath, R.; Stastny, S.; Casperson, S.; Jahns, L.; Roemmich, J.; Hackney, K.J. Daily Protein Intake and Distribution of Daily Protein Consumed Decreases Odds for Functional Disability in Older Americans. J. Aging Health 2020, 32, 1075–1083. [Google Scholar] [CrossRef] [PubMed]
- Domazetovic, V.; Marcucci, G.; Iantomasi, T.; Brandi, M.L.; Vincenzini, M.T. Oxidative stress in bone remodeling: Role of antioxidants. Clin. Cases Miner. Bone Metab. 2017, 14, 209–216. [Google Scholar] [CrossRef] [PubMed]
- Sui, S.X.; Williams, L.J.; Holloway-Kew, K.L.; Hyde, N.K.; Pasco, J.A. Skeletal Muscle Health and Cognitive Function: A Narrative Review. Int. J. Mol. Sci. 2020, 22, 255. [Google Scholar] [CrossRef] [PubMed]
- Welch, A.A. Nutritional influences on age-related skeletal muscle loss. Proc. Nutr. Soc. 2014, 73, 16–33. [Google Scholar] [CrossRef] [PubMed]

Publisher’s Note: MDPI stays neutral with regard to jurisdictional claims in published maps and institutional affiliations. |
© 2022 by the authors. Licensee MDPI, Basel, Switzerland. This article is an open access article distributed under the terms and conditions of the Creative Commons Attribution (CC BY) license (https://creativecommons.org/licenses/by/4.0/).