Article

Sanguisorba officinalis L. Ameliorates Hepatic Steatosis and Fibrosis by Modulating Oxidative Stress, Fatty Acid Oxidation, and Gut Microbiota in CDAHFD-Induced Mice

1
Division of Bio-Medical Science and Technology, KIST School, University of Science and Technology (UST), Seoul 02792, Republic of Korea
2
Smart Farm Research Center, Korea Institute of Science and Technology (KIST), Gangneung 25451, Republic of Korea
3
Natural Product Research Center, Korea Institute of Science and Technology (KIST), Gangneung 25451, Republic of Korea
4
Department of Convergence Medicine, Wonju College of Medicine, Yonsei University, Wonju 26493, Republic of Korea
5
Natural Product Informatics Research Center, Korea Institute of Science and Technology (KIST), Gangneung 25451, Republic of Korea
*
Author to whom correspondence should be addressed.
These authors contributed equally to this work.
Nutrients 2023, 15(17), 3779; https://doi.org/10.3390/nu15173779
Submission received: 31 July 2023 / Revised: 19 August 2023 / Accepted: 28 August 2023 / Published: 29 August 2023

Abstract

:
Non-alcoholic fatty liver disease (NAFLD) is a leading cause of chronic liver diseases and encompasses non-alcoholic steatosis, steatohepatitis, and fibrosis. Sanguisorba officinalis L. (SO) roots have traditionally been used for their antioxidant properties and have beneficial effects on metabolic disorders, including diabetes and obesity. However, its effects on hepatic steatosis and fibrosis remain unclear. In this study, we explored the effects of a 95% ethanolic SO extract (SOEE) on NAFLD and fibrosis in vivo and in vitro. The SOEE was orally administered to C57BL/6J mice fed a choline-deficient, L-amino-acid-defined, high-fat diet for 10 weeks. The SOEE inhibited hepatic steatosis by modulating hepatic malondialdehyde levels and the expression of oxidative stress-associated genes, regulating fatty-acid-oxidation-related genes, and inhibiting the expression of genes that are responsible for fibrosis. The SOEE suppressed the deposition of extracellular matrix hydroxyproline and mRNA expression of fibrosis-associated genes. The SOEE decreased the expression of fibrosis-related genes in vitro by inhibiting SMAD2/3 phosphorylation. Furthermore, the SOEE restored the gut microbial diversity and modulated specific bacterial genera associated with NAFLD and fibrosis. This study suggests that SOEE might be the potential candidate for inhibiting hepatic steatosis and fibrosis by modulating oxidative stress, fatty acid oxidation, and gut microbiota composition.

1. Introduction

Non-alcoholic fatty liver disease (NAFLD) is a leading cause of chronic liver diseases, with an estimated worldwide prevalence of 32.4% [1]. Moreover, its prevalence has increased over time, from 25.5% in 2005 to 37.8% in 2016 [2]. NAFLD is characterized by the excessive accumulation of lipids in hepatocytes that was not due to alcohol consumption [3]. It is defined as fat deposition in the hepatocytes with a lipid content > 5% on biopsy [4]. NAFLD is a group of diseases that encompasses non-alcoholic fatty liver (NAFL) and non-alcoholic steatohepatitis (NASH), which is classified as a progressive NAFLD that can progress to fibrosis and cirrhosis, and in some cases, hepatocellular carcinoma (HCC). About 30–40% of NAFLD patients progress to NASH, and 30–45% of NASH patients progress to liver fibrosis, increasing the morbidity of cirrhosis and HCC [5]. Despite the increasing prevalence of NAFLD, no FDA-approved medications for NAFLD are available.
Various studies on NAFLD, including those investigating NAFLD progression, drug efficacy, and associated molecular mechanisms, have been conducted using diet-induced animal models [6]. A common diet-induced model used in NAFLD studies is the methionine- and choline-deficient (MCD) diet [7,8,9]. An MCD diet induces NAFLD and fibrosis by inhibiting hepatic fatty acid oxidation and increasing circulatory very low-density lipoprotein (VLDL) levels [10]. However, MCD diet models induce cirrhotic weight loss and cachexia, which are not the hallmarks of NAFLD in humans [11]. A high-fat, high-fructose, high-cholesterol (HFFC) diet results in steatosis, NASH, and fibrosis. However, an HFFC diet requires at least six months of intake to induce hepatic steatosis and fibrosis [12]. A choline-deficient, L-amino-acid-defined (CDAA) diet-induced model overcomes weight loss challenges and effectively develops NAFLD and fibrosis [13]. In addition, a choline-deficient, L-amino-acid-defined, high-fat diet (CDAHFD) leads to liver fibrosis progression within a short period in a diet-induced NAFLD mouse model, which is potentially useful for mimicking human NAFLD [6,9]. Previous studies used CDAHFD to induce NAFLD and fibrosis and confirmed the efficacy of drugs and natural products [14,15].
Sanguisorba officinalis L. (SO) is a perennial plant found in Asia. The root of SO has been established as a traditional medicinal plant in Korea to treat hemostasis, burns, and inflammation [16,17]. Moreover, various studies reported the bioactivities of SO roots, including anti-inflammatory, antioxidant, and anti-obesity activities [18,19,20]. Among the compounds derived from the roots of SO are triterpenoids and phenolic acids, such as gallic acid, catechin, ziyuglycoside I (ZG1), and ziyuglycoside II (ZG2) [21,22]. Specifically, ZG1 and ZG2, which exhibit anti-inflammatory and anticancer effects, were exclusively found in the roots of SO [22,23,24]. Despite the physiological activity of the SO root and its derived compounds, their effects on hepatic steatosis and fibrosis have not yet been investigated. In this study, the bioactive effects of SO root 95% ethanol extract (SOEE) were investigated to determine its potential therapeutic effects against hepatic steatosis and fibrosis in CDAHFD-fed mice.

2. Materials and Methods

An extended methods section is available in the Supplementary Materials.

2.1. Plant Materials and Extraction

Dried roots of SO were collected from China in November 2020 and purchased from a commercial market (Samhong, Gyunggi-do, Republic of Korea) in South Korea. Plant identification was confirmed by Professor Dae Sik Jang of Kyung Hee University (Seoul, Republic of Korea). The SO roots were dried and crushed into a powder. Powdered SO roots (50 g) were extracted with 500 mL of 95% ethanol for 72 h at room temperature on an orbital shaker and filtered through filter paper (GE Healthcare, Chicago, IL, USA). A rotary evaporator was used to evaporate the solvent in the SOEE under reduced pressure (Buchi, Flawil, Switzerland) to eliminate the solvent. The chromatogram of SOEE and standard compounds (ZG1, ZG2, and gallic acid) (Figure S1), chemical analysis information (Tables S1–S3), and quantification of each compound (ZG1, ZG2, and gallic acid) (Table S4) are shown in the Supplementary Materials.

2.2. Cell Culture

The LX-2 cell line was obtained from the American Type Culture Collection (Manassas, VA, USA). The cells were cultured using Dulbecco’s Modified Essential Medium (Welgene, Gyeongsan-si, Gyeongsangbuk-do, Republic of Korea) supplemented with heat-inactivated fetal bovine serum (10%) (Gibco, Grand Island, NY, USA) and penicillin-streptomycin (1%) (Hyclone, Logan, UT, USA) and incubated at 37 °C in 5% CO2.

2.3. Animal Experiment

Four-week-old C57BL/6J male mice were purchased from Daehan Biolink Inc. (Eumseong, Chungcheongbuk-do, Republic of Korea) and acclimated for 2 weeks. The mice were maintained in a controlled environment facility (23 ± 0.5 °C, 60% humidity) with a 12/12 h light/dark cycle. After adaptation, the mice were divided into five feeding groups: control diet group (control, n = 10), CDAHFD (A06071302, Research Diets Inc., New Brunswick, NJ, USA) group (CDAHFD group, n = 10), CDAHFD treated with 15 mg/kg/day obeticholic acid (Medchemexpress, Princeton, NJ, USA) (15 mg/kg/day) (OCA group, n = 10), CDAHFD treated with the SOEE (25 mg/kg/day) (SO25 group, n = 10), and CDAHFD treated with the SOEE (100 mg/kg/day) (SO100 group, n = 10). The SOEE dosage was determined by referring to previous reports on metabolic diseases [20]. Doses of 25 and 100 mg/kg/day of SOEE in mice are equivalent to 121.6 and 486.5 mg, respectively, of SOEE in humans (60 kg) [25]. The OCA and SOEE were dissolved in 0.5% carboxymethyl cellulose solution. Each treatment was administered daily via oral gavage for 10 weeks. One day before the mice were sacrificed, feces were collected from each mouse. After 10 weeks, the mice were sacrificed and plasma and liver tissues were collected and stored at −80 °C for biological analysis. An overview of the experimental design is shown in Figure S2.

2.4. Biochemical Analysis

The plasma levels of alanine aminotransferase (ALT) (Cat. E-BC-K235-S), aspartate aminotransferase (AST) (Cat. E-BC-K236-M), TG (Cat. E-BC-K238), and total cholesterol (TC) (Cat. E-BC-K109-M) were quantified using kits from Elabscience (Houston, TX, USA). TG, TC, malondialdehyde (MDA) (Cat. E-BC-K025-M), and hydroxyproline (Cat. E-BC-K062-S) levels in the liver tissues were measured using kits from Elabscience (USA). All experiments were performed according to the manufacturer’s instructions.

2.5. Histological Examination

The right lobe of the liver from each mouse was collected, fixed, and stained for histological examination. A detailed description of the methods is given in the Supplementary Materials.
To evaluate the NAFLD activity score (NAS), the scores of various histological features, such as steatosis, ballooning, and inflammation, were computed using a pre-trained convolutional neural network (CNN) [26]. Briefly, high-magnification image tiles in two dimensions (299 × 299 px2) were prepared using a Zeiss AxioCam MRc5 (Carl Zeiss, Jena, Germany) microscope with 125× magnification and 0.44 µm/px of pixel resolution under bright field illumination [26]. Image tiles were quantified and described using an automated “Kleiner score” [27] of steatosis (0–3), ballooning (0–2), and inflammation (0–3) and then summed up to give the NAS [26]. NAS was evaluated based on H&E-stained liver sections using a CNN.

2.6. Quantitative Reverse Transcription–Polymerase Chain Reaction (qRT-PCR)

Total RNA was extracted from liver tissue and LX-2 cells and complementary DNA (cDNA) was synthesized. qRT-PCR was performed using gene-specific primers (Table 1). Detailed information is described in the Supplementary Materials.

2.7. Western Blotting

To determine the protein expression levels, cell lysates were harvested and centrifuged to obtain proteins. The primary antibodies used were anti-rabbit SMAD2/3, phosphor-SMAD2/3, and glyceraldehyde-3-phosphate dehydrogenase (GAPDH). Goat anti-rabbit IgG antibody (horseradish peroxidase (HRP)-conjugated) was used as the secondary antibody. Detailed information and methods are described in the Supplementary Materials.

2.8. 16S rRNA Gene Sequencing of the Bacterial Community in Feces

One day before sacrifice, fecal samples were collected, homogenized via mechanical lysis using bead beating, and DNA was extracted. To amplify the V3–V4 hypervariable region of the 16S rRNA gene, PCR was performed using the universal primer set 341F and barcoded 806R. Samples were sequenced on a MiSeq platform and raw sequencing data were analyzed using the QIIME2-DADA2 pipeline [28,29]. Detailed information and methods are described in the Supplementary Materials.

2.9. Statistical Analysis

All results are presented as the mean ± standard error (SEM). Statistical differences between groups were evaluated using one-way analysis of variance (ANOVA) and Tukey’s post hoc multiple comparison test using R software (v.4.1.2.). A p-value < 0.05 was considered statistically significant. Spearman’s correlation was used to correlate the phenotypes and abundances of the microbial taxa. The p-values were adjusted using the Benjamini–Hochberg (BH) false discovery rate (FDR) procedure [30], and the correlation coefficients and adjusted p-value were visualized using the “heatmap” package [31].

3. Results

3.1. Effects of SOEE on Plasma Lipid Profiling and Liver Injury Markers in CDAHFD-Fed Mice

To explore the effects of the SOEE on NAFLD and fibrosis in vivo, male mice were fed a CDAHFD for 10 weeks to develop NAFLD and fibrosis and then orally administered 25 or 100 mg/kg/day of SOEE. OCA (15 mg/kg/day, farnesoid X Receptor agonist) was used as the positive control. First, the circulating levels of ALT and AST, which are liver injury markers, were examined to determine the effects of the SOEE on the liver. The levels of ALT and AST were significantly elevated in the CDAHFD group; however, the SOEE treatment did not significantly reduce these levels (Table 2). In contrast, the OCA administration increased the levels of these liver injury markers.
The TG levels in the plasma increased in the CDAHFD group, whereas it was significantly decreased by the OCA and SOEE administration (p < 0.05) (Table 2). However, the TC levels were lower in the CDAHFD group than in the control group, and the administration of OCA and SOEE did not result in significant alterations.

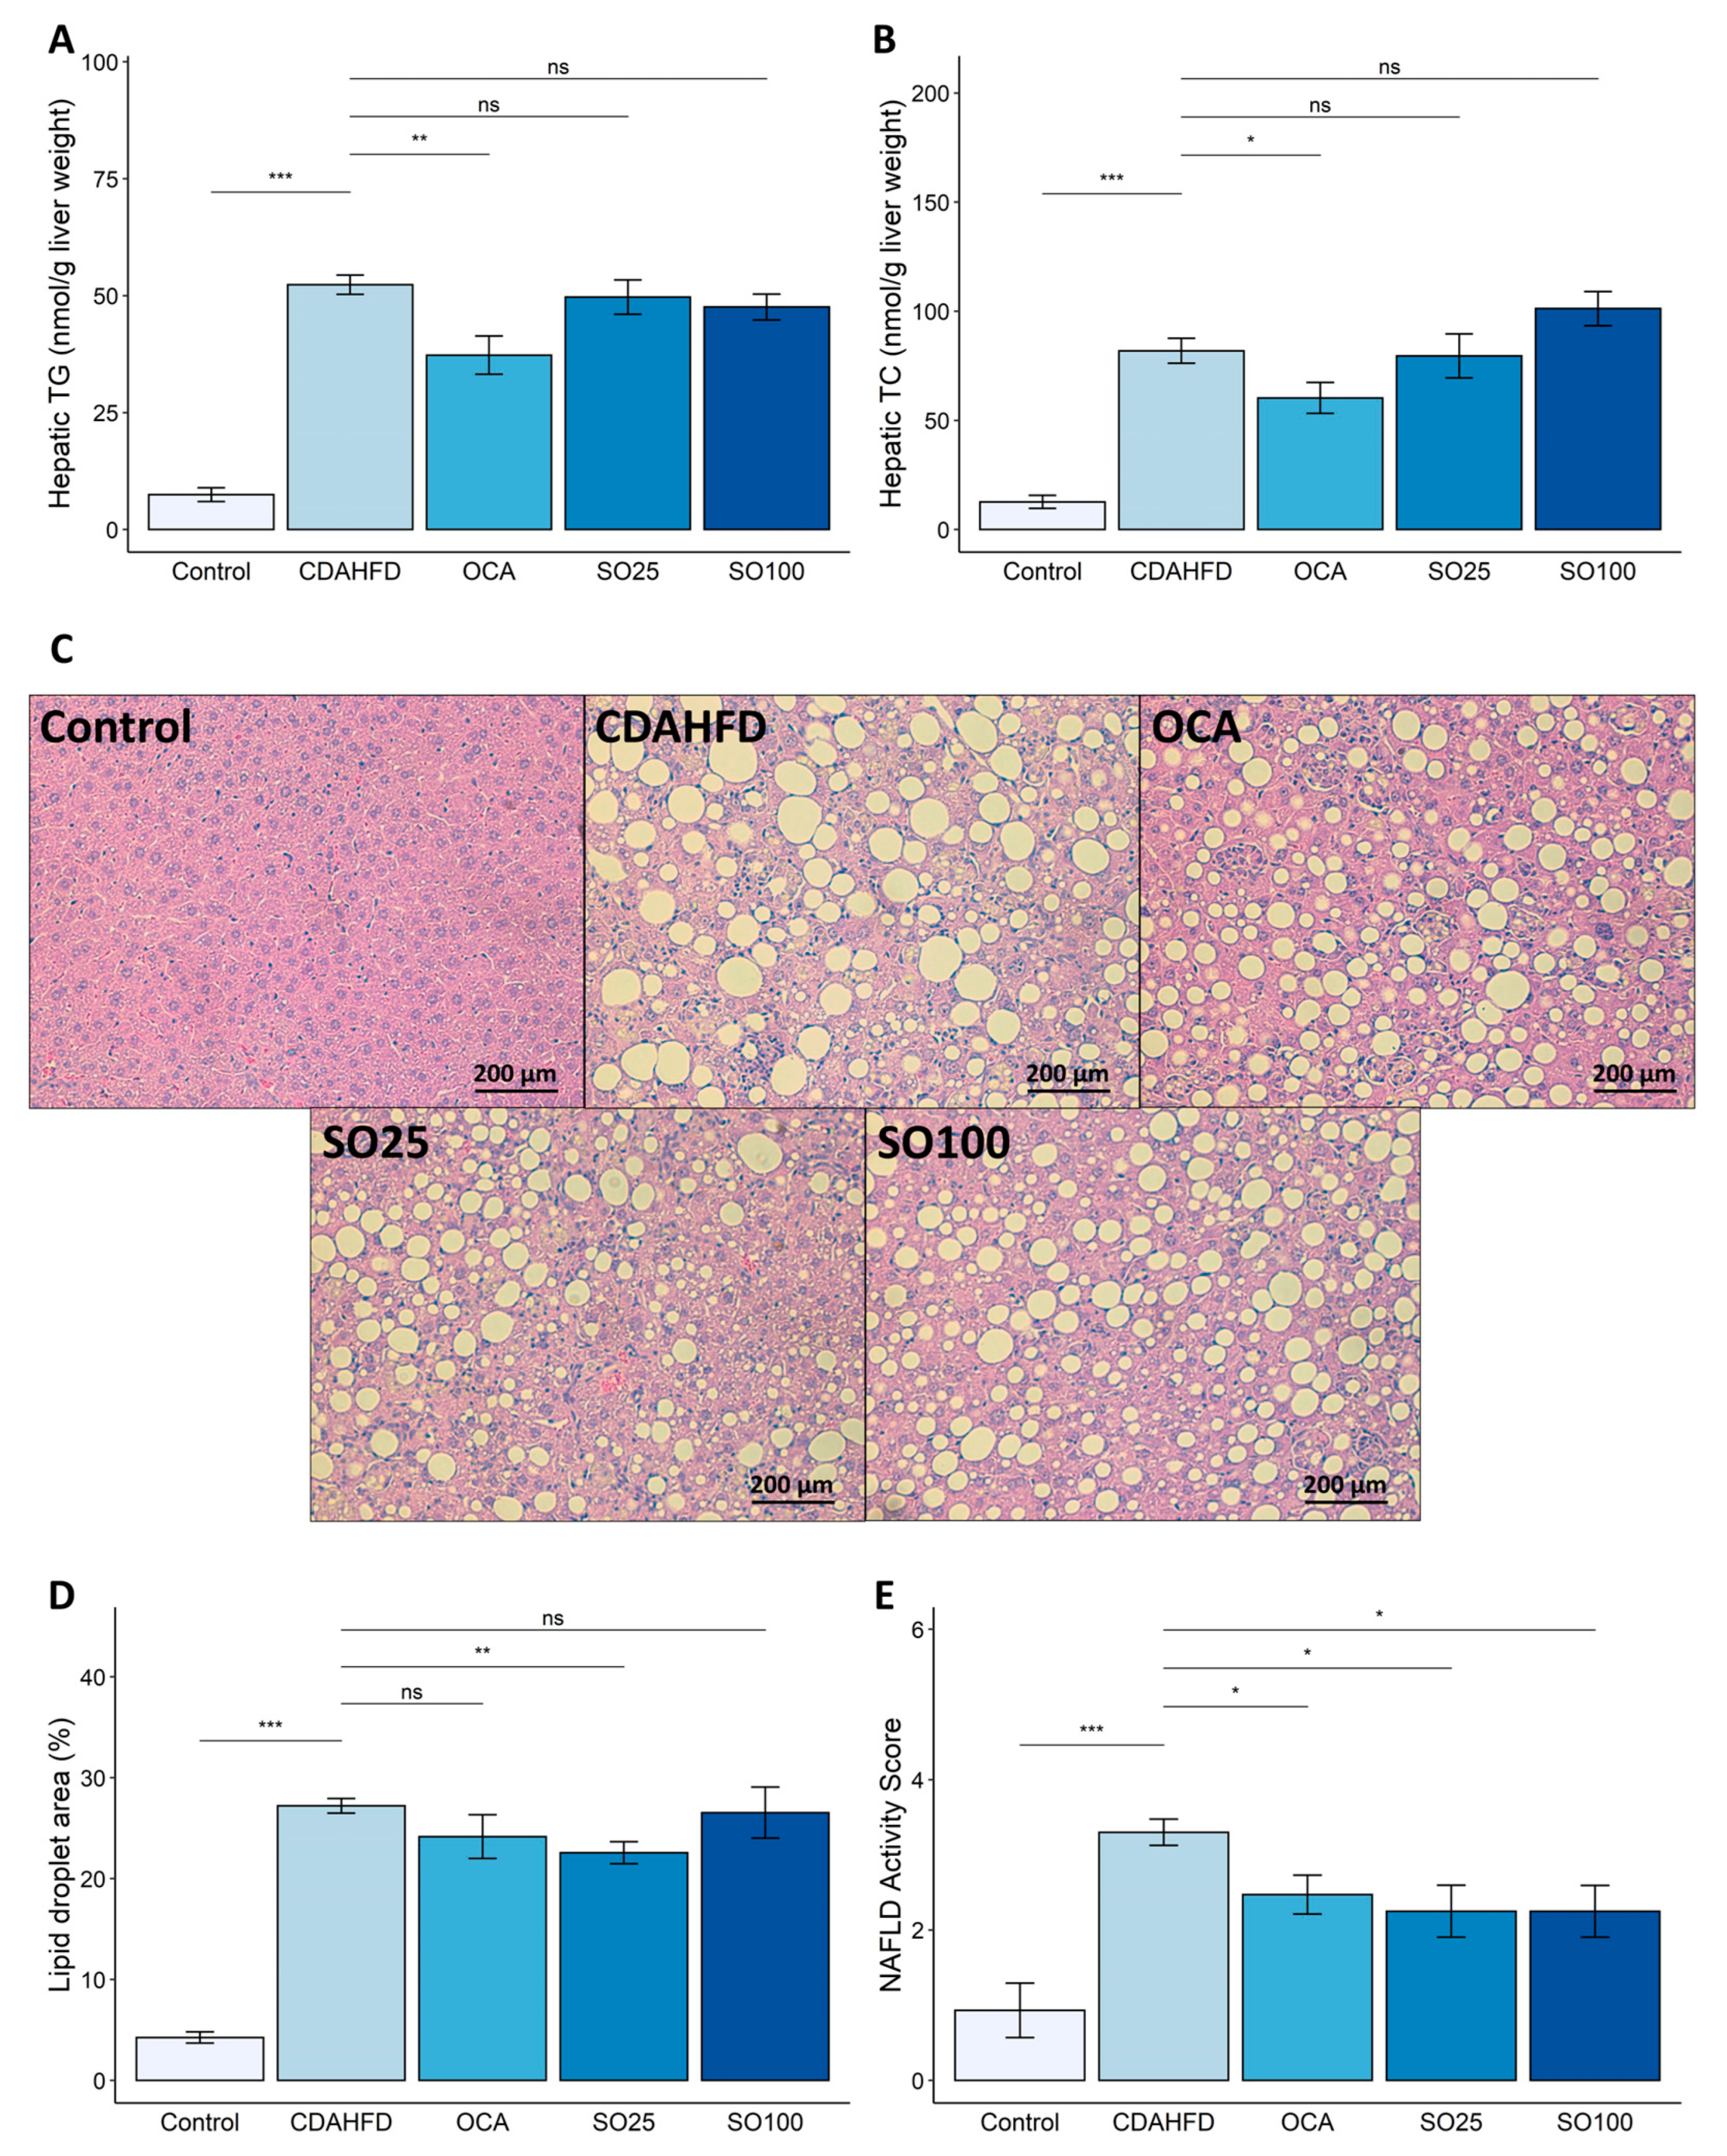
3.2. Effect of SOEE on NAFLD-Related Traits in CDAHFD-Fed Mice

To determine fat depositions in the liver, which indicates NAFLD severity, we measured the hepatic TG and TC levels. The CDAHFD significantly increased the TG and TC content in the liver. The administration of OCA significantly decreased the hepatic TG and TC levels; however, the SOEE treatment did not significantly reduce the hepatic TG and TC contents (Figure 1A,B).
Histological analysis of the liver was performed to evaluate whether the SOEE inhibited hepatic lipid accumulation in the CDAHFD-fed mouse model. H&E-stained liver sections from each group were subjected to morphological analysis (Figure 1C). To compare the level of lipid accumulation in histological analysis with that in colorimetric analysis, the lipid droplet size was quantified. In the H&E-stained liver tissues, lipid accumulation was significantly higher in the CDAHFD group than in the control group (Figure 1C). The surfaces of the lipid droplets were quantified using ImageJ software (v.1.53k, NIH, USA) and showed a significant increase in lipid accumulation in the CDAHFD group compared with that in the control group (Figure 1D). In addition, treatment with the SOEE reduced the surface area of hepatic lipid droplets; however, the diminution of lipid accumulation was not observed significantly in the SO100 group.
The NAFLD activity score (NAS) was determined using a CNN model. Increased NAS levels were observed in the CDAHFD-fed mice; however, the OCA and SOEE treatments significantly reduced the NAS levels (Figure 1E). The reduction in hepatic steatosis induced by the SOEE was confirmed via various histopathological analyses.

3.3. Effects of SOEE on Oxidative-Stress- and Fatty-Acid-Oxidation-Related Markers in the Liver of CDAHFD-Fed Mice

In addition to lipogenesis, multiple parallel hits involving oxidative stress and fatty acid oxidation are involved in NAFL progression [32,33,34,35]. The hepatic levels of MDA, a lipid peroxidation marker, were higher in the CDAHFD group than in the control group. The SOEE treatment significantly reduced MDA levels (p < 0.05) (Figure 2A). Furthermore, the expression of antioxidant enzymes, such as catalase (Cat), superoxide dismutase 1 (Sod1), and glutathione peroxidase I (Gpx1), which inhibit hepatic MDA production [36], was decreased in the CDAHFD group. In contrast, the SOEE treatment significantly increased the mRNA expression of antioxidant enzymes (Figure 2B–D). These results suggest that the SOEE alleviated the progression of hepatic steatosis by inhibiting oxidative stress.
PPARα target genes are involved in fatty acid oxidation in highly oxidative tissues, such as the liver, heart, and muscle [37]. Activation of PPARα induces the transcription of various fatty-acid-oxidation-related genes in the mitochondria, peroxisomes, and cytochromes, thereby reducing liver lipid levels [38,39]. Ppara expression was significantly lower in the CDAHFD group than in the control group (p < 0.05) and was recovered in the SOEE-treated group (p < 0.001) (Figure 2E). Moreover, mRNA expression of Cpt1a, one of the fatty-acid-oxidation-related genes in NASH [40], was increased in the SOEE-treated group (Figure 2F). Lipoprotein lipase (Lpl) plays a role in the decomposition of VLDL, which discharges TG outside the liver [41]. In this study, the OCA and SOEE treatments reduced the expression of Lpl, which was increased by the CDAHFD (p < 0.05) (Figure 2G), indicating that SOEE administration may attenuate the progression of hepatic steatosis.

3.4. Effects of SOEE on Hepatic Fibrosis in CDAHFD-Fed Mice

NAFLD encompasses a wide range of clinical phenotypes, including hepatic steatosis, NASH, and fibrotic NASH [42]. Histological and biochemical analyses were performed to determine the effect of the SOEE on the progression of NASH to fibrosis. Fixed liver sections were stained with Sirius Red (Figure 3A) and analyzed to quantify the fibrotic area. The Sirius-Red-stained area was significantly larger in the CDAHFD-fed mice. In contrast, the Sirius-Red-stained areas were markedly decreased (~60%) in the SO100 group (Figure 3B). In addition, the SOEE treatment inhibited liver fibrosis by reducing hydroxyproline levels, which increased with the progression of liver fibrosis (Figure 3C) [43].
The expression levels of various fibrosis-related genes were measured to estimate the occurrence of liver fibrosis. Alpha-smooth muscle actin (Acta2) mRNA expression was not significantly increased by the CDAHFD; however, the SO25 treatment reduced (p < 0.05) Acta2 expression (Figure 3D). In addition, the expression of collagen type I alpha 1 (Col1a1), collagen type III alpha 1 (Col3a1), and transforming growth factor beta 1 (Tgfb1) was significantly reduced (p < 0.01) in the OCA, SO25, and SO100 groups compared with the CDAHFD group (Figure 3E–G). These results suggest that the SOEE treatment attenuated fibrosis progression by effectively inhibiting the CDAHFD-induced expression of fibrosis-related genes.

3.5. Effects of SOEE on Fibrosis-Related Gene Expression and Signaling Pathway in LX-2 Cells

Next, we investigated the mechanism by which SOEE inhibited liver fibrosis in TGF-β1-induced LX-2 hepatic stellate cells (HSCs). LX-2 cells were treated with 5 ng/mL of TGF-β1 and the SOEE, and qRT-PCR was performed to confirm the inhibitory effect of the SOEE on fibrosis. First, LX-2 cells were treated with various concentrations of the SOEE (1, 5, or 10 μg/mL) in the presence of TGF-β1 (5 ng/mL). The SOEE significantly reduced the mRNA expression levels of fibrosis-related genes (ACTA2, COL1A1, COL3A1, and TIMP1), which were increased by the TGF-β1 treatment (p < 0.01) (Figure 4A–D). These results suggest that the SOEE had a fibrosis-inhibitory effect on HSCs and alleviated hepatic steatosis and fibrosis progression. TGF-β is a profibrogenic cytokine that primarily activates the SMAD signaling pathway [44,45]. Therefore, we hypothesized that SOEE inhibits the TGF-β signaling pathway during HSC activation and fibrosis. To determine the inhibitory effect of the SOEE on the SMAD signaling pathway, the phosphorylated form of SMAD was confirmed. Phosphorylation of SMAD2/3 was highly increased in the TGF-β1 treatment group, and the SOEE treatment significantly reduced the phosphorylation (Figure 4E,F). These results suggest that the SOEE inhibited liver fibrosis by inhibiting the phosphorylation of the key transcription factor SMAD2/3 in HSCs.

3.6. Effects of SOEE on the Diversity and Composition of the Gut Microbiota

Increasing evidence suggests that the gut microbiota–liver axis plays a significant role in NAFLD/NASH, particularly in cases of fibrosis [46,47]. The 16S rRNA gene amplicon sequencing analysis of mouse fecal samples allowed us to evaluate whether the ameliorative effect of the SOEE was related to gut microbiota modulation. Analysis of the microbial diversity and differential abundance of taxa demonstrated that the CDAHFD influenced the composition and diversity of the gut microbiome. The alpha diversity index based on the Shannon metric, Faith’s PD, and the observed amplicon sequence variant (ASV) show that diversity increased in the CDAHFD group, whereas it was significantly reduced by the SOEE or OCA treatment (Figure 5A–C). To determine the microbial genera showing differential abundances between the CDAHFD and SOEE groups, we compared the microbial compositions of the two groups. The ANOVA results reveal that several bacteria, including Butyricicoccus, Acetivibrio ethanolgignens, and Lactobacillus, were differentially abundant between the control and CDAHFD groups (Figure 5D–F); the abundance of these genera was significantly altered by the SOEE treatment. Furthermore, the abundances of Butyricicoccus and Acetivibrio ethanolgignens were lower in the SOEE group than in the CDAHFD group and were positively correlated with NAFLD/fibrosis-related traits, whereas the abundance of Lactobacillus was increased in the SOEE group and was negatively correlated with NAFLD/fibrosis-related traits (Figure 5G).

4. Discussion

Previously reported candidates for the treatment of NAFLD, namely, OCA, elafibranor (GFT505), and lanifibranor (IVA337), were shown to improve some features of NAFLD. However, all candidates affected only a fraction of the “multiple hit” characteristic of NAFLD [48,49,50]. Candidate drugs consist of only one or two complex compounds. In contrast, natural products contain various active compounds that are effective in controlling multiple hits, which are beneficial for complex diseases. Therefore, studying the therapeutic effects of natural products and their mechanisms of action in NAFLD may be a useful strategy for the discovery of NAFLD therapeutics. SOEE was selected as a candidate compound for NAFLD inhibition using a plant extract library. To the best of our knowledge, this is the first report of SOEE as a potential candidate for NAFLD treatment, including the inhibition of fibrosis.
Many animal models have been developed using various diets [9]. Diet-induced NAFLD models, including MCD-, HFHF-, HFFC-, and CDAA-diet-induced models, were reported in various studies. Each model has disadvantages, such as severe weight loss. To effectively induce NAFLD and fibrosis and mimic human physiology, we used a CDAHFD-induced NAFLD model in this study. The effects of SOEE on NAFLD were assessed in a CDAHFD-fed mouse model and in vitro using HSCs. Several conclusions were drawn from this study. SOEE inhibited NAFLD by modulating biomarkers related to oxidative stress and fatty acid oxidation in CDAHFD-fed mice. In addition, SOEE suppressed the expression of fibrosis-related biomarkers in CDAHFD-fed mice and inhibited HSC activation by regulating SMAD signaling. Third, SOEE altered the gut microbial diversity and modulated the abundance of bacterial genera correlated with hepatic steatosis and fibrosis.
Previously, the pathogenesis of NAFLD was proposed as a “two-hit” process [51]. Recently the “multiple parallel hit” hypothesis by complex factors was reported. This hypothesis suggests that various factors, such as steatosis, the microbiome, fatty acid oxidation, and endoplasmic reticulum stress, influence the pathogenesis of NASH [32,33,34,35]. Hepatic lipid peroxidation is also associated with NAFLD [52]. MDA is a representative marker of oxidative stress and is formed via the degeneration of polyunsaturated lipids [53]. In our study, hepatic lipid accumulation occurred in the CDAHFD group, and the quantification of lipid droplets in H&E-stained liver section slides and calculation of NAS using a CNN model confirmed the reduction in steatosis using the SOEE. This analysis was particularly significant because we used a CNN to objectively assess NAS and confirm that the SOEE administration reduced hepatic steatosis. Moreover, hepatic MDA levels were significantly reduced in SOEE treatment groups. CAT, SOD, and GPX1 play crucial roles as antioxidants against reactive oxygen species [36]. The effects of CAT were determined in a Cat-/- mouse model [54]. The CDAHFD reduced the mRNA expression of Gpx1, Sod, and Cat, whereas the SOEE treatment increased their expression compared with the control levels. Furthermore, the SOEE increased the Ppara levels and suppressed Lpl expression in the liver. Increased LPL production prevents TG release from the liver [55]. In addition, PPARα regulates fatty acid transport and mitochondrial β-oxidation [56]. The influence of PPARα on inflammation and hepatic steatosis was demonstrated in a PPAR-/- mouse model [57]. As these biomarkers are associated with fatty acid oxidation and oxidative stress, SOEE treatment may inhibit NAFLD progression by regulating fatty acid oxidation and oxidative stress.
NAFLD is a chronic inflammatory condition in which HSCs are transformed into myofibroblasts. The activation of HSCs is the most important factor in hepatic fibrosis [58]. Liver fibrosis progresses owing to HSC activation [59]. HSCs play important roles in liver physiology and fibrogenesis [60]. HSC activation leads to the excessive precipitation of the extracellular matrix (ECM) collagen [61]. ECM precipitation is consistent with the increase in hydroxyproline levels [62]. Moreover, collagen is a structural ECM protein, and its deposition results in increased mRNA levels of fibrosis-related genes, including Col1a1, and Col3al [63]. Liver fibrosis was dramatically increased in the CDAHFD-fed groups, as confirmed by fibrosis-related gene expression and histopathological analyses. The SOEE treatment significantly reduced the area of fibrosis. The level of hydroxyproline, which is an indicator of fibrosis severity, also decreased in the SO100 group. Furthermore, the SOEE significantly reduced the mRNA levels of liver-fibrosis-related genes, which were increased by the CDAHFD. Thus, the SOEE suppressed HSC activation and prevented ECM and collagen deposition.
To investigate the mechanism by which SOEE inhibits fibrosis in HSCs, liver fibrosis-related mechanisms and mRNA levels were examined in LX-2 cells. HSC activation is induced by various factors, including signaling pathway regulation, metabolic regulation, epigenetic regulation, and extracellular stimuli. TGF-β is typically the most potent factor in liver fibrosis [44,45]. For investigating the activation of HSCs, LX-2 cells were treated with TGF-β1. qRT-PCR revealed the anti-fibrotic effects of the SOEE. The SOEE markedly decreased the fibrosis-related mRNA expression in TGF-β1-treated LX-2 cells. In particular, the mRNA expression of COL1A1 was dramatically suppressed by the SOEE. TGF-β receptor binding to TGF-β is known to induce the phosphorylation of SMAD2/3 proteins. During HSC activation, SMAD2/3 promotes the transcription of collagen types 1 and 3 [64,65]. The SOEE inhibited SMAD2/3 phosphorylation in TGF-β1-induced LX-2 cells. Natural products inhibit liver fibrosis by inhibiting SMAD2/3 [66,67]. In this study, SOEE effectively inhibited the phosphorylation of SMAD2/3 in HSCs to reduce liver fibrosis.
The SOEE increased the abundance of probiotics, such as Lactobacillus, which was negatively correlated with hepatic-steatosis- and fibrosis-related markers. Lactobacillus is a genus of lactic-acid-producing bacteria that has positive effects on gut microbiota and host health. In a clinical trial, probiotic agents, including Lactobacillus acidophilus, Lactobacillus rhamnosus, and Lactobacillus paracasei, significantly improved body weight and intrahepatic fat in patients with NAFLD [68]. In mouse models, L. rhamnosus, Lactobacillus sakei, L. acidophilus, Lactobacillus fermentum, and Lactobacillus plantarum significantly reduce hepatic lipid accumulation, inflammation, and plasma lipid profiles in a high-fat-diet-induced mouse model of NAFLD [69,70,71,72]. Lactobacillus casei supplementation reduces liver inflammation, fibrosis, and oxidative stress in rats with MCD-induced NASH [73]. Lactobacillus may modulate gut microbiota, reduce endotoxin levels, decrease inflammation, and improve gut barrier function, which may contribute to its therapeutic effects against NAFLD, NASH, and liver fibrosis. Therefore, SOEE combined with Lactobacillus spp., as a dietary supplement, may be a promising therapeutic strategy for the treatment of hepatic steatosis and fibrosis. In addition, CDAHFD mice showed an increase in the relative abundance of harmful bacteria at the genus level, including Acetivibrio ethanolgignens, Roseburia, Rikenellaceae RC9 gut group, and Butyricicoccus, compared with the control group, and all of these bacteria were significantly reduced after the SOEE treatment. Furthermore, A. ethanolgignens, Roseburia, and Butyricicoccus were positively correlated with hepatic-steatosis- and fibrosis-related markers. A. ethanolgignens mediates liver inflammation and causes abnormal lipid metabolism [74]. Roseburia, which is a member of the Lachnospiraceae family, is abundant in patients with NAFLD [75]. The interaction between the gut microbiota and host is complex and variable, and SOEE can increase the relative abundance of beneficial bacteria and reduce the abundance of harmful bacteria, thereby inhibiting the development of hepatic steatosis and fibrosis.

5. Conclusions

In conclusion, hepatic steatosis and fibrosis were observed in the CDAHFD-induced NAFLD mouse model, and the SOEE improved oxidative stress and fatty-acid-oxidation-related factors. The SOEE markedly decreased the expression of fibrosis-related markers and inhibited the phosphorylation of SMAD2/3. Finally, we showed that the SOEE altered gut microbial diversity and composition, which are associated with hepatic steatosis and fibrosis. Thus, the SOEE, which inhibits hepatic steatosis and fibrosis by modulating oxidative stress, fatty acid oxidation, and gut microbiota, may be a potential natural therapeutic agent against NAFLD.

Supplementary Materials

The following supporting information can be downloaded from https://www.mdpi.com/article/10.3390/nu15173779/s1: Figure S1. HPLC chromatograms of (A) 95% ethanol extract of Sanguisorba officinalis L. (SOEE) at 203 nm, (B) standard of ziyuglycoside I and II (203 nm), (C) HPLC chromatograms of SOEE at 280 nm, and (D) standard gallic acid (280 nm); Figure S2. Experimental design of CDAHFD-induced mouse model; Table S1. HPLC conditions for the analysis of SOEE and standards of ziyuglycoside I and II; Table S2. HPLC conditions for the analysis of SOEE and gallic acid standard; Table S3. Calibration data for ziyuglycoside I and II and gallic acid; Table S4. Ziyuglycoside I, ziyuglycoside II, and gallic acid content in SOEE.

Author Contributions

Conceptualization, Y.N. and M.K.; methodology, Y.N., M.K. and S.E.; formal analysis, Y.N., M.K. and S.E.; microbiome analysis, M.K. and K.H.C.; HPLC analysis, D.H.R. and H.Y.K.; genomic identification, S.H.L. and J.H.J.; writing—original draft, Y.N.; writing—review and editing, M.K. and C.W.N.; supervision, C.W.N.; funding acquisition, C.W.N. All authors have read and agreed to the published version of the manuscript.

Funding

This research was supported by the Korea Institute of Science and Technology Intramural Research grant (2Z06720).

Institutional Review Board Statement

The animal experiment was approved by the Institutional Animal Care and Use Committee of the Korea Institute of Science and Technology (KIST) (approval no. KIST-2021-09-102).

Informed Consent Statement

Not applicable.

Data Availability Statement

The authors confirm that all data underlying the findings are fully available and can be obtained after submitting a request to the corresponding author.

Conflicts of Interest

The authors declare no conflict of interest.

References

  1. Riazi, K.; Azhari, H.; Charette, J.H.; Underwood, F.E.; King, J.A.; Afshar, E.E.; Swain, M.G.; Congly, S.E.; Kaplan, G.G.; Shaheen, A.-A. The prevalence and incidence of NAFLD worldwide: A systematic review and meta-analysis. Lancet Gastroenterol. Hepatol. 2022, 7, 851–861. [Google Scholar] [CrossRef]
  2. Estes, C.; Razavi, H.; Loomba, R.; Younossi, Z.; Sanyal, A.J. Modeling the epidemic of nonalcoholic fatty liver disease demonstrates an exponential increase in burden of disease. Hepatol. Baltim. Md. 2018, 67, 123–133. [Google Scholar] [CrossRef]
  3. Anstee, Q.M.; Reeves, H.L.; Kotsiliti, E.; Govaere, O.; Heikenwalder, M. From NASH to HCC: Current concepts and future challenges. Nat. Rev. Gastroenterol. Hepatol. 2019, 16, 411–428. [Google Scholar] [CrossRef]
  4. Cobbina, E.; Akhlaghi, F. Non-Alcoholic Fatty Liver Disease (NAFLD)—Pathogenesis, Classification, and Effect on Drug Metabolizing Enzymes and Transporters. Drug Metab. Rev. 2017, 49, 197–211. [Google Scholar] [CrossRef]
  5. Ekstedt, M.; Franzén, L.E.; Mathiesen, U.L.; Thorelius, L.; Holmqvist, M.; Bodemar, G.; Kechagias, S. Long-term follow-up of patients with NAFLD and elevated liver enzymes. Hepatology 2006, 44, 865–873. [Google Scholar] [CrossRef]
  6. Sugasawa, T.; Ono, S.; Yonamine, M.; Fujita, S.-I.; Matsumoto, Y.; Aoki, K.; Nakano, T.; Tamai, S.; Yoshida, Y.; Kawakami, Y.; et al. One Week of CDAHFD Induces Steatohepatitis and Mitochondrial Dysfunction with Oxidative Stress in Liver. Int. J. Mol. Sci. 2021, 22, 5851. [Google Scholar] [CrossRef]
  7. Sutti, S.; Jindal, A.; Locatelli, I.; Vacchiano, M.; Gigliotti, L.; Bozzola, C.; Albano, E. Adaptive immune responses triggered by oxidative stress contribute to hepatic inflammation in NASH. Hepatol. Baltim. Md. 2014, 59, 886–897. [Google Scholar] [CrossRef]
  8. Caballero, F.; Fernández, A.; Matías, N.; Martínez, L.; Fucho, R.; Elena, M.; Caballeria, J.; Morales, A.; Fernández-Checa, J.C.; García-Ruiz, C. Specific contribution of methionine and choline in nutritional nonalcoholic steatohepatitis: Impact on mitochondrial S-adenosyl-L-methionine and glutathione. J. Biol. Chem. 2010, 285, 18528–18536. [Google Scholar] [CrossRef]
  9. Matsumoto, M.; Hada, N.; Sakamaki, Y.; Uno, A.; Shiga, T.; Tanaka, C.; Ito, T.; Katsume, A.; Sudoh, M. An improved mouse model that rapidly develops fibrosis in non-alcoholic steatohepatitis. Int. J. Exp. Pathol. 2013, 94, 93–103. [Google Scholar] [CrossRef]
  10. Weltman, M.; Farrell, G.; Liddle, C. Increased hepatocyte CYP2E1 expression in a rat nutritional model of hepatic steatosis with inflammation. Gastroenterology 1996, 111, 1645–1653. [Google Scholar] [CrossRef]
  11. Machado, M.V.; Michelotti, G.A.; Xie, G.; de Almeida, T.P.; Boursier, J.; Bohnic, B.; Guy, C.D.; Diehl, A.M. Mouse Models of Diet-Induced Nonalcoholic Steatohepatitis Reproduce the Heterogeneity of the Human Disease. PLoS ONE 2015, 10, e0127991. [Google Scholar] [CrossRef] [PubMed]
  12. Trevaskis, J.L.; Griffin, P.S.; Wittmer, C.; Neuschwander-Tetri, B.A.; Brunt, E.M.; Dolman, C.S.; Erickson, M.R.; Napora, J.; Parkes, D.G.; Roth, J.D. Glucagon-like peptide-1 receptor agonism improves metabolic, biochemical, and histopathological indices of nonalcoholic steatohepatitis in mice. Am. J. Physiol.-Gastrointest. Liver Physiol. 2012, 302, G762–G772. [Google Scholar] [CrossRef]
  13. Abe, N.; Tsuchida, T.; Yasuda, S.-I.; Oka, K. Dietary iron restriction leads to a reduction in hepatic fibrosis in a rat model of non-alcoholic steatohepatitis. Biol. Open 2019, 8, bio040519. [Google Scholar] [CrossRef] [PubMed]
  14. Lee, N.; Heo, Y.J.; Choi, S.-E.; Jeon, J.Y.; Han, S.J.; Kim, D.J.; Kang, Y.; Lee, K.W.; Kim, H.J. Hepatoprotective effects of gemigliptin and empagliflozin in a murine model of diet-induced non-alcoholic fatty liver disease. Biochem. Biophys. Res. Commun. 2022, 588, 154–160. [Google Scholar] [CrossRef] [PubMed]
  15. Suzuki-Kemuriyama, N.; Abe, A.; Nakane, S.; Uno, K.; Ogawa, S.; Watanabe, A.; Sano, R.; Yuki, M.; Miyajima, K.; Nakae, D. Extract of Siraitia grosvenorii (Luo Han Guo) protects against hepatic fibrosis in mice on a choline-deficient, methionine-lowered, L-amino acid-defined, high-fat diet without trans fatty acids. Fundam. Toxicol. Sci. 2021, 8, 135–145. [Google Scholar] [CrossRef]
  16. Zhang, H.; Chen, J.; Cen, Y. Burn wound healing potential of a polysaccharide from Sanguisorba officinalis L. in mice. Int. J. Biol. Macromol. 2018, 112, 862–867. [Google Scholar] [CrossRef]
  17. Yasueda, A.; Kayama, H.; Murohashi, M.; Nishimura, J.; Wakame, K.; Komatsu, K.-i.; Ogino, T.; Miyoshi, N.; Takahashi, H.; Uemura, M.; et al. Sanguisorba officinalis L. derived from herbal medicine prevents intestinal inflammation by inducing autophagy in macrophages. Sci. Rep. 2020, 10, 9972. [Google Scholar] [CrossRef]
  18. Zhang, L.; Koyyalamudi, S.R.; Jeong, S.C.; Reddy, N.; Smith, P.T.; Ananthan, R.; Longvah, T. Antioxidant and immunomodulatory activities of polysaccharides from the roots of Sanguisorba officinalis. Int. J. Biol. Macromol. 2012, 51, 1057–1062. [Google Scholar] [CrossRef]
  19. Yang, J.-H.; Hwang, Y.-H.; Gu, M.-J.; Cho, W.-K.; Ma, J.Y. Ethanol extracts of Sanguisorba officinalis L. suppress TNF-α/IFN-γ-induced pro-inflammatory chemokine production in HaCaT cells. Phytomedicine 2015, 22, 1262–1268. [Google Scholar] [CrossRef]
  20. Jung, D.-W.; Lee, O.-H.; Kang, I.-J. Sanguisorba officinalis L. Extracts Exert Antiobesity Effects in 3T3-L1 Adipocytes and C57BL/6J Mice Fed High-Fat Diets. J. Med. Food 2016, 19, 768–779. [Google Scholar] [CrossRef]
  21. Fernandes, F.H.A.; Batista, R.S.d.A.; de Medeiros, F.D.; Santos, F.S.; Medeiros, A.C.D. Development of a rapid and simple HPLC-UV method for determination of gallic acid in Schinopsis brasiliensis. Rev. Bras. Farmacogn. 2015, 25, 208–211. [Google Scholar] [CrossRef]
  22. Jang, E.; Kim, S.; Lee, N.-R.; Kim, H.; Chae, S.; Han, C.-W.; Kim, Y.; Lee, K.-T.; Kim, B.-J.; Inn, K.-S.; et al. Sanguisorba officinalis extract, ziyuglycoside I, and II exhibit antiviral effects against hepatitis B virus. Eur. J. Integr. Med. 2018, 20, 165–172. [Google Scholar] [CrossRef]
  23. Sun, H.; Wang, M.; Su, T.; Guo, P.; Tai, Y.; Cheng, H.; Zhu, Z.; Jiang, C.; Yan, S.; Wei, W.; et al. Ziyuglycoside I attenuates collagen-induced arthritis through inhibiting plasma cell expansion. J. Ethnopharmacol. 2022, 294, 115348. [Google Scholar] [CrossRef] [PubMed]
  24. Zhu, X.; Wang, K.; Zhang, K.; Huang, B.; Zhang, J.; Zhang, Y.; Zhu, L.; Zhou, B.; Zhou, F. Ziyuglycoside II inhibits the growth of human breast carcinoma MDA-MB-435 cells via cell cycle arrest and induction of apoptosis through the mitochondria dependent pathway. Int. J. Mol. Sci. 2013, 14, 18041–18055. [Google Scholar] [CrossRef]
  25. Reagan-Shaw, S.; Nihal, M.; Ahmad, N. Dose translation from animal to human studies revisited. FASEB J. Off. Publ. Fed. Am. Soc. Exp. Biol. 2008, 22, 659–661. [Google Scholar] [CrossRef] [PubMed]
  26. Heinemann, F.; Birk, G.; Stierstorfer, B. Deep learning enables pathologist-like scoring of NASH models. Sci. Rep. 2019, 9, 18454. [Google Scholar] [CrossRef]
  27. Kleiner, D.E.; Brunt, E.M.; Van Natta, M.; Behling, C.; Contos, M.J.; Cummings, O.W.; Ferrell, L.D.; Liu, Y.C.; Torbenson, M.S.; Unalp-Arida, A.; et al. Design and validation of a histological scoring system for nonalcoholic fatty liver disease. Hepatology 2005, 41, 1313–1321. [Google Scholar] [CrossRef]
  28. Bolyen, E.; Rideout, J.R.; Dillon, M.R.; Bokulich, N.A.; Abnet, C.C.; Al-Ghalith, G.A.; Alexander, H.; Alm, E.J.; Arumugam, M.; Asnicar, F. Reproducible, interactive, scalable and extensible microbiome data science using QIIME 2. Nat. Biotechnol. 2019, 37, 852–857. [Google Scholar] [CrossRef]
  29. Callahan, B.J.; McMurdie, P.J.; Rosen, M.J.; Han, A.W.; Johnson, A.J.; Holmes, S.P. DADA2: High-resolution sample inference from Illumina amplicon data. Nat. Methods 2016, 13, 581–583. [Google Scholar] [CrossRef]
  30. Benjamini, Y.; Hochberg, Y. Controlling the False Discovery Rate—A Practical and Powerful Approach to Multiple Testing. J. R. Statst. Soc. B 1995, 57, 289–300. [Google Scholar] [CrossRef]
  31. Kolde, R.; Franzosa, E.A.; Rahnavard, G.; Hall, A.B.; Vlamakis, H.; Stevens, C.; Daly, M.J.; Xavier, R.J.; Huttenhower, C. Host genetic variation and its microbiome interactions within the Human Microbiome Project. Genome Med. 2018, 10, 6. [Google Scholar] [CrossRef] [PubMed]
  32. Fujii, J.; Homma, T.; Kobayashi, S.; Seo, H.G. Mutual interaction between oxidative stress and endoplasmic reticulum stress in the pathogenesis of diseases specifically focusing on non-alcoholic fatty liver disease. World J. Biol. Chem. 2018, 9, 1–15. [Google Scholar] [CrossRef] [PubMed]
  33. Chen, Z.; Tian, R.; She, Z.; Cai, J.; Li, H. Role of oxidative stress in the pathogenesis of nonalcoholic fatty liver disease. Free Radic. Biol. Med. 2020, 152, 116–141. [Google Scholar] [CrossRef]
  34. Masarone, M.; Rosato, V.; Dallio, M.; Gravina, A.G.; Aglitti, A.; Loguercio, C.; Federico, A.; Persico, M. Role of Oxidative Stress in Pathophysiology of Nonalcoholic Fatty Liver Disease. Oxidative Med. Cell. Longev. 2018, 2018, 9547613. [Google Scholar] [CrossRef]
  35. Tilg, H.; Moschen, A.R. Evolution of inflammation in nonalcoholic fatty liver disease: The multiple parallel hits hypothesis. Hepatology 2010, 52, 1836–1846. [Google Scholar] [CrossRef]
  36. Ighodaro, O.M.; Akinloye, O.A. First line defence antioxidants-superoxide dismutase (SOD), catalase (CAT) and glutathione peroxidase (GPX): Their fundamental role in the entire antioxidant defence grid. Alex. J. Med. 2018, 54, 287–293. [Google Scholar] [CrossRef]
  37. Rao, M.S.; Reddy, J.K. Peroxisomal beta-oxidation and steatohepatitis. Semin. Liver Dis. 2001, 21, 43–55. [Google Scholar] [CrossRef]
  38. Reddy, J.K.; Hashimoto, T. Peroxisomal beta-oxidation and peroxisome proliferator-activated receptor alpha: An adaptive metabolic system. Annu. Rev. Nutr. 2001, 21, 193–230. [Google Scholar] [CrossRef]
  39. Pawlak, M.; Lefebvre, P.; Staels, B. Molecular mechanism of PPARα action and its impact on lipid metabolism, inflammation and fibrosis in non-alcoholic fatty liver disease. J. Hepatol. 2015, 62, 720–733. [Google Scholar] [CrossRef]
  40. Fondevila, M.F.; Fernandez, U.; Heras, V.; Parracho, T.; Gonzalez-Rellan, M.J.; Novoa, E.; Porteiro, B.; Alonso, C.; Mayo, R.; da Silva Lima, N.; et al. Inhibition of carnitine palmitoyltransferase 1A in hepatic stellate cells protects against fibrosis. J. Hepatol. 2022, 77, 15–28. [Google Scholar] [CrossRef]
  41. Mead, J.; Irvine, S.; Ramji, D. Lipoprotein lipase: Structure, function, regulation, and role in disease. J. Mol. Med. 2002, 80, 753–769. [Google Scholar] [CrossRef]
  42. Ratziu, V. A position statement on NAFLD/NASH based on the EASL 2009 special conference. J. Hepatol. 2010, 53, 372–384. [Google Scholar] [CrossRef] [PubMed]
  43. Zhang, X.; Han, X.; Yin, L.; Xu, L.; Qi, Y.; Xu, Y.; Sun, H.; Lin, Y.; Liu, K.; Peng, J. Potent effects of dioscin against liver fibrosis. Sci. Rep. 2015, 5, 9713. [Google Scholar] [CrossRef]
  44. Inagaki, Y.; Okazaki, I. Emerging insights into Transforming growth factor β Smad signal in hepatic fibrogenesis. Gut 2007, 56, 284–292. [Google Scholar] [CrossRef] [PubMed]
  45. Breitkopf, K.; Godoy, P.; Ciuclan, L.; Singer, M.V.; Dooley, S. TGF-beta/Smad signaling in the injured liver. Z. Fur Gastroenterol. 2006, 44, 57–66. [Google Scholar] [CrossRef] [PubMed]
  46. de Vos, W.M.; Tilg, H.; Van Hul, M.; Cani, P.D. Gut microbiome and health: Mechanistic insights. Gut 2022, 71, 1020–1032. [Google Scholar] [CrossRef]
  47. Loomba, R.; Seguritan, V.; Li, W.; Long, T.; Klitgord, N.; Bhatt, A.; Dulai, P.S.; Caussy, C.; Bettencourt, R.; Highlander, S.K.; et al. Gut Microbiome-Based Metagenomic Signature for Non-invasive Detection of Advanced Fibrosis in Human Nonalcoholic Fatty Liver Disease. Cell Metab. 2019, 30, 607. [Google Scholar] [CrossRef]
  48. Neuschwander-Tetri, B.A.; Loomba, R.; Sanyal, A.J.; Lavine, J.E.; Van Natta, M.L.; Abdelmalek, M.F.; Chalasani, N.; Dasarathy, S.; Diehl, A.M.; Hameed, B.; et al. Farnesoid X nuclear receptor ligand obeticholic acid for non-cirrhotic, non-alcoholic steatohepatitis (FLINT): A multicentre, randomised, placebo-controlled trial. Lancet 2015, 385, 956–965. [Google Scholar] [CrossRef]
  49. Staels, B.; Rubenstrunk, A.; Noel, B.; Rigou, G.; Delataille, P.; Millatt, L.J.; Baron, M.; Lucas, A.; Tailleux, A.; Hum, D.W.; et al. Hepatoprotective effects of the dual peroxisome proliferator-activated receptor alpha/delta agonist, GFT505, in rodent models of nonalcoholic fatty liver disease/nonalcoholic steatohepatitis. Hepatology 2013, 58, 1941–1952. [Google Scholar] [CrossRef]
  50. Lefere, S.; Puengel, T.; Hundertmark, J.; Penners, C.; Frank, A.K.; Guillot, A.; de Muynck, K.; Heymann, F.; Adarbes, V.; Defrêne, E.; et al. Differential effects of selective- and pan-PPAR agonists on experimental steatohepatitis and hepatic macrophages☆. J. Hepatol. 2020, 73, 757–770. [Google Scholar] [CrossRef]
  51. Day, C.P.; James, O.F.W. Steatohepatitis: A tale of two “hits”? Gastroenterology 1998, 114, 842–845. [Google Scholar] [CrossRef] [PubMed]
  52. Yang, Z.-r.; Wang, H.-f.; Zuo, T.-c.; Guan, L.-l.; Dai, N. Salidroside alleviates oxidative stress in the liver with non- alcoholic steatohepatitis in rats. BMC Pharmacol. Toxicol. 2016, 17, 16. [Google Scholar] [CrossRef] [PubMed]
  53. Pryor, W.A.; Stanley, J.P. Suggested mechanism for the production of malonaldehyde during the autoxidation of polyunsaturated fatty acids. Nonenzymic production of prostaglandin endoperoxides during autoxidation. J. Org. Chem. 1975, 40, 3615–3617. [Google Scholar] [CrossRef] [PubMed]
  54. Hwang, I.; Uddin, M.J.; Pak, E.S.; Kang, H.; Jin, E.-J.; Jo, S.; Kang, D.; Lee, H.; Ha, H. The impaired redox balance in peroxisomes of catalase knockout mice accelerates nonalcoholic fatty liver disease through endoplasmic reticulum stress. Free. Radic. Biol. Med. 2020, 148, 22–32. [Google Scholar] [CrossRef] [PubMed]
  55. Fujita, K.; Nozaki, Y.; Wada, K.; Yoneda, M.; Fujimoto, Y.; Fujitake, M.; Endo, H.; Takahashi, H.; Inamori, M.; Kobayashi, N.; et al. Dysfunctional very-low-density lipoprotein synthesis and release is a key factor in nonalcoholic steatohepatitis pathogenesis. Hepatology 2009, 50, 772–780. [Google Scholar] [CrossRef]
  56. Xu, J.; Xiao, G.; Trujillo, C.; Chang, V.; Blanco, L.; Joseph, S.B.; Bassilian, S.; Saad, M.F.; Tontonoz, P.; Lee, W.N.P.; et al. Peroxisome Proliferator-activated Receptor α (PPARα) Influences Substrate Utilization for Hepatic Glucose Production. J. Biol. Chem. 2002, 277, 50237–50244. [Google Scholar] [CrossRef]
  57. Régnier, M.; Polizzi, A.; Smati, S.; Lukowicz, C.; Fougerat, A.; Lippi, Y.; Fouché, E.; Lasserre, F.; Naylies, C.; Bétoulières, C.; et al. Hepatocyte-specific deletion of Pparα promotes NAFLD in the context of obesity. Sci. Rep. 2020, 10, 6489. [Google Scholar] [CrossRef]
  58. Reeves, H.L.; Friedman, S.L. Activation of hepatic stellate cells--a key issue in liver fibrosis. Front. Biosci. A J. Virtual Libr. 2002, 7, d808–d826. [Google Scholar] [CrossRef]
  59. Puche, J.E.; Saiman, Y.; Friedman, S.L. Hepatic stellate cells and liver fibrosis. Compr. Physiol. 2013, 3, 1473–1492. [Google Scholar] [CrossRef]
  60. Yin, C.; Evason, K.J.; Asahina, K.; Stainier, D.Y.R. Hepatic stellate cells in liver development, regeneration, and cancer. J. Clin. Investig. 2013, 123, 1902–1910. [Google Scholar] [CrossRef]
  61. Yang, C.; Zeisberg, M.; Mosterman, B.; Sudhakar, A.; Yerramalla, U.; Holthaus, K.; Xu, L.; Eng, F.; Afdhal, N.; Kalluri, R. Liver fibrosis: Insights into migration of hepatic stellate cells in response to extracellular matrix and growth factors. Gastroenterology 2003, 124, 147–159. [Google Scholar] [CrossRef] [PubMed]
  62. Ender, F.; Godl, K.; Wenzl, S.; Sumper, M. Evidence for Autocatalytic Cross-Linking of Hydroxyproline-Rich Glycoproteins during Extracellular Matrix Assembly in Volvox. Plant Cell 2002, 14, 1147–1160. [Google Scholar] [CrossRef]
  63. Di Lullo, G.A.; Sweeney, S.M.; Körkkö, J.; Ala-Kokko, L.; San Antonio, J.D. Mapping the Ligand-binding Sites and Disease-associated Mutations on the Most Abundant Protein in the Human, Type I Collagen. J. Biol. Chem. 2002, 277, 4223–4231. [Google Scholar] [CrossRef] [PubMed]
  64. Dooley, S.; Delvoux, B.; Streckert, M.; Bonzel, L.; Stopa, M.; ten Dijke, P.; Gressner, A.M. Transforming growth factor β signal transduction in hepatic stellate cells via Smad2/3 phosphorylation, a pathway that is abrogated during in vitro progression to myofibroblasts. FEBS Lett. 2001, 502, 4–10. [Google Scholar] [CrossRef] [PubMed]
  65. Gressner, O.A.; Lahme, B.; Demirci, I.; Gressner, A.M.; Weiskirchen, R. Differential effects of TGF-β on connective tissue growth factor (CTGF/CCN2) expression in hepatic stellate cells and hepatocytes. J. Hepatol. 2007, 47, 699–710. [Google Scholar] [CrossRef]
  66. Jung, H.J.; Cho, K.; Kim, S.Y.; Seong, J.K.; Oh, S.H. Ethanol extract of Pharbitis nil ameliorates liver fibrosis through regulation of the TGFbeta1-SMAD2/3 pathway. J. Ethnopharmacol. 2022, 294, 115370. [Google Scholar] [CrossRef]
  67. Liu, Z.; Xu, B.; Ding, Y.; Ding, X.; Yang, Z. Guizhi Fuling pill attenuates liver fibrosis in vitro and in vivo via inhibiting TGF-beta1/Smad2/3 and activating IFN-gamma/Smad7 signaling pathways. Bioengineered 2022, 13, 9357–9368. [Google Scholar] [CrossRef]
  68. Ahn, S.B.; Jun, D.W.; Kang, B.K.; Lim, J.H.; Lim, S.; Chung, M.J. Randomized, Double-blind, Placebo-controlled Study of a Multispecies Probiotic Mixture in Nonalcoholic Fatty Liver Disease. Sci. Rep. 2019, 9, 5688. [Google Scholar] [CrossRef]
  69. Lee, N.Y.; Shin, M.J.; Youn, G.S.; Yoon, S.J.; Choi, Y.R.; Kim, H.S.; Gupta, H.; Han, S.H.; Kim, B.K.; Lee, D.Y.; et al. Lactobacillus attenuates progression of nonalcoholic fatty liver disease by lowering cholesterol and steatosis. Clin. Mol. Hepatol. 2021, 27, 110–124. [Google Scholar] [CrossRef]
  70. Jang, H.R.; Park, H.J.; Kang, D.; Chung, H.; Nam, M.H.; Lee, Y.; Park, J.H.; Lee, H.Y. A protective mechanism of probiotic Lactobacillus against hepatic steatosis via reducing host intestinal fatty acid absorption. Exp. Mol. Med. 2019, 51, 1–14. [Google Scholar] [CrossRef]
  71. Nguyen, H.T.; Gu, M.; Werlinger, P.; Cho, J.H.; Cheng, J.; Suh, J.W. Lactobacillus sakei MJM60958 as a Potential Probiotic Alleviated Non-Alcoholic Fatty Liver Disease in Mice Fed a High-Fat Diet by Modulating Lipid Metabolism, Inflammation, and Gut Microbiota. Int. J. Mol. Sci. 2022, 23, 3436. [Google Scholar] [CrossRef]
  72. Cao, F.; Ding, Q.; Zhuge, H.; Lai, S.; Chang, K.; Le, C.; Yang, G.; Valencak, T.G.; Li, S.; Ren, D. Lactobacillus plantarum ZJUIDS14 alleviates non-alcoholic fatty liver disease in mice in association with modulation in the gut microbiota. Front. Nutr. 2022, 9, 1071284. [Google Scholar] [CrossRef] [PubMed]
  73. Okubo, H.; Sakoda, H.; Kushiyama, A.; Fujishiro, M.; Nakatsu, Y.; Fukushima, T.; Matsunaga, Y.; Kamata, H.; Asahara, T.; Yoshida, Y.; et al. Lactobacillus casei strain Shirota protects against nonalcoholic steatohepatitis development in a rodent model. Am. J. Physiol. Gastrointest. Liver Physiol. 2013, 305, G911–G918. [Google Scholar] [CrossRef]
  74. Yuan, G.-h.; Zhang, Z.; Gao, X.-s.; Zhu, J.; Guo, W.-h.; Wang, L.; Ding, P.; Jiang, P.; Li, L. Gut microbiota-mediated tributyltin-induced metabolic disorder in rats. RSC Adv. 2020, 10, 43619–43628. [Google Scholar] [CrossRef] [PubMed]
  75. Raman, M.; Ahmed, I.; Gillevet, P.M.; Probert, C.S.; Ratcliffe, N.M.; Smith, S.; Greenwood, R.; Sikaroodi, M.; Lam, V.; Crotty, P.; et al. Fecal Microbiome and Volatile Organic Compound Metabolome in Obese Humans with Nonalcoholic Fatty Liver Disease. Clin. Gastroenterol. Hepatol. 2013, 11, 868–875. [Google Scholar] [CrossRef] [PubMed]
Figure 1. Effects of SOEE on NAFLD-related traits in CDAHFD-fed mice. (A) TG contents in liver tissue. (B) TC contents in liver tissue. (C) Representative image of H&E-stained liver section. Magnification is 200×. (D) Quantified surface area of lipid droplets in each group using ImageJ software. (E) Evaluated NAFLD activity score in H&E-stained liver sections using deep-learning-based CNN. Data are expressed as mean ± SEM (n = 10). One-way ANOVA and Tukey’s post hoc multiple comparison test were performed for statistical analysis. p-value compared with the CDAHFD group. “***” p < 0.001, “**” p < 0.01, “*” p < 0.05, and “ns” non-significant.
Nutrients 15 03779 g001
Figure 2. Effects of SOEE on oxidative-stress- and fatty-acid-oxidation-related markers in CDAHFD-fed mice. (A) Level of hepatic malondialdehyde (MDA), which is a biomarker of lipid peroxidation, measured using a colorimetric assay. (B,D) mRNA expression of oxidative-stress-related genes, namely, (B) catalase (Cat), (C) glutathione peroxidase I (Gpx1), and (D) superoxide dismutase 1 (Sod1), were quantified using qRT-PCR. mRNA expression levels of fatty-acid-oxidation-related genes were quantified using qRT-PCR. (E) Peroxisome proliferator-activated receptor alpha (Ppara), (F) carnitine palmitoyltransferase 1A (Cpt1a), and (G) lipoprotein lipase (Lpl) mRNA levels. Data are expressed as mean ± SEM (n = 10). One-way ANOVA and Tukey’s post hoc multiple comparison test were performed for statistical analysis. p-value compared with the CDAHFD group. “***” p < 0.001, “**” p < 0.01, “*” p < 0.05, and “ns” non-significant.
Nutrients 15 03779 g002
Figure 3. Effects of SOEE on fibrosis-related markers in the liver of CDAHFD-fed mice. (A) Representative image of Sirius-Red-stained liver section. Magnification was 200×. (B) Quantified Sirius-Red-stained area in liver tissue section (n = 40 images per group). (C) Hydroxyproline level in liver tissue (n = 10). (DG) mRNA expression levels of fibrosis-related genes including (D) alpha-smooth muscle actin (Acta2), (E) collagen type I alpha 1 (Col1a1), (F) collagen type III alpha 1 (Col3a1), and (G) transforming growth factor beta 1 (Tgfb1) were quantified using qRT-PCR. Data are expressed as mean ± SEM (n = 10). One-way ANOVA and Tukey’s post hoc multiple comparison test were performed for statistical analysis. p-value compared with the CDAHFD group. “***” p < 0.001, “**” p < 0.01, “*” p < 0.05, and “ns” non-significant.
Nutrients 15 03779 g003
Figure 4. Effects of SOEE on mRNA expression levels of fibrosis-related genes and SMAD2/3 phosphorylation in LX-2 cells. To investigate the fibrosis inhibitory effect of SOEE, LX-2 cells were treated with TGF-β1 (TGFb1) at 5 ng/mL, and mRNA expression levels of (A) alpha-smooth muscle actin (ACTA2), (B) collagen type I alpha 1 (COL1A1), (C) TIMP metallopeptidase inhibitor 1 (TIMP1), and (D) collagen type III alpha 1 (COL3A1) were observed using qRT-PCR. (E) Protein levels of SMAD2/3 and p-SMAD2/3 were determined using Western blotting. Cells were pre-treated with SOEE for 24 h and then with TGF-β1 (5 ng/mL) and SOEE simultaneously for 30 min. (F) Protein expression levels were quantified using ImageJ software. Data are expressed as mean ± SEM. (n = 4). One-way ANOVA and Tukey’s post hoc multiple comparison test were performed for statistical analysis. p-value compared with the TGF-β1 group. “***” p < 0.001, “**” p < 0.01, “*” p < 0.05.
Nutrients 15 03779 g004
Figure 5. Effect of SOEE on gut microbial diversity and composition in CDAHFD-fed mice. (AC) Alpha diversity indices: (A) Shannon diversity, (B) Faith’s PD, and (C) observed ASV. One-way ANOVA and Tukey’s post hoc multiple comparison test were performed for statistical analysis. p-value compared with the CDAHFD group. (DF) Representative microbial genera, namely, (D) Butyricicoccus, (E) Acetivibrio ethanoligignens group, and (F) Lactobacillus show significantly differential abundance between the SOEE and CDAHFD groups. One-way ANOVA and Tukey’s post hoc multiple comparison test were performed for statistical analysis. p-value compared with the CDAHFD group. (G) Heat map showing the correlations between the abundance of microbial genera and NAFLD/fibrosis-related markers. In taxonomic classification, the class and phylum level to which each genus belongs are denoted with different colors. p-values were adjusted using the Benjamini–Hochberg (BH) FDR procedure. p-value compared with the CDAHFD group. “***” p < 0.001, “**” p < 0.01, “*” p < 0.05, and “ns” non-significant.
Nutrients 15 03779 g005aNutrients 15 03779 g005b
Table 1. Primer sequence for qRT-PCR.
GenesDirectionPrimer (5′→3′)Species
Col1a1ForwardAGC ACG TCT GGT TTG GAG AGMouse
Col1a1ReverseGAC ATT AGG CGC AGG AAG GTMouse
Col3a1ForwardGTG GAC ATT GGC CCT GTT TGMouse
Col3a1ReverseAGT TGG TCA CTT GCA CTG GTMouse
Tgfb1ForwardGTG GCT GAA CCA AGG AGA CGMouse
Tgfb1ReverseGTT TGG GGC TGA TCC CGT TGMouse
Timp1ForwardTTA TTC TCC ACT GTG CAG CCCMouse
Timp1ReverseACA AGA GGA TGC CAG ATG CCMouse
Acta2ForwardTCC AGC CAT CTT TCA TTG GGAMouse
Acta2ReverseCCC CTG ACA GGA CGT TGT TAMouse
PparaForwardGAA CTG ACG TTT GTG GCT GGMouse
PparaReverseGCT CTC TGT GTC CAC CAT GTMouse
Cpt1aForwardACT CCG CTC GCT CAT TCCMouse
Cpt1aReverseGAC TGT GAA CTG GAA GGC CAMouse
LplForwardGTG GAC ATC GGA GAA CTG CTMouse
LplReverseCCT CTC GAT GAC GAA GCT GGMouse
Sod1ForwardGGG AAG CAT GGC GAT GAA AGMouse
Sod1ReverseGCC TTC TGC TCG AAG TGG ATMouse
CatForwardCAA GAT TGC CTT CTC CGG GTMouse
CatReverseATG GTG TAG GAT TGC GGA GCMouse
Gpx1ForwardAGT CCA CCG TGT ATG CCT TCMouse
Gpx1ReverseCCT CAG AGA GAC GCG ACA TTMouse
β-actinForwardCAT TGC TGA CAG GAT GCA GAA GGMouse
β-actinReverseTGC TGG AAG GTG GAC AGT GAG GMouse
ACTA2ForwardGCC AAG CAC TGT CAG GAAHuman
ACTA2ReverseATT GTC ACA CAC CAA GGC AHuman
COL1A1ForwardATG GAG CTC CTG GTC AGA THuman
COL1A1ReverseGTA GCA CCA TCA TTT CCA CGHuman
COL3A1ForwardGCT CTG CTT CAT CCC ACT ATHuman
COL3A1ReverseCGC ATA GGA CTG ACC AAG ATHuman
TIMP1ForwardCTC TGA AAA GGG CTT CCA GTCHuman
TIMP1ReverseAGG ATT CAG GCT ATC TGG GACHuman
GAPDHForwardCAG CCG CAT CTT CTT TTG CGHuman
GAPDHReverseTCC GTT GAC TCC GAC CTT CAHuman
Table 2. Effects of SOEE on plasma lipid profiling and liver injury markers in CDAHFD-fed mice.
GroupBody Weight
(g)
Liver Weight
(g)
ALT
(IU/L)
AST
(IU/L)
Plasma TG
(mM/L)
Plasma TC
(mM/L)
Control*** 30.87 ± 3.38*** 1.15 ± 0.18*** 1.12 ± 0.56*** 5.49 ± 2.090.36 ± 0.11* 0.99 ± 0.14
CDAHFD24.16 ± 2.341.67 ± 0.2617.85 ± 2.5813.13 ± 2.500.40 ± 0.100.83 ± 0.17
OCA23.32 ± 1.99** 2.04 ± 0.20# 24.45 ± 10.28* 25.69 ± 15.03*** 0.23 ± 0.07# 0.67 ± 0.17
SO2524.19 ± 1.811.68 ± 0.2915.84 ± 4.41# 10.36 ± 3.48* 0.30 ± 0.060.77 ± 0.15
SO10024.50 ± 1.151.67 ± 0.1918.24 ± 3.5211.31 ± 3.11** 0.27 ± 0.070.72 ± 0.11
Data are expressed as mean ± SEM. One-way ANOVA and Tukey’s post hoc multiple comparison tests were performed for statistical analysis. p-value compared with the CDAHFD group. “***” p < 0.001, “**” p < 0.01, “*” p < 0.05, and “#p < 0.10.
Disclaimer/Publisher’s Note: The statements, opinions and data contained in all publications are solely those of the individual author(s) and contributor(s) and not of MDPI and/or the editor(s). MDPI and/or the editor(s) disclaim responsibility for any injury to people or property resulting from any ideas, methods, instructions or products referred to in the content.

