1. The Issue at Hand—Unhealthy Food Environments
The burden of noncommunicable diseases (NCDs) continues to increase worldwide. In 2021, NCDs caused 90% of deaths and 85% of years lived with disability (YLDs) in the WHO European Region [
1]. Obesity is a complex disease considered one of the region’s top five risk factors for NCDs. Overweight and obesity affect almost 60% of adults and nearly one in three children (29% of boys and 27% of girls) in the WHO European Region [
2]. It is influenced and caused by several factors, including unhealthy food environments and dietary habits. Recent evidence suggests that around 25% of calories are consumed outside the home. This increase makes the out of home (OOH) food environment an important public health setting [
3].
In most countries, meal delivery apps (MDAs) are not included in existing laws addressing establishments in the OOH food environment. This means that labeling laws and the need to disclose certain information about foods and beverages, including nutrition information, do not apply to MDAs. This results in a lack of accessible consumer information on nutritional quality of the foods they are ordering, unlike in a retail environment.
This paper will describe the development and the objectives of an innovative digital out of home food environment-monitoring platform, its benefits, goals, and challenges with a focus on the impact on nutritional information.
2. Digital Food Environments and Public Health
Obesogenic environments promote unhealthy lifestyles, increasing the risk of obesity and other lifestyle-related diseases. These environments make choices towards an unhealthy lifestyle, such as an unhealthy diet and lack of physical activity, easier [
4]. When evaluating the OOH food environment, several factors lead to an obesogenic environment. Examples are bigger portion sizes, new opportunities to order high-calorie snacks and drinks via food delivery apps, and the increased reach of fast-food restaurants due to cheap delivery services. In addition, widespread promotional actions are increasing the popularity and awareness of OOH food products [
5]. Many countries have been showing increasing consumption of out of home meals [
6] and an extensive calorie intake when eating outside the home [
7,
8,
9].
The obesogenic environment has stretched from the physical environment to the virtual world, making it a growing public health challenge. Online activities and entertainment offers for people of all ages have increased, and targeted and personalized marketing strategies make marketing even more persuasive. Also, diet-related misinformation found online can have a dangerous impact on people’s health [
10]. Extensive options to purchase food or ready meals online to be delivered directly to the consumer’s house support a sedentary lifestyle and the tendency to choose nutrient-poor and high-energy foods [
11].
This trend highlights the importance of understanding and regulating the digital food environment to ensure the availability of nutritious meals contributing to a healthy diet. To support this, the WHO European Office for the Prevention and Control of Noncommunicable Diseases (NCD Office) has started several workstreams exploring the digital food environment, its challenges, and opportunities. This includes a number of factsheets and reports which explore a systems approach to MDAs and describe the need for comprehensive data and a detailed understanding of MDAs to facilitate healthier choices [
3,
11,
12,
13]. MDAs are online platforms allowing people to order ready meals and beverages online via restaurant accounts, and delivery workers bring the food to the consumer. This form of food delivery has gained popularity, especially during the COVID-19 pandemic. A recent study looking at the healthiness of food and menu items in three cities in in New Zealand showed that over 75% of food and menu items offered on MDAs were classified as unhealthy based on Eating and Activity Guidelines for New Zealand Adults [
14]. This trend has been observed in previous studies [
15,
16,
17].
2.1. The Importance of Access to Nutritional Information
Nutrition labeling is essential to inform people better and enable them to make healthier food choices. How information is presented and the amount of information differ across countries and depend on the type of labeling—front of pack labeling (FOPL) or back of pack labeling. The WHO “best buys” recommend FOPL as cost-effective way to tackle NCDs and to support consumers in making healthier food choices [
12].
In addition to improving the healthiness of consumers’ food purchases, nutrition labeling can be used for several measures that can support populations’ diets through policy decisions. Regarding marketing regulations, nutrient profile models (NPMs) with clear thresholds can indicate what types of foods are categorized as permitted or not permitted to be marketed in certain settings. Some forms of labeling might also encourage companies to reformulate their products into healthier versions to obtain a better label which might be more attractive to consumers [
12].
In the European Union (EU), providing a nutrition declaration on the back of packs of food products is mandatory [
18]. However, such regulations typically only apply to the physical food environment, leaving the online food environment, including MDAs, widely unregulated, which leads to a need for nutritional information for food products when ordering online.
Some larger international food chains provide nutritional information for their products on their brand websites. However, this information needs to be presented in a more user-friendly and consistent way, as the current presentation makes it hard for consumers to compare products and make healthier choices. Additionally, nutritional information is rarely provided when ordering food through MDAs, which is becoming a common way to purchase ready meals.
Research shows that meals delivered through MDAs have larger portion sizes and are higher in energy, sugars, salt, and fats compared to meals cooked at home or pre-packed meals purchased from a retailer [
19,
20]. The easy access to alcoholic beverages, which are also promoted on MDAs, makes alcohol purchases easier and increases associated health risks [
21]. Data gaps and lack of regulation around MDAs make it challenging to monitor and understand the health risks of the digital food environment and hard to ensure access to safe and healthy food. Several considerations, including food supply chains, availability and accessibility, prices and affordability, and marketing, regulation, and desirability of food environments, must be considered [
19,
22]. A systems approach is needed to sufficiently understand the challenges and opportunities of MDAs.
2.2. The Beginnings of Change?—Calorie Labeling in a WHO Euro Member State—The UK Case
In April 2022, the UK became the first country in the WHO European Region to introduce a new mandatory regulation for the provision of calorie information on foods and beverages in cafes, restaurants, and takeaways with more than 250 employees. The display of calories does not only include packaged foods but also nonprepacked foods and soft drinks. “Calorie information must be displayed on menus, online menus, third party apps, food delivery platforms, and food labels at the point a customer is making their food and drink choices.” [
23]. Further, daily recommended calories need to be added next to the calorie information of food items, menus, and labels. This new regulation is a step towards supporting customers to make healthy and informed food choices. It is part of a broader strategy to tackle obesity in the country, as research indicates that 20–25% of adult calorie intake in the UK happens outside the home [
23].
Although some data on the out of home food environment have been collected, it needs to be carried out systematically otherwise they have only limited value. Further, no regular monitoring of the existing data has been conducted. Therefore, accurate, accessible, and consistent data for the region are needed in order to assess the digital OOH food environment and utilize opportunities to improve people’s access to healthier food choices.
Previous efforts have focused on the collection of data from big chains only [
24,
25,
26]. The platform which was developed by the WHO NCD Office will support a better understanding of the digital food environment by collecting relevant data including all available nutrition-related information from MDAs, but also prices, cuisine types, and delivery areas.
3. Project Description of WHO/Europe OOH Dashboard
3.1. Aims, Function, and Opportunities of the Dashboard
The OOH food environment platform was developed in 2021 by the WHO NCD Office in collaboration with Kingston University, United Kingdom, to work towards the current lack of online information in terms of the nutritional value of foods in MDAs and fill current gaps.
The platform currently collects data from two major food delivery platforms and provides information on available restaurants, their geographical location and delivery reach, as well as menu items if available. However, most restaurants do not provide information on nutrient composition.
A technical paper describing the details of the data-monitoring platform will be published separately.
Labeling laws and regulations on the provision of nutrient information on nutritional composition values enable access to relevant food-related information in the physical food environment, including sales data and information on consumer behaviors [
8,
11]. The same level of data describing the digital food environment on OOH food platforms should be made available in a clear and consistent manner. Available data are essential to successfully develop and implement policies that can monitor the digital OOH food environment and improve health outcomes.
Currently, the data platform collects data from Ireland, Italy, Slovakia, Spain, and the United Kingdom. Restaurant information, including location, offered cuisine types, delivery prices, delivery area, and images, when available, was collected from each country. With more data collected by the platform, more impactful comparisons are possible. Therefore, countries are encouraged to use the OOH data platform.
3.2. Current Gaps: Nutrition Information in the European Context, Challenges of the OOH Environment
There needs to be more research into how food delivery apps are structured, which menu items are placed in prime positions at the top of the page, and the use of promotions and bundles to encourage the consumer to buy more. Such sales promotions can lead to excess energy consumption and overweight and obesity. However, these data points are owned by food delivery apps and are not accessible to public health researchers.
Information on food sales and food retail data can be used by policymakers in multiple ways, for example, using the data for introducing policies, including product-related, price-related, promotion-related, and place-related policies, and monitoring adherence to national dietary guidelines [
22].
To develop and implement policies, policymakers need to understand in their own country what are the main contributors to the population level of salt intake or sugar intake. To estimate that, one needs the specific nutrient value per product and its sales data in a country.
Promotional offers and sales in the OOH online food environment take a lot of work to monitor. The newly developed WHO OOH-monitoring platform can help understanding the offered food items and online restaurant menus of food delivery apps, the structure of food offers and listing of items, offered menus and bundles for a reduced price, promotional events, cost of products, and the number and geographical location and reach of restaurants, which is essential from a public health perspective to better understand online food retail, including the type of food which is purchased most often, comparing geographical areas and socio-economic averages with food products. These analyses can support the implementation of regulations to protect vulnerable populations.
Some information is currently not provided on MDAs and can therefore not be collected, namely the nutritional content of food items, any kind of individual customer data like purchase behaviors or types of customers, as well as marketing strategies. Other data, including individuals’ sales data, are only accessible to the MDAs themselves.
3.3. Development and Structure of the Dashboard
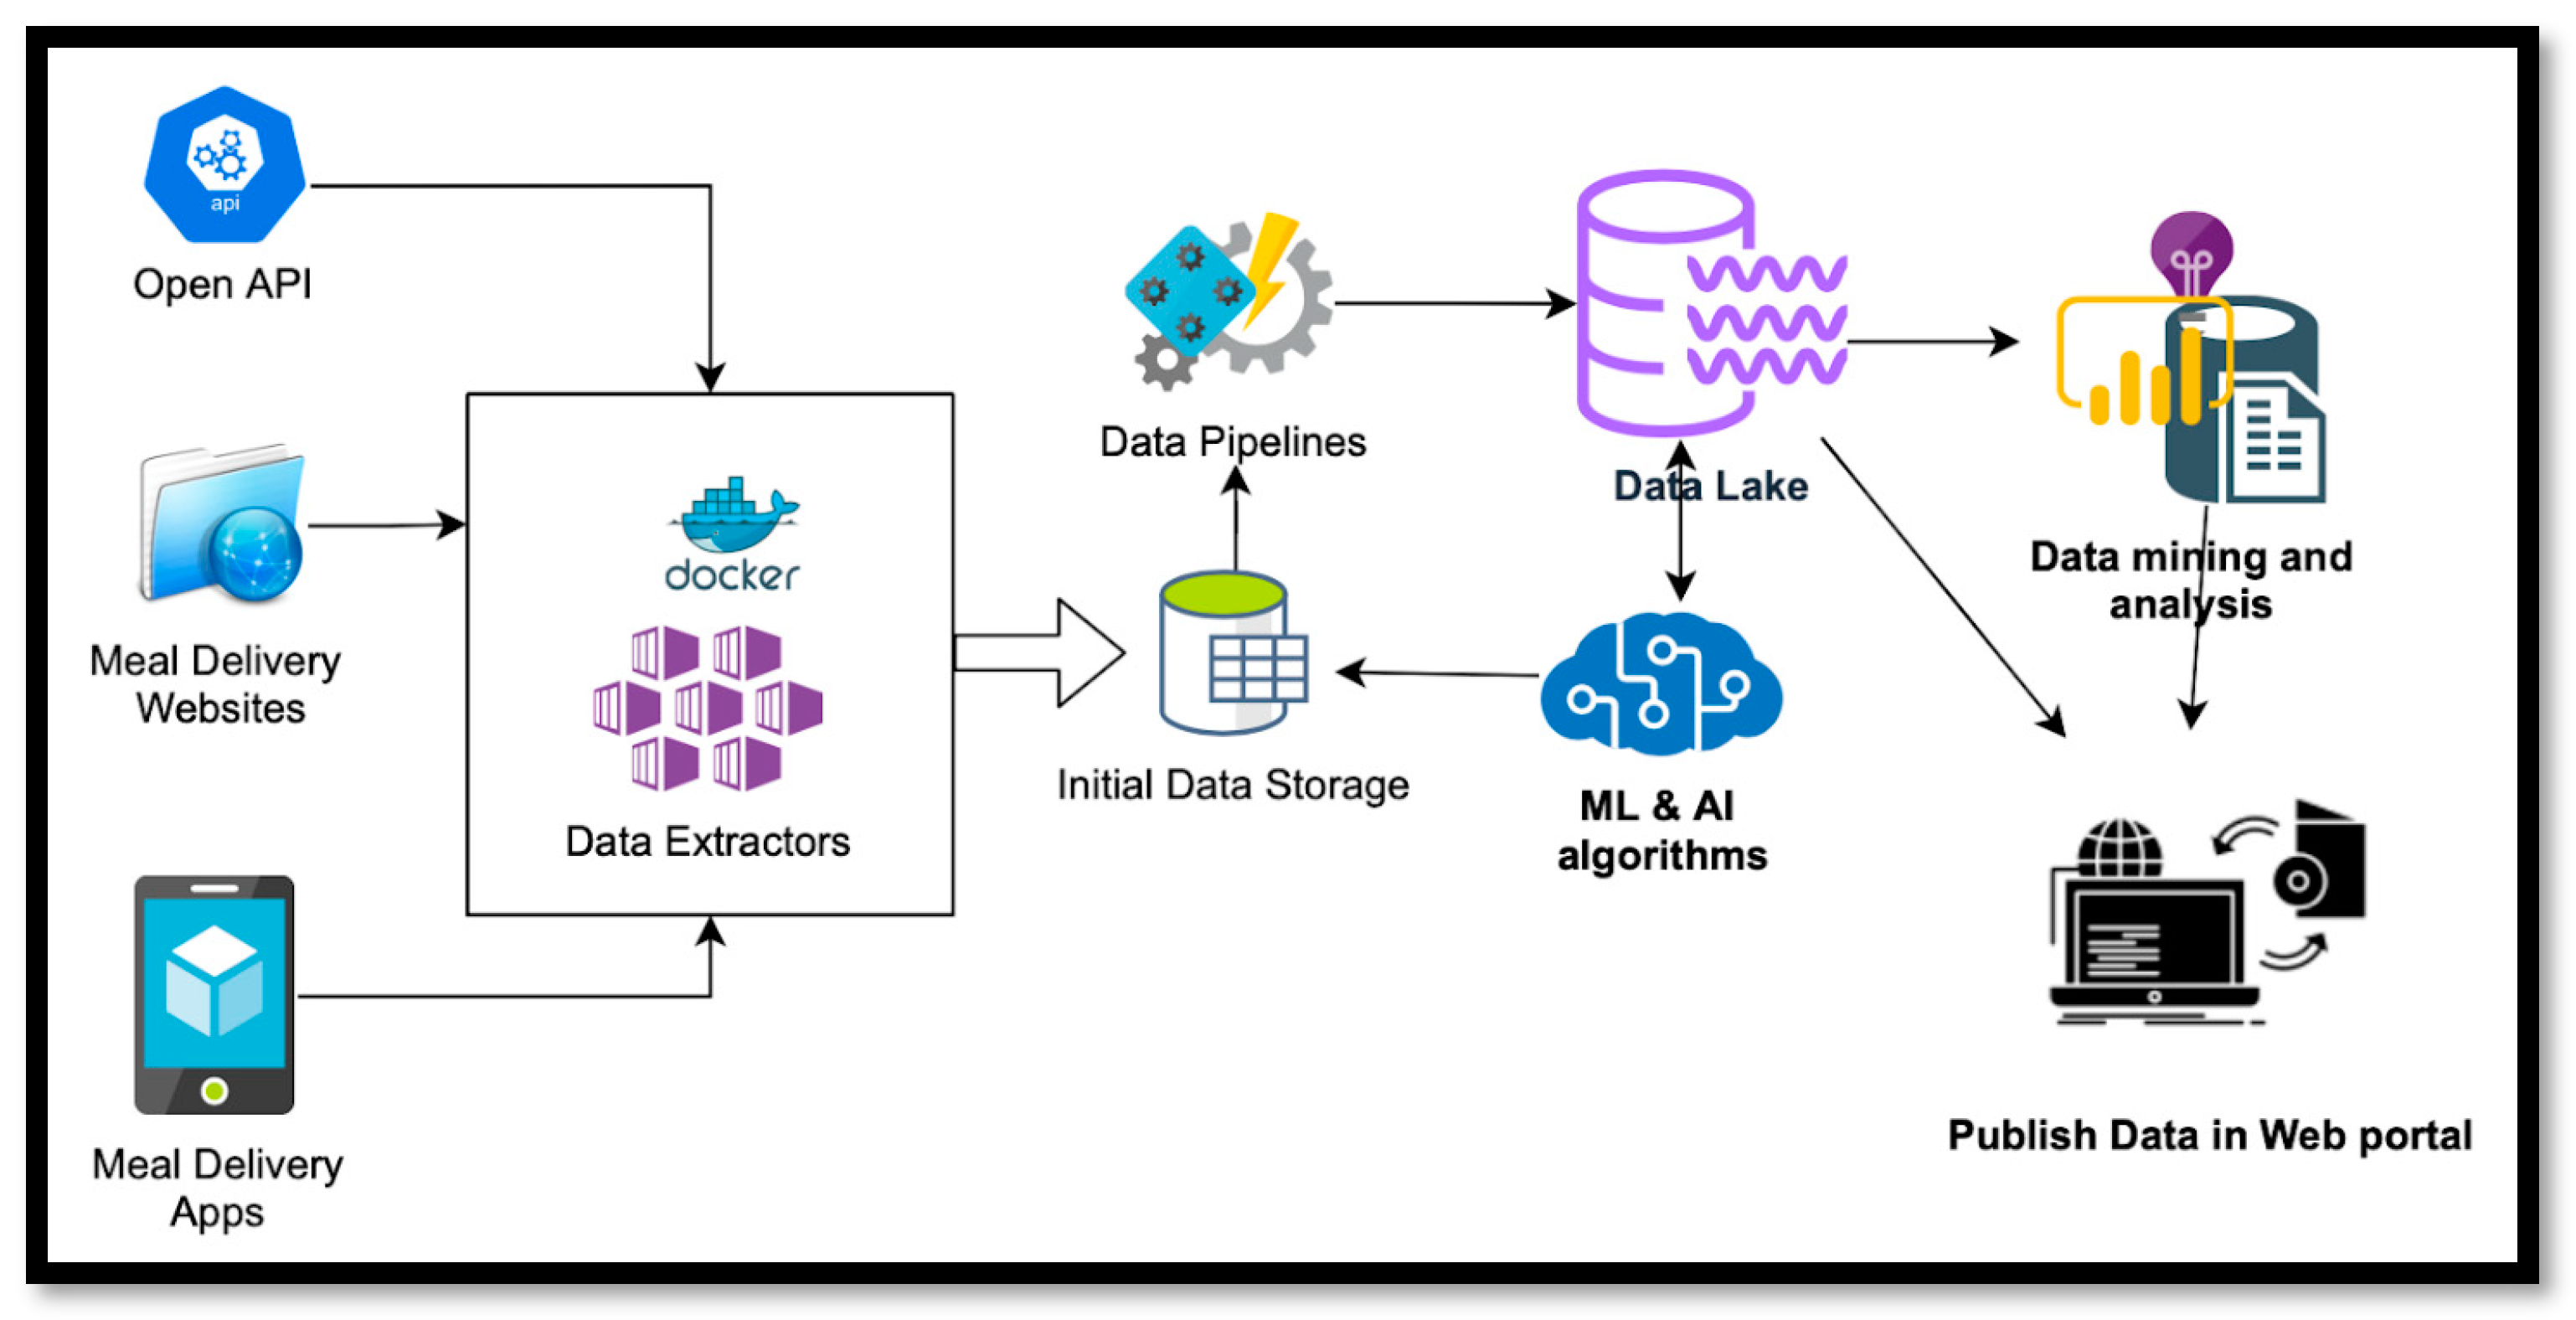
Figure 1 describes the implementation of an MDA data-monitoring platform in the Microsoft Azure cloud platform. The platform includes base data extractors designed to extract data from multiple sources, such as open APIs, websites, and mobile apps. These extractors were extended for each MDA platform by modifying them to suit the unique features of each MDA. Subsequently, data extractors were configured for each county and installed as docker containers, with collected data initially stored in Azure storage. Several data pipelines were developed using Azure functions to process initial data cleansing and upload data to the data lake. Although the collected data formed the basic version of the data lake, there were duplicates and incomplete information, and thus data cleansing was performed to make them available to stakeholders. While traditional data cleansing methods provided a baseline for developing the data cleansing framework, they could not effectively deal with large amounts of data without incorporating AI and machine learning techniques.
Consequently, ML and AI algorithms were employed to identify the same restaurant on different platforms. Although various data cleansing approaches employing AI and machine learning techniques are available, data cleansing remains challenging and requires further research. Finally, a data mining service was developed for initial data analysis, with results stored in a Microsoft SQL database. A PowerBI-based dashboard was created to visualize and share results with policymakers, providing insights into customer behavior, popular restaurants, and trends in the meal delivery industry.
Figure 2 shows a screenshot of the dashboard.
First Results of the OOH Dashboard
The digital OOH food environment-monitoring platform is currently able to extract and use publicly available data from MDAs and fill knowledge gaps on the OOH food environment. Important questions like the most common restaurants in a country/region, the delivery reach per restaurant, or the number of restaurant types per 100,000 inhabitants per region can be assessed. A comparative analysis can be conducted when looking at the calorie information (when provided). Average calories per restaurant/restaurant type or food type can be calculated, and meal types can be compared between restaurants/restaurant types. This will not only help to better understand the digital food environment, including the nutritional value of foods restaurants provide through MDAs, and help consumers to make informed decisions and have the opportunities to compare several dishes and food options but also indicate where policy interventions like labeling policies could support healthier food choices for people using MDAs. However, more online nutrition information is needed to compare the nutritional quality of restaurants when using MDAs. Also, positive nutrients like fiber would be beneficial in assessing the contribution to a healthier diet.
Even though the data platform already contributes greatly to a better understanding of the digital food ecosystem, there are still gaps. MDA platforms do not share individual data, meaning studies on user behavior and consumer data cannot be conducted. This information would be needed to understand how MDAs are used, how certain marketing or promotion strategies work, and how consumer behavior can be influenced to encourage healthier behaviors. Even data analysis with generally available data can be difficult due to missing menu items and the different ways in which they are presented. The biggest problem is the lack of available data in general. As the first country to make information on calories mandatory, the UK set the first step in the right direction. However, more must be done to understand, analyze, and regulate the digital food environment to support populations in having a healthy diet and maintaining a healthy weight. As in the offline food environment, the online food environment needs policies to make regulations mandatory and create a level playing field.
3.4. Example Analyses
Figure 3 shows that pizza places are the most common cuisine type on the MDAs, with nearly 12,500 restaurants. Pizza, burgers, and breakfast are the cuisine types with the most restaurants.
When comparing the number of chains versus independent restaurants by cuisine type, as presented in
Figure 3, independent restaurants dominate the market on MDAs. Only the categories American cuisine, sandwiches, lunch, coffee, alcohol, groceries, burritos, and carvery have a higher number of chain restaurants. The current UK regulation demands restaurants with more than 250 employees to disclose calorie information. Therefore, only larger businesses are affected. The authors believe more research is needed on the impact of alcohol and grocery delivery of prepared foods.
Looking closer at the main chain restaurants by cuisine type,
Figure 4 shows that the five most common chains often make up more than half of the restaurants of one cuisine type. These big chains can therefore influence the online food environment widely. For example, looking at the category sandwiches, the first and second largest chains make up around ¾ of all sandwich restaurants. For lunch places, this trend is even more prominent. For example, 83% of restaurants in the category lunch are from the same chain.
The data platform can calculate average calorie information per cuisine type.
Figure 5 compares the energy density of all chain restaurants with the top three chains and all chains except for the top three chains. The top three chains have the highest energy density, with an average of 201–300 kcal per dish.
The energy density of all food options available on the MDAs can be compared.
Figure 5a shows all chain restaurants. The north of England, Scotland, and Wales seem to have slightly higher average energy values than the rest of the UK.
A substantial change can be observed when filtering for the top three chains in the UK (
Figure 5b). The map changes color throughout the entire UK with average energy values between 301 and 400 kcal. This means that the most popular chains available on MDAs have higher average energy values compared to the rest.
In
Figure 5c, all chains except for the three most common chains show similar average energy values (201–300 kcal) throughout the UK with three exception areas.
The high prevalence of chain restaurants impacts the average energy density.
This trend can also be observed when only taking burger chains, the second most common cuisine type, into account.
Figure 6 shows that the three most popular chains have, on average, higher energy values than less popular chains, with the most popular clearly dominating the market.
Coffee places have a large distribution throughout England and Scotland, mainly driven by the three largest chains. Energy data from coffee places differ from the trend of burger restaurants.
Figure 7 shows that while the top three chains reach all of the UK and have average energy values from 101–200 kcal, the average energy of foodstuffs from coffee places except the top three chains is a lot higher at over 500 kcal, but the reach is mainly in the south and middle of England. One possible explanation might be the significant presence of big coffee chains, while small bakeries or coffee places might have a smaller menu.
Chicken restaurants have a high coverage throughout the entire UK. Chicken cuisine is dominated by popular chain restaurants, as presented in
Figure 8. The top three chains sell products that, on average, have energy values of over 500 kcal and cover nearly the entire UK. At the same time, the remaining restaurants have lower average energy values and also a smaller reach.
Figure 9 shows that pizza places have the same tendencies. While the top three chains have a high reach and higher average energy values, mainly ranging from 301–400 kcal, the less common chains tend to have foods with lower average energy counts.
Comparing cuisine types by their average energy value, as presented in
Figure 10, helps to increase the understanding of the OOH food environment. When comparing average energy values by different cuisine types, which products contribute the most to the average value, how large the product variety is, and how the food contributes to the daily energy intake should be considered.
When analyzing the OOH environment, energy (in kcal) per monetary unit is an important factor to consider. This is essential when discussing equality and access to healthy and nutritious foods in deprived areas.
Figure 11 shows that the categories carvery (98 kcal per GBP 1), coffee (96 kcal per GBP 1), and sandwiches (74 kcal per GBP 1) have the highest amount of kcal available for GBP 1, while peri peri (33 kcal per GBP 1), pizza (37 kcal per GBP 1), and cakes (40 kcal per GBP 1) are on the lower end. Again, the variety of products and a list of the most popular products are necessary to understand consumer behavior.
Appendix A shows a list of cuisine types including their average and maximum energy per menu item/kcal. It also indicates number of chains per cuisine type.
4. Discussion
Food products that are sold in the physical food environment are under stricter regulations in terms of food safety and nutrition declarations compared to the online food environment. Health authorities should not only control food safety but also the healthiness of the food offered in this fast-growing online sector. This is difficult due to missing data like consistent and comparable nutrition information of offered foods like those offered on the back of pack label in the offline food environment, consumer-specific information to understand purchase behaviors of customers, and comparison and analysis of the restaurants offering food online. Without a uniform labeling system, consumers will still not be able to compare food when purchasing online. Nutrition information does not automatically ensure healthy food choices, but it helps consumers to make an informed choice.
The WHO data platform is an important tool that has the ability to extensively improve the understanding and encourage regulation of the OOH food environment. The technology allows the collection and analysis of available data from MDAs. However, the current lack of available nutrition data is challenging.
Currently, the UK only requests companies with more than 250 employees to provide energy values of offered foods. Even though this is a good start, the regulation is not sufficient, and it might be easy for restaurants to find grey areas and loopholes to avoid providing energy information. More in-depth information, as well as standardized, complete, comparable, and transparent data, is needed.
The data platform showed that the majority of restaurants of four out of five cuisine types with the most restaurants on MDAs, which are pizza, breakfast, burgers, and chicken, and the vast majority of restaurants providing food, are independent restaurants. Only American cuisine has more chain restaurants. It is more likely that independent restaurants have fewer employers than chains. Therefore, the UK regulation might not apply to a large number of restaurants.
The presented data from the data platform show the high penetration of fast-food restaurants through MDAs. Even remote areas are within the delivery radius. In the example of England, the main chains tend to have products that are higher in calories on average and cover, with small exemptions, the entire country, making high-calorie products easily accessible.
Nutrient information is needed for consumer information, national regulations, and also marketing-related purposes. MDA data on sponsoring and marketing on the platform as well as the use of push notifications to nudge people into purchasing (more) food, as well as their effect, are relevant as they can influence people’s eating behavior. Regulations making sure healthy food options appear higher on lists or banning pictures of products high in energy might reduce the consumption of unhealthy foods.
Certain information can only be obtained with the support of the MDAs. Consumer-related information, providing insights into consumer behavior, would be essential to structure MDAs in a health-promoting way rather than in a way increasing overconsumption.
The data platform is an important tool to understand people’s eating behavior better as the digital food environment has a large role in populations’ diets and it monitors the environment on a continuous basis.
Due to inconsistent information, comparison and data analysis are currently still tricky. Some restaurants share calorie information per serving, others per 100 g or per portion. In some cases, no exact calorie information is provided or a calorie range is stated, including, e.g., different sizes or stuffing. In those cases, the average value is taken for analysis. Often this information is missing entirely.
5. Conclusions and Next Steps
The paper presented how this WHO platform can support closing the existing data gap in the digital food environment. The platform will be expanded to several countries and other meal delivery apps. In addition, developing an automated tool calculating average values of the most commonly purchased items or meal options is planned.
The platform has the potential to offer Member States a deep understanding of the digital food environment through MDAs. However, regulations are needed to enforce data sharing from MDA providers to public health researchers and governments.
Often the most vulnerable populations live in areas with high numbers of fast-food restaurants, serving food high in salt, fat, and sugar. Data gained from the data platform can help understand the number and distribution of restaurant types in certain areas as well as the average cost per calorie. This information can be used to compare restaurants with high-calorie options and less calorie-dense options and the average socioeconomic status of communities can be linked with the most popular restaurants in the area or by looking at the provision of meals in schools and the types of the most common restaurants in the area to tackle inequalities and to work on policies incentivizing healthy foods. Further, urban planning and healthy city design can be based on these data.
Analyses of topics like marketing on MDAs, understanding of the structure of MDAs, and the system behind the list of restaurants are needed. In some MDAs, options to filter the restaurants for “healthy” are available. This could support consumers making healthy food choices as long as the indicators labeling a food as healthy are clear. Otherwise, any kind of health claim can be included without any evidence. Due to the missing nutrition information, an accurate classification is not possible yet. The development of consistent food classification or food groups in MDAs can be helpful. Regulated portion sizes can also help consumers and especially families to avoid overeating.
If MDAs share their data and work together with the WHO, governments, and nutrition experts, they have a great potential to improve food choices. Policymakers can use the platform to argue for strong policies to protect consumers, share learnings, and compare data with other Member States but also to make MDA providers share essential consumer-related data to understand consumer behavior better. At the same time, food delivery services own extensive information about individual food behaviors of users, which would be essential for public health research to better understand food intake behaviors, influencing factors, and changes over time.
Author Contributions
K.H.: conceptualization, methodology, writing—original draft preparation, N.W.: conceptualization, methodology, software, writing—review and editing, supervision, H.R.: conceptualization, writing—review and editing, supervision, K.W.: conceptualization, writing—review and editing, supervision, O.Z.: writing—review and editing, M.A.U.: visualization, software, C.P.: writing—review and editing, G.G.: supervision, funding acquisition. All authors have read and agreed to the published version of the manuscript.
Funding
This research was funded by the WHO Regional Office for Europe. Funding for the publication was received from Member States in the context of the WHO European Office for the Prevention and Control of Noncommunicable Diseases (NCD Office).
Institutional Review Board Statement
Not applicable.
Informed Consent Statement
Not applicable.
Data Availability Statement
Not applicable.
Conflicts of Interest
The authors declare no conflict of interest. The funders had no role in the design of the study; in the collection, analyses, or interpretation of data; in the writing of the manuscript; or in the decision to publish the results. The authors alone are responsible for the views expressed in this article and they do not necessarily represent the views, decisions, or policies of the institutions with which they are affiliated.
Abbreviations
The following abbreviations are used in this manuscript:
| AI | Artificial intelligence |
| EU | European Union |
| FOPL | Front of pack labeling |
| MDAs | Meal delivery apps |
| NCDs | Noncommunicable diseases |
| NPMs | Nutrient profile models |
| OOH | Out of home food environment |
| WHO | World Health Organization |
| YLDs | Years lived with disability |
Appendix A
The appendix shows the list of cuisine types including their average and maximum energy per menu item/kcal. It also indicates the number of chains per cuisine type.
| Cuisine Type | Energy per Menu Item/kcal | Number of
Chains |
| Average | Maximum |
|---|
| Cakes | 719 | 9426 | 5 |
| Carvery | 657 | 4387 | 4 |
| Desserts | 380 | 9600 | 45 |
| American | 333 | 9600 | 71 |
| Pub Food | 319 | 1726 | 7 |
| Peri Peri | 315 | 7420 | 12 |
| Latin American | 310 | 2336 | 2 |
| Burritos | 300 | 6396 | 12 |
| Mexican | 275 | 6396 | 16 |
| Chicken | 269 | 7420 | 80 |
| Sandwiches | 256 | 4068 | 24 |
| Pizza | 246 | 3755 | 57 |
| Breakfast | 211 | 4068 | 34 |
| Burgers | 210 | 6660 | 102 |
| Pasta | 170 | 1557 | 8 |
| Italian | 167 | 2440 | 49 |
| Coffee | 159 | 4322 | 11 |
| Steak | 156 | 2363 | 6 |
| Tapas | 149 | 1544 | 2 |
| Doughnuts | 149 | 4250 | 4 |
| Ice Cream | 143 | 2314 | 10 |
| Pies | 139 | 2376 | 6 |
| Lunch | 139 | 4322 | 22 |
| Sushi | 127 | 4171 | 8 |
| Lebanese | 120 | 8203 | 5 |
| Continental | 115 | 1400 | 2 |
| Vegan | 114 | 4573 | 17 |
| British | 105 | 4387 | 12 |
| Healthy | 103 | 1960 | 15 |
| BBQ | 90 | 1638 | 5 |
| Salads | 88 | 1960 | 3 |
| Mediterranean | 78 | 8203 | 7 |
| Cafe | 77 | 3721 | 5 |
| Noodles | 75 | 2878 | 9 |
| Middle Eastern | 64 | 1330 | 4 |
| French | 64 | 2142 | 3 |
| Bagels | 62 | 667 | 2 |
| Tex-Mex | 62 | 1969 | 2 |
| English | 62 | 1849 | 4 |
| Brunch | 61 | 1174 | 2 |
| Japanese | 57 | 4171 | 13 |
| Sweets | 56 | 1267 | 6 |
| Kebab | 56 | 4943 | 9 |
| Asian | 55 | 2027 | 18 |
| Street Food | 52 | 3312 | 7 |
| Local Legends | 50 | 6660 | 24 |
| Chinese | 48 | 1223 | 17 |
| Italian Pizza | 45 | 1526 | 2 |
| Smoothies | 44 | 874 | 2 |
| Fish & Chips | 41 | 2024 | 7 |
| Seafood | 39 | 1500 | 2 |
| Milkshakes | 37 | 4560 | 12 |
| European | 34 | 2400 | 6 |
| Roast Dinners | 26 | 4387 | 2 |
| Indian | 19 | 1306 | 18 |
| Bakery | 17 | 4560 | 2 |
| Bubble Tea | 17 | 816 | 3 |
| Korean | 17 | 1068 | 9 |
| Vegetarian | 16 | 4560 | 4 |
| Brazilian food | 16 | 801 | 2 |
| Waffles | 14 | 1247 | 3 |
| Sri Lankan | 12 | 10,000 | 2 |
| Fast Food | 10 | 1271 | 6 |
| Polish | 9 | 2400 | 1 |
| Groceries | 6 | 1289 | 9 |
| Alcohol | 6 | 1289 | 9 |
| Thai | 5 | 1372 | 7 |
| Grill | 4 | 2440 | 7 |
References
- World Health Organization; Regional Office for Europe. First Meeting of the Regional Director’s Advisory Council on Innovation for Noncommunicable Diseases: Virtual Meeting, 14 December 2020: Meeting Report; Regional Office for Europe: Copenhagen, Denmark, 2021. Available online: https://apps.who.int/iris/handle/10665/339903 (accessed on 4 April 2023).
- World Health Organization; Regional Office for Europe. WHO European Regional Obesity Report 2022; Regional Office for Europe: Copenhagen, Denmark, 2022. Available online: https://apps.who.int/iris/handle/10665/353747 (accessed on 4 April 2023).
- World Health Organization; Regional Office for Europe. The Out-of-Home Food Environment: Report of a WHO Regional Office for Europe and Public Health England Expert Meeting, 10 June 2021; Regional Office for Europe: Copenhagen, Denmark, 2022. Available online: https://apps.who.int/iris/handle/10665/356899 (accessed on 4 April 2023).
- World Health Assembly 69. Report of the Commission on Ending Childhood Obesity: Report by the Director-General; World Health Organization: Geneva, Switzerland, 2016. Available online: https://apps.who.int/iris/handle/10665/252659 (accessed on 4 April 2023).
- World Health Organization. The Out-of-Home Food Sector—Exponential Growth in an Unregulated Market. Available online: https://www.euro.who.int/en/health-topics/disease-prevention/nutrition/news/news/2021/9/the-out-of-home-food-sector-exponential-growth-in-an-unregulated-market (accessed on 4 January 2023).
- Department for Environment Food & Rural Affairs. National Statistics. Family Food 2018/19; Department for Environment Food & Rural Affairs: London, UK, 2020. Available online: https://www.gov.uk/government/statistics/family-food-201819/family-food-201819 (accessed on 5 July 2023).
- Keeble, M.; Adams, J.; Sacks, G.; Vanderlee, L.; White, C.M.; Hammond, D.; Burgoine, T. Use of Online Food Delivery Services to Order Food Prepared Away-From-Home and Associated Sociodemographic Characteristics: A Cross-Sectional, Multi-Country Analysis. Int. J. Environ. Res. Public Health 2020, 17, 5190. [Google Scholar] [CrossRef] [PubMed]
- Adams, J.; Goffe, L.; Brown, T.; A Lake, A.; Summerbell, C.; White, M.; Wrieden, W.; Adamson, A.J. Frequency and socio-demographic correlates of eating meals out and take-away meals at home: Cross-sectional analysis of the UK national diet and nutrition survey, waves 1–4 (2008–2012). Int. J. Behav. Nutr. Phys. Act. 2015, 12, 51. [Google Scholar] [CrossRef] [PubMed]
- Robinson, E.; Jones, A.; Whitelock, V.; Mead, B.R.; Haynes, A. (Over)eating out at major UK restaurant chains: Observational study of energy content of main meals. BMJ 2018, 363, k4982. [Google Scholar] [CrossRef] [PubMed]
- World Health Organization; Regional Office for Europe. Toolkit for Tackling Misinformation on Noncommunicable Disease: Forum for Tackling Misinformation on Health and NCDs; Regional Office for Europe: Copenhagen, Denmark, 2022. Available online: https://apps.who.int/iris/handle/10665/363688 (accessed on 1 August 2023).
- World Health Organization; Regional Office for Europe. Digital food Environments: Factsheet; Regional Office for Europe: Copenhagen, Denmark, 2021. Available online: https://apps.who.int/iris/handle/10665/342072 (accessed on 4 April 2023).
- World Health Organization; Regional Office for Europe. Manual to Develop and Implement Front-of-Pack Nutrition Labelling: Guidance for Countries on the Selection and Testing of Evidence-Informed Front-of-Pack Nutrition Labelling Systems in the WHO European Region; Regional Office for Europe: Copenhagen, Denmark, 2020. Available online: https://apps.who.int/iris/handle/10665/336988 (accessed on 4 April 2023).
- World Health Organization; Regional Office for Europe. Slide to Order: A Food Systems Approach to Meals Delivery Apps: WHO European Office for the Prevention and Control of Noncommunicable Diseases; World Health Organization: Copenhagen, Denmark; Regional Office for Europe: Copenhagen, Denmark, 2021. Available online: https://apps.who.int/iris/handle/10665/350121 (accessed on 4 April 2023).
- Norriss, D.; Crossin, R.; Curl, A.; Bidwell, S.; Clark, E.; Pocock, T.; Gage, R.; McKerchar, C. Food Outlet Access and the Healthiness of Food Available ‘On-Demand’ via Meal Delivery Apps in New Zealand. Nutrients 2022, 14, 4228. [Google Scholar] [CrossRef] [PubMed]
- Poelman, M.P.; Thornton, L.; Zenk, S.N. A cross-sectional comparison of meal delivery options in three international cities. Eur. J. Clin. Nutr. 2020, 74, 1465–1473. [Google Scholar] [CrossRef] [PubMed]
- Horta, P.M.; Souza, J.d.P.M.; Rocha, L.L.; Mendes, L.L. Digital food environment of a Brazilian metropolis: Food availability and marketing strategies used by delivery apps. Public Health Nutr. 2020, 24, 544–548. [Google Scholar] [CrossRef] [PubMed]
- Partridge, S.R.; Gibson, A.A.; Roy, R.; Malloy, J.A.; Raeside, R.; Jia, S.S.; Singleton, A.C.; Mandoh, M.; Todd, A.R.; Wang, T.; et al. Junk Food on Demand: A Cross-Sectional Analysis of the Nutritional Quality of Popular Online Food Delivery Outlets in Australia and New Zealand. Nutrients 2020, 12, 3107. [Google Scholar] [CrossRef] [PubMed]
- Regulation (EU) No 1169/2011 of the European Parliament and of the Council of 25 October 2011 on the Provision of Food Information to Consumers, Amending Regulations (EC) No 1924/2006 and (EC) No 1925/2006 of the European Parliament and of the Council, and Repealing Commission Directive 87/250/EEC, Council Directive 90/496/EEC, Commission Directive 1999/10/EC, Directive 2000/13/EC of the European Parliament and of the Council, Commission Directives 2002/67/EC and 2008/5/EC and Commission Regulation (EC) No 608/2004 Text with EEA relevance. Official Journal of the European Union. 2011. Available online: http://data.europa.eu/eli/reg/2011/1169/oj (accessed on 2 June 2023).
- World Health Organization; Regional Office for Europe. A Systems Approach to Meal Delivery Apps (MDAs): WHO European Office for the Prevention and Control of Noncommunicable Diseases; Regional Office for Europe: Copenhagen, Denmark, 2021. Available online: https://apps.who.int/iris/handle/10665/350134 (accessed on 4 April 2023).
- Bates, S.; Reeve, B.; Trevena, H. A narrative review of online food delivery in Australia: Challenges and opportunities for public health nutrition policy. Public Health Nutr. 2023, 26, 262–272. [Google Scholar] [CrossRef] [PubMed]
- Duthie, C.; Pocock, T.; Curl, A.; Clark, E.; Norriss, D.; Bidwell, S.; McKerchar, C.; Crossin, R. Online on-demand delivery services of food and alcohol: A scoping review of public health impacts. SSM Popul. Health 2023, 21, 101349. [Google Scholar] [CrossRef] [PubMed]
- World Health Organization; Regional Office for Europe. Using Third-Party Food Sales and Composition Databases to Monitor Nutrition Policies; Regional Office for Europe: Copenhagen, Denmark, 2021. Available online: https://apps.who.int/iris/handle/10665/339075 (accessed on 4 April 2023).
- New Calorie Labelling Rules Come into Force to Improve Nation’s Health; Department of Health and Social Care: London, UK, 2022. Available online: https://www.gov.uk/government/news/new-calorie-labelling-rules-come-into-force-to-improve-nations-health#:~:text=Calorie%20information%20will%20need%20to,include%20daily%20recommended%20calorie%20needs (accessed on 2 June 2023).
- Huang, Y.; Burgoine, T.; Essman, M.; Theis, D.R.Z.; Bishop, T.R.P.; Adams, J. Monitoring the Nutrient Composition of Food Prepared Out-of-Home in the United Kingdom: Database Development and Case Study. JMIR Public Health Surveill. 2022, 8, e39033. [Google Scholar] [CrossRef] [PubMed]
- Huang, Y.; Burgoine, T.; Theis, D.R.; Adams, J. Differences in energy and nutrient content of menu items served by large chain restaurants in the USA and the UK in 2018. Public Health Nutr. 2022, 25, 2671–2679. [Google Scholar] [CrossRef] [PubMed]
- Huang, Y.; Theis, D.R.Z.; Burgoine, T.; Adams, J. Trends in energy and nutrient content of menu items served by large UK chain restaurants from 2018 to 2020: An observational study. BMJ Open 2021, 11, e054804. [Google Scholar] [CrossRef]
| Disclaimer/Publisher’s Note: The statements, opinions and data contained in all publications are solely those of the individual author(s) and contributor(s) and not of MDPI and/or the editor(s). MDPI and/or the editor(s) disclaim responsibility for any injury to people or property resulting from any ideas, methods, instructions or products referred to in the content. |
© 2023 by the authors. Licensee MDPI, Basel, Switzerland. This article is an open access article distributed under the terms and conditions of the Creative Commons Attribution (CC BY) license (https://creativecommons.org/licenses/by/4.0/).


 ,
, 