
Pro-Inflammatory Diet Is Correlated with High Veillonella rogosae, Gut Inflammation and Clinical Relapse of Inflammatory Bowel Disease
 , , , , ,
  , and
, and
Abstract
:1. Introduction
2. Materials and Methods
2.1. Ethical Issues
2.2. Participants
2.3. Dietary Intake and DII Analysis
2.4. Demographic and Clinical Variables
2.5. Gut Microbiota Analysis
2.6. Markers of Gut and Systemic Inflammation
2.6.1. Fecal Zonulin and Calprotectin
2.6.2. Serum 25-Hydroxivitamin D [25(OH)D] and C-Reactive Protein
2.7. Statistical Analysis
3. Results
3.1. Descriptive Data of IBD Patients
3.2. Descriptive Data of IBD Patients According to Their DII Allocation
3.3. GM Composition According to DII Allocation
3.4. DII, Gut Microbiota, and Inflammatory Markers in the Prediction of IBD Relapse
4. Discussion
5. Conclusions
Supplementary Materials
Author Contributions
Funding
Institutional Review Board Statement
Informed Consent Statement
Data Availability Statement
Acknowledgments
Conflicts of Interest
References
- Ng, S.C.; Shi, H.Y.; Hamidi, N.; Underwood, F.E.; Tang, W.; Benchimol, E.I.; Panaccione, R.; Ghosh, S.; Wu, J.C.Y.; Chan, F.K.L.; et al. Articles worldwide incidence and prevalence of Inflammatory Bowel Disease in the 21st century: A systematic review of population-based studies. Lancet 2017, 390, 2769–2778. [Google Scholar] [CrossRef] [PubMed]
- Ramos, G.P.; Papadakis, K.A. Mechanisms of disease: Inflammatory bowel diseases. In Mayo Clinic Proceedings; Elsevier: Amsterdam, The Netherlands, 2019; Volume 94, pp. 155–165. [Google Scholar]
- Fiocchi, C. Inflammatory Bowel Disease: Complexity and Variability Need Integration. Front. Med. 2018, 5, 75. [Google Scholar] [CrossRef] [PubMed]
- Guardiola, J.; Lobatón, T.; Rodríguez-Alonso, L.; Ruiz-Cerulla, A.; Arajol, C.; Loayza, C.; Sanjuan, X.; Sánchez, E.; Rodríguez-Moranta, F. Fecal level of calprotectin identifies histologic inflammation in patients with ulcerative colitis in clinical and endoscopic remission. Clin. Gastroenterol. Hepatol. 2014, 12, 1865–1870. [Google Scholar] [CrossRef] [PubMed]
- Mosli, M.H.; Zou, G.; Garg, S.K.; Feagan, S.G.; MacDonald, J.K.; Chande, N.; Sandborn, W.J.; Feagan, B.G. C-Reactive Protein, Fecal Calprotectin, and Stool Lactoferrin for Detection of Endoscopic Activity in Symptomatic Inflammatory Bowel Disease Patients: A Systematic Review and Meta-Analysis. Am. J. Gastroenterol. 2015, 110, 802–819. [Google Scholar] [CrossRef] [PubMed]
- Liu, F.; Lee, S.A.; Riordan, S.M.; Zhang, L.; Zhu, L. Global Studies of Using Fecal Biomarkers in Predicting Relapse in Inflam-matory Bowel Disease. Front. Med. 2020, 7, 580803. [Google Scholar] [CrossRef]
- Khalil, H.; Sherwood, P. PTH-034 Do fecal calprotectin levels influence colonoscopy rates? Gut 2018, 67, A29. [Google Scholar]
- Yang, R.X.; Song, W.J.; Wu, Z.Q.; Goyal, H.; Xu, H.G. Association of Serum Neuron-Specific Enolase and C-Reactive Protein With Disease Location and Endoscopic Inflammation Degree in Patients With Crohn’s Disease. Front. Med. 2021, 8, 663920. [Google Scholar] [CrossRef]
- Fasano, A. All disease begins in the (leaky) gut: Role of zonulin-mediated gut permeability in the pathogenesis of some chronic inflammatory diseases. F1000Research 2020, 9, F1000 Faculty Rev-69. [Google Scholar] [CrossRef]
- Ananthakrishnan, A.N.; Bernstein, C.N.; Iliopoulos, D.; Macpherson, A.; Neurath, M.F.; Ali, R.A.R.; Vavricka, S.R.; Fiocchi, C. Environmental triggers in IBD: A review of progress and evidence. Nat. Rev. Gastroenterol. Hepatol. 2018, 15, 39–49. [Google Scholar] [CrossRef]
- Kordjazy, N.; Haj-Mirzaian, A.; Haj-Mirzaian, A.; Rohani, M.M.; Gelfand, E.W.; Rezaei, N.; Abdolghaffari, A.H. Role of toll-like receptors in inflammatory bowel disease. Pharmacol. Res. 2018, 129, 204–215. [Google Scholar] [CrossRef]
- Larussa, T.; Imeneo, M.; Luzza, F. Potential role of nutraceutical compounds in inflammatory bowel disease. World J. Gastroenterol. 2017, 23, 2483–2492. [Google Scholar] [CrossRef] [PubMed]
- Rizzello, F.; Spisni, E.; Giovanardi, E.; Imbesi, V.; Salice, M.; Alvisi, P.; Valerii, M.C.; Gionchetti, P. Implications of the Westernized Diet in the Onset and Progression of IBD. Nutrients 2019, 11, 1033. [Google Scholar] [CrossRef]
- Rajilic-Stojanovic, M.; Jonkers, D.M.; Salonen, A.; Hanevik, K.; Raes, J.; Jalanka, J.; de Vos, W.M.; Manichanh, C.; Golic, N.; Enck, P.; et al. Intestinal microbiota and diet in IBS: Causes, consequences, or epiphenomena? Am. J. Gastroenterol. 2015, 110, 278–287. [Google Scholar] [CrossRef] [PubMed]
- Zheng, J.; Hoffman, K.L.; Chen, J.S.; Shivappa, N.; Sood, A.; Browman, G.J.; Dirba, D.D.; Hanash, S.; Wei, P.; Hebert, J.R.; et al. Dietary inflammatory potential in relation to the gut microbiome: Results from a cross-sectional study. Br. J. Nutr. 2020, 124, 931–942. [Google Scholar] [CrossRef] [PubMed]
- Mentella, M.C.; Scaldaferri, F.; Pizzoferrato, M.; Gasbarrini, A.; Miggiano, G.A.D. Nutrition, IBD and Gut Microbiota: A Review. Nutrients 2020, 12, 944. [Google Scholar] [CrossRef]
- Bertani, L.; Ribaldone, D.G.; Bellini, M.; Mumolo, M.G.; Costa, F. Inflammatory Bowel Diseases: Is There a Role for Nutritional Suggestions? Nutrients 2021, 13, 1387. [Google Scholar] [CrossRef]
- Witkowski, M.; Witkowski, M.; Gagliani, N.; Huber, S. Recipe for IBD: Can we use food to control inflammatory bowel disease? Semin. Immunopathol. 2018, 40, 145–156. [Google Scholar] [CrossRef]
- Tian, Z.; Zhuang, X.; Zhao, M.; Zhuo, S.; Li, X.; Ma, R.; Li, N.; Liu, C.; Zhu, Y.; Tang, C.; et al. Index-Based Dietary Patterns and Inflammatory Bowel Disease: A Systematic Review of Observational Studies. Adv. Nutr. 2021, 12, 2288–2300. [Google Scholar] [CrossRef]
- Lewis, J.D.; Abreu, M.T. Diet as a trigger or therapy for inflammatory bowel diseases. Gastroenterology 2017, 152, 398–414.e6. [Google Scholar] [CrossRef]
- Shivappa, N.; Steck, S.E.; Hurley, T.G.; Hussey, J.R.; Hébert, J.R. Designing and developing a literature-derived, population-based dietary inflammatory index. Public Health Nutr. 2014, 17, 1689–1696. [Google Scholar] [CrossRef]
- Cronin, P.; Joyce, S.A.; O’Toole, P.W.; O’Connor, E.M. Dietary Fibre Modulates the Gut Microbiota. Nutrients 2021, 13, 1655. [Google Scholar] [CrossRef] [PubMed]
- Fuke, N.; Nagata, N.; Suganuma, H.; Ota, T. Regulation of Gut Microbiota and Metabolic Endotoxemia with Dietary Factors. Nutrients 2019, 11, 2277. [Google Scholar] [CrossRef] [PubMed]
- Magro, F.; Gionchetti, P.; Eliakim, R.; Ardizzone, S.; Armuzzi, A.; Barreiro-de Acosta, M.; Burisch, J.; Gecse, K.B.; Hart, A.L.; European Crohn’s and Colitis Organisation [ECCO]; et al. Third European evi-dence-based consensus on diagnosis and management of ulcerative colitis. Part 1: Definitions, diagnosis, extra-intestinal manifestations, pregnancy, cancer surveillance, surgery, and ileo-anal pouch disorders. J. Crohn’s Colitis 2017, 11, 649–670. [Google Scholar] [CrossRef] [PubMed]
- Gomollón, F.; Dignass, A.; Annese, V.; Tilg, H.; Van Assche, G.; Lindsay, J.O.; Peyrin-Biroulet, L.; Cullen, G.J.; Daperno, M.; Kucharzik, T.; et al. 3rd European evidence-based consensus on the diagnosis and management of Crohn’s disease 2016: Part 1: Diagnosis and medical management. J. Crohn’s Colitis 2017, 11, 3–25. [Google Scholar] [CrossRef]
- Harvey, R.F.; Bradshaw, M.J. Measuring Crohn’s disease activity. Lancet 1980, 1, 1134–1135. [Google Scholar] [CrossRef]
- Sandborn, W.J.; van Assche, G.; Reinisch, W.; Colombel, J.; D’haens, G.; Wolf, D.C.; Kron, M.; Tighe, M.B.; Lazar, A.; Thakkar, R.B. Adalimumab induces and maintains clinical remission in patients with moderate-to-severe ulcerative colitis. Gastroenterology 2012, 142, 257–265. [Google Scholar] [CrossRef]
- Ma, Y.; Olendzki, B.C.; Pagoto, S.L.; Hurley, T.G.; Magner, R.P.; Ockene, I.S.; Schneider, K.L.; Merriam, P.A.; Hébert, J.R. Number of 24-hour diet recalls needed to estimate energy intake. Ann. Epidemiol. 2009, 19, 553–559. [Google Scholar] [CrossRef]
- Brazilian Institute of Geography and Statistics (IBGE). Table of Measures Referred to the Foods Consumed in Brazil; IBGE: Rio de Janeiro, Brazil, 2011. [Google Scholar]
- US Department of Agriculture. USDA Database for the Flavonoid Content of Selected Foods: Release 3.2; USDA: Beltsvile, MD, USA, 2015; 173p. [Google Scholar]
- The Multiple Source Method (MSM). Department of Epidemiology of the German Institute of Human Nutrition Potsdam-Rehbrücke (DiFE). 2011. Available online: https://nugo.dife.de/msm (accessed on 1 June 2023).
- Haubrock, J.; Hartigg, U.; Souverein, O.; Boeing, H. An improved statistical tool for estimating usual intake distributions: The multiple source method (MSM). Arch. Public Health 2010, 68, 14–15. [Google Scholar]
- WHO Expert Committee. World Health Organization Technical Report Series; WHO: Geneva, Switzerland, 1995; Volume 854, pp. 1–452. [Google Scholar]
- Callahan, B.J.; McMurdie, P.J.; Rosen, M.J.; Han, A.W.; Johnson, A.J.; Holmes, S.P. DADA2: High-resolution sample inference from Illumina amplicon data. Nat. Methods 2016, 13, 581–583. [Google Scholar] [CrossRef]
- Quast, C.; Pruesse, E.; Yilmaz, P.; Gerken, J.; Schweer, T.; Yarza, P. SILVA ribosomal RNA gene database project: Improved data processing and web-based tools. Nucleic Acids Res. 2013, 41, 590–596. [Google Scholar] [CrossRef]
- Bourgonje, A.R.; Bolte, L.A.; Vranckx, L.L.C.; Spekhorst, L.M.; Gacesa, R.; Hu, S.; van Dullemen, H.M.; Visschedijk, M.C.; Festen, E.A.M.; Samsom, J.N.; et al. Long-Term Dietary Patterns Are Reflected in the Plasma Inflammatory Proteome of Patients with Inflammatory Bowel Disease. Nutrients 2022, 14, 2522. [Google Scholar] [CrossRef] [PubMed]
- Gevers, D.; Kugathasan, S.; Denson, L.A.; Vázquez-Baeza, Y.; Van Treuren, W.; Ren, B.; Schwager, E.; Knights, D.; Song, S.J.; Yassour, M.; et al. The treatment-naive microbiome in new-onset Crohn’s disease. Cell Host Microbe 2014, 15, 382–392. [Google Scholar] [CrossRef] [PubMed]
- Bolte, L.A.; Vich Vila, A.; Imhann, F.; Collij, V.; Gacesa, R.; Peters, V.; Wijmenga, C.; Kurilshikov, A.; Campmans-Kuijpers, M.J.E.; Fu, J.; et al. Long-term dietary patterns are associated with pro-inflammatory and anti-inflammatory features of the gut microbiome. Gut 2021, 70, 1287–1298. [Google Scholar] [CrossRef]
- Khalili, H.; Chan, S.S.M.; Lochhead, P.; Ananthakrishnan, A.N.; Hart, A.R.; Chan, A.T. The role of diet in the aetiopathogenesis of inflammatory bowel disease. Nat. Rev. Gastroenterol. Hepatol. 2018, 15, 525–535. [Google Scholar] [CrossRef] [PubMed]
- Lamers, C.R.; de Roos, N.M.; Witteman, B.J.M. The association between inflammatory potential of diet and disease activity: Results from a cross-sectional study in patients with inflammatory bowel disease. BMC Gastroenterol. 2020, 20, 316. [Google Scholar] [CrossRef]
- Vagianos, K.; Shafer, L.A.; Witges, K.; Targownik, L.E.; Haviva, C.; Graff, L.A. Association between change in inflammatory aspects of diet and change in IBD-related inflammation and symptoms over 1 Year: The manitoba living with IBD study. Inflamm. Bowel Dis. 2021, 27, 190–202. [Google Scholar] [CrossRef]
- de Graaf, M.C.G.; Spooren, C.E.G.M.; Hendrix, E.M.B.; Hesselink, M.A.M.; Feskens, E.J.M.; Smolinska, A.; Keszthelyi, D.; Pierik, M.J.; Mujagic, Z.; Jonkers, D.M.A.E. Diet Quality and Dietary Inflammatory Index in Dutch Inflammatory Bowel Disease and Irritable Bowel Syndrome Patients. Nutrients 2022, 14, 1945. [Google Scholar] [CrossRef]
- Jukic, A.; Bakiri, L.; Wagner, E.F.; Tilg, H.; Adolph, T.E. Calprotectin: From biomarker to biological function. Gut 2021, 70, 1978–1988. [Google Scholar] [CrossRef]
- Freeman, K.; Willis, B.H.; Fraser, H.; Taylor-Phillips, S.; Clarke, A. Fecal calprotectin to detect inflammatory bowel disease: A systematic review and exploratory meta-analysis of test accuracy. BMJ Open 2019, 9, e027428. [Google Scholar] [CrossRef]
- Zmora, N.; Suez, J.; Elinav, E. You are what you eat: Diet, health and the gut microbiota. Nat. Rev. Gastroenterol. Hepatol. 2019, 16, 35–56. [Google Scholar] [CrossRef]
- Tian, Z.; Zhuang, X.; Zhuo, S.; Zhu, Y.; Hu, S.; Zhao, M.; Tang, C.; Zhang, Z.; Li, X.; Ma, R.; et al. Dietary inflammatory potential mediated gut microbiota and metabolite alterations in Crohn’s disease: A fire-new perspective. Clin. Nutr. 2022, 41, 1260–1271. [Google Scholar] [CrossRef] [PubMed]
- Poppleton, D.I.; Duchateau, M.; Hourdel, V.; Matondo, M.; Flechsler, J.; Klingl, A.; Beloin, C.; Gribaldo, S. Outer membrane proteome of Veillonella parvula: A diderm firmicute of the human microbiome. Front. Microbiol 2017, 8, 1215. [Google Scholar] [CrossRef] [PubMed]
- Li, J.; Wang, H.; Li, N.; Zhang, Y.; Lü, X.; Liu, B. Antibiotic susceptibility and biofilm-forming ability of Veillonella strains. Anaerobe 2022, 78, 102667. [Google Scholar] [CrossRef] [PubMed]
- Pittayanon, R.; Lau, J.T.; Leontiadis, G.I.; Tse, F.; Yuan, Y.; Surette, M.; Moayyedi, P. Differences in gut microbiota in patients with vs without inflammatory bowel diseases: A systematic review. Gastroenterology 2020, 158, 930–946.e1. [Google Scholar] [CrossRef]
- Rai, A.K.; Panda, M.; Das, A.K.; Rahman, T.; Das, R.; Das, K.; Sarma, A.; Kataki, A.C.; Chattopadhyay, I. Dysbiosis of salivary microbiome and cytokines influence oral squamous cell carcinoma through inflammation. Arch. Microbiol. 2021, 203, 13. [Google Scholar] [CrossRef]
- Das, P.; Marcisauskas, S.; Ji, B.; Nielsen, J. Metagenomic analysis of bile salt biotransformation in the human gut microbiome. BMC Genom. 2019, 20, 517. [Google Scholar] [CrossRef]
- Levine, A.; Wine, E.; Assa, A.; Boneh, R.S.; Shaoul, R.; Kori, M.; Cohen, S.; Peleg, S.; Shamaly, H.; On, A.; et al. Crohn’s Disease Exclusion Diet Plus Partial Enteral Nutrition Induces Sustained Remission in a Randomized Controlled Trial. Gastroenterology 2019, 157, 440–450. [Google Scholar] [CrossRef]
- Cui, Y.; Zhang, L.; Wang, X.; Yi, Y.; Shan, Y.; Liu, B.; Zhou, Y.; Lü, X. Roles of intestinal Parabacteroides in human health and diseases. FEMS Microbiol. Lett. 2022, 369, fnac072. [Google Scholar] [CrossRef]
- Dione, N.; Rathored, J.; Tomei, E.; Lagier, J.-C.; Khelaifia, S.; Robert, C.; Bretelle, F.; Raoult, D.; Fournier, P.-E.; Fenollar, F. Dakarella massiliensis gen. nov., sp. nov., strain ND3T: A new bacterial genus isolated from the female genital tract. New Microbes New Infect. 2017, 18, 38–46. [Google Scholar] [CrossRef]
- Kaakoush, N.O. Sutterella Species, IgA-degrading Bacteria in Ulcerative Colitis. Trends Microbiol. 2020, 28, 519–522. [Google Scholar] [CrossRef]
- Butera, A.; Di Paola, M.; Vitali, F.; De Nitto, D.; Covotta, F.; Borrini, F.; Pica, R.; De Filippo, C.; Cavalieri, D.; Giuliani, A.; et al. IL-13 mRNA Tissue Content Identifies Two Subsets of Adult Ulcerative Colitis Patients With Different Clinical and Mucosa-Associated Microbiota Profiles. J. Crohn’s Colitis 2020, 14, 369–380. [Google Scholar] [CrossRef] [PubMed]
- Malíčková, K.; Francová, I.; Lukáš, M.; Kolář, M.; Králíková, E.; Bortlík, M.; Ďuricová, D.; Štěpánková, S.; Zvolská, K.; Zima, T.; et al. Fecal zonulin is elevated in crohn’s disease and in cigarette smokers. Pract. Lab. Med. 2017, 9, 39–44. [Google Scholar] [CrossRef] [PubMed]
- Caviglia, G.P.; Dughera, F.; Ribaldone, D.G.; Rosso, C.; Abate, M.L.; Pellicano, R.; Francesca, B.; Antonina, S.; Giorgio, M.S.; Marco, A. Serum zonulin in patients with inflammatory bowel disease: A pilot study. Minerva Medica 2019, 110, 95–100. [Google Scholar] [CrossRef] [PubMed]
- Bian, D.; Liu, X.; Wang, C.; Jiang, Y.; Gu, Y.; Zhong, J.; Shi, Y. Association between Dietary Inflammatory Index and Sarcopenia in Crohn’s Disease Patients. Nutrients 2022, 14, 901. [Google Scholar] [CrossRef]
- Guo, X.; Huang, C.; Xu, J.; Xu, H.; Liu, L.; Zhao, H.; Wang, J.; Huang, W.; Peng, W.; Chen, Y.; et al. Gut Microbiota Is a Potential Biomarker in Inflammatory Bowel Disease. Front. Nutr. 2022, 8, 818902. [Google Scholar] [CrossRef]
- Ribaldone, D.G.; Pellicano, R.; Actis, G.C. Inflammation in gastrointestinal disorders: Prevalent socioeconomic factors. Clin. Exp. Gastroenterol. 2019, 12, 321–329. [Google Scholar] [CrossRef]
- Mirmiran, P.; Moslehi, N.; Morshedzadeh, N.; Shivappa, N.; Hébert, J.R.; Farsi, F.; Daryani, N.E. Does the inflammatory potential of diet affect disease activity in patients with inflammatory bowel disease? Nutr. J. 2019, 18, 65. [Google Scholar] [CrossRef]
- De Vries, J.H.M.; Dijkhuizen, M.; Tap, P.; Witteman, B.J.M. Patient’s Dietary Beliefs and Behaviours in Inflammatory Bowel Disease. Dig. Dis. 2019, 37, 131–139. [Google Scholar] [CrossRef]


| Variable/Mean (SD) | Quartile 1 (n = 10) | Quartile 2 (n = 10) | Quartile 3 (n = 10) | Quartile 4 (n = 10) | p Value |
|---|---|---|---|---|---|
| DII | 1.76 (0.45) | 2.72 (0.24) | 3.38 (0.21) | 4.02 (0.32) | - |
| Age (year) | 41.60 ± 14.20 | 46.80 ± 16.20 | 41.90 ± 14.70 | 49.00 ± 14.60 | 0.623 |
| Time of disease (years) | 11.00 ± 7.10 | 14.50 ± 5.00 | 9.70 ± 9.00 | 12.60 ± 10.20 | 0.309 |
| Chao index | 214.79 ± 97.46 | 270.58 ± 79.22 | 193.29 ± 57.89 | 252.08 ± 72.98 | 0.230 |
| Shannon index | 3.76 ± 0.64 | 4.11 ± 0.45 | 3.69 ± 0.46 | 3.95 ± 0.44 | 0.190 |
| Simpson index | 0.95 ± 0.03 | 0.96 ± 0.02 | 0.94 ± 0.03 | 0.95 ± 0.02 | 0.100 |
| Calprotectin (μg/g) | 127.90 ± 111.50 | 238.70 ± 245.10 | 406.80 ± 405.60 | 591.00 ± 338.10 | 0.013 |
| Zonulin (ng/mL) | 1.20 ± 0.10 | 1.20 ± 0.20 | 1.20 ± 0.20 | 1.30 ± 0.30 | 0.890 |
| Weight (kg) | 68.90 ± 15.90 | 72.50 ± 14.80 | 69.20 ± 9.70 | 71.1 ± 17.2 | 0.996 |
| Height (m) | 1.60 ± 0.10 | 1.70 ± 0.10 | 1.70 ± 0.10 | 1.70 ± 0.10 | 1.000 |
| BMI (kg/m2) | 25.50 ± 5.50 | 26.00 ± 3.30 | 25.10 ± 3.50 | 25.60 ± 4.40 | 0.949 |
| Fat (%) | 36.60 ± 9.20 | 32.00 ± 9.80 | 33.00 ± 8.30 | 31.10 ± 4.40 | 0.483 |
| Lean mass (%) | 63.40 ± 9.20 | 68.00 ± 9.80 | 67.00 ± 8.30 | 68.90 ± 4.40 | 0.483 |
| Vitamin D (ng/mL) | 28.00 ± 12.80 | 30.50 ± 9.80 | 25.40 ± 7.80 | 23.80 ± 8.50 | 0.448 |
| CRP (mg/L) | 3.20 ± 6.40 | 7.60 ± 11.40 | 3.30 ± 3.20 | 3.30 ± 4.40 | 0.629 |
| Physically active * | 11.00 ± 23.30 | 36.00 ± 64.50 | 65.00 ± 107.00 | 42.00 ± 93.00 | 0.830 |
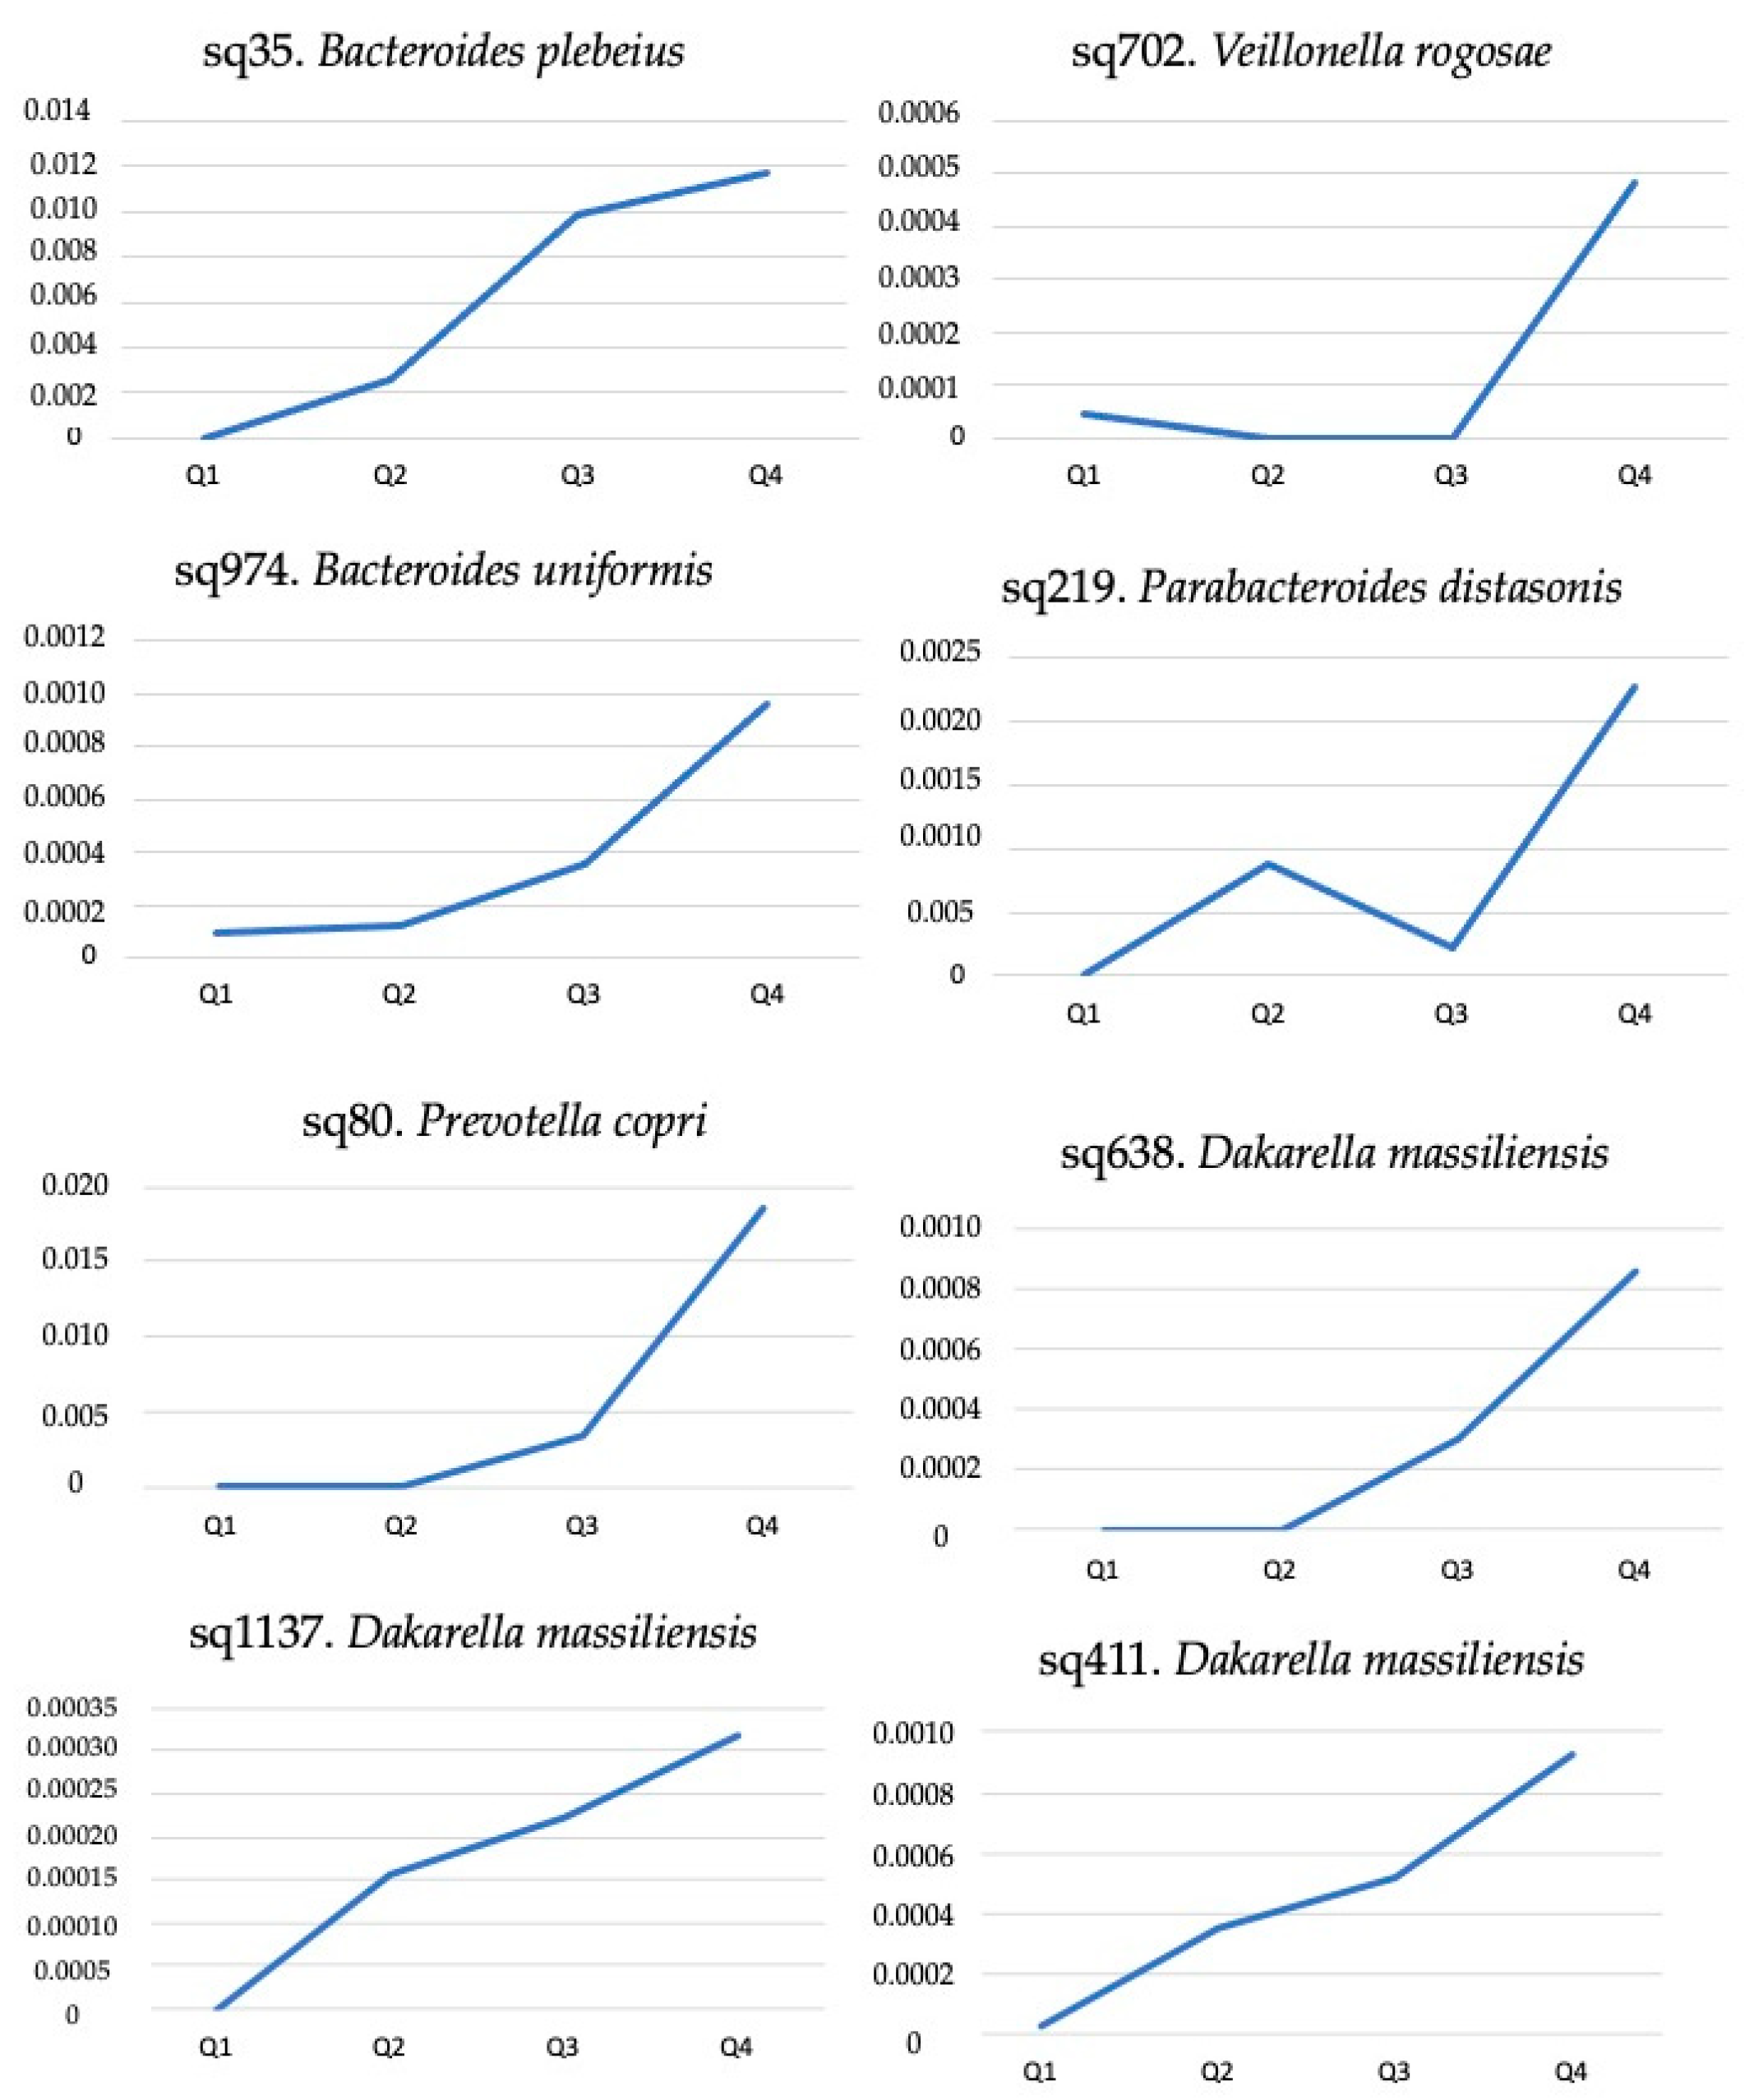
| Amplicon Sequence Variant | Zonulin | Calprotectin | C-Reactive Protein | |||
|---|---|---|---|---|---|---|
| rho | p Value | rho | p-Value | rho | p Value | |
| sq80. Prevotella copri | −0.045 | 0.784 | 0.148 | 0.360 | 0.006 | 0.973 |
| sq219. Parabacteroides distasonis | 0.051 | 0.755 | 0.343 | 0.030 | 0.118 | 0.512 |
| sq411. Dakarella massiliensis | 0.316 | 0.047 | 0.142 | 0.383 | −0.037 | 0.836 |
| sq638. Dakarella massiliensis | 0.319 | 0.044 | 0.281 | 0.078 | −0.014 | 0.939 |
| sq1137. Dakarella massiliensis | 0.486 | 0.001 | 0.070 | 0.669 | −0.206 | 0.250 |
| sq702. Veillonella rogosae | 0.039 | 0.811 | 0.419 | 0.007 | −0.095 | 0.600 |
| sq974. Bacteroides uniformis | 0.068 | 0.677 | 0.113 | 0.486 | 0.098 | 0.588 |
| sq35. Bacteroides plebeius | −0.076 | 0.641 | −0.179 | 0.270 | −0.087 | 0.629 |
| Variable | Adjusted Odds Ratio (95% Confidence Interval) | p Value |
|---|---|---|
| Calprotectin | 1.000 (1.000–1.001) | 0.00643 |
| Diet inflammatory index | 1.232 (1.046–1.451) | 0.0177 |
| Zonulin | 2.300(1.102–4.800) | 0.0336 |
| CRP | 1.019 (1.00–1.042) | 0.1204 |
Disclaimer/Publisher’s Note: The statements, opinions and data contained in all publications are solely those of the individual author(s) and contributor(s) and not of MDPI and/or the editor(s). MDPI and/or the editor(s) disclaim responsibility for any injury to people or property resulting from any ideas, methods, instructions or products referred to in the content. |
© 2023 by the authors. Licensee MDPI, Basel, Switzerland. This article is an open access article distributed under the terms and conditions of the Creative Commons Attribution (CC BY) license (https://creativecommons.org/licenses/by/4.0/).
Share and Cite
Rocha, I.M.G.d.; Torrinhas, R.; Fonseca, D.; Lyra, C.d.O.; de Sousa Alves Neri, J.L.; Balmant, B.D.; Callado, L.; Charlton, K.; Queiroz, N.; Waitzberg, D.L. Pro-Inflammatory Diet Is Correlated with High Veillonella rogosae, Gut Inflammation and Clinical Relapse of Inflammatory Bowel Disease. Nutrients 2023, 15, 4148. https://doi.org/10.3390/nu15194148
Rocha IMGd, Torrinhas R, Fonseca D, Lyra CdO, de Sousa Alves Neri JL, Balmant BD, Callado L, Charlton K, Queiroz N, Waitzberg DL. Pro-Inflammatory Diet Is Correlated with High Veillonella rogosae, Gut Inflammation and Clinical Relapse of Inflammatory Bowel Disease. Nutrients. 2023; 15(19):4148. https://doi.org/10.3390/nu15194148
Chicago/Turabian StyleRocha, Ilanna Marques Gomes da, Raquel Torrinhas, Danielle Fonseca, Clelia de Oliveira Lyra, Julianna Lys de Sousa Alves Neri, Bianca Depieri Balmant, Letícia Callado, Karen Charlton, Natalia Queiroz, and Dan L. Waitzberg. 2023. "Pro-Inflammatory Diet Is Correlated with High Veillonella rogosae, Gut Inflammation and Clinical Relapse of Inflammatory Bowel Disease" Nutrients 15, no. 19: 4148. https://doi.org/10.3390/nu15194148