
Potential Neuroprotective Effect of Melatonin in the Hippocampus of Male BTBR Mice


Abstract
:1. Introduction
2. Materials and Methods
2.1. Animal Treatment
2.2. Morphological Analysis
2.3. Immunohistochemistry
2.4. DAB-Enhanced Perls Reaction Assay
2.5. Western Blot
2.6. Statistical Analysis
3. Results
3.1. Hippocampus General Morphology
3.2. DAB-Enhanced Perls Reaction Assay
3.3. Nrf2
3.4. SOD1
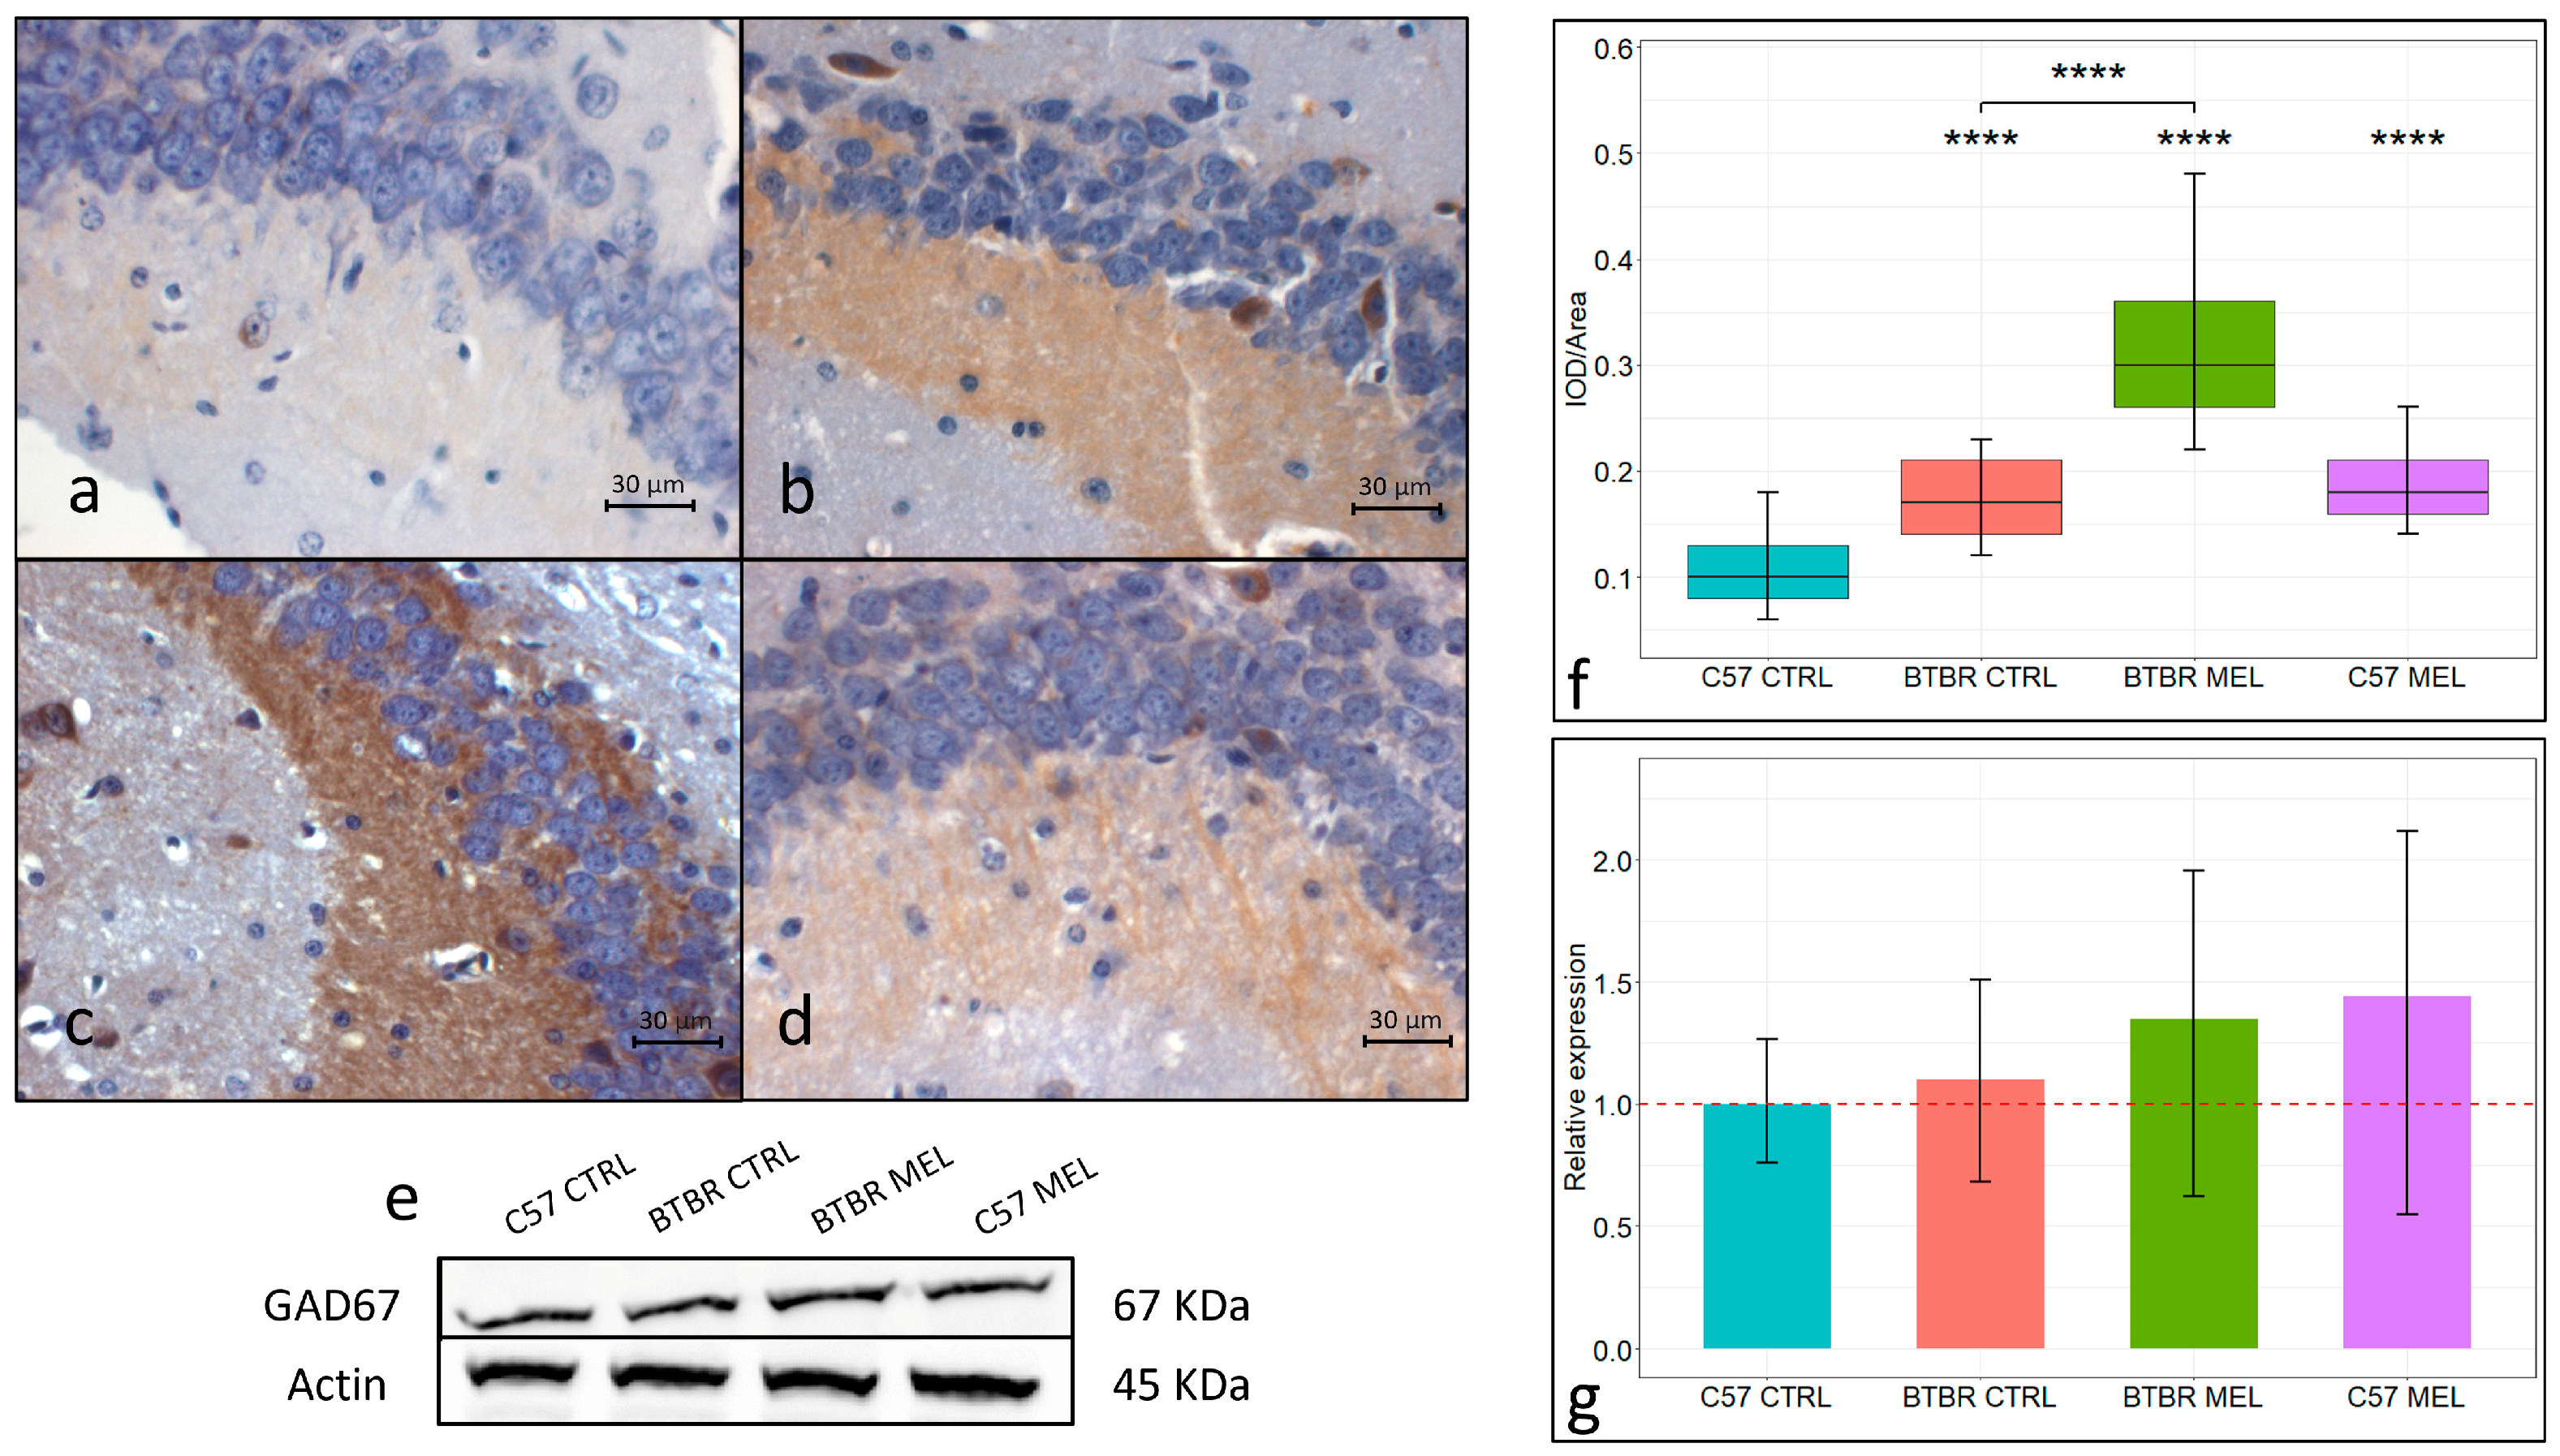
3.5. GAD67
3.6. Immunohistochemistry for Inflammation Markers: NLP3 and NFkB
4. Discussion
5. Conclusions
Author Contributions
Funding
Institutional Review Board Statement
Informed Consent Statement
Data Availability Statement
Acknowledgments
Conflicts of Interest
References
- Meng, X.; Li, Y.; Li, S.; Zhou, Y.; Gan, R.Y.; Xu, D.P.; Li, H.B. Dietary Sources and Bioactivities of Melatonin. Nutrients 2017, 9, 367. [Google Scholar] [CrossRef] [PubMed]
- Milagres, M.P.; Minim, V.P.; Minim, L.A.; Simiqueli, A.A.; Moraes, L.E.; Martino, H.S. Night milking adds value to cow’s milk. J. Sci. Food Agric. 2014, 94, 1688–1692. [Google Scholar] [CrossRef] [PubMed]
- Carriedo-Diez, B.; Tosoratto-Venturi, J.L.; Cantón-Manzano, C.; Wanden-Berghe, C.; Sanz-Valero, J. The Effects of the Exogenous Melatonin on Shift Work Sleep Disorder in Health Personnel: A Systematic Review. Int. J. Environ. Res. Public Health 2022, 19, 10199. [Google Scholar] [CrossRef] [PubMed]
- Paroni, R.; Terraneo, L.; Bonomini, F.; Finati, E.; Virgili, E.; Bianciardi, P.; Favero, G.; Fraschini, F.; Reiter, R.J.; Rezzani, R.; et al. Antitumour activity of melatonin in a mouse model of human prostate cancer: Relationship with hypoxia signalling. J. Pineal Res. 2014, 57, 43–52. [Google Scholar] [CrossRef] [PubMed]
- Li, J.; Liu, H.; Wang, X.; Xia, Y.; Huang, J.; Wang, T.; Lin, Z.; Xiong, N. Melatonin ameliorates Parkinson’s disease via regulating microglia polarization in a RORα-dependent pathway. NPJ Park. Dis. 2022, 8, 90. [Google Scholar] [CrossRef] [PubMed]
- Zhang, Y.; Wang, Y.; Xu, J.; Tian, F.; Hu, S.; Chen, Y.; Fu, Z. Melatonin attenuates myocardial ischemia-reperfusion injury via improving mitochondrial fusion/mitophagy and activating the AMPK-OPA1 signaling pathways. J. Pineal Res. 2019, 66, e12542. [Google Scholar] [CrossRef] [PubMed]
- Borsani, E.; Bonomini, F.; Bonini, S.A.; Premoli, M.; Maccarinelli, G.; Giugno, L.; Mastinu, A.; Aria, F.; Memo, M.; Rezzani, R. Role of melatonin in autism spectrum disorders in a male murine transgenic model: Study in the prefrontal cortex. J. Neurosci. Res. 2022, 100, 780–797. [Google Scholar] [CrossRef] [PubMed]
- Olcese, J.M.; Cao, C.; Mori, T.; Mamcarz, M.B.; Maxwell, A.; Runfeldt, M.J.; Wang, L.; Zhang, C.; Lin, X.; Zhang, G.; et al. Protection against cognitive deficits and markers of neurodegeneration by long-term oral administration of melatonin in a transgenic model of Alzheimer disease. J. Pineal Res. 2009, 47, 82–96. [Google Scholar] [CrossRef] [PubMed]
- American Psychiatric Association. Diagnostic and Statistical Manual of Mental Disorders, Fifth Edition, Text Revision (DMS-5-TR); American Psychiatric Association: Washington, DC, USA, 2022. [Google Scholar]
- Khachadourian, V.; Mahjani, B.; Sandin, S.; Kolevzon, A.; Buxbaum, J.D.; Reichenberg, A.; Janecka, M. Comorbidities in autism spectrum disorder and their etiologies. Transl. Psychiatry 2023, 13, 71. [Google Scholar] [CrossRef]
- Nogueira, H.A.; de Castro, C.T.; da Silva, D.C.G.; Pereira, M. Melatonin for sleep disorders in people with autism: Systematic review and meta-analysis. Prog. Neuropsychopharmacol. Biol. Psychiatry 2023, 123, 110695. [Google Scholar] [CrossRef]
- Wright, B.; Sims, D.; Smart, S.; Alwazeer, A.; Alderson-Day, B.; Allgar, V.; Whitton, C.; Tomlinson, H.; Bennett, S.; Jardine, J.; et al. Melatonin versus placebo in children with autism spectrum conditions and severe sleep problems not amenable to behaviour management strategies: A randomised controlled crossover trial. J. Autism Dev. Disord. 2011, 41, 175–184. [Google Scholar] [CrossRef] [PubMed]
- Beopoulos, A.; Géa, M.; Fasano, A.; Iris, F. Autism spectrum disorders pathogenesis: Toward a comprehensive model based on neuroanatomic and neurodevelopment considerations. Front. Neurosci. 2022, 16, 988735. [Google Scholar] [CrossRef] [PubMed]
- Al-Ayadhi, L.Y.; Mostafa, G.A. Elevated serum levels of interleukin-17A in children with autism. J. Neuroinflammation 2012, 9, 158. [Google Scholar] [CrossRef] [PubMed]
- Runge, K.; Fiebich, B.L.; Kuzior, H.; Rausch, J.; Maier, S.J.; Dersch, R.; Nickel, K.; Domschke, K.; Tebartz van Elst, L.; Endres, D. Altered cytokine levels in the cerebrospinal fluid of adult patients with autism spectrum disorder. J. Psychiatr. Res. 2023, 158, 134–142. [Google Scholar] [CrossRef]
- Meguid, N.A.; Dardir, A.A.; Abdel-Raouf, E.R.; Hashish, A. Evaluation of oxidative stress in autism: Defective antioxidant enzymes and increased lipid peroxidation. Biol. Trace Elem. Res. 2011, 143, 58–65. [Google Scholar] [CrossRef] [PubMed]
- Morimoto, M.; Hashimoto, T.; Tsuda, Y.; Suenaga, M.; Nakamura, T.; Katoh, S. Study on oxidative stress and inflammatory/antioxidant substance levels in autism spectrum disorder. J. Chin. Med. Assoc. 2023, 86, 489–493. [Google Scholar] [CrossRef]
- Zhao, H.; Mao, X.; Zhu, C.; Zou, X.; Peng, F.; Yang, W.; Li, B.; Li, G.; Ge, T.; Cui, R. GABAergic System Dysfunction in Autism Spectrum Disorders. Front. Cell Dev. Biol. 2021, 9, 781327. [Google Scholar] [CrossRef]
- Qi, C.; Chen, A.; Mao, H.; Hu, E.; Ge, J.; Ma, G.; Ren, K.; Xue, Q.; Wang, W.; Wu, S. Excitatory and Inhibitory Synaptic Imbalance Caused by Brain-Derived Neurotrophic Factor Deficits During Development in a Valproic Acid Mouse Model of Autism. Front. Mol. Neurosci. 2022, 15, 860275. [Google Scholar] [CrossRef]
- Saitow, F.; Takumi, T.; Suzuki, H. Change in serotonergic modulation contributes to the synaptic imbalance of neuronal circuit at the prefrontal cortex in the 15q11-13 duplication mouse model of autism. Neuropharmacology 2020, 165, 107931. [Google Scholar] [CrossRef]
- Dimond, D.; Schuetze, M.; Smith, R.E.; Dhollander, T.; Cho, I.; Vinette, S.; Ten Eycke, K.; Lebel, C.; McCrimmon, A.; Dewey, D.; et al. Reduced White Matter Fiber Density in Autism Spectrum Disorder. Cereb. Cortex 2019, 29, 1778–1788. [Google Scholar] [CrossRef]
- Boedhoe, P.S.W.; van Rooij, D.; Hoogman, M.; Twisk, J.W.R.; Schmaal, L.; Abe, Y.; Alonso, P.; Ameis, S.H.; Anikin, A.; Anticevic, A.; et al. Subcortical Brain Volume, Regional Cortical Thickness, and Cortical Surface Area Across Disorders: Findings From the ENIGMA ADHD, ASD, and OCD Working Groups. Am. J. Psychiatry 2020, 177, 834–843. [Google Scholar] [CrossRef] [PubMed]
- Hitti, F.L.; Siegelbaum, S.A. The hippocampal CA2 region is essential for social memory. Nature 2014, 508, 88–92. [Google Scholar] [CrossRef]
- Deng, X.; Gu, L.; Sui, N.; Guo, J.; Liang, J. Parvalbumin interneuron in the ventral hippocampus functions as a discriminator in social memory. Proc. Natl. Acad. Sci. USA 2019, 116, 16583–16592. [Google Scholar] [CrossRef] [PubMed]
- Codagnone, M.G.; Podestá, M.F.; Uccelli, N.A.; Reinés, A. Differential Local Connectivity and Neuroinflammation Profiles in the Medial Prefrontal Cortex and Hippocampus in the Valproic Acid Rat Model of Autism. Dev. Neurosci. 2015, 37, 215–231. [Google Scholar] [CrossRef]
- Sgritta, M.; Vignoli, B.; Pimpinella, D.; Griguoli, M.; Santi, S.; Bialowas, A.; Wiera, G.; Zacchi, P.; Malerba, F.; Marchetti, C.; et al. Impaired synaptic plasticity in an animal model of autism exhibiting early hippocampal GABAergic-BDNF/TrkB signaling alterations. iScience 2023, 26, 105728. [Google Scholar] [CrossRef]
- Münster-Wandowski, A.; Gómez-Lira, G.; Gutiérrez, R. Mixed neurotransmission in the hippocampal mossy fibers. Front. Cell Neurosci. 2013, 7, 210. [Google Scholar] [CrossRef]
- Chiang, M.C.; Huang, A.J.Y.; Wintzer, M.E.; Ohshima, T.; McHugh, T.J. A role for CA3 in social recognition memory. Behav. Brain Res. 2018, 354, 22–30. [Google Scholar] [CrossRef]
- Motta-Teixeira, L.C.; Machado-Nils, A.V.; Battagello, D.S.; Diniz, G.B.; Andrade-Silva, J.; Silva, S.; Matos, R.A.; do Amaral, F.G.; Xavier, G.F.; Bittencourt, J.C.; et al. The absence of maternal pineal melatonin rhythm during pregnancy and lactation impairs offspring physical growth, neurodevelopment, and behavior. Horm. Behav. 2018, 105, 146–156. [Google Scholar] [CrossRef]
- McFarlane, H.G.; Kusek, G.K.; Yang, M.; Phoenix, J.L.; Bolivar, V.J.; Crawley, J.N. Autism-like behavioral phenotypes in BTBR T+tf/J mice. Genes. Brain Behav. 2008, 7, 152–163. [Google Scholar] [CrossRef]
- Trinchese, G.; Cimmino, F.; Cavaliere, G.; Catapano, A.; Fogliano, C.; Lama, A.; Pirozzi, C.; Cristiano, C.; Russo, R.; Petrella, L.; et al. The Hepatic Mitochondrial Alterations Exacerbate Meta-Inflammation in Autism Spectrum Disorders. Antioxidants 2022, 11, 1990. [Google Scholar] [CrossRef]
- Onore, C.E.; Careaga, M.; Babineau, B.A.; Schwartzer, J.J.; Berman, R.F.; Ashwood, P. Inflammatory macrophage phenotype in BTBR T+tf/J mice. Front. Neurosci. 2013, 7, 158. [Google Scholar] [CrossRef] [PubMed]
- Nadeem, A.; Ahmad, S.F.; Al-Harbi, N.O.; Attia, S.M.; Alshammari, M.A.; Alzahrani, K.S.; Bakheet, S.A. Increased oxidative stress in the cerebellum and peripheral immune cells leads to exaggerated autism-like repetitive behavior due to deficiency of antioxidant response in BTBR T+tf/J mice. Prog. Neuropsychopharmacol. Biol. Psychiatry 2019, 89, 245–253. [Google Scholar] [CrossRef] [PubMed]
- Cao, C.; Li, Q.; Chen, Y.; Zou, M.; Sun, C.; Li, X.; Wu, L. Untargeted Metabolomic Analysis Reveals the Metabolic Disturbances and Exacerbation of Oxidative Stress in the Cerebral Cortex of a BTBR Mouse Model of Autism. J. Mol. Neurosci. 2023, 73, 15–27. [Google Scholar] [CrossRef] [PubMed]
- Stephenson, D.T.; O’Neill, S.M.; Narayan, S.; Tiwari, A.; Arnold, E.; Samaroo, H.D.; Du, F.; Ring, R.H.; Campbell, B.; Pletcher, M.; et al. Histopathologic characterization of the BTBR mouse model of autistic-like behavior reveals selective changes in neurodevelopmental proteins and adult hippocampal neurogenesis. Mol. Autism 2011, 2, 7. [Google Scholar] [CrossRef] [PubMed]
- Cheng, N.; Alshammari, F.; Hughes, E.; Khanbabaei, M.; Rho, J.M. Dendritic overgrowth and elevated ERK signaling during neonatal development in a mouse model of autism. PLoS ONE 2017, 12, e0179409. [Google Scholar] [CrossRef] [PubMed]
- Sforazzini, F.; Bertero, A.; Dodero, L.; David, G.; Galbusera, A.; Scattoni, M.L.; Pasqualetti, M.; Gozzi, A. Altered functional connectivity networks in acallosal and socially impaired BTBR mice. Brain Struct. Funct. 2016, 221, 941–954. [Google Scholar] [CrossRef] [PubMed]
- Tossetta, G.; Fantone, S.; Piani, F.; Crescimanno, C.; Ciavattini, A.; Giannubilo, S.R.; Marzioni, D. Modulation of NRF2/KEAP1 Signaling in Preeclampsia. Cells 2023, 12, 1545. [Google Scholar] [CrossRef] [PubMed]
- Tossetta, G.; Marzioni, D. Targeting the NRF2/KEAP1 pathway in cervical and endometrial cancers. Eur. J. Pharmacol. 2023, 941, 175503. [Google Scholar] [CrossRef] [PubMed]
- Bonomini, F.; Dos Santos, M.; Veronese, F.V.; Rezzani, R. NLRP3 Inflammasome Modulation by Melatonin Supplementation in Chronic Pristane-Induced Lupus Nephritis. Int. J. Mol. Sci. 2019, 20, 3466. [Google Scholar] [CrossRef]
- Meguro, R.; Asano, Y.; Odagiri, S.; Li, C.; Iwatsuki, H.; Shoumura, K. Nonheme-iron histochemistry for light and electron microscopy: A historical, theoretical and technical review. Arch. Histol. Cytol. 2007, 70, 1–19. [Google Scholar] [CrossRef]
- Faraji, J.; Karimi, M.; Lawrence, C.; Mohajerani, M.H.; Metz, G.A.S. Non-diagnostic symptoms in a mouse model of autism in relation to neuroanatomy: The BTBR strain reinvestigated. Transl. Psychiatry 2018, 8, 234. [Google Scholar] [CrossRef] [PubMed]
- Wahlsten, D.; Metten, P.; Crabbe, J.C. Survey of 21 inbred mouse strains in two laboratories reveals that BTBR T/+ tf/tf has severely reduced hippocampal commissure and absent corpus callosum. Brain Res. 2003, 971, 47–54. [Google Scholar] [CrossRef]
- Mercier, F.; Kwon, Y.C.; Douet, V. Hippocampus/amygdala alterations, loss of heparan sulfates, fractones and ventricle wall reduction in adult BTBR T+tf/J mice, animal model for autism. Neurosci. Lett. 2012, 506, 208–213. [Google Scholar] [CrossRef]
- Bellezza, I.; Giambanco, I.; Minelli, A.; Donato, R. Nrf2-Keap1 signaling in oxidative and reductive stress. Biochim. Biophys. Acta Mol. Cell Res. 2018, 1865, 721–733. [Google Scholar] [CrossRef]
- George, M.; Tharakan, M.; Culberson, J.; Reddy, A.P.; Reddy, P.H. Role of Nrf2 in aging, Alzheimer’s and other neurodegenerative diseases. Ageing Res. Rev. 2022, 82, 101756. [Google Scholar] [CrossRef] [PubMed]
- Wu, H.; Luan, Y.; Wang, H.; Zhang, P.; Liu, S.; Wang, P.; Cao, Y.; Sun, H.; Wu, L. Selenium inhibits ferroptosis and ameliorates autistic-like behaviors of BTBR mice by regulating the Nrf2/GPx4 pathway. Brain Res. Bull. 2022, 183, 38–48. [Google Scholar] [CrossRef]
- Ahmadi, Z.; Ashrafizadeh, M. Melatonin as a potential modulator of Nrf2. Fundam Clin Pharmacol 2020, 34, 11–19. [Google Scholar] [CrossRef]
- Tsang, C.K.; Liu, Y.; Thomas, J.; Zhang, Y.; Zheng, X.F. Superoxide dismutase 1 acts as a nuclear transcription factor to regulate oxidative stress resistance. Nat. Commun. 2014, 5, 3446. [Google Scholar] [CrossRef]
- Guan, T.; Guo, Y.; Zhou, T.; Yu, Q.; Sun, J.; Sun, B.; Zhang, G.; Kong, J. Oxidized SOD1 accelerates cellular senescence in neural stem cells. Stem Cell Res. Ther. 2024, 15, 55. [Google Scholar] [CrossRef]
- Cao, J.; Tang, C.; Gao, M.; Rui, Y.; Zhang, J.; Wang, L.; Wang, Y.; Xu, B.; Yan, B.C. Hyperoside alleviates epilepsy-induced neuronal damage by enhancing antioxidant levels and reducing autophagy. J. Ethnopharmacol. 2020, 257, 112884. [Google Scholar] [CrossRef]
- Yenkoyan, K.; Harutyunyan, H.; Harutyunyan, A. A certain role of SOD/CAT imbalance in pathogenesis of autism spectrum disorders. Free Radic. Biol. Med. 2018, 123, 85–95. [Google Scholar] [CrossRef]
- Wang, L.; Jia, J.; Zhang, J.; Li, K. Serum levels of SOD and risk of autism spectrum disorder: A case-control study. Int. J. Dev. Neurosci. 2016, 51, 12–16. [Google Scholar] [CrossRef] [PubMed]
- Afrazeh, M.; Saedisar, S.; Khakzad, M.R.; Hojati, M. Measurement of Serum Superoxide Dismutase and Its Relevance to Disease Intensity Autistic Children. Maedica 2015, 10, 315–318. [Google Scholar]
- Shi, Y.; Han, L.; Zhang, X.; Xie, L.; Pan, P.; Chen, F. Selenium Alleviates Cerebral Ischemia/Reperfusion Injury by Regulating Oxidative Stress, Mitochondrial Fusion and Ferroptosis. Neurochem. Res. 2022, 47, 2992–3002. [Google Scholar] [CrossRef]
- Yan, H.F.; Zou, T.; Tuo, Q.Z.; Xu, S.; Li, H.; Belaidi, A.A.; Lei, P. Ferroptosis: Mechanisms and links with diseases. Signal Transduct. Target. Ther. 2021, 6, 49. [Google Scholar] [CrossRef]
- Li, R.; Zhang, J.; Zhou, Y.; Gao, Q.; Wang, R.; Fu, Y.; Zheng, L.; Yu, H. Transcriptome Investigation and In Vitro Verification of Curcumin-Induced HO-1 as a Feature of Ferroptosis in Breast Cancer Cells. Oxid. Med. Cell Longev. 2020, 2020, 3469840. [Google Scholar] [CrossRef]
- Wang, H.; Huo, X.; Han, C.; Ning, J.; Chen, H.; Li, B.; Liu, J.; Ma, W.; Li, Q.; Yu, Y.; et al. Ferroptosis is involved in the development of neuropathic pain and allodynia. Mol. Cell Biochem. 2021, 476, 3149–3161. [Google Scholar] [CrossRef]
- Pei, Y.; Jiao, Z.; Dong, W.; Pei, L.; He, X.; Wang, H.; Xu, D. Excitotoxicity and compensatory upregulation of GAD67 in fetal rat hippocampus caused by prenatal nicotine exposure are associated with inhibition of the BDNF pathway. Food Chem. Toxicol. 2019, 123, 314–325. [Google Scholar] [CrossRef] [PubMed]
- Lu, J.; Jiao, Z.; Yu, Y.; Zhang, C.; He, X.; Li, Q.; Xu, D.; Wang, H. Programming for increased expression of hippocampal GAD67 mediated the hypersensitivity of the hypothalamic-pituitary-adrenal axis in male offspring rats with prenatal ethanol exposure. Cell Death Dis. 2018, 9, 659. [Google Scholar] [CrossRef]
- Chen, J.; Ma, X.L.; Zhao, H.; Wang, X.Y.; Xu, M.X.; Wang, H.; Yang, T.Q.; Peng, C.; Liu, S.S.; Huang, M.; et al. Increasing astrogenesis in the developing hippocampus induces autistic-like behavior in mice via enhancing inhibitory synaptic transmission. Glia 2022, 70, 106–122. [Google Scholar] [CrossRef]
- Shimazaki, K.; Kobari, T.; Oguro, K.; Yokota, H.; Kasahara, Y.; Murashima, Y.; Watanabe, E.; Kawai, K.; Okada, T. Hippocampal GAD67 Transduction Using rAAV8 Regulates Epileptogenesis in EL Mice. Mol. Ther. Methods Clin. Dev. 2019, 13, 180–186. [Google Scholar] [CrossRef] [PubMed]
- Shih, R.H.; Wang, C.Y.; Yang, C.M. NF-kappaB Signaling Pathways in Neurological Inflammation: A Mini Review. Front. Mol. Neurosci. 2015, 8, 77. [Google Scholar] [CrossRef]
- Shah, A.; Varma, M.; Bhandari, R. Exploring sulforaphane as neurotherapeutic: Targeting Nrf2-Keap & Nf-Kb pathway crosstalk in ASD. Metab. Brain Dis. 2024, 39, 373–385. [Google Scholar]
- Napetschnig, J.; Wu, H. Molecular basis of NF-κB signaling. Annu. Rev. Biophys. 2013, 42, 443–468. [Google Scholar] [CrossRef]
- Ridder, D.A.; Schwaninger, M. NF-kappaB signaling in cerebral ischemia. Neuroscience 2009, 158, 995–1006. [Google Scholar] [CrossRef] [PubMed]
- Liu, T.; Zhang, L.; Joo, D.; Sun, S.C. NF-κB signaling in inflammation. Signal Transduct. Target. Ther. 2017, 2, 17023. [Google Scholar] [CrossRef]
- Yang, J.; Fu, X.; Liao, X.; Li, Y. Nrf2 Activators as Dietary Phytochemicals Against Oxidative Stress, Inflammation, and Mitochondrial Dysfunction in Autism Spectrum Disorders: A Systematic Review. Front. Psychiatry 2020, 11, 561998. [Google Scholar] [CrossRef]
- Snow, W.M.; Albensi, B.C. Neuronal Gene Targets of NF-κB and Their Dysregulation in Alzheimer’s Disease. Front. Mol. Neurosci. 2016, 9, 118. [Google Scholar] [CrossRef]
- O’Mahony, A.; Raber, J.; Montano, M.; Foehr, E.; Han, V.; Lu, S.M.; Kwon, H.; LeFevour, A.; Chakraborty-Sett, S.; Greene, W.C. NF-kappaB/Rel regulates inhibitory and excitatory neuronal function and synaptic plasticity. Mol. Cell Biol. 2006, 26, 7283–7298. [Google Scholar] [CrossRef]
- Algahtani, M.M.; Ahmad, S.F.; Alkharashi, L.A.; Al-Harbi, N.O.; Alanazi, W.A.; Alhamed, A.S.; Attia, S.M.; Bakheet, S.A.; Ibrahim, K.E.; Nadeem, A. Exposure to Methylmercury at Juvenile Stage Worsens Autism-like Symptoms in Adult BTBR T+tf/J Mice Due to Lack of Nuclear Factor Erythroid 2-Related Factor 2 Signaling Upregulation in Periphery and Brain. Toxics 2023, 11, 546. [Google Scholar] [CrossRef]
- Zhang, N.; Zhang, X.; Liu, X.; Wang, H.; Xue, J.; Yu, J.; Kang, N.; Wang, X. Chrysophanol inhibits NALP3 inflammasome activation and ameliorates cerebral ischemia/reperfusion in mice. Mediators Inflamm. 2014, 2014, 370530. [Google Scholar] [CrossRef] [PubMed]
- Ventura, L.; Freiberger, V.; Thiesen, V.B.; Dias, P.; Dutra, M.L.; Silva, B.B.; Schlindwein, A.D.; Comim, C.M. Involvement of NLRP3 inflammasome in schizophrenia-like behaviour in young animals after maternal immune activation. Acta Neuropsychiatr. 2020, 32, 321–327. [Google Scholar] [CrossRef] [PubMed]
- Arioz, B.I.; Tastan, B.; Tarakcioglu, E.; Tufekci, K.U.; Olcum, M.; Ersoy, N.; Bagriyanik, A.; Genc, K.; Genc, S. Melatonin Attenuates LPS-Induced Acute Depressive-Like Behaviors and Microglial NLRP3 Inflammasome Activation Through the SIRT1/Nrf2 Pathway. Front. Immunol. 2019, 10, 1511. [Google Scholar] [CrossRef] [PubMed]
- Su, W.J.; Li, J.M.; Zhang, T.; Cao, Z.Y.; Hu, T.; Zhong, S.Y.; Xu, Z.Y.; Gong, H.; Jiang, C.L. Microglial NLRP3 inflammasome activation mediates diabetes-induced depression-like behavior via triggering neuroinflammation. Prog. Neuropsychopharmacol. Biol. Psychiatry 2023, 126, 110796. [Google Scholar] [CrossRef]
- Szabó, D.; Tod, P.; Gölöncsér, F.; Román, V.; Lendvai, B.; Otrokocsi, L.; Sperlágh, B. Maternal P2X7 receptor inhibition prevents autism-like phenotype in male mouse offspring through the NLRP3-IL-1β pathway. Brain Behav. Immun. 2022, 101, 318–332. [Google Scholar] [CrossRef]
- Chen, K.P.; Hua, K.F.; Tsai, F.T.; Lin, T.Y.; Cheng, C.Y.; Yang, D.I.; Hsu, H.T.; Ju, T.C. A selective inhibitor of the NLRP3 inflammasome as a potential therapeutic approach for neuroprotection in a transgenic mouse model of Huntington’s disease. J. Neuroinflammation 2022, 19, 56. [Google Scholar] [CrossRef]


| Antibody | Dilution | Distributor, Cat. Num. |
|---|---|---|
| anti-SOD1 mouse monoclonal antibody | 1:300 | Santa Cruz Biotechnology, Santa Cruz, CA, USA, sc-101523 |
| anti-Nrf2 rabbit polyclonal antibody | 1:300 | Abcam, Cambridge, UK, ab31163 |
| anti-GAD67 mouse monoclonal antibody | 1:300 | Abcam, MAB5406 |
| anti-NFkB p65 rabbit polyclonal antibody | 1:200 | Abcam, ab16502 |
| anti-NLRP3 mouse polyclonal antibody | 1.200 | Abcam, ab214185 |
| polyclonal goat anti-rabbit biotinylated antibody | 1:50 | DakoCytomation, Glostrup, Denmark E0432 |
| polyclonal goat anti-mouse biotinylated antibody | 1:50 | DakoCytomation, E0433 |
| Antibody | Dilution | Distributor, Cat. Num. |
|---|---|---|
| anti-SOD1 mouse monoclonal antibody | 1:1000 | Santa Cruz Biotechnology, sc-101523 |
| anti-Nrf2 rabbit polyclonal antibody | 1:1000 | Abcam, ab31163 |
| anti-GAD67 mouse monoclonal antibody | 1:2000 | Abcam, MAB5406 |
| monoclonal anti-β-Actin antibody (mouse) | 1.2500 | Sigma, A5441 |
| IRDye® 800CW Goat anti-Rabbit IgG Secondary Antibody | 1:2500 | LI-COR bioscience, 926-32211 |
| IRDye® 680RD Goat anti-Mouse IgG Secondary Antibody | 1.2500 | LI-COR bioscience, 925-68070 |
| polyclonal goat anti-rabbit biotinylated antibody | 1:2500 | DakoCytomation, E0432 |
| polyclonal goat anti-mouse biotinylated antibody | 1:2500 | DakoCytomation, E0433 |
Disclaimer/Publisher’s Note: The statements, opinions and data contained in all publications are solely those of the individual author(s) and contributor(s) and not of MDPI and/or the editor(s). MDPI and/or the editor(s) disclaim responsibility for any injury to people or property resulting from any ideas, methods, instructions or products referred to in the content. |
© 2024 by the authors. Licensee MDPI, Basel, Switzerland. This article is an open access article distributed under the terms and conditions of the Creative Commons Attribution (CC BY) license (https://creativecommons.org/licenses/by/4.0/).
Share and Cite
Bonetti, M.; Giugno, L.; Borsani, E.; Bonomini, F. Potential Neuroprotective Effect of Melatonin in the Hippocampus of Male BTBR Mice. Nutrients 2024, 16, 1652. https://doi.org/10.3390/nu16111652
Bonetti M, Giugno L, Borsani E, Bonomini F. Potential Neuroprotective Effect of Melatonin in the Hippocampus of Male BTBR Mice. Nutrients. 2024; 16(11):1652. https://doi.org/10.3390/nu16111652
Chicago/Turabian StyleBonetti, Matteo, Lorena Giugno, Elisa Borsani, and Francesca Bonomini. 2024. "Potential Neuroprotective Effect of Melatonin in the Hippocampus of Male BTBR Mice" Nutrients 16, no. 11: 1652. https://doi.org/10.3390/nu16111652