Abstract
Nowadays, the interest in the extraskeletal effects of vitamin D is growing. In the literature, its several possible actions have been confirmed. Vitamin D seems to have a regulatory role in many different fields—inflammation, immunity, and the endocrine system—and many studies would demonstrate a possible correlation between vitamin D and cardiovascular disease. In this paper, we deepened the relationship between vitamin D and dyslipidemia by reviewing the available literature. The results are not entirely clear-cut: on the one hand, numerous observational studies suggest a link between higher serum vitamin D levels and a beneficial lipid profile, while on the other hand, interventional studies do not demonstrate a significant effect. Understanding the possible relationship between vitamin D and dyslipidemia may represent a turning point: another link between vitamin D and the cardiovascular system.
1. Introduction
Dyslipidemia is an imbalance of lipids such as total cholesterol (TC), low-density lipoprotein cholesterol (LDL-C), triglycerides (TGs), and high-density lipoprotein (HDL-C). It is a pathological condition found all around the world. Dyslipidemia is also a fundamental and modifiable cardiovascular risk factor. Genetic and environmental factors (obesity, incorrect diet, smoking) are both involved. Excessive cholesterol poses a risk, but it is essential in appropriate amounts for the human body; in fact, it maintains the integrity and fluidity of cell membranes and represents the precursor of hormones and bile acids.
Vitamin D undergoes an initial conversion to 25-hydroxyvitamin D (25OHD) in the liver, followed by a subsequent transformation into its active form, 1,25-dihydroxyvitamin D, or calcitriol, primarily occurring in the kidneys and various tissues. The synthesis of 1,25-dihydroxyvitamin D in the kidneys is regulated by levels of parathyroid hormone, as well as concentrations of calcium and phosphorus in the bloodstream. Vitamin D3, also referred to as cholecalciferol, shares structural similarities with steroids and is generated in the skin upon exposure to ultraviolet light from the sun. Circulating 25(OH)D is the most dependable indicator of vitamin D status in humans, reflecting dietary intake, supplements, and the skin synthesis of vitamin D. Moreover, 25OHD’s functions do not stop only at the bone but involve the inflammatory, immune, and endocrine systems. Vitamin D deficiency is very common across numerous regions globally. In a recent study, the association between vitamin D deficiency and cardiovascular disease has been described [1].
How can vitamin D affect cholesterol levels? Actually, this is not entirely clear. Vitamin D and cholesterol share similarities in their biosynthesis processes: cholecalciferol is synthesized in the skin by UV-B irradiation from 7-dehydrocholesterol (7DHC); 7DHC is also converted to cholesterol by the action of the enzyme 7-Dehydrocholesterol reductase (DHCR7) [2]. Zou and Porter [3] demonstrated in vitro that increased levels of cholecalciferol lead to a rapid decrease in DHCR7 activity and result in a lipid decrease. This represents a fundamental connection between lipids and vitamin D (Figure 1). However, the relationship between vitamin D and lipids has deep-seated roots, extending to the genetic level. Below, we summarize the mechanisms that link vitamin D and lipids.
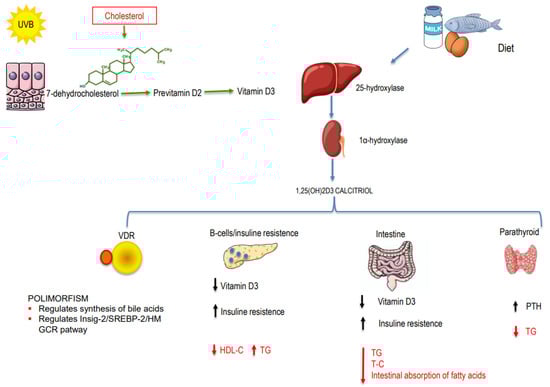
Figure 1.
Mechanisms involved in the relationship between vitamin D and dyslipidemia.
1.1. Genetic Mechanisms
Vitamin D is involved in lipid metabolism through genetic mechanisms mediated by the vitamin D receptor (VDR). The VDR gene is located on chromosome 12 (q11–q13). Several studies have shown that, in some populations, certain VDR polymorphisms are associated with higher levels of triglycerides and cholesterol [4,5,6]. Jia et al. [7] investigated the association between VDR polymorphism and dyslipidemia in a large Chinese population. Their work suggests that the presence of VDR rs2228570 polymorphism correlates with an increased risk of higher LDL-C and lower serum 25OHD levels in the study population. Additionally, it has been also proposed that VDR determines cholesterol levels by regulating the synthesis of bile acids at the genetic level: VDR inhibits liver X receptor alpha (LXR-alpha) signaling, thereby regulating bile acid and cholesterol homeostasis [8,9].
Li et al. demonstrated another important link between vitamin D and cholesterol trough VDR. Vitamin D deficiency reduces the transcriptional activity of VDR, leading to a down-regulation of insulin-induced gene-2 (Insig-2) expression and, consequently, the activation of its inhibitory effect on sterol regulatory element-binding protein 2 (SREBP-2). This cascade ultimately leads to an increase in 3-hydroxy-3-methylglutaryl-coenzyme A reductase expression, culminating in elevated cholesterol production [10].
1.2. Non-Genetic Mechanisms
There are also non-genetic mechanisms that link vitamin D and lipids (Figure 1). One of the main functions of vitamin D is to regulate calcium metabolism. Through this action, vitamin D interferes with lipid production in the following ways: (1) Increasing intestinal calcium absorption may play a role in modulating microsomal triglyceride transfer protein (MTP), thereby reducing the synthesis and secretion of triglycerides [11]. (2) Increasing intestinal calcium levels reduces the intestinal absorption of fatty acids due to the formation of insoluble calcium–fat complexes. (3) Calcium may promote the conversion of cholesterol into bile acids, resulting in decreased cholesterol levels. (4) 25OHD regulates PTH; a previous paper on rats demonstrated that hyperparathyroidism is associated with increased triglycerides. Therefore, 25-OH-vitamin D (25OHD), by regulating PTH, could regulate triglyceride values [12]. (5) Hypovitaminosis D could affect beta cell function and insulin resistance, thereby influencing lipoprotein metabolism and resulting in increased triglyceride levels and reduced HDL-C levels [13]. (6) Hypovitaminosis D is also associated with the pro-inflammatory state: inflammation, lipid metabolism, and atherosclerosis interact closely with each other [14]. (7) Finally, calcitriol (1,25(OH)D) seems to arrest cholesterol uptake by macrophages, thus suppressing foam cell formation, which is involved in atherosclerosis [15].
In this narrative review, we aim to delve deeper into the relationship between vitamin D and lipids to understand their potential link by analyzing observational and interventional studies.
2. Materials and Methods
A literature review was conducted from inception to July 2023. The PubMed/Medline, Cochrane Library, ClinicalTrials.gov, and SCOPUS databases were searched using the following search terms: “dyslipidemia” or “cholesterol” or “lipids” or “triglyceride” AND “vitamin D”. The process of selecting the studies for review in adherence to the PRISMA 2020 process is shown in Figure 2.
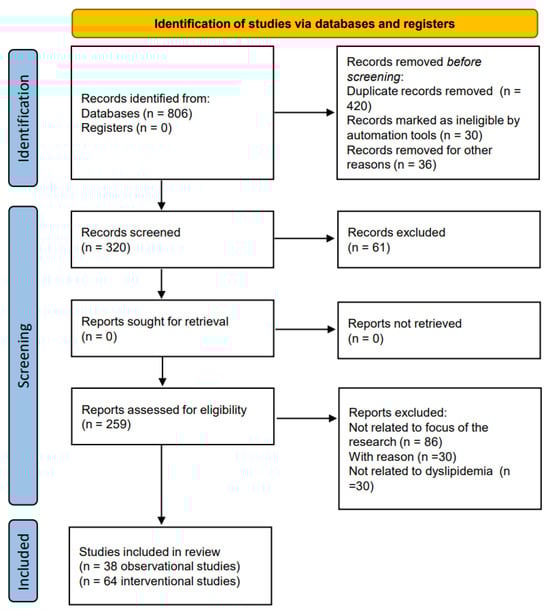
Figure 2.
Flow chart of the studies identified and included in this review.
3. Results
3.1. Observational Studies
On this topic, it is possible to find observational and interventional studies. First, we began by analyzing observational studies. However, it is worth noting that interest in this topic is not recent. One of the earliest papers in 1992 was a Belgian study conducted on a group of 358 subjects. In this study, a blood sample was performed for the determination of total serum calcium, 25OHD, TC, HDL-C, apolipoprotein A-I (apoA1), apolipoprotein B (apoB), and total protein. The study determined the existence of a significant positive relation between serum 25OHD and both HDL-C and apo A-I [16]. It is well known that high HDL-C has a protective effect, unlike LDL-C and TGs. Cross-sectional studies with very large populations have reported an inversely significant correlation between the values of 25OHD, TGs, and LDL-C and a positive correlation with HDL-C, as reported by Aumerx et al. [16]. Similarly, Jiang too in 2018, in a cross-sectional study carried out on 3788 subjects, found an inversely significant correlation between 25OHD, TGs, and LDL-C, while there was a positive correlation with HDL-C [17]. These results further underline the possible protective role of vitamin D in reducing cardiovascular risk. Other studies confirmed the inverse correlation between 25OHD and TG or LDL-C serum levels [18,19,20]. In 2007, Botella-Carretero led a transversal observational study on 73 patients with morbid obesity. Anthropometric variables, 25OHD, lipid profiles (TC, HDL-C, LDL-C, TGs), glucose and insulin levels, and insulin resistance were measured for each patient. Vitamin D deficiency was present in 37 of 73 patients (50.7%) and was more prevalent in morbidly obese patients with metabolic syndrome. HDL-C was lower and TGs were higher in the hypovitaminosis D group [21]. Similar positive associations have been observed in numerous other studies conducted across various populations [22,23,24,25,26,27,28,29,30,31,32]. A recent cross-sectional study confirmed that the percentage of individuals with dyslipidemia and dysglycemia was higher in subjects with low levels of vitamin D [33]. Results from some studies suggested a possible correlation with gender. In a study by Wang et al. [34], vitamin D deficiency seemed to be associated with an increased risk of dyslipidemia more in men than in women. However, in a more recent paper by AlQuaiz et al., it was observed that hypovitaminosis D was associated with lower HDL-C levels in men and higher TG levels in women [35]. Many authors studied vitamin D and lipid profiles in young adults and children; also in these groups, vitamin D deficiency seemed to be associated with an increased risk of dyslipidemia [36,37,38,39,40,41,42,43,44,45]. A study by Al-Ajlan et al. analyzed the relationship between vitamin D and lipids in Saudi pregnant women, who had higher incidence of obesity, diabetes, and cardiovascular disease during the course of pregnancy. Surprisingly, serum vitamin D levels positively correlated with serum levels of TC and TGs [46]. Conversely, a prospective study carried out on a large cohort of Brazilian women reported that low 25OHD concentrations during early pregnancy were associated with higher TC, LDL-C, and TC/HDL-C ratios throughout pregnancy [47]. This correlation was recently confirmed in a study carried out on 2479 pregnant Chinese women in the second trimester. Serum 25OHD levels were inversely associated with TC, TG, HDL-C, LDL-C, and hs-CRP levels, suggesting that higher levels of vitamin D during pregnancy may improve lipid levels and inhibit the rise of hs-CRP [48].
The effect of vitamin D on lipid profile has also been studied in subpopulations with higher cardiovascular risk, such as patients with type 2 diabetes mellitus (T2DM), finding significant correlations [49,50,51,52]. Insulin resistance has effects on lipids [53]; therefore, vitamin D, having a regulatory role on insulin resistance [54], could also act on lipids in diabetic patients through this mechanism.
A meta-analysis conducted by Jafari et al. aimed to clarify the effect of vitamin D on serum TC, TGs, LDL-C, and HDL-C in T2DM patients; 17 studies comparing an intervention group (which received vitamin D) with a control group (which received a placebo) were enrolled in the study. The meta-analysis demonstrated that vitamin D improved serum levels of TC, TGs, and LDL-C in patients with T2DM, although changes in serum HDL-C levels were not significant [55].
One of the most influential studies on vitamin D and lipids was conducted by Ponda et al. in 2012 [56]. In this study, 4.06 million laboratory test results from September 2009 to February 2011 were analyzed. The study was both a cross-sectional study and a retrospective cohort analysis. While vitamin D deficiency was associated with an unfavorable lipid profile in cross-sectional analyses, replenishing vitamin D deficiency up to normal levels did not change lipid concentrations. Thus, although observational studies suggest that vitamin D deficiency impacts lipoprotein levels, Ponda’s study reported that this effect was not confirmed in interventional studies. Table 1 describes the main characteristics of observational studies.
3.2. Interventional Studies
In addition to observational studies on the link between vitamin D and lipids, several interventional studies on this topic are available in the literature. One of the earliest studies dates back to 1970 by Carlson et al., who examined the effect of vitamin D supplementation for 6 weeks on lipid profiles. The study concluded that replenishing vitamin D had no impact on lipid concentrations [57]. Yousefi Rad carried out a study on 58 diabetic patients, where for 2 months, 28 subjects received 100 micrograms (4000 IU) of vitamin D while 30 subjects received a placebo. HDL-C levels increased significantly in both groups; no difference was observed in the replenishment group [58]. A double-blind randomized placebo-controlled trial on 70 diabetic patients, who received vitamin D or a placebo for 12 weeks, showed a significant reduction in TC, LDL-C, and TGs, in both groups. HDL-C level decreased significantly only in the placebo group; however, the variables did not all achieve statistical significance [59]. Moreover, numerous studies over time have shown that there is no change in TC, LDL-C, HDL-C, and TGs after treatment with different doses of vitamin D [60,61,62,63,64,65,66,67,68,69,70,71,72,73,74,75,76,77,78,79,80,81,82,83,84,85,86,87,88,89,90]. A prospective, randomized, open-label trial carried out on healthy Indian men compared the effect of increased sunlight exposure versus vitamin D supplementation on 25OHD status and lipid profile in subjects with vitamin D deficiency. In the sunlight exposure group, an increase in vitamin D levels significantly reduced TC, LDL-C, and HDL-C concentrations, while in the cholecalciferol supplementation group, TC and HDL-C levels increased [91]. However, these data are not unique. In fact, there are also studies which have demonstrated that vitamin D supplementation can have effects on lipids. This is the case of the paper of Farag et al. [92], in which daily vitamin D supplementation for 12 weeks associated with moderate physical activity led to a significant reduction in lipid profile in patients with metabolic syndrome. In the paper of Salekzamani [93], vitamin D replenishment seemed to have positive effects only on TGs. Also, Asemi et al. demonstrated a significant decrease in TGs and VLDL-C in a population who received calcium and vitamin D [94]. This reduction in TG levels was also observed in other studies [95,96,97,98,99,100].
In the study by Imga et al., carried out on 122 overweight or obese women who underwent to vitamin D replenishment, it was concluded that vitamin D supplementation led to an improvement in HOMA-IR and LDL-C values [101]. The same results were demonstrated in a group of 120 adult Saudi patients with controlled T2DM who received 2000 IU of vitamin D daily for 18 months. The vitamin D replenishment brought about an improved lipid profile (a decrease in LDL-C and TC) and an improvement in HOMA-β function [102]. Shab-Bidar et al., in a study carried out into T2DM, found a decrease in LDL-C and TC along with a significative increase in HDL-C after vitamin D supplementation [103]. Replenishment with vitamin D was also associated with decreased TC in a T2DM Spanish study [104]. A recent study by Sacheck JM et al. found that replenishment with vitamin D had positive effects on HDL-C, LDL-C, and TC [105] in young people. Significant improvements in serum HDL-C in a vitamin D group was also found by Liyanage [106] in subjects with T2DM and early-stage nephropathy. An Iranian randomized controlled trial carried out on 168 subjects with prediabetes showed significantly increased HDL-C levels in the co-supplementation group (with omega 3 and vitamin D) compared to the other three groups (placebo group, only omega 3 group, only vitamin D group) [107]. Samimi et al. carried out a double-blind, placebo-controlled trial on 60 women at risk for pre-eclampsia from 20 to 30 weeks of gestation; in particular, 30 women received 50,000 IU of cholecalciferol every 2 weeks plus 1000 mg of calcium per day, and 30 women received a placebo [108]. The study demonstrated that vitamin D plus calcium administration for 12 weeks had beneficial effects on HDL-C, glycemic status, and blood pressure among women at risk for pre-eclampsia. In 2018, Riek et al. studied the potential role of vitamin D in cardiovascular risk in diabetic patients, with very interesting results [109]. This study was based on the fact that vitamin D and its metabolites have effects on atherogenesis, acting on macrophages and peripheral blood monocytes in patients with diabetes [110]. Riek randomized 26 diabetic patients to receive either vitamin D at a dosage of 4000 IU/day or a placebo for 4 months. Monocytes of the patients were isolated; in 2TDM patients who received vitamin D, levels of oxidized LDL uptake in cultured monocytes had a reduction >50%. These data would support the positive effect of vitamin D on atherosclerosis and lipid carriers [110]. Moreover, in a group of 181 subjects with mild cognitive impairment, a replenishment for 12 months with 400 UI/day of vitamin D showed decreased levels of TC, TGs, and LDL-C as well as increased HDL-C [111]. In a very recent interventional study, the correction of vitamin D deficiency in Arab adults seemed to improve their 10-year risk of atherosclerotic cardiovascular disease (ASCVD). This result is very interesting; once optimal vitamin D levels were achieved, there was a modest improvement in glucose and HDL-C levels, resulting in a decrease in ASCVD risk scores [112]. However, a study by Schwetz et al. demonstrated that vitamin D supplementation significantly increased TC, TGs, VLDL-C, LDL-C, HDL-C, ApoB, and ApoB, indicating a negative effect on lipid profile [113]. An increase in LDL-C levels after replenishment was observed also by Zittermann in 2009 [114]. The non-univocal interpretation of the results on the relationship between vitamin D and lipids is evident in the studies of Jorde. In a cross-sectional study from 2010 carried out on 1762 nonsmoking and 397 smoking subjects, Jorde [115] found a significative decrease in TGs with an increase in vitamin D. In the same year, Jorde randomized 438 overweight or obese subjects to receive (a) 40,000 IU of vitamin D weekly, (b) 20,000 IU of vitamin D weekly, or (c) a placebo for one year; the result was that replenishment with vitamin D had no effect on serum lipid levels. In 2016, in a randomized placebo-controlled trial conducted on 511 subjects with prediabetes, Jorde also found a significant decrease in LDL-C in the vitamin D supplementation group [116]. Moreover, the most recent papers show conflicting results on the effect of vitamin D supplementation on dyslipidemia [117,118,119]. Table 2 describes the main characteristics of interventional studies.
In Figure 3, we report the number of studies presenting responses to treatment with vitamin D.
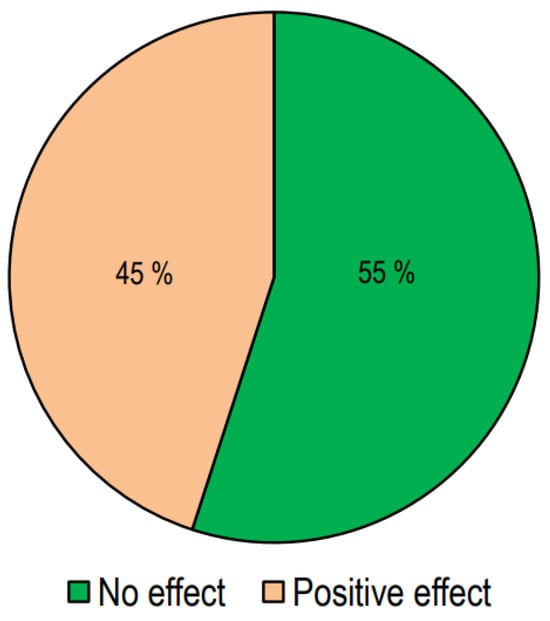
Figure 3.
The effect of vitamin D supplementation on lipid profiles in interventional studies.
Out of the 64 interventional studies examined, 35 (55%) indicated no significant effects on lipid profiles following vitamin D supplementation, whereas 29 (45%) demonstrated a significant alteration in lipid profile. Taking into consideration the studies carried out on patients with T2DM, we have observed that treatment with vitamin D gave positive answers in a greater number of studies (57%). Also, in the group of studies conducted in patients with metabolic syndrome or who were overweight/obese, it was found that the number of studies with positive results was slightly higher than those with negative results. On the other hand, in studies conducted on healthy subjects, the response rate was markedly lower.
In Figure 4 we reported the effect of Vitamin D supplementation on lipid profile in different categories of patients.

Figure 4.
The effect of Vitamin D supplementation on lipid profile in different categories of patients.
Figure 4.
The effect of Vitamin D supplementation on lipid profile in different categories of patients.


Table 1.
Main characteristics of observational studies.
Table 1.
Main characteristics of observational studies.
| Study/Years | Country | Subjects | Study | Description/Evaluation | Results/Conclusion |
|---|---|---|---|---|---|
| Auwerx J et al. (1992) [16] | Belgium | 185 ♂. Age: 38.7 ± 10.9 yrs 25OHD: 29.6 ± 12.1 ng/mL 173 ♀. Age: 37.2 ± 10.4 yrs 25OHD: 30.4 ± 14.5 ng/mL | Observational | total serum calcium, 25OHD, y-GT, TC, HDL-C, apo A-1, apo B, and total protein | Positive correlation between 25OHD and apoA-1 and HDL-C levels |
| Botella-CarreteroJI et al. (2007) [21] | Spain | 73 obese patients 36 without vit D deficiency (Age: 42.17 ± 11.6 yrs 25OHD: 45.7 ± 35.5 ng/mL 37 with vit D deficiency (Age: 39.07 ± 12.7 yrs 25OHD 13.3 ± 3.8 ng/mL) | Transversal, observational | BMI, FG, 25OHD, lipid profile, glucose, insulin and insulin resistance | 25OHD deficiency was more prevalent in morbidly obese patients with metabolic syndrome; HDL-C was lower and TGs were higher in the hypovitaminosis D group |
| Kostecka D et al. (2022) [23] | Poland | 191 ♀ (45–65 yrs) 25OHD: 23 ng/mL | Observational | lipid profile, glycemia and 25OHD | Negative correlation between 25OHD and TC, LDL-C, and TGs |
| Chaudhuri J.R. et al. (2012) [18] | India | 91 (48 ♂ and 43 ♀) normal vit D (Age: 49 ± 16.1 yrs) 91 (48 ♂ and 43 ♀) vit D deficiency (Age: 50.1 ± 15.1 yrs) | Observational | FG, lipid profile calcium, alkaline phosphatase, phosphorus, CRP, 25OHD | Hypovitaminosis D was associated with increased levels of TC, LDL-C and TGs and lower levels of HDL-C |
| Karhapää P. et al. (2010) [19] | Finland | 909 ♂ DMT2 Age: 45–70 yrs 25OHD = 22.1–163.6 nmol/L | Observational | lipid profile, 25OHD, and 1,25OHD | Low levels of 1,25OHD were associated with low HDL-C levels; low levels of 25OHD were associated with high levels of TC, LDL-C and TGs |
| Guasch A. et al. (2012) [20] | Spain | 76 ♂ Age: 49.28 yrs 25OHD: 65.01 nmol/L 240 ♀ Age: 46.08 yrs 25OHD: 53.55 nmol/L | Retrospective | FG, calcium, phosphate, alkaline phosphatase, lipid profile, creatinine, serum albumin, erythrocyte sedimentation rate (ESR) and leukocyte count, uCRP | Low levels of 25OHD were associated higher levels of TGs |
| Jiang X et al. (2019) [12] | China | 3788 adults 2056 (54.28%) had dyslipidemia 25OHD: ≤8.02–≥33.71 nmol/L | Cross-sectional | lipid profile and 25OHD | 25OHD was inversely correlated with LDL-C and TG levels, and positively correlated with HDL-C |
| Sharba ZF et al. (2020) [22] | Iraq | 58 ♂ and 72 ♀. Age: 20–70 yrs 3 groups by serum level of vit D: <10 ng/mL—vit D deficient 10–30 ng/mL—vit D insufficient 30–100 ng/mL vit D normal | Cross-sectional | lipid profile and 25OHD | HDL-C was significantly reduced in low levels of 25OHD, while LDL-C and TG levels were increased |
| Saheb Sharif-Askari F S et al. (2020) [24] | Arab Emirates | 1848 ♂, 641 ♀. Age: 18 to 80 yrs Insulin resistance group 25OHD: 28.50 ng/mL Insulin-sensitive group 25OHD: 31.20 ng/mL | Cross-sectional | lipid profile and 25OHD, IL-6, IL-8, and soluble thrombomodulin | Hypovitaminosis D was associated with lower HDL-C |
| Guan C. et al. (2020) [25] | China | 10,038 subjects 25OHD: <20 ng/mL | Cross-sectional | lipid profile and 25OHD | Deficient serum 25OHD was associated with higher TC, LDL-C, and TGs |
| Han YY et al. (2021) [28] | China | 715 (527 ♂ and 188 ♀) Age: 35–65 yrs first group: 25OHD < 15 ng/mL second group: 25OHD ≥15 ng/mL | Observational | lipid profile and 25OHD, glucose | Hypovitaminosis D was associated with increased levels of LDL-C, TGs and VLDL-C |
| Yang K. et al. (2020) [30] | China | 1928 (958 ♂–970 ♀) Age: 18–87 yrs 25OHD: <15 nmol/L | Observational | lipid profile, 25OHD, FPG, H2PG, BMI | 25OHD level was negatively correlated with FPG, TC and TGs |
| Wang Y. et al. (2016) [49] | China | 1475 829 ♂ Age: 25–64.5 yrs 646 ♀ Age: 24–64 yrs 25OHD: 27–92.25 nmol/L | Cross-sectional | lipid profile and 25OHD, BMI | In ♂, elevated TGs and reduced HDL-C were associated with hypovitaminosis D; in ♀, no significant difference |
| AlQuaiz AM et al. (2020) [35] | Saudi Arabia | 653 ♂ Age: 40.1 ± 10.2 yrs 1064 ♀ Age: 39.1 ± 8.3 yrs first group 25OHD: <50 nmol/L second group 25OHD: ≥50 nmol/L | Cross-sectional | lipid profile and 25OHD | Hypovitaminosis D was associated with low levels of HDL-C (higher in ♂ than in ♀) and high levels of TGs (in ♀ but not in ♂) |
| Kostrova GN. et al. (2022) [36] | Russia | 64 boys and 214 girls Age: 18–24 yrs 25OHD: 14.9–26.3 ng/mL | Observational | lipid profile and 25OHD, BMI | In ♂, a negative correlation was found between 25OHD levels and TC and LDL |
| Kim MR. et al. (2019) [37] | Korea | 117 boys and 126 girls Age: 9–18 yrs 25OHD: 17.27 ng/mL | Observational | lipid profile and 25OHD, BMI | The vitamin D-deficient group showed higher TG levels and TG/HDL-C ratios |
| Delvin EE et al. (2010) [38] | French Canadian | 878 boys and 867 girls Age: 9–16 yrs Boys: 25OHD: 45.9 ± 12.2 nmol/L Girls: 25OHD: 45.9 ± 13.0 nmol/L | Cross-sectional | lipid profile and 25OHD, fasting plasma insulin, glucose, apolipoproteins (apo) A1 and B | Modestly higher concentration of plasma TC, TGs, apoA1, and apoB for each 10 nmol/L of 25OHD increase in plasma in girls only |
| Williams DM et al. (2011) [39] | USA | 7078 subjects Age: 12–19 yrs 25OHD: 50.4 nmol/L | Cross-sectional | lipid profile and 25OHD, fasting insulin and glucose, post-load glucose and HbA1c | 25OHD was positively associated with HDL-C values |
| Rajakumar K. et al. (2011) [40] | USA | 237 subjects Age: 12.7 ± 2.2 yrs 25OHD: 19.4 ± 7.4 ng/mL | Observational | lipid profile and 25OHD, BMI | Lower levels of 25OHD are associated with lower HDL-C |
| Birken CS et al. (2015) [41] | Canada | 996 boys and 965 girls Age: 1–5 yrs 25OHD: 85 nmol/l | Cross-sectional | lipid profile and 25OHD | A significant association between increased 25OHD and decreased non-HDL-C; each 10 nmol/L increase in 25OHD was associated with a decrease in non-fasting TC and in non-fasting TGs |
| Yarparvar, A. et al. (2020) [43] | Iran | 71 boys (17 yrs) 25OHD: first group < 25 ng/mL second group ≥ 25 ng/mL | Observational | lipid profile and 25OHD, IL-10, IL-6, hsCRP, and TNFR-2 | HDL-C level was lower in hypovitaminosis D |
| Saeidlou N. et al. (2017) [44] | Iran | 541 subjects Age: 5–60 yrs; In winter: 25OHD: 45.8 ± 24.26 ng/mL; in summer: 25OHD: 55.24 ± 37.47 ng/mL | Cross-sectional | lipid profile and 25OHD and comparison of values between summer and winter | Comparing serum lipid levels in summer and in winter showed a significant difference in TC, LDL-C, and HDL-C, but no significant effect was found for TGs |
| Song K. et al. (2020) [45] | Korea | 3183 subjects Age: 12–18 yrs 25OHD: 6.15 ng/mL | Cross-sectional | lipid profile and 25OHD | Vitamin D deficiency is related with low HDL-C levels |
| Al-Ajlan, A et al. (2015) [46] | Saudi Arabia | 515 pregnant ♀ Age: 28.71 ± 6.07 yrs 25OHD: 24.42 ± 15.4 nmol/L | Cross-sectional | lipid profile and 25OHD | Serum vitamin D values correlated positively with serum levels of TC and TGs |
| Lepsch, J. et al. (2017) [47] | Brazil | 194 pregnant ♀ Age: 26.7 ± 5.5 yrs first group 25OHD: ≥75 nmol/L second group25OHD: <75 nmol/L | Cross-sectional | lipid profile and 25OHD | Women with low levels of 25OHD had higher LDL-C than those with adequate concentrations |
| Jin D. et al. (2020) [48] | China | 2479 pregnant ♀ Age: 29.3 ± 4.2 yrs 25OHD: 40.08 nmol/L | Observational | lipid profile and 25OHD hs-CRP | Increased serum 25OHD was significantly associated with decreasing TC, TGs, HDL-C, LDL-C, and hs-CRP levels |
| Wang L. et al. (2020) [49] | China | 2659 (Age: 54–66 yrs) 849 T2DM (324 ♂, 525 ♀) 25OHD: 29.77 ng/mL 913 IFG (352 ♂, 561 ♀) 25OHD: 29.26 ng/mL 897 NGT (344 ♂, 553 ♀) 25OHD: 31.12 ng/mL | Case–control | lipid profile and 25OHD, HOMA-IR, BMI | Adequate vitamin D levels could reduce the risk of IFG and T2DM by reducing the lipid profile |
| Saedisomeolia, A. et al. (2014) [50] | Iran | T2DM 108 Age: 47.65 ± 12.08 yrs sufficient group 25OHD: ≥50 nmol/L deficiency group 25OHD: <50 nmol/L | Cross-sectional | lipid profile and 25OHD, calcium, phosphorus, PTH | Subjects with vit D deficiency had higher serum levels of TC, TGs, and LDL-C and lower levels of HDL-C compared to subjects with vit D sufficiency. Association was statistically significant only for TGs |
| Huang, Y. et al. (2013) [51] | China | T2DM 1326 ♂ Age: 47.6 ± 11.3 yrs T2DM 1326 ♀ Age: 49.4 ± 13.1 yrs 25OHD: 25.4 ± 6.5 ng/mL | Cross-sectional | lipid profile and 25OHD, LPL, FFAs, FG, fasting insulin, apoA and apoB | Serum 25OHD concentration was positively associated with LPL |
| Raheem M. et al. (2022) [52] | Iraq | 47 T2DM subjects (Age: 35–64 yrs) 43 healthy (Age: 37–65 yrs) first group 25OHD: >22.5 ng/dL second group 25OHD: <22.5 ng/dL | Observational | lipid profile and 25OHD, HOMA-IR, HbA1c, FG | FG, HOMA-IR, TC and TGs were significantly elevated in T2DM compared to controls when the serum 25OHD was markedly low |
| Ponda M. et al. (2012) [56] | USA | 107.811 subjects Retrospective 2332 subjects 25OHD: <20 ng/mL 6260 subjects 25OHD: 20–30 ng/mL | Cross-sectional Retrospective cohort | association between lipid profile and 25OHD how changes in 25OHD levels relate to changes in lipid levels | Subjects with optimal levels ≥30 ng/mL had lower TC, LDL-C, TGs and higher HDL-C; correcting vitamin D deficiency had no effect on lipids |
| Li Y. et al. (2021) [28] | USA | Cohort 1: N = 5580 Age: 48 (38–56) yrs 25OHD: 32 ng/mL Cohort 2: N = 6057 Age: 48 (38–56) yrs 25OHD: 34 ng/mL Cohort 3: N = 7249 Age: 49 (39–57) yrs 25OHD: 32 ng/mL | Observational, cross-sectional | lipid profile and 25OHD | Changes in vit D levels correlated negatively with changes in TC, LDL-C, and TGs; no changes in HDL-C levels |
| Gong T. et al. (2022) [27] | China | 153 T2DM ♂ Age: 50.45 ± 11.14 yrs 153 T2DM ♀ Age: 54.14 ± 11.59 yrs | Observational | lipid profile and 25OHD, HOMA-IR, BMI | In overweight/obese with T2DM, serum 25OHD was independently, negatively correlated with TGs |
| Jorde R. et al. (2010) [114] | Norway | Nonsmokers 8018 Age: 55.9 ± 12.6 yrs 25OHD: 54.1 ± 16.2 nmol/L Smokers 2087 Age: 53.6 ± 11.4 yrs 25OHD: 75.4 ± 20.9 nmol/L Nonsmokers 1762 Age: 55.5 ± 9.8 yrs 25OHD: 55.0 ± 17.7 nmol/L Smokers 397 Age: 52.1 ± 10.3 yrs 25OHD: 68.7 ± 20.8 nmol/L | Cross-sectional Longitudinal | serum 25OHD, TC, HDL-C, LDL-C, LDL-C/HDL-C ratio and triacylglycerol (TAG) | A significative decrease in TGs with the increase in vitamin D |
| Pathania M. et al. (2023) [29] | India | 120 ♂ and 115 ♀ MetS patients Age: 43.81 ± 10.45 yrs 25OHD: 19.14 ± 20.44 ng/mL | Single-center Cross-sectional | serum 25OHD, TC, HDL-C, LDL-C, LDL-C/HDL-C ratio, TGs | Low vit D serum levels show weak correlation with TC, TGs and LDL-C |
| Atia T. (2023) [32] | Saudi Arabia | n145 non diabetes: 25OHD: 30.28 ± 12.51 ng/mL n104 prediabetes: 25OHD: 24.86 ± 10.59 ng/mL | Cross-sectional study | serum 25OHD, TC, HDL-C, LDL-C, TGs, HOMA-IR, BMI, FG, | Vitamin D deficiency was more prevalent in prediabetes and it was associated with high TG and low HDL levels, with no significant changes in TC or LDL levels |
| Cheng YL (2023) [31] | Taiwan | 118 (53 ♂ 65 ♀; Age, 54.4 ± 10.6 yrs) 25OHD at baseline: 22.7 (17.6–29.2) (ng/mL) | Retrospective study | serum 25OHD, TC, HDL-C, LDL-C, TGs, HbA1c | Increased of 25OHD levels showed a significant reduction in TGs and TC |
| Chen CW et al. (2023) [33] | Taiwan | 407 ♂ and 569 ♀ Age: 20–45 yrs 25OHD < 12 ng/mL N = 205 age: 31.64 ± 4.59 yrs 25OHD 12–200 ng/mL N = 345 age: 31.54 ± 4.34 yrs 25OHD 20–30 ng/mL N = 344 age: 32.35 ± 4.61 yrs 25OHD > 30 N = 82 age: 32.65 ± 4.32 yrs | Single-center Cross-sectional | serum 25OHD, TC, HDL-C, LDL-C, TGs | Vit D deficiency was associated with higher TC, LDL-C, TGs, and non HDL-C |
Abbreviations: ♂, male; ♀, female; 25OHD, 25-hydroxyvitaminD; y-GT, serum gamma glutamyl transpeptidase; TC, total cholesterol; HDL-C, high-density lipoprotein cholesterol; apo A-1, apolipoprotein A-I; apoB, apolipoprotein B; BMI, bone mass index; FG, fasting glucose; TGs, triglycerides; LDL-C, low-density lipoprotein cholesterol; T2DM, Type 2 diabetes mellitus; uCRP, Ubiquitin Cross-Reactive Protein; IL-6, interleukin 6; IL-8, interleukin 8; VLDL-C, very low-density lipoprotein cholesterol; FPG, fasting plasma glucose; H2PG, 2h postprandial plasma glucose; HbA1c, glycohemoglobin; hsCRP, high-sensitivity C-reactive protein; TNFR-2, Tumor Necrosis Factor Receptor 2; HOMA-IR, Homeostatic Model Assessment of Insulin Resistance; IFG, impaired fasting glucose; PTH, parathyroid hormone; LPL, lipoprotein lipase; FFAs, free fatty acids; MetS, metabolic syndrome.
Table 2.
Main characteristics of the interventional studies.
Table 2.
Main characteristics of the interventional studies.
| Study/Year | Country | Healthy/ Comorbidity | Subjects | Study | Description | Results |
|---|---|---|---|---|---|---|
| Carlson LA et al. (1970) [57] | Sweden | Healthy | 121 ♂ aged 34.6 (range 21–64 yrs) Group A N = 43 Group B N = 32 Group C N = 46 | interventional | Duration of treatment: 6 weeks (A) No treatment (B) 500 IU vitamin D/day (C) 1000 IU vitamin D/day | vitamin D had no effect on the serum lipid levels |
| Scragg R et al. (1995) [61] | UK | Healthy | 199 subjects Age: 70 yrs (range 63–76) Vit D: N = 95 Placebo: N = 94 | randomized double-blind trial | Duration of treatment: a single oral dose of 2.5 mg cholecalciferol Assessment after 5 weeks | vitamin D supplementation had no effect on serum lipid levels |
| Andersen R et al. (2009) [62] | Denmark | Healthy | 89 ♀–84 ♂ Pakistani immigrants Vit D 10 mcg: N = 56 Vit D 20 mcg: N = 61 Placebo N = 56 | 1-year-long randomized double-blind placebo-controlled intervention | Duration of treatment: 12 months: Vit D 10 mcg daily Vit D 20 mcg daily | vitamin D had no effect on serum lipid levels |
| Makariou S et al. (2017) [63] | Greece | MetS subjects | 50 MetS subjects Vit D: N = 25 Age: 52 ± 9 yrs 25OHD status: 16.1 ng/mL Placebo: N = 25 Age: 51 ± 12 yrs 25OHD status: 9.9 ng/mL | pilot study PROBE (prospective, randomized, open-label, blinded end-point) design | Duration of treatment: 3 months: Vit D: 2000 IU vitamin D/day | vitamin D had no effect on serum lipid levels |
| Makariou S et al. (2019) [64] | Greece | MetS subjects | 50 MetS subjects Vit D: N = 25 Age: 52 ± 9 yrs 25OHD status: 16.1 ng/mL Placebo: N = 25 Age: 53 ± 7 yrs 25OHD status: 9.9 ng/mL | pre-specified analysis of a previous study | Duration of treatment: 3 months: Vit D: 2000 IU vitamin D/day | vitamin D had no effect on oxidative stress markers |
| Wongwiwatthananukit S et al. (2013) [65] | USA | MetS subjects | 46 ♀–44 ♂ patients with MetS Age: 63.6 ± 11.7 yrs 25-OHD status: 15.19 ± 3.23 ng/mL Placebo: N = 30 DP 20.000 IU: N = 30 DD 40.000 IU: N = 30 | a prospective, randomized, double-blind, double-dummy, parallel trial | Duration of treatment: 8 weeks: Group DP: vitamin D 20.000 IU/week, Group DD: vitamin D 40.000 IU/week, | vitamin D had no effect on serum lipid levels |
| Yin X et al. (2016) [67] | China | MetS subjects | 126 MetS subjects Age: 49.5 ± 8.72 yrs 25-OHD status: 14.5 ± 3.3 ng/mL Vit D: N = 61 Placebo: N = 62 | 1-year long randomized double-blind placebo-controlled | Duration of treatment: 1 year: Vit D: daily 700 IU vitamin D | vitamin D had no effect on serum lipid levels |
| Farag A et al. (2019) [92] | Iraq | MetS subjects | 70 MetS patients Vit D: N = 24 Age: 40.5 ± 5.9 yrs 25-OHD status: 10.7 ± 2.8 ng/mL Vit D + PA: N = 21 Age: 40.4 ± 5.9 yrs 25-OHD status: 10.4 ± 3.2 ng/mL Placebo: N = 25 Age: 42.6 ± 5.6 yrs 25-OHD status: 12.2 ± 3.9 ng/mL | randomized controlled trial | Duration of treatment: 12 weeks: Vit D: 2000 UI/day vitamin D, Vit D + PA: 2000 UI/day vitamin D and physical activity | only vitamin D + PA reduced TC, LDL-C and HDL-C |
| Imga N N et al. (2019) [101] | Turkey | Overweight/obese | 72 ♀ overweight Age: 42.5 ± 10.8 yrs 25OHD status: 6.1 ng/mL 50 ♀ obese Age: 43.9 ± 10.1 yrs 25OHD status= 5.6 ng/mL | interventional study | Duration of treatment: 6 months: 100.000 IU/week as a loading dose for 8 weeks following a maintenance dose of 3000 IU/day | vitamin D reduced LDL-C and HOMA-IR |
| Patwardhan V. et al. (2017) [91] | India | Healthy | 150 healthy Indians Increase Sunlight: N = 50 Age: 47.6 ± 6.6 yrs 25OHD status: 35.6 ± 11.8 nmol/L Vit D: N = 50 Age: 47.5 ± 6.4 yrs 25OHD status: 31.9 ± 12.7 nmol/L Control: N = 50 Age: 47.7 ± 6.8 yrs 25OHD status: 66.3 ± 13.8 nmol/L | prospective, randomized open-label trial | Duration of treatment: 6 months: Increase Sunlight: Sunlight exposure 20 min forearms and face between 11 a.m. and 3 p.m.; Vit D: cholecalciferol 1000 IU/day | sunlight exposure reduced TC, LDL-C, and HDL-C vitamin D supplementation increased TC and HDL-C |
| Jorde R et al. (2010) [116] | Norway | Overweight/obese | 438 overweight or obese subjects Vit DD group: N = 150 Age: 46.3 ± 11.3 yrs 25-OHD status: 57.7 ± 21.2 nmol/L Vit DP group: N = 139 Age: 47.3 ± 11.9 yrs 25-OHD status: 56.7 ± 21.2 nmol/L Placebo group: N = 149 Age: 48.9 ± 11.0 yrs 25-OHD status: 58.8 ± 21 nmol/L | 1 year, double-blind placebo-controlled intervention trial | Duration of treatment: 1 yrs: Vit DD: cholecalciferol 40,000 IU per week, Vit DP: cholecalciferol 20,000 IU per week, | vitamin D had no effect on serum lipid levels |
| Salekzamani S et al. (2016) [93] | Iran | MetS subjects | 80 MetS subjects (40.49 ± 5.04 yrs) 25OHD status < 75 nmol/L Vit D group: N = 35 Placebo group: N = 36 | randomized, controlled, double-blind study | Duration of treatment: 16 weeks: Vit D group: 50.000 IU vitamin D weekly | vitamin D supplementation decreased TGs and TG/HDL |
| Heikkinen A M et al. (1997) [60] | Finland | Postmenopausal women in hormone replacement therapy | 464 ♀ HRT group N = 65 Age: 52.9 ± 0.29 yrs Vit D N = 83 Age: 52.8 ± 0.24 yrs HRT + Vit D N = 77 Age: 52.4 ± 0.28 yrs Placebo N = 95 Age: 52.5 ± 0.22 yrs | interventional study | Duration of treatment: 3 yrs: HRT (2 mg estradiol valerate + 1 mg cyproterone acetate) Vit D3 (cholecalciferol 300 IU/day) HRT + Vit D3 (both as above), Placebo (calcium lactate 500 mg/day) | vitamin D had no effect on serum lipid levels |
| Zittermann A. et al. (2009) [114] | Germany | Overweight/obese | 200 overweight subjects 25OHD status= 12 ng/mL Vit D group: N = 82 Age: 47.4 ± 10.3 yrs Placebo group: N = 83 Age: 48.8 ± 10.1 yrs | double-blind placebo-controlled intervention trial | Duration of treatment: 12 months: Vit D group: 83.3 mcg/day (3332 IU) cholecalciferol/daily | vitamin D reduced TGs and increased LDL-C |
| von Hurst P. et al. (2010) [70] | New Zealand | Insulin resistance | 81 ♀ insulin resistant 25OHD status < 50 nmol/L Vit D group: N = 42 Age: 41.8 ± 10.1 yrs Placebo: N = 39 Age: 41.5 ± 9.1 yrs | randomized, placebo- controlled, double-blind trial | Duration of treatment: 6 months: Vit D: cholecalciferol 4000 IU/day | vitamin D had no effect on serum lipid levels |
| Nagpal J. et al. (2009) [66] | India | Healthy | 100 ♂ Vit D: N = 35 Age: 42.4 ± 6.6 yrs Control: N = 36 Age: 45.0 ± 9.2 yrs | double-blind randomized controlled trial | Duration of treatment: 6 weeks: Vit D: 3 doses of vitamin D (120,000 IU) fortnightly | vitamin D had no effect on serum lipid levels |
| Witham M D et al. (2013) [69] | UK | Healthy | 50 ♀ Vit D group N = 25 Age: 41.7 ± 13.4 yrs 25OHD status: 27 ± 13 nmol/L Placebo N = 25 Age: 39.4 ± 11.8 yrs 25OHD status: 28.7 ± 5.5 nmol/L | parallel-group, double-blind, randomized placebo-controlled trial. | Duration of treatment: 8 week: Vit D group: a single dose of 100,000 IU vitamin D3 | vitamin D had no effect on serum lipid levels |
| Shab-Bidar S. et al. (2011) [103] | Iran | T2DM | 43 ♂–57 ♀ T2DM (52.5 ± 7.4 yrs) PYD group: N = 50 FYD group: N = 50 | randomized controlled clinical trial (RCT) | Duration of treatment: 12 weeks: PYD: yogurt drink (170 mg calcium) twice a day; FYD: D-fortified yogurt drink (170 mg calcium + Vit D 500 IU/250 mL) twice a day | vitamin D decreased TGs, TC and LDL-C and increased HDL-C |
| Nikooyeh B. et al. (2011) [68] | Iran | T2DM | 35 ♂–55 ♀ T2DM Age: 50.7 ± 6.1 yrs PY: N = 30 DY: N = 30 DCY: N = 30 | interventional study | Duration of treatment: 12 weeks: PY= plain yogurt (150 mg Ca) twice per day; DY = vit D-fortified yogurt drink (500 IU vitamin D3 and 150 mg Ca) twice per day; DCY = calcium + vit D-fortified yogurt drink (500 IU vitamin D3 and 250 mg Ca) twice per day; | vitamin D had no effect on serum lipid levels |
| Wood A. et al. (2012) [71] | UK | Healthy post menopausal women | 305 healthy PMO ♀ Age: 63.8 ± 2.2 yrs Vit D 400 IU: N = 102 25OHD status: 32.7 ± 12.9 nmol/L Vit D 1000 IU: N = 101 25OHD status: 32.4 ± 13.8 nmol/L Placebo: N = 102 25OHD status: 36.2 ± 17.1 nmol/L | parallel-group, double-blind, placebo-controlled randomized controlled trial. | Duration of treatment: 1 yrs: Vit D3 400 UI daily Vit D3 1000 UI daily | vitamin D had no effect on serum lipid levels |
| Muldowney S. et al. (2012) [73] | Ireland | Healthy | aged 20–40 yrs N = 202 Age: 29.9 ± 6 yrs 25OHD status: 70.4 nmol/L aged > 64 yrs N = 192 Age: 70.8 ± 5 yrs 25OHD status: 54.2 nmol/L | two separate, identical, double-blind, randomized, placebo-controlled intervention studies | Duration of treatment: 22 weeks in winter: All group assumed doses of 0, 5, 10, or 15 mcg daily of cholecalciferol | vitamin D had no effect on serum lipid levels |
| Chai W. et al. (2013) [72] | Hawaii | Patients with colorectal adenoma | 92 colorectal adenoma (30–75 yrs of age) Placebo Group: N = 23 Age: 58.5 ± 21.2 yrs Ca group: N = 23 Age: 61.9 ± 8.2 yrs Vit D group: N = 23 Age: 60.2 ± 8.1 yrs Ca + Vit D group: N = 23 Age: 62.1 ± 7.5 yrs | pilot, randomized, double-blind, placebo-controlled, 2 × 2 factorial design, 6-month clinical trial | Duration of treatment: 6 months: Ca group: calcium carbonate 1 g twice daily Vit D group: cholecalciferol 400 IU twice daily Ca + Vit D group: calcium carbonate 1 g twice daily + 400 IU vitamin D twice daily | vitamin D had no effect on serum lipid levels |
| Breslavsky A. et al. (2013) [74] | Israel | T2DM | 47 T2DM patients Group Vit D N = 24 Age: 66.8 ± 9.2 yrs 25OHD status: 12.91 ± 10.69 ng/mL Group placebo N = 23 Age: 65.8 ± 9.7 yrs 25OHD status: = 10.79 ± 6.57 ng/mL | randomized, double-blind, placebo-controlled study | Duration of treatment: 12 months: Group Vit D: cholecalciferol 1000 IU/day | vitamin D had no effect on serum lipid levels |
| Sadiya A. at al. (2015) [75] | UAE | Obese and T2DM | 87 obese and T2DM Vit D group: N = 45 Age: 49 ± 8 yrs 25OHD status: 28.5 ± 9.2 nmol/L Placebo group: N = 45 Age: 48 ± 8 yrs 25OHD status: 30.5 ± 11.3.2 nmol/L | randomized double-blind clinical trial | Duration of treatment: 3 months: Vit D group 6000 IU vit D/day For 3 months: Vit D group 3000 IU vit D/day For 6 months: All 2200 IU vit D/day | vitamin D had no effect on serum lipid levels |
| Moghassemi S et al. (2014) [76] | Iran | Healthy postmenopausal women | 76 ♀ healthy PM Vit D group: N = 43 Age: 52.73 ± 4.56 yrs 25OHD status: 34.45 ± 4.9 nmol/L Placebo group: N = 36 Age 51.90 ± 9.94 yrs 25OHD status 33.13 ± 19.77 nmol/L | randomized, double-blind, placebo-controlled, parallel-group study | Duration of treatment: 12 weeks: Vit D3 group: 2000 IU once daily | vitamin D had no effect on serum lipid levels |
| Dalbeni A. et al. (2014) [78] | Italy | Chronic heart failure patients | 23 chronic HF patients Vit D group: N = 13 Age: 71.2 (67.0–75.4) yrs 25OHD status: 16.2 (11.8–20.7) ng/mL Placebo group: N = 10 Age: 73.4 (64.1–82.7) yrs 25OHD status: 16.0 (11.9–20.2) ng/mL | a double-blind, randomized, placebo-controlled trial | Duration of treatment: 6 months; 4000 IU/daily of cholecalciferol | vitamin D had no effect on serum lipid levels |
| Ryu O. et al. (2014) [79] | Korea | T2DM | 62 T2DM subjects Vit D group: N = 40 Age: 54.5 ± 7.4 yrs 25OHD status: 10.7 ± 2.6 ng/mL Placebo group: N = 41 Age: 56.7 ± 7.9 yrs 25OHD status: 12.3 ± 3.0 ng/mL | prospective, randomized, double-blind-ed, placebo-controlled trial | Duration of treatment: 24 weeks; Vit D group: 1000 IU of cholecalciferol + 100 mg calcium twice daily Placebo group: 100 mg calcium twice daily | vitamin D had no effect on serum lipid levels |
| Yousefi Rad E. et al. (2014) [58] | Iran | T2DM | 58 T2DM subjects Vit D group: N = 28 Age: 50.03 yrs 25OHD status: 15.55 ± 1.91 ng/mL Placebo group: N = 30 Age: 49.9 yrs 25OHD status: 14.64 ± 2.22 ng/mL | randomized controlled trial study | Duration of treatment: 2 months: 4000 IU Vitamin D/day | HDL-C level increased significantly in both groups |
| Kim HJ. et al. (2014) [80] | Korea | T2DM | 52 T2DM subjects Vit D + Training group: N = 15 Age: 69.53 ± 0.84 yrs 25OHD status: 11.91 ± 1.66 ng/mL Training group: N = 13 Age: 68.54 ± 1.18 yrs 25OHD status: 13.05 ± 1.43 ng/mL Vit D group: N = 11 Age: 73.27 ± 2.0 6 yrs 25OHD status: 10.44 ± 1.80 ng/mL Control group: N = 13 Age: 70.08 ± 1.37 yrs 25OHD status: 11.66 ± 2.80 ng/mL | interventional study | Duration of treatment: 12 weeks: Vit D + Training group: Vitamin D 1200 IU + exercise 3–4 times/week for 20 min Training group: exercise Vit D group: vitamin D 1200 IU per day | vitamin D combined with exercise training reduced TC, TGs, LDL-C and increase HDL-C |
| Kampmann U. et al. (2014) [81] | Denmark | T2DM | 16 T2DM patients Vit D group: N = 8 Age: 61.6 ± 4.4 yrs 25OHD status: 31.0 ± 4.9 nmol/L Placebo group: N = 8 Age: 57 ± 4.5 yrs 25OHD status: 34.8 ± 3.8 nmol/L | a randomized, placebo-controlled, double-blind trial | Duration of treatment: 2 weeks: Vit D group: cholecalciferol 11,200 IU daily For 10 weeks: Vit D group: cholecalciferol 5600 IU daily | vitamin D had no effect on serum lipid levels |
| Eftekhari MH et al. (2014) [59] | Iran | T2DM | 70 T2DM patients Treatment group: N = 35 Age: 53.8 ± 8.9 yrs Placebo group: N = 35 Age: 52.4 ± 7.8 yrs | double-blind randomized placebo-controlled | Duration of treatment: 12 weeks: Treatment group: Calcitriol 0.25 mcg twice/day | there was a reduction in TC, TGs and LDL-C in all groups; HDL-C only in placebo group |
| Al-Zahrani MK et al. (2014) [82] | Saudi Arabia | T2DM | 200 T2DM patients Vit D group: N = 100 Age: 56.9 ± 9.4 yrs 25OHD status: 25.3 ± 13.8 nmol/L Placebo group: N = 100 Age: 52.5 ± 8.1 yrs 25OHD status: 22.0 ± 15.2 nmol/L | randomized placebo-controlled | Duration of treatment: 3 months: Vit D group: cholecalciferol 45,000 IU orally once every week for 2 months and a single 45,000 I.U. dose in the last month | vitamin D had no effect on serum lipid levels |
| Asemi Z et al. (2015) [94] | Iran | Overweight/obese women with PCOS | 104 ♀ overweight and obese with PCOS Placebo group: N = 26 Age: 24.3 ± 5.2 yrs 25OHD status: 14.0 ± 4.1 ng/mL Calcium group: N = 26 Age 25.0 ± 6.7 yrs 25OHD status: 13.9 ± 2.0 ng/mL Vit D group: N = 26 Age 25.6 ± 4.4 yrs 25OHD status: 11.6 ± 4.7 ng/mL Vit D + Calcium group: N = 26 Age: 24.9 ± 5.1 yrs 25OHD status: 15.1 ± 3.6 ng/mL | randomized double-blind placebo controlled clinical trial | Duration of treatment: 8 weeks Calcium group: 1000 mg/d calcium Vit D group: 50,000 IU/week Vit D + calcium group: 1000 mg calcium/d + 50.000 IU/week | calcium + vitamin D reduced TGs and VLDL-C |
| Qin XF et al. (2015) [95] | China | Hypercholesterolemia | 56 subjects with hypercholesterolemia Vit D group: N = 100 Age: 67.7 ± 8.9 yrs 25OHD status: 21.1 ± 11.7 ng/mL Placebo group: N = 100 Age: 67.8 ± 8.1 yrs 25OHD status: 21.2 ± 11.4 ng/mL | single-center, double-blind, placebo-controlled trial | Duration of treatment: 6 months: Vit D group: add-on to statin vitamin D 2000 IU/day | vitamin D reduced TC, LDL-C and TGs and increase HDL-C |
| Muñoz-Aguirre P. at al. (2015) [96] | Mexico | T2DM | 104 ♀ T2DM Vit D group: N = 52 Age: 56.1 ± 5.1 yrs 25OHD status: 54.8 ± 14.3 nmol/L Placebo group: N = 52 Age: 57.4 ± 5.0 yrs 25OHD status: 54.3 ± 17.1 nmol/L | randomized, double-blind, placebo-controlled, | Duration of treatment: 6 months; Vit D group: 4000 IU vitamin D daily | vitamin D reduced TGs |
| Jafari T. et al. (2015) [55] | Iran | T2DM | 59 ♀ T2DM Vit D fortified yogurt (FY): N = 30 Age: 57.8 ± 5.5 yrs 25OHD status: 62.23 ± 4.52 nmol/L plain yogurt (PY): N = 29 Age: 56.8 ± 5.7 yrs 25OHD status: 62.72 ± 4.27 nmol/L | double-blind randomized placebo-controlled trial | Duration of treatment: 12 weeks: FY: 2000 IU vitamin D in 100 g/day | vitamin D had no effect on serum lipid levels |
| Riek AE et al. (2018) [109] | USA | T2DM | 26 T2DM patients 25OHD: 17 ng/mL Vit D group: N = 11 Age: 57.6 ± 1.9 yrs Placebo group: N = 15 Age: 57.4 ± 1.8 yrs | interventional study | Duration of treatment: 4 months: Vit D group: vitamin D 4000 IU/day | vitamin D had no effect in plasma lipid (vitamin D reduced total monocyte cholesterol content by suppressing oxidized LDL cholesterol uptake) |
| Liyanage GC. et al. (2017) [106] | Sri Lanka | T2DM + early stage nephropathy | 85 T2DM + early stage nephropathy patients Vit D3 group: N = 42 Age: 56 ± 10 yrs 25OHD status: 55.9 ± 12.3 nmol/L Placebo group: N = 43 Age: 59 ± 8 yrs 25OHD status: 50.0 ± 9 nmol/L | randomized double-blind clinical trial | Duration of treatment: 6 months: 50.000 UI vitamin D/month intramuscularly | vitamin D reduce TC, LDL-C and increase HDL-C |
| Jamilian M. et al. (2017) [97] | Iran | Gestational diabetes | 140 ♀ GDM Placebo: N = 35 Age: 30.7 ± 4.1 yrs 25OHD status: 16.6 ± 2.6 ng/mL Vit D: N = 35 Age: 31.5 ± 7.0 yrs 25OHD status: 15.2 ± 3.8 ng/mL Omega-3: N = 35 Age: 30.7 ± 3.5 yrs 25OHD status: 16.9 ± 3.5 ng/mL Vit D + Omega-3: N = 35 Age: 31.2 ± 4.3 yrs 25OHD status: 15.5 ± 3.1 ng/mL | randomized double-blind placebo-controlled clinical trial | Duration of treatment: 6 weeks: Vit D: 50,000 IU vitamin D every 2 weeks Omega-3: 1000 mg omega 3 twice a day Vit D + Omega-3: 50,000 IU vitamin D every 2 weeks + 1000 mg omega 3 twice a day | in the group with vit D + omega 3 co-supplementation there was a reduction in TGs |
| Ghaderi A. et al. (2017) [98] | Iran | Patients in maintenance methadone treatment | 68 MMT subjects Vit D3 group N = 34 Age: 42.5 ± 8.9 yrs 25OHD status: 13.9 ± 4.5 ng/mL Placebo group N = 34 Age: 40.1 ± 9.2 yrs 25OHD status: 13.5 ± 4.5 ng/mL | randomized, double-blind, placebo-controlled, clinical trial | Duration of treatment: 12 weeks: Vit D: 50,000 IU vitamin D every 2 weeks | vitamin D supplementation reduced TC, TGs, LDL-C and increased HDL-C |
| Ghaderi A. et al. (2019) [99] | Iran | Chronic schizophrenia patients | 60 chronic schizophrenia patients Vit D3 group N = 30 Age: 44.8 ± 8.3 yrs 25OHD status: 15.0 ± 4.1 ng/mL Placebo group N = 30 Age: 43.2 ± 6.0 yrs 25OHD status: 13.7 ± 3.2 ng/mL | randomized, double-blind, placebo-controlled, clinical trial | Duration of treatment: 12 weeks: Vit D: 50,000 IU vitamin D + probiotic every 2 weeks Placebo: probiotic | vitamin D + probiotic reduced TGs, TC, LDL-C and VLDL-C |
| Tamadon M. et al. (2018) [77] | Iran | Diabetic patients on hemodialysis | 60 diabetic hemodialysis patients Vit D group: N = 30 Placebo group: N = 30 | randomized, double-blind, placebo-controlled, clinical trial | Duration of treatment: 12 weeks: Vit D: 50.000 UI every 2 weeks; | vitamin D had no effect on serum lipid levels |
| Yarparvar A. et al. (2020) [43] | Austria | Healthy | 71 healthy adolescent boys (age 17 yrs) Vit D group: N = 34 25OHD status: 24.16 ± 10.16 ng/mL Placebo group: N = 37 25OHD status: 22.15 ± 12.33 ng/mL | randomized single-blind placebo-controlled trial | Duration of treatment: 6 months: Vit D: 50.000 IU monthly | vitamin D reduced TC and LDL-C |
| Schwetz V. at al. (2018) [113] | Austria | Hypertension | 163 subjects with hypertension Vit D3 group N = 79 Age: 62.2 yrs 25OHD status: 52.5 nmol/L Placebo group N = 84 Age: 62.1 yrs 25OHD status: 58.8 nmol/L | single-center, double-blind, randomized, placebo-controlled | Duration of treatment: 8 weeks: Vit D group: 2800 IU of vitamin D daily | vitamin D increased TC and TGs |
| Hafez M. at al. (2019) [83] | Egypt | T1DM children | 50 children with T1DM (for >2 yrs) and dyslipidemia VD sufficiency (>30 ng/mL) N = 20 VD deficiency (VDD) or insufficiency (<29 ng/mL) N = 30 | prospective cohort study | Duration of treatment: 4 months: VDD: 4000 UI/day of vitamin D | vitamin D had no effect on serum lipid levels |
| Mohamad M.at al. (2016) [84] | Egypt | T2DM | 100 T2DM patients Age: 47.35 ± 6 25OHD status: 16 ± 5.3 ng/mL | interventional study | Duration of treatment: 2 months: 4500 IU/day of vitamin D | vitamin D had no effect on serum lipid levels |
| Miao J. et al. (2021) [100] | USA | Hypertension | 289 subjects at high risk of hypertension Age: 37.0 yrs 25OHD status: 15.1 ng/mL Low-dose Vit D: N = 144 High-dose Vit D: N = 145 | randomized, double-blind, controlled trial | Duration of treatment: 6 months: Low-dose Vit D: 400 IU/daily vitamin D; High-dose Vit D: 4000 IU/daily vitamin D | vitamin D increased TGs in high-dose vitamin D group |
| Jastrzebski Z.at al. (2016) [85] | Poland | Healthy | 16 professional rowers Vit D group N = 8 Age: 23.1 ± 2.7 yrs 25OHD status: 35.7 ± 17.0 nmol/L Placebo group N = 8 Age: 23.1 ± 3.2 yrs 25OHD status: 31.4 ± 15.2 nmol/L | interventional study | Duration of treatment: 4 weeks: Vit D: 5.000 IU of vitamin D every day | vitamin D had no effect on serum lipid levels |
| Khosravi ZS et al. (2018) [86] | Iran | Overweight/obese | 53 ♀ overweight and obese Intervention N = 26 Age: 29.1 ± 9.6 yrs 25OHD status: 22 ± 6.5 nmol/L Placebo N = 27 Age: 26.9 ± 9.1 yrs 25OHD status: 18 ± 5 nmol/L | double-blind clinical trial study | Duration of treatment: 6 weeks: Intervention: 50.000 IU/week | vitamin D had no effect on serum lipid levels |
| Ramiro-Lozano JM et al. (2015) [104] | Spain | T2DM | 28 T2DM Age: 71.7 ± 9.6 25OHD status: 10.6 ± 3.6 | interventional study | Duration of treatment: 8 weeks: 16.000 IU of calcifediol orally once a week | vitamin D decreased TC and LDL-C |
| Hu J. et al. (2018) [111] | China | Mild cognitive impairment | 181 subjects with mild cognitive impairment Vit D N = 93 Age: 67.22 ± 6.09 yrs 25OHD status: 19.07 ± 2.91 ng/mL Placebo N = 88 Age: 66.60 ± 5.24 yrs 25OHD status: 19.77 ± 2.91 ng/mL | randomized, double-blind, placebo-controlled trial | Duration of treatment: 12 months: Vit D: 400 UI/day vitamin D | vitamin D reduced TC, TGs, HDL-C and LDL-C |
| Angellotti E. et al. (2019) [88] | USA | T2DM | 127 T2DM patients Vit D N = 66 Age: 60.1 ± 8.4 yrs 25OHD status: 26.6 ± 11.1 ng/mL Placebo N = 61 Age: 60.1 ± 8.1 yrs 25OHD = 25.8 ± 10.3 ng/mL | double-blind, randomized, placebo-controlled clinical trial | Duration of treatment: 48 weeks: Vit D: 4000 IU/day of vit D | vitamin D had no effect on serum lipid levels |
| Al-Daghri NM et al. (2012) [101] | Saudi Arabia | T2DM | 34 ♂ 58 ♀ T2DM patients Vit D levels baseline: 32.2 ± 1.5 nmol/L | multi-center, interventional study | Duration of treatment: 18 months: 2000 IU vitamin D daily | vitamin D supplementation reduced TC and LDL-C and increased HOMA-IR |
| Dutta D. et al. (2014) [87] | India | Prediabetes and diabetes | 121 Prediabetic and diabetic subjects Group A: N = 68 Age: 48.37 ± 10.47 yrs 25OHD status: 17.04 ± 7.66 ng/mL Group B: N = 57 Age: 47.4 ± 11.51 yrs 25OHD status: 18 ± 7.16 ng/mL Group C: N = 45 Age: 46.6 ± 11.01 yrs 25OHD status: 37.89 ± 8.26 ng/mL | interventional study | Duration of treatment: 12 months: Group A: cholecalciferol 60,000 UI/once weekly for 8 weeks than monthly for 12 months + calcium carbonate 1250 mg/day; Group B: calcium carbonate Group C: calcium carbonate All: lifestyle interventions | vitamin D supplementation in prediabetes and diabetes is associated with an improvement in dyslipidemia |
| Bhatt SP et al. (2020) [89] | India | Prediabetes | 121 ♀ prediabetes Aged 20–60 yrs Intervention N = 61 25OHD status: 29.9 ± 5.9 nmol/L Placebo N = 60 25OHD status: 32.1 ± 5.2 nmol/L | open-label randomized placebo-controlled trial | Duration of treatment: 8 weeks: Intervention: cholecalciferol 60,000 IU once per week | vitamin D had no effect on serum lipid levels |
| Jorde R. et al. (2016) [116] | Norway | Prediabetes | 511 subjects with prediabetes Vit D N = 256 Age: 62.3 ± 8.1 yrs 25OHD status: 24 ± 8.8 ng/mL Placebo N = 255 Age: 61.9 ± 9.2 yrs 25OHD status: 24.4 ± 8.5 ng/mL | randomized controlled trial | Duration of treatment: 5 yrs: Vit D: cholecalciferol 20,000 IU weekly for | in the vit D group, there was a decrease in LDL-C only at 1 year |
| Rajabi-Naeeni M. et al. (2020) [107] | Iran | Prediabetes | 168 ♀ prediabetes Placebo: N = 42 Age: 41.8 ± 7.8 yrs 25OHD status: 25.5 ± 5.8 ng/mL Omega-3: N = 42 Age: 39.8 ± 6.9 yrs 25OHD status: 23.6 ± 6.4 ng/mL Vit D: N = 42 Age: 39.9 ± 6.0 yrs 25OHD status: 21.4 ± 8.0 ng/mL Vit D + Omega-3: N = 42 Age: 39.0 ± 7.7 yrs 25OHD status: 22.0 ± 8.9 ng/mL | factorial, triple-blind clinical trial | Duration of treatment: 8 weeks: Omega-3: 1000 mg omega 3 twice daily Vit D: cholecalciferol 50,000 IU every 2 weeks Vit D + Omega-3: 1000 mg omega 3 twice daily + cholecalciferol 50,000 IU every 2 weeks | TC, TGs and LDL-C decrease and HDL-C increase in the vit D + omega 3 group TC and LDL-C decrease in Vit D group |
| Misra P. et al. (2021) [90] | India | Prediabetes | 132 ♀ prediabetes Intervention N = 67 Age: 48.1 ± 6.7 yrs 25OHD status: 27.6 ± 6.5 ng/mL Placebo N = 65 Age: 46.1 ± 8.1 yrs 25OHD status: 27.7 ± 14.6 ng/mL | open-label randomized placebo-controlled trial | Duration of treatment: 8 weeks: Intervention: cholecalciferol 60,000 IU + calcium carbonate 1 gr Placebo: calcium carbonate 1 gr | vitamin D had no effect on serum lipid levels |
| Sacheck J. et al. (2022) [105] | USA | Healthy children | 604 children (8–15 yrs) 600 UI group: N = 207 25OHD status: 21.9 ± 0.5 ng/mL 1000 UI group: N = 190 25OHD status: 21.7 ± 0.5 ng/mL 2000 UI group: N = 207 25OHD status: 22.4 ± 0.5 ng/mL | a randomized double-blind clinical trial | Duration of treatment: 6 months: 600 IU or 1000 IU or 2000 IU daily | vitamin D at low dosage increased HDL-C and at high dosage decreased LDL-C and TC |
| Samimi M et al. (2015) [108] | Iran | Pregnant women at risk of pre-eclampsia | 60 ♀ pregnancy at risk of risk for pre-eclampsia Vit D group: N = 30 Age: 27.3 ± 3.7 yrs 25OHD status: 13.1 ± 6.4 ng/mL Placebo: N = 30 Age: 27.1 ± 5.2 yrs 25OHD status: 16.2 ± 3.5 ng/mL | prospective, double-blind, placebo-controlled trial | Duration of treatment: 20 to 30 weeks of gestation: Vit D group: 50,000 IU cholecalciferol every 2 weeks + calcium 1000 mg day | vit D + calcium increased serum HDL-C |
| Sabico S et al. (2023) [112] | Saudi Arabia | Healthy | 58 ♂ 62 ♀ healthy adults age 40.6 ± 10.8 yrs 25OHD status < 50 nmol/L | interventional study | Duration of treatment: 6 months: 50,000 IU cholecalciferol weekly once for first 2 months, then once in two weeks for month 3 and 4, and a daily dose of 1000 IU for the last two months | vitamin D increased HDL-C and reduced ASCVD risk score |
| Bahramian H et al. (2023) [117] | Iran | PCOS | 80 PCOS ♀ vit D < 20 ng/mL Vit D N = 18 Age 23.6 ± 3.4 yrs Omega 3 N = 20 Age 22.3 ± 3.6 yrs Vit D + Omega-3 N = 20 Age 24.6 ± 3.1 yrs Placebo N = 18 Age 22.3 ± 3.1 yrs | double-blind, randomized clinical trial | Duration of treatment: 6 weeks 50,000 IU/weekly Omega-3 | vitamin D + Omega-3 treatment reduce TC |
| Safari S et al. (2023) [118] | Iran | subclinical hypothyroidism | 44 ♀ subclinical hypothyroidism Vit D N = 22 Age 36.3 ± 11.6 yrs placebo N = 22 Age 36.0 ± 11.125 yrs | randomized, double-blind, placebo-controlled clinical trial | Duration of treatment: 12 weeks 50,000 IU/week of vitamin D | vitamin D reduce TC |
| Ku CW et al. (2024) [119] | Overweight/obese pregnant women | Intervention N = 137 Age: 30.5 ± 4.6 yrs 25OHD = 39.9 4 ± 17.0 nmol/L Control N = 137 Age: 30.6 ± 4.2 yrs 25OHD = 38.9 ± 11.97 nmol/L | two-arm, parallel, non-blind randomized controlled trial | Duration of treatment: from week 16 of gestation to delivery Intervention: 800 UI/daily of Vit D Control: 400 UI/daily of Vit D | vitamin D had no effect on serum lipid levels |
Abbreviations: ♂, male; IU, international unit; ♀, female; 25OHD, 25-hydroxyvitamin D; MetS, metabolic syndrome; TC, total cholesterol; TGs, triglycerides; HDL-C, high-density lipoprotein cholesterol; LDL-C, low-density lipoprotein cholesterol; PA, physical activity; HOMA-IR, Homeostatic Model Assessment of Insulin Resistance; HRT, hormone replacement therapy; T2DM, type 2 diabetes mellitus; VLDL-C, very-low-density lipoprotein cholesterol; GDM, gestational diabetes; MMT, maintenance methadone treatment; HD, diabetic hemodialysis patients; ASCVD risk score, 10-year risk of atherosclerotic cardiovascular disease; PCOS, polycystic ovary syndrome.
With regard to the effect on individual classes of the lipid profile, we observed that in patients with T2DM, the most frequent variation concerns TC and LDL-C, while in studies with MetS and overweight (OW) subjects, the effect on the reduction in TGs prevails.
4. Discussion
The relationship between vitamin D and cardiovascular risk is very popular today. In most studies, the conclusions are quite consistent: observational studies have shown inverse associations between vitamin D concentration and cardiovascular disease, but the same results are not always replicable in intervention studies. Considering these data, which unfortunately often accompany vitamin D studies, we conducted our analysis.
From the review of the literature on vitamin D and dyslipidemia, the same paradox clearly emerges: while observational studies give mostly unambiguous results and support an evident association between increased serum vitamin D levels and a favorable lipid profile, interventional studies show contrasting data or no effect. So, it would seem that hypovitaminosis D could predispose to dyslipidemia rather than replenishment leading to a significant improvement in lipid levels. Observational studies do not allow us to find a cause-and-effect link between vitamin D and dyslipidemia; however, from the consistent results, it would seem, as in many other fields, that vitamin D deficiency represents a risk marker—in this case, a possible marker of cardiovascular risk. Similarly, inconclusive results have been obtained in several studies involving vitamin D treatment for patients with diabetes [120] or COVID-19 infection [121].
The interventional studies we considered in our review exhibit significant heterogeneity regarding population characteristics (such as age and pathologies) as well as doses, methods of administration, and duration of vitamin D intervention. Nevertheless, upon analyzing these studies, it does not seem that age influenced the results. Surprisingly, positive effects of vitamin D supplementation on lipids were observed across various age groups, including adults (aged over 60) and younger patients, including children.
In most studies where vitamin D supplementation was administered to individuals with vitamin D deficiency, beneficial effects on lipid profiles were observed. Interestingly, the dosage of vitamin D supplementation does not appear to significantly impact these effects. However, there remains a critical gap in knowledge regarding the optimal dose of vitamin D for pleiotropic effects. Discrepancies in study outcomes may also stem from variations in the methods used to assess vitamin D levels; some studies employed validated schemes for assessment, while others did not specify their methods. This discrepancy represents a notable limitation. Indeed, intervention studies with meticulous vitamin D assessment tend to demonstrate positive effects on lipid profiles as a result of vitamin D supplementation.
Some of the most interesting data that emerge from this review show that supplementation with vitamin D is particularly effective in improving and the lipid profile in patients with T2DM, MetS, or OW.
Therefore, diabetic and metabolic patients would have a greater advantage, compared to healthy subjects, in the administration of vitamin D in terms of lipids. This positive effect of vitamin D on dyslipidemia in these patients could be explained by the action of vitamin D on improving insulin resistance (IR). Insulin resistance is an important metabolic component in metabolic syndrome, prediabetes, PCOS, and T2DM and is associated with risk of micro- and macrovascular complications. Insulin resistance is also involved in lipid metabolism, leading to atherogenic dyslipidemia; therefore, vitamin D, by improving IR, would probably have an indirect effect on lipids. Indirectly, also through the control of inflammation, vitamin D could lead to action on lipids. A recent review showed how the administration of vitamin D to patients with T2DM determines a significant reduction in inflammatory markers (CRP and IL-6), with a positive effect on the lipid profile [122].
Similar to other hormones, vitamin D supplementation is beneficial for individuals with deficiency but may not be necessary for everyone. This phenomenon is also evident in addressing bone fragility: while vitamin D supplementation significantly reduces fragility fractures in individuals who are deficient and at risk, administering high doses to healthy individuals does not show a significant effect in preventing such fractures.
Furthermore, the inconsistent outcomes of interventional studies might also stem from variations in dosage, frequency, or duration of vitamin D supplementation. Also, other variables could influence the results of interventional studies, such as physical activity, obesity, VDR polymorphisms, or the heterogeneity of populations. Let us not forget that vitamin D is partly taken with food; this component was not considered in interventional works. Furthermore, cholesterol also depends on diet as well as physical activity. So, in order to carry out more truthful studies, all of these components should be taken into consideration, as they could influence the results of interventional studies.
5. Conclusions
The prospect of vitamin D supplementation contributing to the improvement of lipid parameters and reducing cardiovascular risk is truly fascinating. Vitamin D is readily available and generally without side effects when taken in recommended doses. The possibility that its replenishment could play a role in cardiovascular risk is very intriguing and warrants further analysis.
Currently, data in the literature confirm that, at the molecular level, there is a close link between lipid metabolism and vitamin D; numerous observational studies suggest a possible association between vitamin D and serum lipid levels, but the data do not appear to be completely confirmed in interventional studies. However, it was certainly interesting to observe how, in interventional studies on metabolic and diabetic patients, the effects of vitamin D replenishment were positive on lipids.
In the future, this relationship should be further explored in large, well-designed, randomized controlled trials (RCTs). The results of such studies could be truly surprising and could help us better understand the role of vitamin D in cardiovascular prevention.
Author Contributions
Conceptualization, A.A.R. and C.C.; methodology, A.A.R.; validation, A.A.R., L.B., E.G., M.D.V. and C.M.; formal analysis, C.C.; investigation, A.A.R. and L.B.; resources, A.A.R.; data curation, C.C.; writing—original draft preparation, A.A.R.; writing—review and editing, C.C., R.T. and S.G.; visualization, A.A.R.; supervision, C.C. All authors have read and agreed to the published version of the manuscript.
Funding
This research received no external funding.
Data Availability Statement
No new data were created.
Conflicts of Interest
The authors declare no conflicts of interest.
References
- Rai, V.; Agrawal, D.K. Role of Vitamin D in Cardiovascular Diseases. Endocrinol. Metab. Clin. N. Am. 2017, 46, 1039–1059. [Google Scholar] [CrossRef]
- Prabhu, A.V.; Luu, W.; Sharpe, L.J.; Brown, A.J. Cholesterol-mediated Degradation of 7-Dehydrocholesterol Reductase Switches the Balance from Cholesterol to Vitamin D Synthesis. J. Biol. Chem. 2016, 29, 8363–8373. [Google Scholar] [CrossRef]
- Zou, L.; Porter, T.D. Rapid suppression of 7-dehydrocholesterol reductase activity in keratinocytes by vitamin D. J. Steroid Biochem. Mol. Biol. 2015, 148, 64–71. [Google Scholar] [CrossRef]
- Xia, Z.; Hu, Y.; Han, Z.; Gao, Y.; Bai, J.; He, Y.; Zhao, H.; Zhang, H. Association of vitamin D receptor gene polymorphisms with diabetic dyslipidemia in the elderly male population in North China. Clin. Interv. Aging 2017, 12, 1673–1679. [Google Scholar] [CrossRef][Green Version]
- Hajj, A.; Chedid, R.; Chouery, E.; Megarbané, A.; Gannagé-Yared, M.H. Relationship between vitamin D receptor gene polymorphisms, cardiovascular risk factors and adiponectin in a healthy young population. Pharmacogenomics 2016, 17, 1675–1686. [Google Scholar] [CrossRef]
- He, L.; Wang, M. Association of vitamin d receptor-a gene polymorphisms with coronary heart disease in Han Chinese. Int. J. Clin. Exp. Med. 2015, 8, 6224–6229. [Google Scholar]
- Jia, J.; Tang, Y.; Shen, C.; Zhang, N.; Ding, H.; Zhan, Y. Vitamin D receptor polymorphism rs2228570 is significantly associated with risk of dyslipidemia and serum LDL levels in Chinese Han population. Lipids Health Dis. 2018, 17, 193. [Google Scholar] [CrossRef]
- Gonzalez, F.J.; Moschetta, A. Potential role of the vitamin D receptor in control of cholesterol levels. Gastroenterology 2014, 146, 899–902. [Google Scholar] [CrossRef]
- Jiang, W.; Miyamoto, T.; Kakizawa, T.; Nishio, S.I.; Oiwa, A.; Takeda, T.; Suzuki, S.; Hashizume, K. Inhibition of LXRalpha signaling by vitamin D receptor: Possible role of VDR in bile acid synthesis. Biochem. Biophys. Res. Commun. 2006, 351, 176–184. [Google Scholar] [CrossRef]
- Li, S.; He, Y.; Lin, S.; Hao, L.; Ye, Y.; Lv, L.; Sun, Z.; Fan, H.; Shi, Z.; Li, J.; et al. Increase of circulating cholesterol in vitamin D deficiency is linked to reduced vitamin D receptor activity via the Insig-2/SREBP-2 pathway. Mol. Nutr. Food Res. 2016, 60, 798–809. [Google Scholar] [CrossRef]
- Hussain, M.M.; Nijstad, N.; Franceschini, L. Regulation of microsomal triglyceride transfer protein. Clin. Lipidol. 2011, 6, 293–303. [Google Scholar] [CrossRef] [PubMed]
- Martins, D.; Wolf, M.; Pan, D.; Zadshir, A.; Tareen, N.; Thadhani, R.; Felsenfeld, A.; Levine, B.; Mehrotra, R.; Norris, K. Prevalence of cardiovascular risk factors and the serum levels of 25-hydroxyvitamin D in the United States: Data from the Third National Health and Nutrition Examination Survey. Arch. Intern. Med. 2007, 167, 1159–1165. [Google Scholar] [CrossRef] [PubMed]
- Ginsberg, H.N.; Zhang, Y.L.; Hernandez-Ono, A. Regulation of plasma triglycerides in insulin resistance and diabetes. Arch. Med. Res. 2005, 36, 232–240. [Google Scholar] [CrossRef] [PubMed]
- Malekmohammad, K.; Bezsonov, E.E.; Rafieian-Kopaei, M. Role of Lipid Accumulation and Inflammation in Atherosclerosis: Focus on Molecular and Cellular Mechanisms. Front. Cardiovasc. Med. 2021, 8, 707529. [Google Scholar] [CrossRef] [PubMed]
- Riek, A.E.; Oh, J.; Bernal-Mizrachi, C. 1,25(OH)2 vitamin D suppresses macrophage migration and reverses atherogenic cholesterol metabolism in type 2 diabetic patients. J. Steroid Biochem. Mol. Biol. 2013, 136, 309–312. [Google Scholar] [CrossRef] [PubMed]
- Auwerx, J.; Bouillon, R.; Kesteloot, H. Relation between 25-hydroxyvitamin D3, apolipoprotein A-I, and high density lipoprotein cholesterol. Arterioscler. Thromb. 1992, 12, 671–674. [Google Scholar] [CrossRef] [PubMed]
- Jiang, X.; Peng, M.; Chen, S.; Wu, S.; Zhang, W. Vitamin D deficiency is associated with dyslipidemia: A cross-sectional study in 3788 subjects. Curr. Med. Res. Opin. 2019, 35, 1059–1063. [Google Scholar] [CrossRef] [PubMed]
- Chaudhuri, J.R.; Mridula, K.R.; Anamika, A.; Boddu, D.B.; Misra, P.K.; Lingaiah, A.; Balaraju, B.; Bandaru, V.S. Deficiency of 25-hydroxyvitamin d and dyslipidemia in Indian subjects. J. Lipids 2013, 2013, 623420. [Google Scholar] [CrossRef] [PubMed]
- Karhapää, P.; Pihlajamäki, J.; Pörsti, I.; Kastarinen, M.; Mustonen, J.; Niemelä, O.; Kuusisto, J. Diverse associations of 25-hydroxyvitamin D and 1,25-dihydroxy-vitamin D with dyslipidaemias. J. Intern. Med. 2010, 268, 604–610. [Google Scholar] [CrossRef]
- Guasch, A.; Bulló, M.; Rabassa, A.; Bonada, A.; Del Castillo, D.; Sabench, F.; Salas-Salvadó, J. Plasma vitamin D and parathormone are associated with obesity and atherogenic dyslipidemia: A cross-sectional study. Cardiovasc. Diabetol. 2012, 11, 149. [Google Scholar] [CrossRef]
- Botella-Carretero, J.I.; Alvarez-Blasco, F.; Villafruela, J.J.; Balsa, J.A.; Vázquez, C.; Escobar-Morreale, H.F. Vitamin D deficiency is associated with the metabolic syndrome in morbid obesity. Clin. Nutr. 2007, 26, 573–580. [Google Scholar] [CrossRef] [PubMed]
- Sharba, Z.F.; Shareef, R.H.; Abd, B.A.; Hameed, E.N. Association between Dyslipidemia and Vitamin D Deficiency: A Cross-Sectional Study. Folia Med. 2021, 63, 965–969. [Google Scholar] [CrossRef] [PubMed]
- Kostecka, D.; Schneider-Matyka, D.; Barczak, K.; Starczewska, M.; Szkup, M.; Ustianowski, P.; Brodowski, J.; Grochans, E. The effect of vitamin D levels on lipid, glucose profiles and depression in perimenopausal women. Eur. Rev. Med. Pharmacol. Sci. 2022, 26, 3493–3505. [Google Scholar] [PubMed]
- Saheb Sharif-Askari, F.; Saheb Sharif-Askari, N.; Halwani, R.; Abusnana, S.; Hamoudi, R.; Sulaiman, N. Low Vitamin D Serum Level Is Associated with HDL-C Dyslipidemia and Increased Serum Thrombomodulin Levels of Insulin-Resistant Individuals. Diabetes Metab. Syndr. Obes. 2020, 13, 1599–1607. [Google Scholar] [CrossRef] [PubMed]
- Guan, C.; Fu, S.; Zhen, D.; Li, X.; Niu, J.; Cheng, J.; Zhao, N.; Liu, J.; Yin, H.; Tang, X. Correlation of serum vitamin D with lipid profiles in middle-aged and elderly Chinese individuals. Asia Pac. J. Clin. Nutr. 2020, 29, 839–845. [Google Scholar]
- Han, Y.Y.; Hsu, S.H.; Su, T.C. Association between Vitamin D Deficiency and High Serum Levels of Small Dense LDL in Middle-Aged Adults. Biomedicines 2021, 9, 464. [Google Scholar] [CrossRef] [PubMed]
- Gong, T.; Di, H.; Han, X.; Hu, X.; Liu, C.; Chen, G. Vitamin D is negatively associated with triglyceride in overweight/obese patients with type 2 diabetes. Endocrine 2022, 76, 304–311. [Google Scholar] [CrossRef] [PubMed]
- Li, Y.; Tong, C.H.; Rowland, C.M.; Radcliff, J.; Bare, L.A.; McPhaul, M.J.; Devlin, J.J. Association of changes in lipid levels with changes in vitamin D levels in a real-world setting. Sci. Rep. 2021, 11, 21536. [Google Scholar] [CrossRef]
- Pathania, M.; Dhar, M.; Kumar, A.; Saha, S.; Malhotra, R. Association of Vitamin D Status with Metabolic Syndrome and Its Individual Risk Factors: A Cross-Sectional Study. Cureus 2023, 15, e38344. [Google Scholar] [CrossRef]
- Yang, K.; Liu, J.; Fu, S.; Tang, X.; Ma, L.; Sun, W.; Niu, Y.; Jing, G.; Niu, Q. Vitamin D Status and Correlation with Glucose and Lipid Metabolism in Gansu Province, China. Diabetes Metab. Syndr. Obes. 2020, 13, 1555–1563. [Google Scholar] [CrossRef]
- Cheng, Y.L.; Lee, T.I.; Chien, Y.M.; Lee, T.W.; Chen, Y.J. Vitamin D level regulates serum lipids discrepantly in adults with and without dyslipidemia. Endocr. Connect. 2023, 12, e230013. [Google Scholar] [CrossRef] [PubMed]
- Atia, T.; Abdelzaher, M.H.; Nassar, S.A.; Gafar, H.H.; Husseini, M.A.M.; Kaabi, A.M.Y.; Sakr, H.I. Investigating the relationship between vitamin-D deficiency and glycemia status and lipid profile in nondiabetics and prediabetics in Saudi population. Medicine 2023, 102, e36322. [Google Scholar] [CrossRef] [PubMed]
- Chen, C.W.; Han, Y.Y.; Hwang, J.S.; Rizzo, M.; Yamashita, S.; Hsu, S.H.; Su, T.C. Association Between Adequate Serum 25(OH)D Levels and Atherogenic Dyslipidemia in Young Adults. J. Atheroscler. Thromb. 2023, 64523. [Google Scholar] [CrossRef] [PubMed]
- Wang, Y.; Si, S.; Liu, J.; Wang, Z.; Jia, H.; Feng, K.; Sun, L.; Song, S.J. The Associations of Serum Lipids with Vitamin D Status. PLoS ONE 2016, 11, e0165157. [Google Scholar] [CrossRef] [PubMed]
- AlQuaiz, A.M.; Kazi, A.; Youssef, R.M.; Alshehri, N.; Alduraywish, S.A. Association between standardized vitamin 25(OH)D and dyslipidemia: A community-based study in Riyadh, Saudi Arabia. Environ. Health Prev. Med. 2020, 25, 4. [Google Scholar] [CrossRef] [PubMed]
- Kostrova, G.N.; Malyavskaya, S.I.; Lebedev, A.V. Relationship between vitamin D level and lipid profile in young adults. Vopr. Pitan. 2022, 91, 26–34. [Google Scholar] [CrossRef]
- Kim, M.R.; Jeong, S.J. Relationship between Vitamin D Level and Lipid Profile in Non-Obese Children. Metabolites 2019, 9, 125. [Google Scholar] [CrossRef] [PubMed]
- Delvin, E.E.; Lambert, M.; Levy, E.; O’Loughlin, J.; Mark, S.; Gray-Donald, K.; Paradis, G. Vitamin D status is modestly associated with glycemia and indicators of lipid metabolism in French-Canadian children and adolescents. J. Nutr. 2010, 140, 987–991. [Google Scholar] [CrossRef] [PubMed]
- Williams, D.M.; Fraser, A.; Lawlor, D.A. Associations of vitamin D, parathyroid hormone and calcium with cardiovascular risk factors in US adolescents. Heart 2011, 97, 315–320. [Google Scholar] [CrossRef]
- Rajakumar, K.; de las Heras, J.; Chen, T.C.; Lee, S.; Holick, M.F.; Arslanian, S.A. Vitamin D status, adiposity, and lipids in black American and Caucasian children. J. Clin. Endocrinol. Metab. 2011, 96, 1560–1567. [Google Scholar] [CrossRef]
- Birken, C.S.; Lebovic, G.; Anderson, L.N.; McCrindle, B.W.; Mamdani, M.; Kandasamy, S.; Khovratovich, M.; Parkin, P.C.; Maguire, J.L.; TARGet Kids! collaboration. Association between Vitamin D and Circulating Lipids in Early Childhood. PLoS ONE 2015, 10, e0131938. [Google Scholar] [CrossRef]
- Kelishadi, R.; Farajzadegan, Z.; Bahreynian, M. Association between vitamin D status and lipid profile in children and adolescents: A systematic review and meta-analysis. Int. J. Food Sci. Nutr. 2014, 65, 404–410. [Google Scholar] [CrossRef] [PubMed]
- Yarparvar, A.; Elmadfa, I.; Djazayery, A.; Abdollahi, Z.; Salehi, F. The Association of Vitamin D Status with Lipid Profile and Inflammation Biomarkers in Healthy Adolescents. Nutrients 2020, 12, 590. [Google Scholar] [CrossRef]
- Nouri Saeidlou, S.; Vahabzadeh, D.; Babaei, F.; Vahabzadeh, Z. Seasonal variations of vitamin D and its relation to lipid profile in Iranian children and adults. J. Health Popul. Nutr. 2017, 36, 21. [Google Scholar] [CrossRef]
- Song, K.; Park, G.; Choi, Y.; Oh, J.S.; Choi, H.S.; Suh, J.; Kwon, A.; Kim, H.S.; Chae, H.W. Association of Vitamin D Status and Physical Activity with Lipid Profile in Korean Children and Adolescents: A Population-Based Study. Children 2020, 7, 241. [Google Scholar] [CrossRef] [PubMed]
- Al-Ajlan, A.; Krishnaswamy, S.; Alokail, M.S.; Aljohani, N.J.; Al-Serehi, A.; Sheshah, E.; Alshingetti, N.M.; Fouda, M.; Turkistani, I.Z.; Al-Daghri, N.M. Vitamin D deficiency and dyslipidemia in early pregnancy. BMC Pregnancy Childbirth 2015, 15, 314. [Google Scholar] [CrossRef]
- Lepsch, J.; Eshriqui, I.; Farias, D.R.; Vaz, J.S.; Cunha Figueiredo, A.C.; Adegboye, A.R.; Brito, A.; Mokhtar, R.; Allen, L.H.; Holick, M.F.; et al. Association between early pregnancy vitamin D status and changes in serum lipid profiles throughout pregnancy. Metabolism 2017, 70, 85–97. [Google Scholar] [CrossRef]
- Jin, D.; Zhu, D.M.; Hu, H.L.; Yao, M.N.; Yin, W.J.; Tao, R.X.; Zhu, P. Vitamin D status affects the relationship between lipid profile and high-sensitivity C-reactive protein. Nutr. Metab. 2020, 17, 57. [Google Scholar] [CrossRef]
- Wang, L.; Liu, X.; Hou, J.; Wei, D.; Liu, P.; Fan, K.; Zhang, L.; Nie, L.; Li, X.; Huo, W.; et al. Serum Vitamin D Affected Type 2 Diabetes though Altering Lipid Profile and Modified the Effects of Testosterone on Diabetes Status. Nutrients 2020, 13, 90. [Google Scholar] [CrossRef]
- Saedisomeolia, A.; Taheri, E.; Djalali, M.; Moghadam, A.M.; Qorbani, M. Association between serum level of vitamin D and lipid profiles in type 2 diabetic patients in Iran. J. Diabetes Metab. Disord. 2014, 13, 7. [Google Scholar] [CrossRef]
- Huang, Y.; Li, X.; Wang, M.; Ning, H.A.L.; Li, Y.; Sun, C. Lipoprotein lipase links vitamin D, insulin resistance, and type 2 diabetes: A cross-sectional epidemiological study. Cardiovasc. Diabetol. 2013, 12, 17. [Google Scholar] [CrossRef] [PubMed]
- Faris Raheem, M.H.; Ali, S.; Shareef, L. Impact of serum levels of vitamin D on lipid profiles, glycemic indices, and insulin resistance in obese type 2 diabetes patients: An observational study. Research 2022, 11, 1002. [Google Scholar] [CrossRef]
- Howard, B.V. Insulin resistance and lipid metabolism. Am. J. Cardiol. 1999, 84, 28J–32J. [Google Scholar] [CrossRef] [PubMed]
- Talaei, A.; Mohamadi, M.; Adgi, Z. The effect of vitamin D on insulin resistance in patients with type 2 diabetes. Diabetol. Metab. Syndr. 2013, 5, 8. [Google Scholar] [CrossRef] [PubMed]
- Jafari, T.; Fallah, A.A.; Barani, A. Effects of vitamin D on serum lipid profile in patients with type 2 diabetes: A meta-analysis of randomized controlled trials. Clin. Nutr. 2016, 35, 1259–1268. [Google Scholar] [CrossRef]
- Ponda, M.P.; Huang, X.; Odeh, M.A.; Breslow, J.L.; Kaufman, H.W. Vitamin D may not improve lipid levels: A serial clinical laboratory data study. Circulation 2012, 126, 270–277. [Google Scholar] [CrossRef] [PubMed]
- Carlson, L.A.; Derblom, H.; Lanner, A. Effects of different doses of vitamin D on serum cholesterol and triglycerides in healthy men. Atherosclerosis 1970, 12, 313–317. [Google Scholar] [CrossRef] [PubMed]
- Yousefi Rad, E.; Djalali, M.; Koohdani, F.; Saboor-Yaraghi, A.A.; Eshraghian, M.R.; Javanbakht, M.H.; Saboori, S.; Zarei, M.; Hosseinzadeh-Attar, M.J. The effects of vitamin D supplementation on glucose control and insulin resistance in patients with diabetes type 2: A randomized clinical trial study. Iran. J. Public. Health 2014, 43, 1651–1656. [Google Scholar] [PubMed]
- Eftekhari, M.H.; Akbarzadeh, M.; Dabbaghmanesh, M.H.; Hassanzadeh, J. The effect of calcitriol on lipid profile and oxidative stress in hyperlipidemic patients with type 2 diabetes mellitus. ARYA Atheroscler. 2014, 10, 82–88. [Google Scholar]
- Heikkinen, A.M.; Tuppurainen, M.T.; Niskanen, L.; Komulainen, M.; Penttilä, I.; Saarikoski, S. Long-term vitamin D3 supplementation may have adverse effects on serum lipids during postmenopausal hormone replacement therapy. Eur. J. Endocrinol. 1997, 137, 495–502. [Google Scholar] [CrossRef][Green Version]
- Scragg, R.; Khaw, K.T.; Murphy, S. Effect of winter oral vitamin D3 supplementation on cardiovascular risk factors in elderly adults. Eur. J. Clin. Nutr. 1995, 49, 640–646. [Google Scholar]
- Andersen, R.; Brot, C.; Mejborn, H.; Mølgaard, C.; Skovgaard, L.T.; Trolle, E.; Ovesen, L. Vitamin D supplementation does not affect serum lipids and lipoproteins in Pakistani immigrants. Eur. J. Clin. Nutr. 2009, 63, 1150–1153. [Google Scholar] [CrossRef]
- Makariou, S.E.; Elisaf, M.; Challa, A.; Tentolouris, N.; Liberopoulos, E.N. No effect of vitamin D supplementation on cardiovascular risk factors in subjects with metabolic syndrome: A pilot randomised study. Arch. Med. Sci. Atheroscler. Dis. 2017, 2, e52–e60. [Google Scholar] [CrossRef] [PubMed]
- Makariou, S.E.; Elisaf, M.; Challa, A.; Tellis, C.C.; Tselepis, A.D.; Liberopoulos, E.N. No effect of vitamin D administration plus dietary intervention on emerging cardiovascular risk factors in patients with metabolic syndrome. J. Nutr. Intermed. Metab. 2019, 16, 100093. [Google Scholar] [CrossRef]
- Wongwiwatthananukit, S.; Sansanayudh, N.; Phetkrajaysang, N.; Krittiyanunt, S. Effects of vitamin D(2) supplementation on insulin sensitivity and metabolic parameters in metabolic syndrome patients. J. Endocrinol. Investig. 2013, 36, 558–563. [Google Scholar]
- Nagpal, J.; Pande, J.N.; Bhartia, A. A double-blind, randomized, placebo-controlled trial of the short-term effect of vitamin D3 supplementation on insulin sensitivity in apparently healthy, middle-aged, centrally obese men. Diabet. Med. 2009, 26, 19–27. [Google Scholar] [CrossRef]
- Yin, X.; Yan, L.; Lu, Y.; Jiang, Q.; Pu, Y.; Sun, Q. Correction of hypovitaminosis D does not improve the metabolic syndrome risk profile in a Chinese population: A randomized controlled trial for 1 year. Asia Pac. J. Clin. Nutr. 2016, 25, 71–77. [Google Scholar]
- Nikooyeh, B.; Neyestani, T.R.; Farvid, M.; Alavi-Majd, H.; Houshiarrad, A.; Kalayi, A.; Shariatzadeh, N.; Gharavi, A.; Heravifard, S.; Tayebinejad, N.; et al. Daily consumption of vitamin D- or vitamin D + calcium-fortified yogurt drink improved glycemic control in patients with type 2 diabetes: A randomized clinical trial. Am. J. Clin. Nutr. 2011, 93, 764–771. [Google Scholar] [CrossRef]
- Witham, M.D.; Adams, F.; Kabir, G.; Kennedy, G.; Belch, J.J.; Khan, F. Effect of short-term vitamin D supplementation on markers of vascular health in South Asian women living in the UK-a randomized controlled trial. Atherosclerosis 2013, 230, 293–299. [Google Scholar] [CrossRef]
- von Hurst, P.R.; Stonehouse, W.; Coad, J. Vitamin D supplementation reduces insulin resistance in South Asian women living in New Zealand who are insulin resistant and vitamin D deficient—A randomized, placebo-controlled trial. Br. J. Nutr. 2010, 103, 549–555. [Google Scholar] [CrossRef]
- Wood, A.D.; Secombes, K.R.; Thies, F.; Aucott, L.; Black, A.J.; Mavroeidi, A.; Simpson, W.G.; Fraser, W.D.; Reid, D.M.; Macdonald, H.M. Vitamin D3 supplementation has no effect on conventional cardiovascular risk factors: A parallel-group, double-blind, placebo-controlled RCT. J. Clin. Endocrinol. Metab. 2012, 97, 3557–3568. [Google Scholar] [CrossRef] [PubMed]
- Chai, W.; Cooney, R.V.; Franke, A.A.; Bostick, R.M. Effects of calcium and vitamin D supplementation on blood pressure and serum lipids and carotenoids: A randomized, double-blind, placebo-controlled, clinical trial. Ann. Epidemiol. 2013, 23, 564–570. [Google Scholar] [CrossRef] [PubMed]
- Muldowney, S.; Lucey, A.J.; Hill, T.R.; Seamans, K.M.; Taylor, N.; Wallace, J.M.; Horigan, G.; Barnes, M.S.; Bonham, M.P.; Duffy, E.M. Incremental cholecalciferol supplementation up to 15 μg/d throughout winter at 51–55° N has no effect on biomarkers of cardiovascular risk in healthy young and older adults. J. Nutr. 2012, 142, 1519–1525. [Google Scholar] [CrossRef] [PubMed]
- Breslavsky, A.; Frand, J.; Matas, Z.; Boaz, M.; Barnea, Z.; Shargorodsky, M. Effect of high doses of vitamin D on arterial properties, adiponectin, leptin and glucose homeostasis in type 2 diabetic patients. Clin. Nutr. 2013, 32, 970–975. [Google Scholar] [CrossRef]
- Sadiya, A.; Ahmed, S.M.; Carlsson, M.; Tesfa, Y.; George, M.; Ali, S.H.; Siddieg, H.H.; Abusnana, S. Vitamin D supplementation in obese type 2 diabetes subjects in Ajman, UAE: A randomized controlled double-blinded clinical trial. Eur. J. Clin. Nutr. 2015, 69, 707–711. [Google Scholar] [CrossRef]
- Moghassemi, S.; Marjani, A. The effect of short-term vitamin D supplementation on lipid profile and blood pressure in post-menopausal women: A randomized controlled trial. Iran. J. Nurs. Midwifery Res. 2014, 19, 517–521. [Google Scholar]
- Tamadon, M.R.; Soleimani, A.; Keneshlou, F.; Mojarrad, M.Z.; Bahmani, F.; Naseri, A.; Kashani, H.H.; Hosseini, E.S.; Asemi, Z. Clinical Trial on the Effects of Vitamin D Supplementation on Metabolic Profiles in Diabetic Hemodialysis. Horm. Metab. Res. 2018, 50, 50–55. [Google Scholar] [CrossRef] [PubMed]
- Dalbeni, A.; Scaturro, G.; Degan, M.; Minuz, P.; Delva, P. Effects of six months of vitamin D supplementation in patients with heart failure: A randomized double-blind controlled trial. Nutr. Metab. Cardiovasc. Dis. 2014, 24, 861–868. [Google Scholar] [CrossRef] [PubMed]
- Ryu, O.H.; Chung, W.; Lee, S.; Hong, K.S.; Choi, M.G.; Yoo, H.J. The effect of high-dose vitamin D supplementation on insulin resistance and arterial stiffness in patients with type 2 diabetes. Korean J. Intern. Med. 2014, 29, 620–629. [Google Scholar] [CrossRef]
- Kim, H.J.; Kang, C.K.; Park, H.; Lee, M.G. Effects of vitamin D supplementation and circuit training on indices of obesity and insulin resistance in T2D and vitamin D deficient elderly women. J. Exerc. Nutr. Biochem. 2014, 18, 249–257. [Google Scholar] [CrossRef]
- Kampmann, U.; Mosekilde, L.; Juhl, C.; Moller, N.; Christensen, B.; Rejnmark, L.; Wamberg, L.; Orskov, L. Effects of 12 weeks high dose vitamin D3 treatment on insulin sensitivity, beta cell function, and metabolic markers in patients with type 2 diabetes and vitamin D insufficiency—A double-blind, randomized, placebo-controlled trial. Metabolism 2014, 63, 1115–1124. [Google Scholar] [CrossRef]
- Al-Zahrani, M.K.; Elnasieh, A.M.; Alenezi, F.M.; Almoushawah, A.A.; Almansour, M.; Alshahrani, F.; Rahman, S.U.; Al-Zahrani, A. A 3-month oral vitamin D supplementation marginally improves diastolic blood pressure in Saudi patients with type 2 diabetes mellitus. Int. J. Clin. Exp. Med. 2014, 7, 5421–5428. [Google Scholar]
- Hafez, M.; Musa, N.; Abdel Atty, S.; Ibrahem, M.; Abdel Wahab, N. Effect of Vitamin D Supplementation on Lipid Profile in Vitamin D-Deficient Children with Type 1 Diabetes and Dyslipidemia. Horm. Res. Paediatr. 2019, 91, 311–318. [Google Scholar] [CrossRef] [PubMed]
- Mohamad, M.I.; El-Sherbeny, E.E.; Bekhet, M.M. The Effect of Vitamin D Supplementation on Glycemic Control and Lipid Profile in Patients with Type 2 Diabetes Mellitus. J. Am. Coll. Nutr. 2016, 35, 399–404. [Google Scholar] [CrossRef]
- Jastrzebski, Z.; Kortas, J.; Kaczor, K.; Antosiewicz, J. Vitamin D Supplementation Causes a Decrease in Blood Cholesterol in Professional Rowers. J. Nutr. Sci. Vitaminol. 2016, 62, 88–92. [Google Scholar] [CrossRef] [PubMed]
- Khosravi, Z.S.; Kafeshani, M.; Tavasoli, P.; Zadeh, A.H.; Entezari, M.H. Effect of Vitamin D Supplementation on Weight Loss, Glycemic Indices, and Lipid Profile in Obese and Overweight Women: A Clinical Trial Study. Int. J. Prev. Med. 2018, 9, 63. [Google Scholar]
- Dutta, D.; Maisnam, I.; Shrivastava, A.; Sinha, A.; Ghosh, S.; Mukhopadhyay, P.; Mukhopadhyay, S.; Chowdhury, S. Serum vitamin-D predicts insulin resistance in individuals with prediabetes. Indian J. Med. Res. 2013, 138, 853–860. [Google Scholar]
- Angellotti, E.; D’Alessio, D.; Dawson-Hughes, B.; Chu, Y.; Nelson, J.; Hu, P.; Cohen, R.M.; Pittas, A.G. Effect of vitamin D supplementation on cardiovascular risk in type 2 diabetes. Clin. Nutr. 2019, 38, 2449–2453. [Google Scholar] [CrossRef] [PubMed]
- Bhatt, S.P.; Misra, A.; Pandey, R.M.; Upadhyay, A.D.; Gulati, S.; Singh, N. Vitamin D Supplementation in Overweight/obese Asian Indian Women with Prediabetes Reduces Glycemic Measures and Truncal Subcutaneous Fat: A 78 Weeks Randomized Placebo-Controlled Trial (PREVENT-WIN Trial). Sci. Rep. 2020, 10, 220. [Google Scholar] [CrossRef]
- Misra, P.; Kant, S.; Misra, A.; Jha, S.; Kardam, P.; Thakur, N.; Bhatt, S.P. A Community Based Randomized Controlled Trial to See the Effect of Vitamin D Supplementation on Development of Diabetes Among Women with Prediabetes Residing in A Rural Community of Northern India. J. Fam. Med. Prim. Care 2021, 10, 3122–3129. [Google Scholar] [CrossRef]
- Patwardhan, V.G.; Mughal, Z.M.; Padidela, R.; Chiplonkar, S.A.; Khadilkar, V.V.; Khadilkar, A.V. Randomized Control Trial Assessing Impact of Increased Sunlight Exposure versus Vitamin D Supplementation on Lipid Profile in Indian Vitamin D Deficient Men. Indian J. Endocrinol. Metab. 2017, 21, 393–398. [Google Scholar] [PubMed]
- Farag, H.A.M.; Hosseinzadeh-Attar, M.J.; Muhammad, B.A.; Esmaillzadeh, A.; Hamid El Bilbeisi, A. Effects of vitamin D supplementation along with endurance physical activity on lipid profile in metabolic syndrome patients: A randomized controlled trial. Diabetes Metab. Syndr. 2019, 13, 1093–1098. [Google Scholar] [CrossRef] [PubMed]
- Salekzamani, S.; Mehralizadeh, H.; Ghezel, A.; Salekzamani, Y.; Jafarabadi, M.A.; Bavil, A.S.; Gargari, B.P. Effect of high-dose vitamin D supplementation on cardiometabolic risk factors in subjects with metabolic syndrome: A randomized controlled double-blind clinical trial. J. Endocrinol. Investig. 2016, 39, 1303–1313. [Google Scholar] [CrossRef] [PubMed]
- Asemi, Z.; Foroozanfard, F.; Hashemi, T.; Bahmani, F.; Jamilian, M.; Esmaillzadeh, A. Calcium plus vitamin D supplementation affects glucose metabolism and lipid concentrations in overweight and obese vitamin D deficient women with polycystic ovary syndrome. Clin. Nutr. 2015, 34, 586–592. [Google Scholar] [CrossRef] [PubMed]
- Qin, X.F.; Zhao, L.S.; Chen, W.R.; Yin, D.W.; Wang, H. Effects of vitamin D on plasma lipid profiles in statin-treated patients with hypercholesterolemia: A randomized placebo-controlled trial. Clin. Nutr. 2015, 34, 201–206. [Google Scholar] [CrossRef]
- Muñoz-Aguirre, P.; Flores, M.; Macias, N.; Quezada, A.D.; Denova-Gutiérrez, E.; Salmerón, J. The effect of vitamin D supplementation on serum lipids in postmenopausal women with diabetes: A randomized controlled trial. Clin. Nutr. 2015, 34, 799–804. [Google Scholar] [CrossRef] [PubMed]
- Jamilian, M.; Samimi, M.; Ebrahimi, F.A.; Hashemi, T.; Taghizadeh, M.; Razavi, M.; Sanami, M.; Asemi, Z. The effects of vitamin D and omega-3 fatty acid co-supplementation on glycemic control and lipid concentrations in patients with gestational diabetes. J. Clin. Lipidol. 2017, 11, 459–468. [Google Scholar] [CrossRef] [PubMed]
- Ghaderi, A.; Banafshe, H.R.; Motmaen, M.; Rasouli-Azad, M.; Bahmani, F.; Asemi, Z. Clinical trial of the effects of vitamin D supplementation on psychological symptoms and metabolic profiles in maintenance methadone treatment patients. Prog. Neuropsychopharmacol. Biol. Psychiatry 2017, 79, 84–89. [Google Scholar] [CrossRef] [PubMed]
- Ghaderi, A.; Banafshe, H.R.; Mirhosseini, N.; Moradi, M.; Karimi, M.A.; Mehrzad, F.; Bahmani, F.; Asemi, Z. Clinical and metabolic response to vitamin D plus probiotic in schizophrenia patients. BMC Psychiatry 2019, 19, 77. [Google Scholar] [CrossRef]
- Miao, J.; Bachmann, K.N.; Huang, S.; Su, Y.R.; Dusek, J.; Newton-Cheh, C.; Arora, P.; Wang, T.J. Effects of Vitamin D Supplementation on Cardiovascular and Glycemic Biomarkers. J. Am. Heart Assoc. 2021, 10, e017727. [Google Scholar] [CrossRef]
- Imga, N.N.; Karci, A.C.; Oztas, D.; Berker, D.; Guler, S. Effects of vitamin D supplementation on insulin resistance and dyslipidemia in overweight and obese premenopausal women. Arch. Med. Sci. 2019, 15, 598–606. [Google Scholar] [CrossRef] [PubMed]
- Al-Daghri, N.M.; Alkharfy, K.M.; Al-Othman, A.; El-Kholie, E.; Moharram, O.; Alokail, M.S.; Al-Saleh, Y.; Sabico, S.; Kumar, S.; Chrousos, G.P. Vitamin D supplementation as an adjuvant therapy for patients with T2DM: An 18-month prospective interventional study. Cardiovasc. Diabetol. 2012, 11, 85. [Google Scholar] [CrossRef] [PubMed]
- Shab-Bidar, S.; Neyestani, T.R.; Djazayery, A.; Eshraghian, M.R.; Houshiarrad, A.; Gharavi, A.; Kalayi, A.; Shariatzadeh, N.; Zahedirad, M.; Khalaji, N.; et al. Regular consumption of vitamin D-fortified yogurt drink (Doogh) improved endothelial biomarkers in subjects with type 2 diabetes: A randomized double-blind clinical trial. BMC Med. 2011, 9, 125. [Google Scholar] [CrossRef] [PubMed]
- Ramiro-Lozano, J.M.; Calvo-Romero, J.M. Effects on lipid profile of supplementation with vitamin D in type 2 diabetic patients with vitamin D deficiency. Ther. Adv. Endocrinol. Metab. 2015, 6, 245–248. [Google Scholar] [CrossRef] [PubMed]
- Sacheck, J.M.; Huang, Q.; Van Rompay, M.I.; Chomitz, V.R.; Economos, C.D.; Eliasziw, M.; Gordon, C.M.; Goodman, E. Vitamin D supplementation and cardiometabolic risk factors among diverse schoolchildren: A randomized clinical trial. Am. J. Clin. Nutr. 2022, 115, 73–82. [Google Scholar] [CrossRef] [PubMed]
- Liyanage, G.C.; Lekamwasam, S.; Weerarathna, T.P.; Liyanage, C.E. Effects of high-dose parenteral vitamin D therapy on lipid profile and blood pressure in patients with diabetic nephropathy: A randomized double-blind clinical trial. Diabetes Metab. Syndr. 2017, 2, S767–S770. [Google Scholar] [CrossRef] [PubMed]
- Rajabi-Naeeni, M.; Dolatian, M.; Qorbani, M.; Vaezi, A.A. The effect of omega-3 and vitamin D co-supplementation on glycemic control and lipid profiles in reproductive-aged women with pre-diabetes and hypovitaminosis D: A randomized controlled trial. Diabetol. Metab. Syndr. 2020, 12, 41. [Google Scholar] [CrossRef] [PubMed]
- Samimi, M.; Kashi, M.; Foroozanfard, F.; Karamali, M.; Bahmani, F.; Asemi, Z.; Hamidian, Y.; Talari, H.R.; Esmaillzadeh, A. The effects of vitamin D plus calcium supplementation on metabolic profiles, biomarkers of inflammation, oxidative stress and pregnancy outcomes in pregnant women at risk for pre-eclampsia. J. Hum. Nutr. Diet. 2016, 29, 505–515. [Google Scholar] [CrossRef]
- Riek, A.E.; Oh, J.; Darwech, I.; Worthy, V.; Lin, X.; Ostlund, R.E., Jr.; Zhang, R.M.; Bernal-Mizrachi, C. Vitamin D3 supplementation decreases a unique circulating monocyte cholesterol pool in patients with type 2 diabetes. J. Steroid Biochem. Mol. Biol. 2018, 177, 187–192. [Google Scholar] [CrossRef]
- Giulietti, A.; van Etten, E.; Overbergh, L.; Stoffels, K.; Bouillon, R.; Mathieu, C. Monocytes from type 2 diabetic patients have a pro-inflammatory profile. 1,25-Dihydroxyvitamin D(3) works as anti-inflammatory. Diabetes Res. Clin. Pract. 2007, 77, 47–57. [Google Scholar] [CrossRef]
- Hu, J.; Jia, J.; Zhang, Y.; Miao, R.; Huo, X.; Ma, F. Effects of vitamin D3 supplementation on cognition and blood lipids: A 12-month randomized, double-blind, placebo-controlled trial. J. Neurol. Neurosurg. Psychiatry 2018, 89, 1341–1347. [Google Scholar] [CrossRef] [PubMed]
- Sabico, S.; Wani, K.; Grant, W.B.; Al-Daghri, N.M. Improved HDL Cholesterol through Vitamin D Status Correction Substantially Lowers 10-Year Atherosclerotic Cardiovascular Disease Risk Score in Vitamin D-Deficient Arab Adults. Nutrients 2023, 15, 551. [Google Scholar] [CrossRef] [PubMed]
- Schwetz, V.; Scharnagl, H.; Trummer, C.; Stojakovic, T.; Pandis, M.; Grübler, M.R.; Verheyen, N.; Gaksch, M.; Zittermann, A.; Aberer, F.; et al. Vitamin D supplementation and lipoprotein metabolism: A randomized controlled trial. J. Clin. Lipidol. 2018, 12, 588–596. [Google Scholar] [CrossRef] [PubMed]
- Zittermann, A.; Frisch, S.; Berthold, H.K.; Götting, C.; Kuhn, J.; Kleesiek, K.; Stehle, P.; Koertke, H.; Koerfer, R. Vitamin D supplementation enhances the beneficial effects of weight loss on cardiovascular disease risk markers. Am. J. Clin. Nutr. 2009, 89, 1321–1327. [Google Scholar] [CrossRef]
- Jorde, R.; Figenschau, Y.; Hutchinson, M.; Emaus, N.; Grimnes, G. High serum 25-hydroxyvitamin D concentrations are associated with a favorable serum lipid profile. Eur. J. Clin. Nutr. 2010, 64, 1457–1464. [Google Scholar] [CrossRef]
- Jorde, R.; Sollid, S.T.; Svartberg, J.; Schirmer, H.; Joakimsen, R.M.; Njølstad, I.; Fuskevåg, O.M.; Figenschau, Y.; Hutchinson, M.Y. Vitamin D 20,000 IU per Week for Five Years Does Not Prevent Progression from Prediabetes to Diabetes. J. Clin. Endocrinol. Metab. 2016, 101, 1647–1655. [Google Scholar] [CrossRef]
- Bahramian, H.; Sherafatmanesh, S.; Asadi, N.; Bakhshi, A.; Hassan Eftekhari, M.; Ekramzadeh Comma, M. Effects of single-dose and co-supplementation of vitamin D and omega-3 on metabolic profile in women with polycystic ovary syndrome: An RCT. Int. J. Reprod. Biomed. 2023, 21, 541–550. [Google Scholar] [CrossRef]
- Safari, S.; Rafraf, M.; Malekian, M.; Molani-Gol, R.; Asghari-Jafarabadi, M.; Mobasseri, M. Effects of vitamin D supplementation on metabolic parameters, serum irisin and obesity values in women with subclinical hypothyroidism: A double-blind randomized controlled trial. Front. Endocrinol. 2023, 14, 1306470. [Google Scholar] [CrossRef] [PubMed]
- Ku, C.W.; Lee, A.J.W.; Oh, B.; Lim, C.H.F.; Chang, T.Y.; Yap, F.; Chan, J.K.Y.; Loy, S.L. The Effect of Vitamin D Supplementation in Pregnant Women with Overweight and Obesity: A Randomised Controlled Trial. Nutrients 2024, 16, 146. [Google Scholar] [CrossRef]
- Pittas, A.G.; Jorde, R.; Kawahara, T.; Dawson-Hughes, B. Vitamin D Supplementation for Prevention of Type 2 Diabetes Mellitus: To D or Not to D? J. Clin. Endocrinol. Metab. 2020, 105, 3721–3733. [Google Scholar] [CrossRef]
- di Filippo, L.; Uygur, M.; Locatelli, M.; Nannipieri, F.; Frara, S.; Giustina, A. Low vitamin D levels predict outcomes of COVID-19 in patients with both severe and non-severe disease at hospitalization. Endocrine 2023, 80, 669–683. [Google Scholar] [CrossRef] [PubMed]
- MacGiriley, R.; Phoswa, W.N.; Mokgalaboni, K. Modulatory Properties of Vitamin D in Type 2 Diabetic Patients: A Focus on Inflammation and Dyslipidemia. Nutrients 2023, 15, 4575. [Google Scholar] [CrossRef] [PubMed]


Disclaimer/Publisher’s Note: The statements, opinions and data contained in all publications are solely those of the individual author(s) and contributor(s) and not of MDPI and/or the editor(s). MDPI and/or the editor(s) disclaim responsibility for any injury to people or property resulting from any ideas, methods, instructions or products referred to in the content. |
© 2024 by the authors. Licensee MDPI, Basel, Switzerland. This article is an open access article distributed under the terms and conditions of the Creative Commons Attribution (CC BY) license (https://creativecommons.org/licenses/by/4.0/).