Abstract
Two U.S. cities require chain restaurants to label menu items that exceed 100% of the Daily Value (DV) for sodium, informing consumers and potentially prompting restaurant reformulation. To inform policy design for other localities, this study determined the percentage of the top 91 U.S. chain restaurants’ menu items that would be labeled if a warning policy were established for menu items exceeding the thresholds of 20%, 33%, 50%, 65%, and 100% of the sodium DV for adults. We obtained U.S. chain restaurants’ nutrition information from the 2019 MenuStat database and calculated the percentage of items requiring sodium warning labels across the food and beverage categories at all the restaurants and at the full- and limited-service restaurants separately. In total, 19,038 items were included in the analyses. A warning label covering items with >20%, >33%, >50%, >65%, and >100% of the sodium DV resulted in expected coverage of 42%, 30%, 20%, 13%, and 5% of menu items at all the restaurants, respectively. At each threshold, the average percentage of items labeled per restaurant was higher among the full-service restaurants than the limited-service restaurants. These results suggest that restaurant warning policies with a threshold of 100% of the sodium DV per item would cover a minority of high-sodium menu items and that lower thresholds should be considered to help U.S. consumers reduce their sodium consumption.
1. Introduction
Overconsumption of sodium remains one of the major contributors to the high rate of diet-related chronic disease in the United States, with critical public health and economic implications. Excessive sodium intake increases the risk of hypertension [1], which in turn raises the risk of heart attack and stroke [2]. Therefore, in the U.S., individuals over the age of 14 are advised to lower their sodium intake to under 2300 milligrams (mg) per day, the sodium Daily Value (DV) for adults [3]. However, the average population intake of sodium for children aged 2–19 (2968 mg/day) and adults aged 20 and older (3463 mg/day) greatly exceeds the recommended intake levels [4]. Researchers have estimated that reducing adult Americans’ average sodium intake by 34% to 2300 mg/day over the span of 10 years would prevent 895,000 cardiovascular disease (CVD) events and 252,500 CVD-related deaths [5].
While some sodium is naturally occurring in many foods, it is estimated that more than 70% of sodium consumption can be attributed to packaged and restaurant foods, where sodium may be added in high amounts to enhance palatability and shelf life [1,6]. Restaurants alone account for 26% and 31% of the average daily sodium intake for children and adults, respectively [7]. However, consumers do not realize how much sodium they are consuming at restaurants; in one study, 90% of adults and 88% of adolescents underestimated the sodium levels in restaurant menu items by an average of 900–1000 mg per meal when the actual mean sodium content was 1300 mg per meal for adults and 1100 mg per meal for adolescents [8].
Sodium warnings in restaurants are one policy approach to educate U.S. consumers and reduce sodium in their diets. These disclosures appear on menus, menu boards or other locations that provide easily interpretable information to consumers about food items that contain excessive amounts of sodium. Sodium warnings may also encourage restaurants to reduce the sodium in their menu items to avoid having to label high-sodium items with a warning. Two U.S. cities, New York City and Philadelphia, have enacted policies requiring sodium warnings on chain restaurant menu items that contain more than 2300 mg, or 100% of the adult DV [9,10]. This threshold is substantially above the value of 460 mg, or 20% of the DV, used in the FDA’s general consumer nutrition advice to identify items that are “high” in sodium [3]. The New York City Department of Health and Mental Hygiene estimated in an unpublished study that their warnings would apply to roughly 10% of menu items sold in the city’s chain restaurants [11].
As other cities and states consider restaurant warning policies to reduce sodium consumption, some may explore adopting lower thresholds to help consumers identify more high-sodium items and to create an incentive for restaurants to reduce the sodium content still further. Despite increasing government interest in these policies, the extent to which restaurant menu items would qualify for sodium warnings at different thresholds has not been assessed. Thus, the primary aim of this research was to assess the percentage of all chain restaurant menu items that would be labeled if a warning label policy were established at various sodium thresholds, overall and by food/beverage category. The secondary aims of this study were to compare the warning label prevalence at different thresholds by restaurant type (full service and limited service); describe the distribution of sodium in menu items by food/beverage category across all the restaurants; and identify the highest-sodium items in each food category.
2. Materials and Methods
2.1. Design and Data Source
To evaluate the distribution of sodium across menu items at chain restaurants, we used a cross-sectional study design using 2019 MenuStat data, the most recently available at the time of analysis. The MenuStat 2019 database contains nutrition information for food and beverage items at 91 of the highest-grossing chain restaurants in the United States [12]. The nutrition information in MenuStat is sourced directly from the posted information on restaurant websites. We categorized each restaurant in the dataset as either full service (“establishments primarily engaged in providing food services to patrons who order and are served while seated, i.e., waiter/waitress service, and pay after eating” [13]) or limited service (“establishments primarily engaged in providing food services, except snack and nonalcoholic beverage bars, where patrons generally order or select items and pay before eating” [14]). We referred to restaurants’ websites for information about the establishments and cross-referenced the categorization of U.S. chain restaurants from previous studies [15,16,17,18] that have categorized restaurants using similar categories for full service (e.g., sit down, full service) and limited service (e.g., fast food, fast casual) to determine the categorization for each restaurant in the sample.
MenuStat categorizes each menu item into one of twelve food categories (e.g., appetizers and sides, baked goods, beverages) and assigns a binary code that denotes whether restaurants have described items as kids’ menu items (labeled for kids, like “kids’ fries”), combination meals (described as including an entrée, side, and drink), limited-time offer or seasonal, regional (only sold in certain locations), or shareable (“the nutrition cannot be divided into a single serving, e.g., carafes, whole pies, quarts of ice cream, 2 L drinks”) [19]. The full sample before exclusions included 25,870 menu items across 12 food categories. We focused our analysis on menu items that would be eligible for a warning label under New York City’s law, which applies to any items meant to feed one person (including combination meals) above the threshold for sodium, in addition to any items meant to feed more than one person for which each individual serving is above the threshold for sodium [9]. We could not determine the sodium content per serving for the majority of multi-serving items because the serving size information was missing for 56% of items in the 2019 MenuStat database. We thus chose to be conservative and excluded all the multi-serving items from our analyses. MenuStat’s “shareable” category was not an exhaustive collection of all the multi-serving items, so in addition to excluding those items, we excluded all the menu items with names and descriptions containing keywords commonly used to denote multi-serving items (e.g., “shareable”, “family”; see Table A1 for a full list of search terms). We reviewed this list to ensure we were not accidentally excluding any single-serving items by cross-validating the item descriptions on restaurants’ websites. We also excluded items coded as a limited-time offer or regional. We additionally created new codes for MenuStat’s “kids’ meal items” and “combination meal items” so these items were separated into their own distinct categories for analysis. In total, the sample included 20,197 menu items from 91 different restaurants across 14 food categories. Items missing sodium data (n = 1159) were excluded from the analyses.
2.2. Statistical Analysis
For the primary analyses, we calculated the expected prevalence of sodium warning labels on restaurant menu items when the label applied to items with more than 20%, 33%, 50%, 65%, or 100% of the sodium DV for adults (>460 mg, >759 mg, >1150 mg, >1500 mg, and >2300 mg, respectively). We chose to evaluate the 20% DV threshold as it corresponds to the FDA’s guidance to consumers to identify foods that are high in sodium [3]. We selected the 33% DV threshold based on the assumption that an average restaurant customer will consume three meals a day, so a given meal might contain one-third of their total daily sodium. The 50% DV threshold represents half of a day’s worth of sodium based on current dietary guidance and the assumption that a customer may consume one higher-calorie, higher-sodium meal in a day, in addition to two other lower-calorie and -sodium meals and still consume no more than the recommended amount of sodium in a day. We selected the 65% DV threshold because it aligns with the adequate intake for sodium, which is the “recommended average daily nutrient intake level based on observed or experimentally determined approximations or estimates of nutrient intake by a group (or groups) of apparently healthy people who are assumed to be maintaining an adequate nutritional state” of sodium assumed to ensure nutritional adequacy based on estimates of intake by an apparently health group of people with adequate nutritional states [1,20]. Lastly, we selected the 100% DV threshold as it is the standard for existing sodium labeling policies in New York City and Philadelphia. We calculated the warning label prevalence at each of these thresholds across all the menu items and within each food/beverage category at all the restaurants. For the secondary analyses, we calculated the average prevalence of warning labels at each threshold for menu items by restaurant category: full service and limited service.
In additional secondary analyses, we calculated the median, interquartile range, mean, standard deviation, and range of the sodium content overall and within each food category across all the restaurants. We assessed the normality of the sodium distributions in each category by evaluating the skewness and kurtosis. We also used descriptive statistics to rank the 5 highest-sodium items in each food category across all the restaurants.
We conducted exploratory analyses to understand the percentage of all the menu items across all the restaurants and stratified by restaurant type that would be labeled at increments of 10% of the sodium DV starting from 10% DV and increasing up to 100% DV. We additionally calculated the percentage of each individual restaurant’s menu items that would be labeled at various sodium thresholds and the percentage of each restaurant’s menu items that would require a sodium warning label at the 100% DV sodium threshold by food category. All the data were analyzed in IBM® SPSS® Statistics for Windows version 29.0.1.0 (IBM Corp., Armonk, NY, USA) and the figures were created using Microsoft® Excel® for Windows 365 (Version 2405).
3. Results
The dataset consisted of 20,197 items, including 1159 items with missing sodium data and 19,038 menu items with sodium data from a total of 91 restaurants (n = 28 full service, n = 63 limited service). The distribution of sodium in the food categories was generally marked by positive skewness (more low values than in a normal distribution) and positive kurtosis (more peaked than in a normal distribution) (Table 1). Across all the restaurant menu items, the median sodium exceeded 1150 mg per item (>50% of the DV) in 3 of the 14 food categories: combo meals, sandwiches, and burgers. In every category except desserts, the maximum amount of sodium exceeded 100% of the DV.

Table 1.
Sodium (mg) in chain restaurant foods by food category.
Figure 1 represents the expected prevalence of the warning label within each food category at different thresholds. At the 20% DV threshold, 42% of all the items would be labeled (2–100% expected prevalence across categories), followed by 20% of items labeled at the 50% DV threshold (0–91%), and just 5% of items labeled at the 100% DV threshold (0–22%). Across the different thresholds, the combo meals, entrees, burgers, and soup categories generally had the highest expected prevalence of the label, whereas the beverages, toppings and ingredients, desserts, and baked goods categories generally had the lowest expected prevalence. Figure A1 shows the percentage of all the menu items across all the restaurants that would be labeled at increments of 10% of the sodium DV starting from 10% DV and increasing up to 100% DV.
Figure 1.
Expected prevalence of sodium warning labels on all the restaurant menu items overall and by food/beverage category when the label applies to items with >20%, >33%, >50%, >65%, or >100% of the Daily Value for sodium.
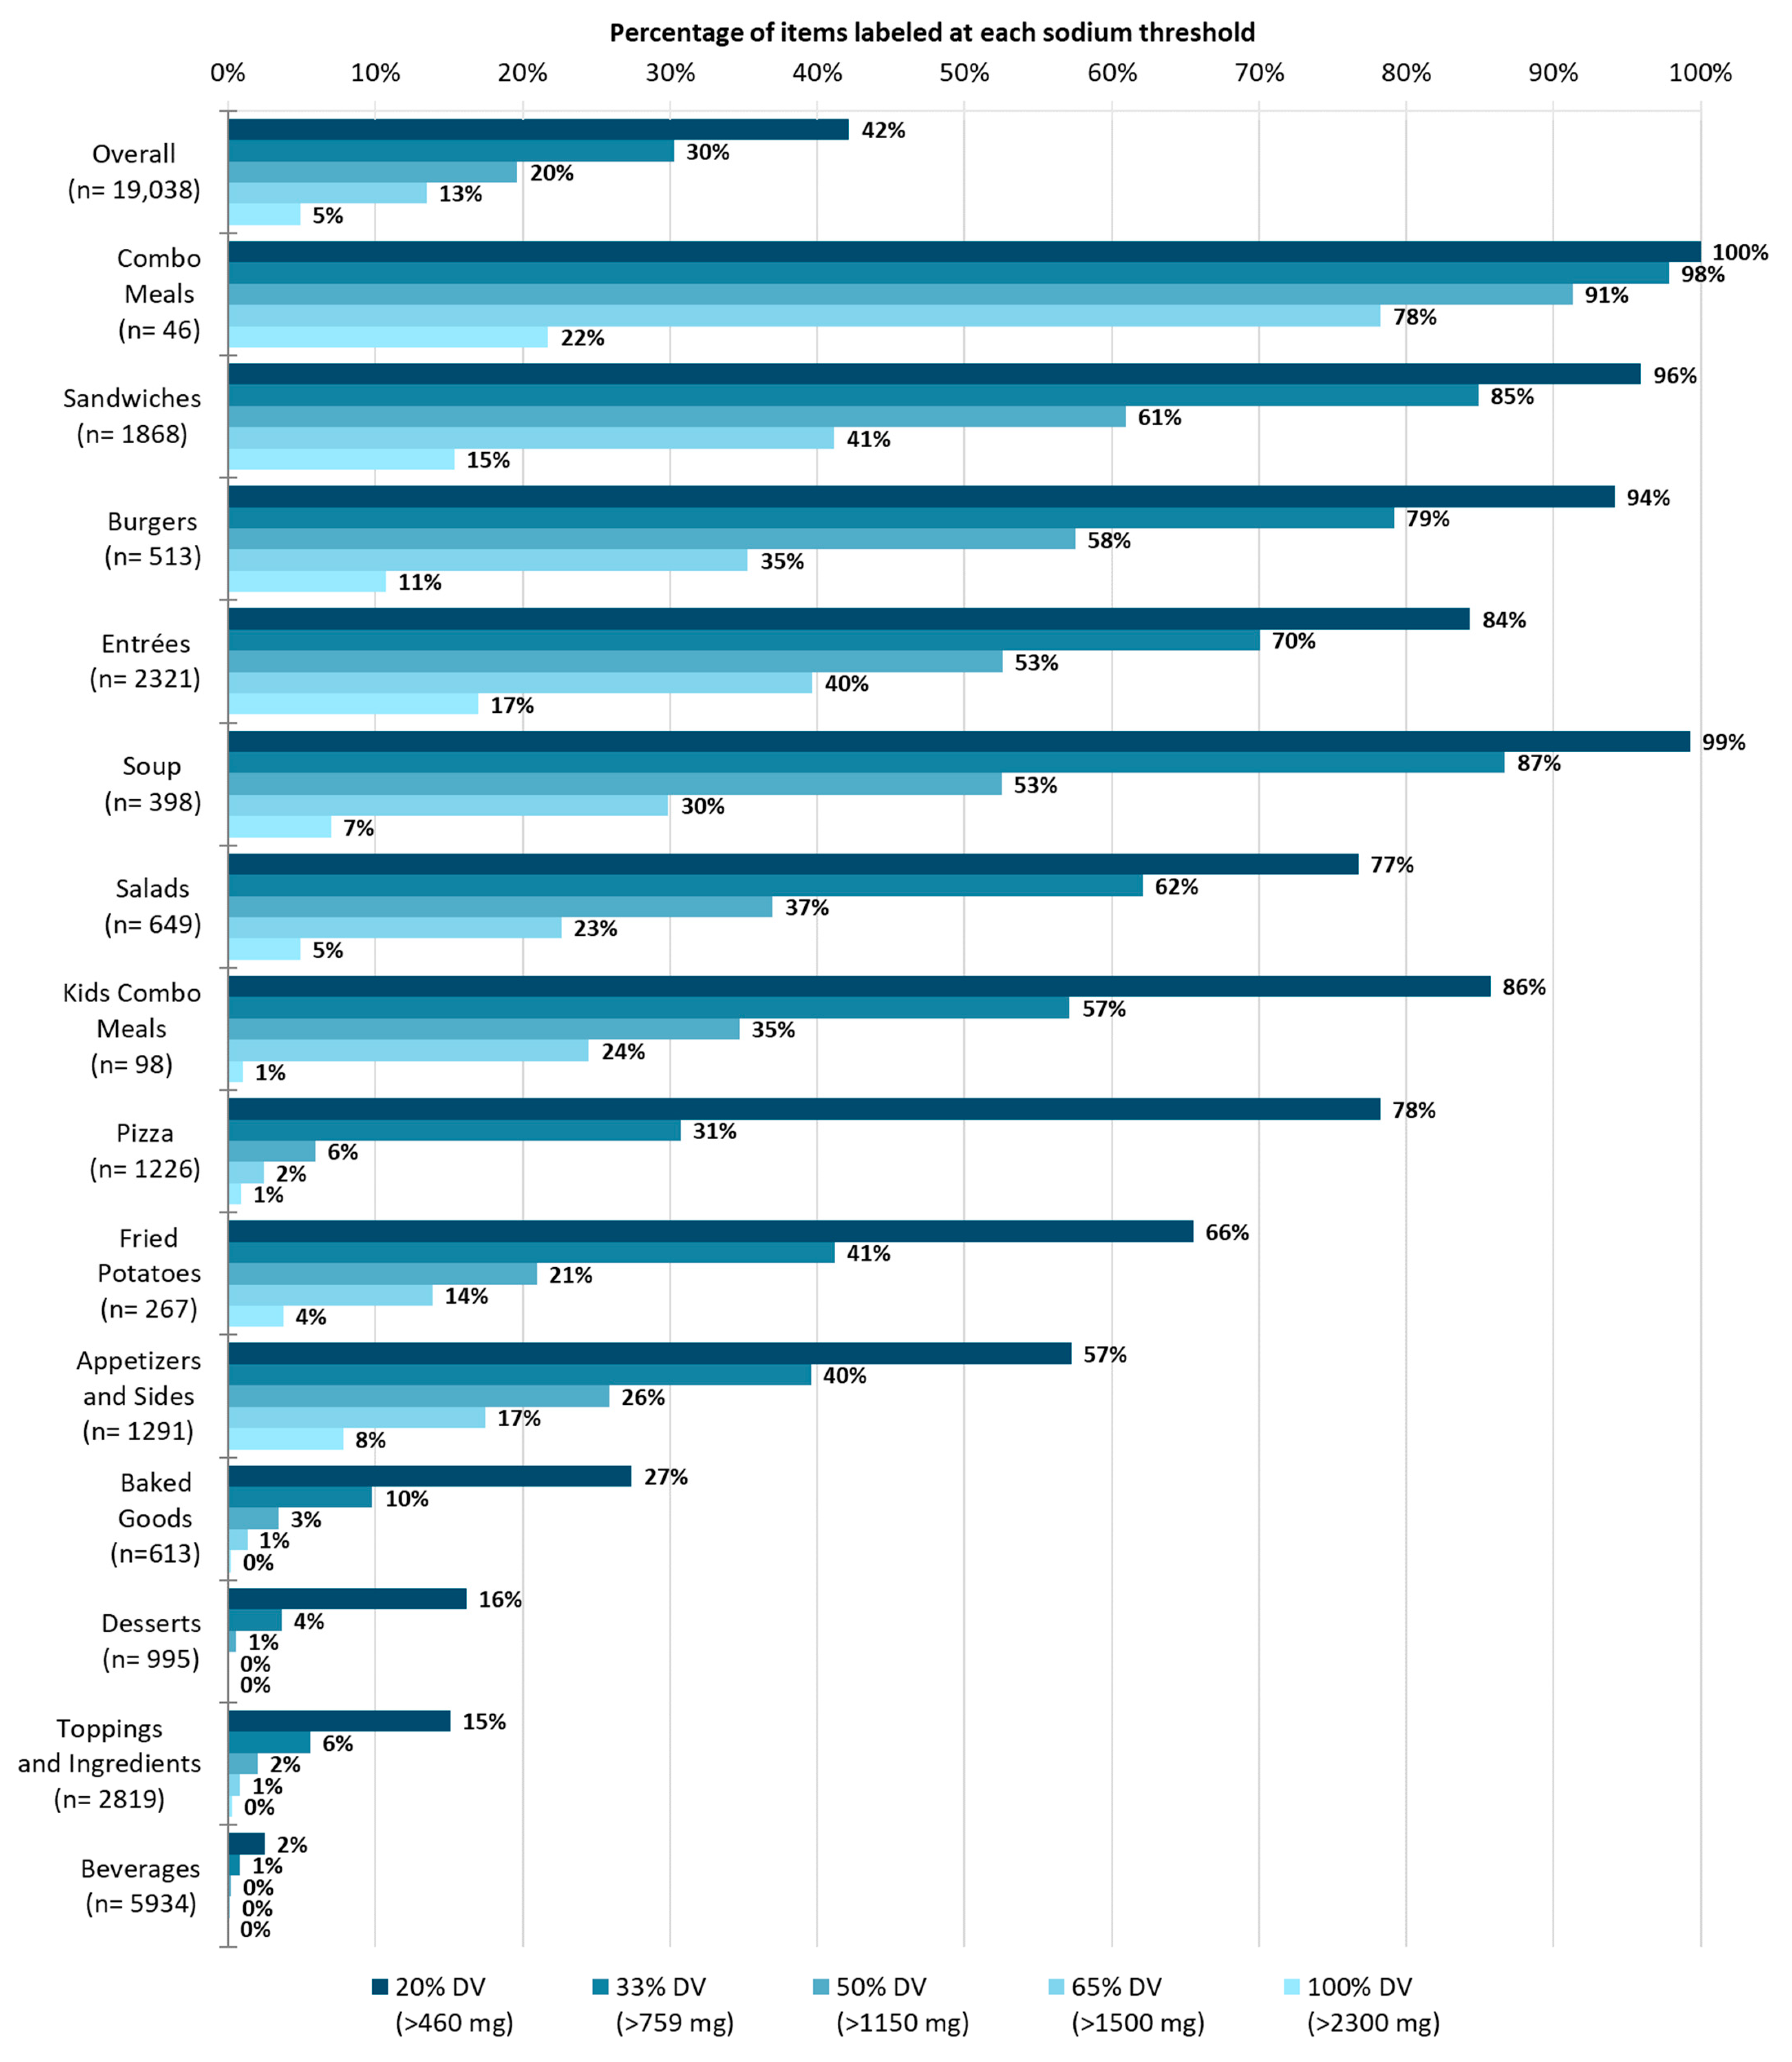
Figure 2 represents the average expected prevalence of items labeled at the various thresholds by restaurant type. On average, across all the restaurants, the expected prevalence of the label was 47% of items at the 20% DV threshold, while it decreased to 5% of items at the 100% DV threshold. We compared the expected prevalence of the label among items from all the restaurants with the expected prevalence for items from full- and limited-service restaurants. The average expected prevalence of the label was higher among the full-service restaurants than the limited-service restaurants at all the thresholds by 1.4-fold to 3.7-fold. At the 20% DV threshold, 42% of items from limited-service restaurants were labeled compared to 57% of items from full-service restaurants. And at the 100% DV threshold, just 3% and 11% of items were labeled at limited- and full-service restaurants, respectively.
Figure 2.
Percentage of menu items per restaurant that would require a sodium warning label when the label applies to items with >20%, >33%, >50%, >65%, or >100% of the Daily Value for sodium. Note: error bars represent the minimum and maximum average percentage of items labeled at each sodium threshold.
Figure A2 and Figure A3 show the percentage of items labeled at each threshold by food category within full-service and limited-service restaurants, respectively. At the 100% DV threshold, full-service restaurants had a higher percentage of items labeled overall and in most food categories when compared to limited-service restaurants, with the greatest differences observed in the percentage of items labeled in the combo meals, burgers, sandwiches, soups, and entrées categories.
Table 2 shows the five highest-sodium items in each food category. The five highest-sodium items overall were the Chicken Noodle Soup Bowl from Fisch’s Big Boy (449% DV), the Whole Turkey Muffaletta from Jason’s Deli (383% DV), the Double Winder Boneless Wings with Buffalo Sauce from Famous Dave’s (343% DV), the Full Rack Baby Pack Pork Ribs from BJ’s Restaurant and Brewhouse (341% DV), and the Double Winder Boneless Wings with Devils Spit from Famous Dave’s (335% DV). For more information about individual restaurants, Table A2 contains the expected prevalence of sodium warning labels at each of the 91 restaurants at the various sodium thresholds, while Table A3 shows the percentage of menu items at each restaurant by food category that would require a sodium warning label when the label applies to items with >100% of the sodium DV. Of note, more than half of all the sandwiches offered at seven different restaurants would require a sodium warning at the 100% DV threshold.
Table 2.
Five highest-sodium items in each food category.
4. Discussion
This is the first evaluation, to the best of the authors’ knowledge, to examine the expected prevalence of sodium warnings on menu items across the top U.S. chain restaurants and stratified by restaurant type. We considered 5 potential sodium warning label thresholds (20%, 33%, 50%, 65%, and 100% of the adult DV) to estimate their impact on the percentage of labeled menu items across 14 food categories in a sample of 19,038 menu items from 91 chain restaurants in 2019. At the highest threshold, 100% of the sodium DV, or 2300 mg, only 5% of all the menu items would be expected to carry the warning label, and increasingly more items (compared to the change in the threshold) were expected to be labeled at the 65% threshold (13% of all the menu items), 50% threshold (20% of all the menu items), 33% threshold (30% of all the menu items), and 20% DV threshold (42% of all the menu items) due to the positively skewed distribution of sodium. Based on these findings, we expect that chain restaurant sodium warning policies using the warning threshold of 2300 mg, as in Philadelphia and New York City, are only covering a distinct minority of high-sodium menu items, thus leaving room to significantly strengthen these policies by applying reduced thresholds.
Sodium warnings may be especially useful in full-service restaurants, as we found a higher expected prevalence of the label on items from full-service restaurants on average compared to limited-service restaurants at every sodium threshold. Furthermore, the five highest-sodium menu items in each food category largely came from full-service restaurants. Our study did not fully discern the extent to which the sodium content vs. a mix of offerings may play a role in the differences in the sodium content we observed at limited- vs. full-service restaurants. However, Figure A2 and Figure A3 show considerable differences in the sodium content of different offerings within the same categories between limited- vs. full-service restaurants.
This study found that more than a day’s worth of salt can be hidden in menu items from food categories consumers likely would not suspect, including beverages, salads, and baked goods. This indicates that there is a clear need for policies like sodium warnings to help consumers understand the amount of sodium in the foods and beverages they order from restaurants. Our findings further provide data to inform threshold-setting for sodium warning policies. Sodium warnings are designed to be used by consumers to inform their intake around one meal. Considering that people in the U.S. average 5.7 eating occasions per day [21], consuming a menu item containing 100% of the DV would mean consumers would have to either avoid any additional dietary sodium for the remainder of the day to stay within the recommended limit, or substantially limit their sodium intake on adjacent days to maintain an average intake not exceeding the DV. Additionally, sodium added to foods during preparation is not the sole source of dietary sodium and some customers may add salt at the table after purchasing their food. Given the low percentage of labeled items with a 100% DV threshold and data suggesting such thresholds in New York City have not altered consumer behavior or restaurant reformulation [22,23], states and localities should consider setting sodium warning thresholds below the 100% sodium DV level to increase the effectiveness. However, a warning threshold set too low may lead to warning fatigue due to the high number of items that could be labeled (e.g., at the 20% DV threshold, the percentage of items labeled would be 42% overall and would exceed 50% in 10 of the 14 food categories), potentially desensitizing consumers to the warning [24]. However, reducing the threshold to 65% DV would leave the majority of menu items unlabeled in each food category except for one (combo meals), so consumers would still be likely to attend to the labels without ignoring them or becoming overwhelmed.
No studies have tested the effects of lower-threshold sodium warnings on consumer behavior in a restaurant setting, but one study in a hospital cafeteria setting found that the introduction of sodium warnings at a 65% DV threshold was initially associated with a 6% decrease in sodium per item purchased [25]. However, the effects waned over 5 weeks. Importantly, half of the cafeteria’s customers were hospital staff who ate there frequently. This suggests that such labels have promise for reducing the sodium purchased and are most effective when salient, meaning that they may become less effective for people who habitually eat at the same restaurants. Furthermore, it is unclear how sodium warning labels at thresholds lower than 100% DV might spur restaurants to reformulate their menu items to contain less sodium, which is another important outcome of warning policies. It is possible that a warning policy requiring stepwise reductions in the sodium thresholds over time could increase the effectiveness by prolonging the salience. Future consumer testing should assess the potential for warning fatigue at various thresholds, while evaluations of enacted policies should examine the factors influencing restaurant reformulation. A gradual sodium reduction in restaurant foods may benefit restaurant owners and operators as well, as customers will have time to adjust to reduced-sodium menu items. Prior research has shown that up to a 50% sodium reduction did not affect consumers’ acceptance or liking of a food [26]. It follows that restaurant reformulation spurred by sodium warning policies may not even be noticed by customers, as they may be unable to detect taste changes in the dishes. Restaurateurs can explore other sodium-reduction strategies without compromising customer satisfaction and the taste quality of lower-sodium foods, such as the addition of herbs and spices [27,28].
This study has several limitations. First, our analyses were focused on the expected prevalence of warning labels among menu items and were not weighted based on actual consumption or sales data. As our restaurant sample and dataset did not include all the chain restaurants in the United States, we cannot generalize about the expected prevalence of a sodium warning label across smaller restaurants. We did examine the relationship between the number of outlets for a given chain and the prevalence of warnings at the 100% DV threshold and found that, after adjusting for the type of restaurant (full or limited service), there was no such relationship, suggesting that our findings may have relevance beyond these larger restaurants. A further limitation is that the restaurant nutrition information used in this study was from 2019 and menus may have changed. Furthermore, MenuStat relies on restaurants to post complete menus on their websites, and for 9 of the top 100 restaurants, data were not available. Lastly, some items intended to be shareable items may be in the dataset, although we attempted to exclude these based on coding for shareable items and a careful review of item descriptors indicating multi-serving items. It is also critical to point out that the 2300 mg daily sodium limit that policies have been based around—and that this study is based on—reflects the daily limit of sodium for individuals 14 years and older. Younger people need even less sodium per day, so policymakers should consider other ways to help parents choose foods with less sodium for their kids, like including sodium limits in kids’ meals [29].
5. Conclusions
In this study, a warning label applied to restaurant menu items with more than 2300 mg sodium resulted in a low expected sodium warning prevalence across 91 of the top 100 restaurant chains in the U.S. This is problematic, because menu items across all the examined food categories contained very high levels of sodium, and consumers are unlikely to be aware of this sodium content, especially for categories like beverages and salads. Therefore, policymakers considering restaurant warning label policies should consider a lower sodium threshold for sodium warning labels on restaurant menus.
Author Contributions
Conceptualization, D.N., S.S. and P.L.; methodology, A.H., D.N., S.S., P.L. and A.A.M.; software, A.H.; validation, A.H. and P.L.; formal analysis, A.H. and P.L.; investigation, A.H.; resources, A.H. and D.N.; data curation, A.H.; writing—original draft preparation, A.H., D.N. and S.S.; writing—review and editing, D.N., S.S., A.A.M. and P.L.; visualization, A.H.; supervision, A.A.M. and P.L.; project administration, S.S., A.A.M. and P.L.; funding acquisition, D.N., S.S. and P.L. All authors have read and agreed to the published version of the manuscript.
Funding
This research was funded by Bloomberg Philanthropies (United States), grant number 2019-71208.
Institutional Review Board Statement
Not applicable.
Informed Consent Statement
Not applicable.
Data Availability Statement
MenuStat data are freely available online for public usage from www.menustat.org (accessed on 15 October 2021).
Acknowledgments
Thank you to the New York City Department of Health and Mental Hygiene and the Department of Population Medicine, Harvard Pilgrim Health Care Institute, for their assistance with the background on MenuStat’s data collection methods.
Conflicts of Interest
The authors declare no conflicts of interest. The funders had no role in the design of the study; in the collection, analyses, or interpretation of data; in the writing of the manuscript; or in the decision to publish the results.
Appendix A
Figure A1.
Expected prevalence of a sodium warning label on restaurant menu items when the label applies to items with 10–100% of the Daily Value for sodium.
Figure A1.
Expected prevalence of a sodium warning label on restaurant menu items when the label applies to items with 10–100% of the Daily Value for sodium.
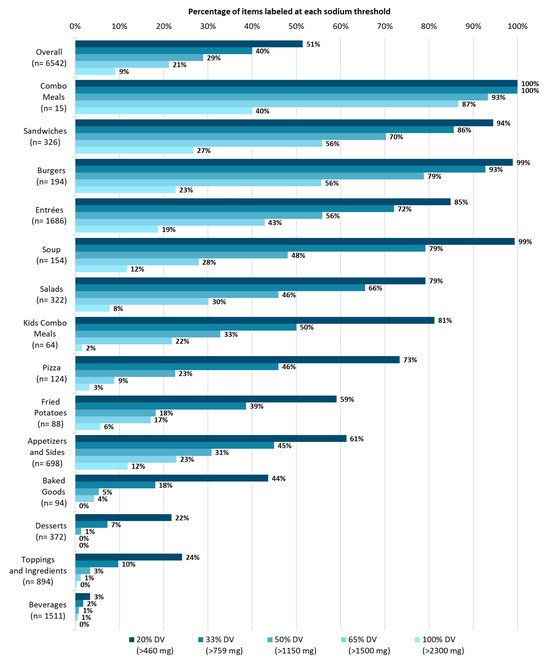
Figure A2.
Expected prevalence of a sodium warning label on full-service restaurant menu items when the label applies to items with >20%, >33%, >50%, >65%, or >100% of the Daily Value for sodium.
Figure A2.
Expected prevalence of a sodium warning label on full-service restaurant menu items when the label applies to items with >20%, >33%, >50%, >65%, or >100% of the Daily Value for sodium.

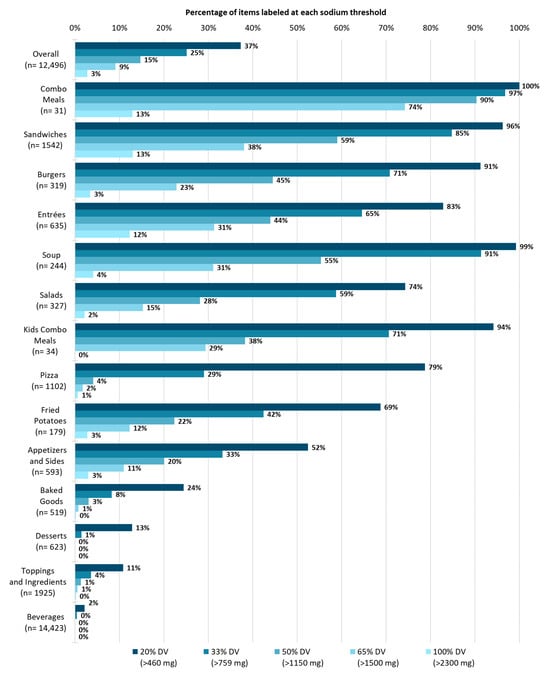
Figure A3.
Expected prevalence of a sodium warning label on limited-service restaurant menu items when the label applies to items with >20%, >33%, >50%, >65%, or >100% of the Daily Value for sodium.
Figure A3.
Expected prevalence of a sodium warning label on limited-service restaurant menu items when the label applies to items with >20%, >33%, >50%, >65%, or >100% of the Daily Value for sodium.
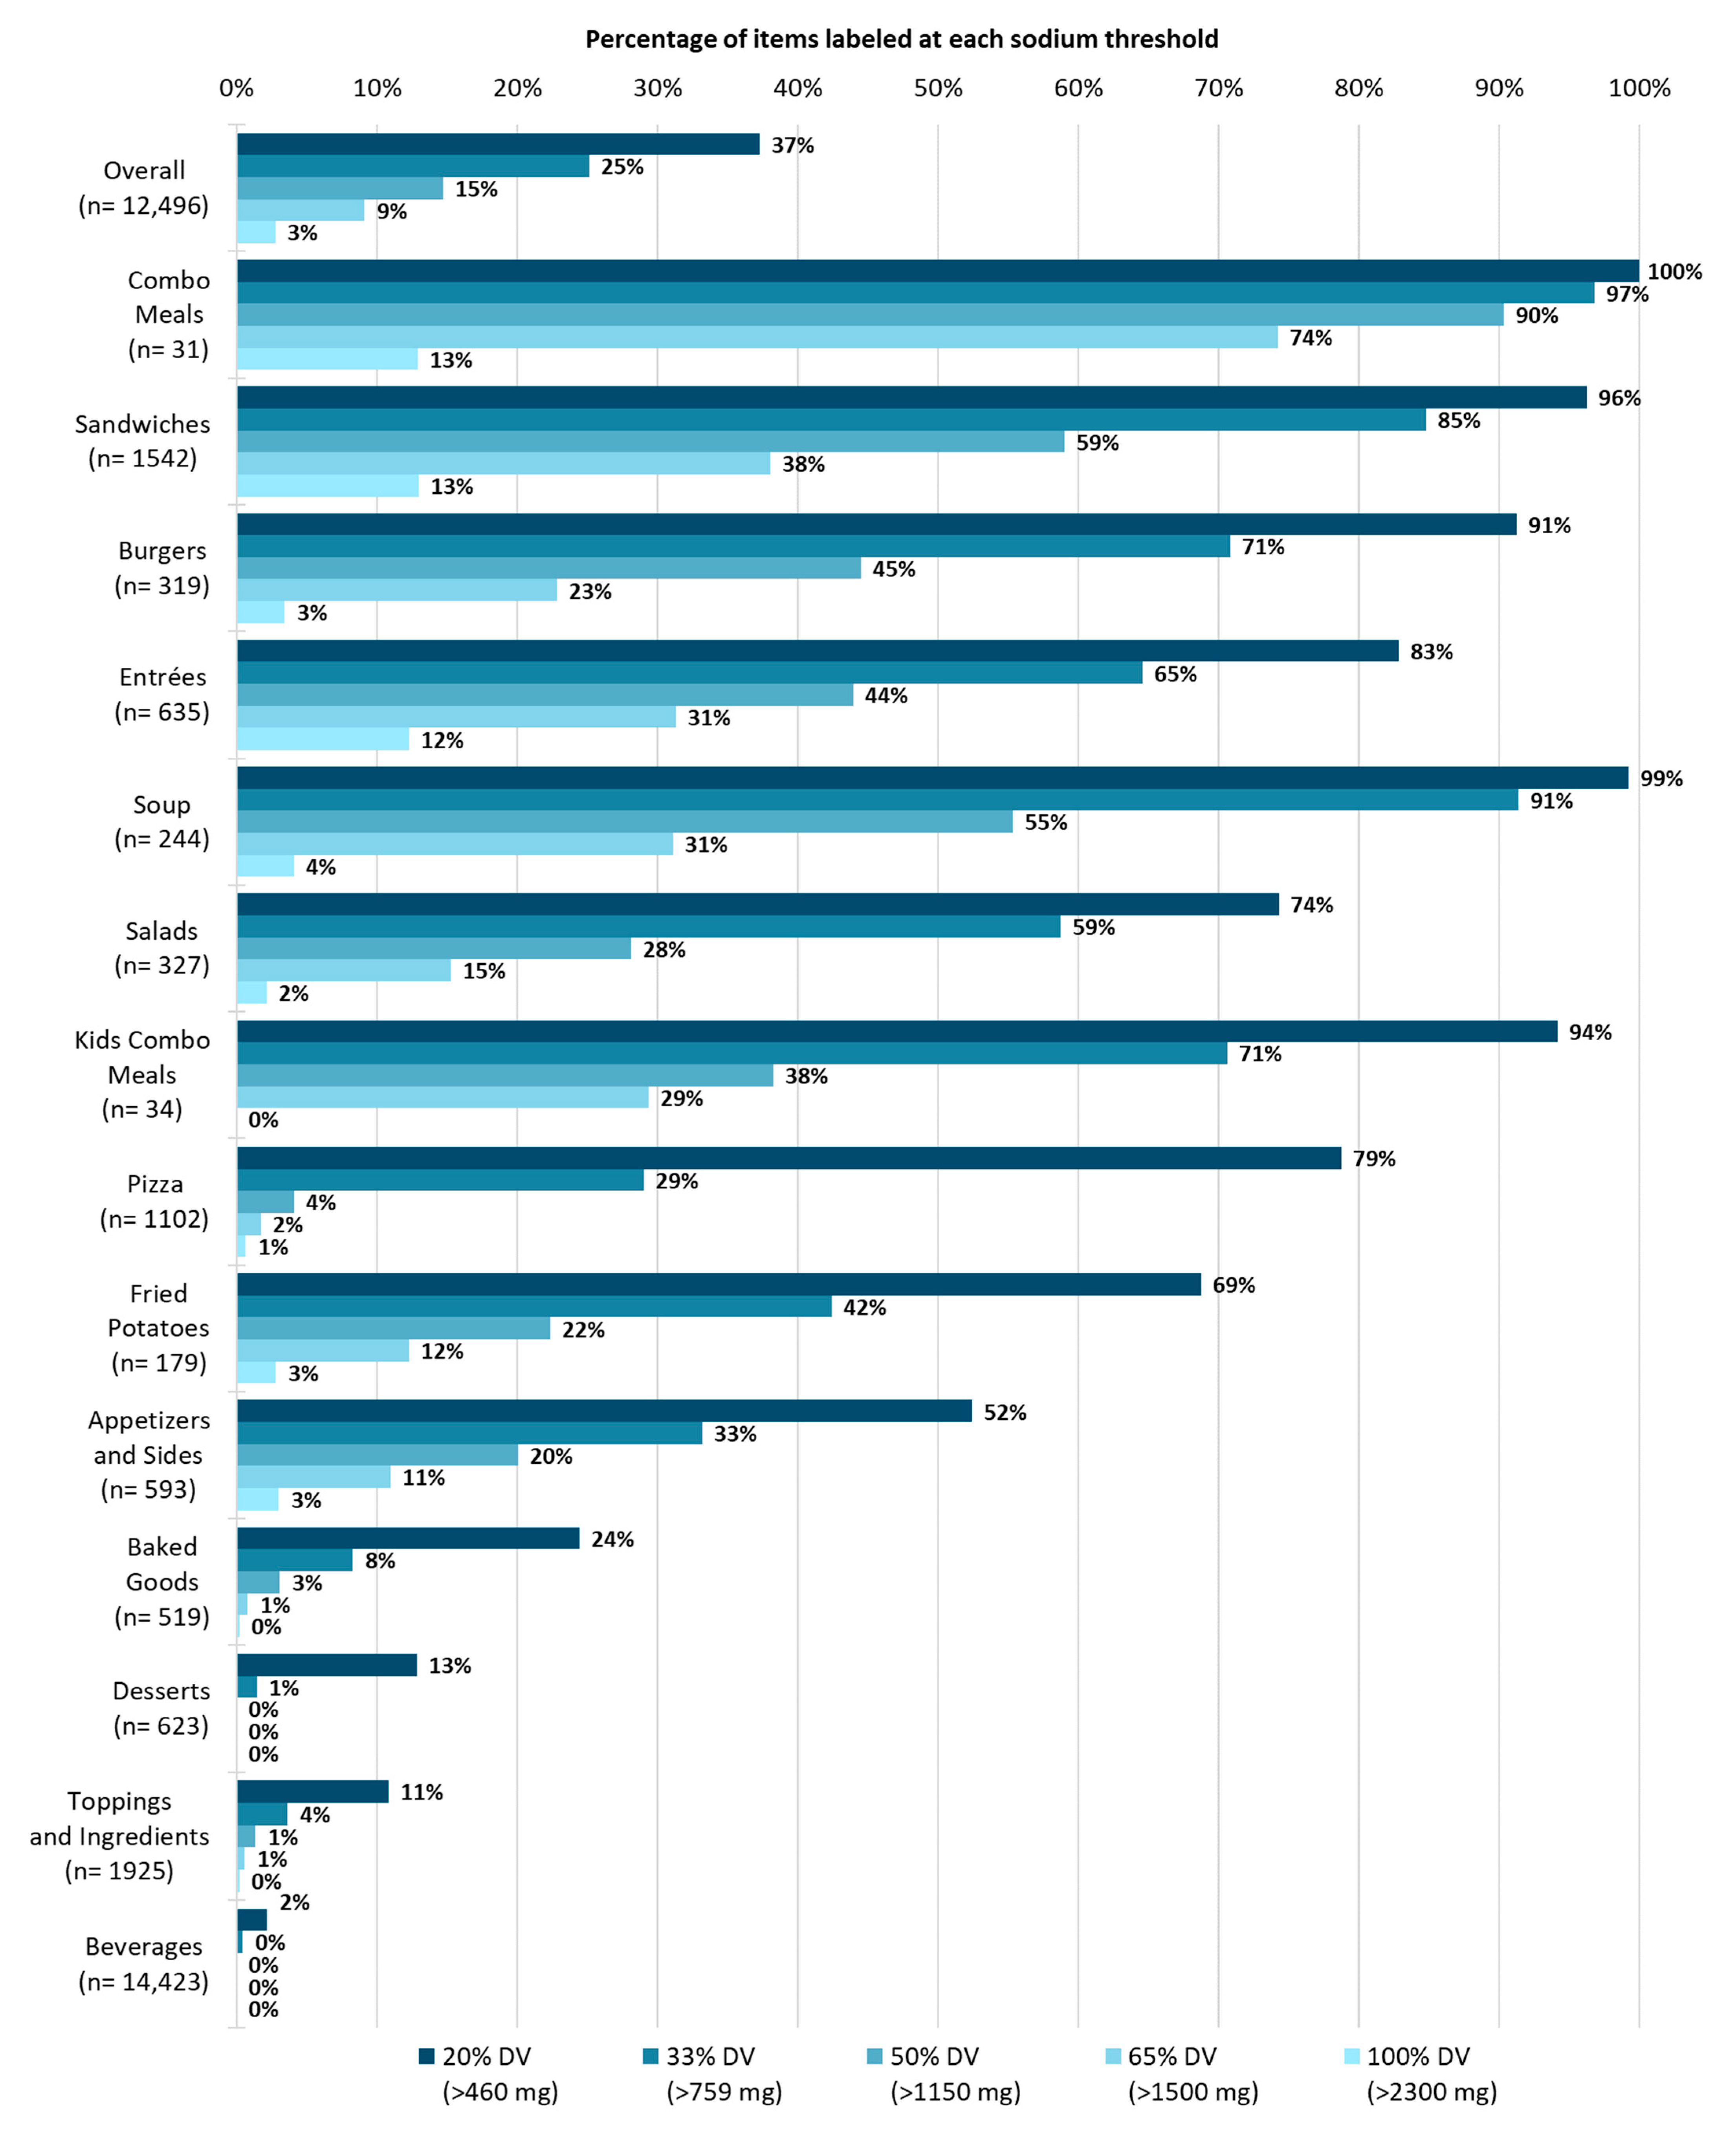
Table A1.
Search terms used to identify multi-serving items.
Table A1.
Search terms used to identify multi-serving items.
| Search Terms | |
|---|---|
| Bottle | Pitcher |
| Bucket | Platter |
| Bundle | Quart |
| Family | Sack |
| Feast | Sampler |
| Feeds | Shareable |
| Gallon | To Share |
| Giant | Tray |
| Group | Whole Cake |
| Liter | Whole Pie |
| Party | |
| Picnic | |
Table A2.
Percentage of menu items for each restaurant that would require a sodium warning label when the label applies to items with >20%, >33%, >50%, >65%, or >100% of the Daily Value for sodium.
Table A2.
Percentage of menu items for each restaurant that would require a sodium warning label when the label applies to items with >20%, >33%, >50%, >65%, or >100% of the Daily Value for sodium.
| Restaurant Category | Restaurant Chain | Total # Items | % of Menu Items Labeled at Different Thresholds | ||||
|---|---|---|---|---|---|---|---|
| 20% DV | 33% DV | 50% DV | 65% DV | 100% DV | |||
| Full service | Applebee’s | 258 | 45% | 38% | 28% | 21% | 14% |
| BJ’s Restaurant and Brewhouse | 430 | 53% | 41% | 29% | 25% | 11% | |
| Bob Evans | 231 | 64% | 54% | 44% | 32% | 13% | |
| Bonefish Grill | 94 | 48% | 34% | 20% | 14% | 5% | |
| California Pizza Kitchen | 265 | 37% | 28% | 20% | 11% | 2% | |
| Carrabba’s Italian Grill | 202 | 59% | 46% | 35% | 27% | 10% | |
| Chili’s | 279 | 41% | 32% | 24% | 20% | 12% | |
| Denny’s | 219 | 49% | 35% | 26% | 18% | 7% | |
| Famous Dave’s | 222 | 80% | 68% | 52% | 41% | 15% | |
| Friendly’s | 228 | 63% | 54% | 41% | 26% | 9% | |
| Golden Corral | 720 | 26% | 9% | 2% | 0% | 0% | |
| Hooters | 108 | 80% | 69% | 64% | 53% | 31% | |
| IHOP | 327 | 46% | 37% | 28% | 22% | 8% | |
| Joe’s Crab Shack | 191 | 49% | 36% | 26% | 19% | 14% | |
| LongHorn Steakhouse | 182 | 49% | 34% | 17% | 8% | 1% | |
| O’Charley’s | 158 | 78% | 68% | 56% | 47% | 24% | |
| Olive Garden | 186 | 41% | 31% | 19% | 12% | 3% | |
| On the Border | 167 | 69% | 58% | 47% | 38% | 17% | |
| Outback Steakhouse | 95 | 82% | 61% | 37% | 21% | 5% | |
| Perkins | 411 | 40% | 28% | 17% | 12% | 5% | |
| PF Chang’s | 160 | 83% | 73% | 58% | 46% | 17% | |
| Red Lobster | 250 | 52% | 41% | 30% | 22% | 8% | |
| Red Robin | 400 | 45% | 37% | 27% | 18% | 6% | |
| Romano’s Macaroni Grill | 95 | 80% | 69% | 54% | 39% | 15% | |
| Ruby Tuesday | 101 | 73% | 55% | 44% | 33% | 15% | |
| TGI Friday’s | 214 | 52% | 45% | 39% | 30% | 17% | |
| The Capital Grille | 93 | 58% | 44% | 16% | 10% | 3% | |
| Yard House | 256 | 57% | 47% | 34% | 22% | 9% | |
| Limited service | Arby’s | 82 | 67% | 49% | 38% | 28% | 6% |
| Auntie Anne’s | 153 | 22% | 13% | 7% | 0% | 0% | |
| Baskin Robbins | 257 | 13% | 1% | 0% | 0% | 0% | |
| Bojangles | 86 | 43% | 27% | 20% | 12% | 3% | |
| Boston Market | 73 | 62% | 38% | 23% | 10% | 0% | |
| Burger King | 180 | 41% | 32% | 15% | 8% | 1% | |
| Captain D’s | 85 | 36% | 20% | 12% | 9% | 0% | |
| Carl’s Jr. | 174 | 47% | 37% | 26% | 15% | 1% | |
| Casey’s General Store | 183 | 38% | 24% | 16% | 8% | 0% | |
| Checker’s Drive-In/Rallys | 79 | 54% | 52% | 33% | 19% | 0% | |
| Chick-Fil-A | 127 | 46% | 29% | 16% | 6% | 1% | |
| Chipotle | 69 | 26% | 12% | 1% | 0% | 0% | |
| Chuck E. Cheese | 193 | 21% | 11% | 5% | 1% | 0% | |
| Church’s Chicken | 141 | 30% | 21% | 14% | 6% | 2% | |
| Ci Ci’s Pizza | 37 | 30% | 19% | 5% | 5% | 0% | |
| Culver’s | 291 | 30% | 19% | 8% | 5% | 1% | |
| Dairy Queen | 326 | 26% | 19% | 11% | 7% | 2% | |
| Del Taco | 167 | 46% | 32% | 22% | 12% | 3% | |
| Dominos | 381 | 20% | 11% | 3% | 1% | 0% | |
| Dunkin’ Donuts | 482 | 10% | 5% | 2% | 0% | 0% | |
| Einstein Bros | 145 | 57% | 39% | 23% | 9% | 1% | |
| El Pollo Loco | 129 | 54% | 45% | 32% | 22% | 4% | |
| Firehouse Subs | 826 | 6% | 5% | 4% | 3% | 2% | |
| Five Guys | 31 | 29% | 23% | 13% | 3% | 3% | |
| Frisch’s Big Boy | 121 | 59% | 47% | 30% | 18% | 7% | |
| Hardee’s | 114 | 83% | 71% | 54% | 29% | 8% | |
| In-N-Out Burger | 46 | 11% | 7% | 4% | 0% | 0% | |
| Jack in the Box | 100 | 81% | 64% | 31% | 16% | 4% | |
| Jamba Juice | 187 | 7% | 1% | 0% | 0% | 0% | |
| Jason’s Deli | 344 | 43% | 33% | 24% | 13% | 4% | |
| Jersey Mike’s Subs | 811 | 68% | 59% | 45% | 35% | 13% | |
| Jimmy John’s | 46 | 67% | 57% | 48% | 22% | 2% | |
| KFC | 185 | 18% | 10% | 6% | 3% | 1% | |
| Krispy Kreme | 211 | 1% | 0% | 0% | 0% | 0% | |
| Krystal | 72 | 43% | 21% | 10% | 6% | 1% | |
| Little Caesars | 72 | 63% | 39% | 28% | 19% | 13% | |
| Long John Silver’s | 86 | 23% | 9% | 5% | 0% | 0% | |
| Marco’s Pizza | 248 | 25% | 13% | 7% | 5% | 3% | |
| McAlister’s Deli | 185 | 71% | 57% | 35% | 24% | 5% | |
| McDonald’s | 226 | 32% | 26% | 15% | 6% | 0% | |
| Moe’s Southwest Grill | 125 | 17% | 10% | 5% | 4% | 2% | |
| Noodles and Company | 80 | 76% | 61% | 38% | 26% | 4% | |
| Panda Express | 104 | 27% | 11% | 1% | 0% | 0% | |
| Panera Bread | 269 | 38% | 28% | 14% | 7% | 0% | |
| Papa John’s | 804 | 51% | 20% | 2% | 2% | 1% | |
| Papa Murphy’s | 111 | 77% | 42% | 8% | 1% | 0% | |
| Pizza Hut | 157 | 47% | 10% | 2% | 1% | 0% | |
| Popeyes | 79 | 53% | 38% | 29% | 24% | 3% | |
| Qdoba | 63 | 32% | 10% | 3% | 0% | 0% | |
| Quiznos | 117 | 79% | 75% | 48% | 36% | 21% | |
| Round Table Pizza | 257 | 75% | 25% | 4% | 2% | 0% | |
| Sbarro | 61 | 89% | 80% | 67% | 51% | 13% | |
| Sonic | 425 | 24% | 16% | 8% | 5% | 1% | |
| Starbucks | 371 | 9% | 5% | 2% | 0% | 0% | |
| Steak N’ Shake | 445 | 25% | 22% | 14% | 9% | 3% | |
| Subway | 121 | 56% | 46% | 26% | 11% | 3% | |
| Taco Bell | 174 | 44% | 31% | 16% | 2% | 0% | |
| Tim Hortons | 158 | 27% | 19% | 7% | 1% | 1% | |
| Wendy’s | 111 | 38% | 23% | 13% | 5% | 0% | |
| Whataburger | 218 | 60% | 47% | 33% | 24% | 5% | |
| White Castle | 191 | 31% | 14% | 2% | 1% | 0% | |
| Wingstop | 49 | 65% | 45% | 14% | 4% | 0% | |
| Zaxby’s | 255 | 52% | 42% | 35% | 27% | 19% | |
| Total # Items | Average% of Menu Items Labeled at Different Thresholds | ||||||
| 20% DV | 33% DV | 50% DV | 65% DV | 100% DV | |||
| All full-service restaurants | 6542 | 57% | 46% | 33% | 24% | 11% | |
| All limited-service restaurants | 12,496 | 42% | 29% | 17% | 10% | 3% | |
| All restaurants | 19,038 | 47% | 34% | 22% | 14% | 5% | |
Table A3.
Percentage of menu items by food category that would require a sodium warning label when the label applies to items with >100% of the Daily Value for sodium.
Table A3.
Percentage of menu items by food category that would require a sodium warning label when the label applies to items with >100% of the Daily Value for sodium.
| Restaurant Category | Restaurant Chain | % of Menu Items Labeled at the 100% DV Threshold * | |||||||||||||||
|---|---|---|---|---|---|---|---|---|---|---|---|---|---|---|---|---|---|
| Total # Items | Appetizers and Sides | Baked Goods | Beverages | Burgers | Desserts | Entrées | Fried Potatoes | Pizza | Salads | Sandwiches | Soup | Toppings and Ingredients | Kids’ combo Meals | Combo Meals | Total | ||
| Full service | Applebee’s | 258 | 32% | 0% * | 0% | 25% * | 0% | 46% | 0% * | 0% * | 19% * | 54% | 0% | 0% | 14% | ||
| BJ’s Restaurant and Brewhouse | 430 | 3% | 0% * | 0% | 73% | 0% | 21% | 0% | 0% | 35% | 37% | 50% | 3% | 0% * | 11% | ||
| Bob Evans | 231 | 0% | 0% * | 0% | 0% * | 0% | 25% | 0% * | 16% | 63% | 0% | 0% | 0% | 38% | 13% | ||
| Bonefish Grill | 94 | 0% | 0% | 25% * | 0% | 6% | 0% * | 17% | 14% | 0% * | 0% | 0% * | 5% | ||||
| California Pizza Kitchen | 265 | 0% | 0% | 0% | 6% | 0% | 0% | 17% | 0% | 0% | 0% * | 2% | |||||
| Carrabba’s Italian Grill | 202 | 10% | 0% | 0% | 24% | 0% * | 0% | 0% | 33% | 0% | 0% * | 10% | |||||
| Chili’s | 279 | 0% | 0% * | 1% | 17% | 0% * | 46% | 0% * | 0% | 15% | 54% | 0% | 0% | 12% | |||
| Denny’s | 219 | 10% | 0% | 0% | 0% | 0% | 14% | 0% | 0% * | 27% | 100% * | 0% | 7% | ||||
| Famous Dave’s | 222 | 29% | 0% * | 0% | 12% | 0% | 24% | 0% * | 0% | 9% | 0% | 0% | 15% | ||||
| Friendly’s | 228 | 0% | 0% | 30% | 0% | 11% | 25% * | 0% * | 11% | 0% * | 0% * | 0% | 9% | ||||
| Golden Corral | 720 | 0% | 0% | 0% | 0% * | 0% | 0% | 0% | 0% | 0% | 0% | 0% | 0% | 0% | |||
| Hooters | 108 | 26% | 0% * | 67% | 0% * | 36% | 40% | 25% | 45% | 0% * | 0% | 31% | |||||
| IHOP | 327 | 3% | 0% | 0% | 0% * | 0% * | 16% | 0% * | 50% | 29% | 0% * | 0% | 0% | 8% | |||
| Joe’s Crab Shack | 191 | 29% | 0% * | 0% | 0% | 32% | 0% * | 0% * | 0% * | 55% | 0% * | 0% | 0% * | 14% | |||
| LongHorn Steakhouse | 182 | 7% | 0% * | 0% | 0% | 0% | 3% | 0% * | 0% | 0% | 0% | 0% | 1% | ||||
| O’Charley’s | 158 | 7% | 0% * | 20% | 0% | 36% | 0% * | 0% | 75% | 40% | 0% | 0% * | 24% | ||||
| Olive Garden | 186 | 6% | 0% * | 0% | 0% | 11% | 0% * | 0% * | 0% * | 0% | 0% * | 0% | 0% * | 3% | |||
| On the Border | 167 | 30% | 0% | 0% | 23% | 0% * | 0% | 40% | 0% * | 0% | 0% | 17% | |||||
| Outback Steakhouse | 95 | 0% | 0% | 0% | 7% | 0% * | 0% | 11% | 33% * | 0% * | 0% * | 5% | |||||
| Perkins | 411 | 10% | 0% | 0% | 0% | 0% | 15% | 0% | 0% | 36% | 0% | 0% | 0% * | 5% | |||
| PF Chang’s | 160 | 5% | 0% | 0% | 24% | 0% * | 57% | 0% * | 17% | ||||||||
| Red Lobster | 250 | 13% | 0% * | 0% | 0% | 17% | 0% * | 0% * | 0% | 0% | 0% * | 0% | 8% | ||||
| Red Robin | 400 | 34% | 0% | 0% | 3% | 0% | 16% | 25% | 0% * | 0% | 17% | 0% | 0% | 6% | |||
| Romano’s Macaroni Grill | 95 | 0% | 0% * | 0% | 0% | 31% | 0% * | 0% * | 5% | 0% * | 0% * | 0% * | 15% | ||||
| Ruby Tuesday | 101 | 0% | 13% | 0% | 27% | 0% * | 0% * | 0% * | 0% * | 0% * | 0% | 33% * | 50% * | 15% | |||
| TGI Friday’s | 214 | 21% | 0% | 76% | 0% | 48% | 0% * | 0% * | 8% | 57% | 0% * | 0% | 17% | ||||
| The Capital Grille | 93 | 0% | 0% | 0% * | 0% | 8% | 0% * | 0% | 0% * | 17% | 3% | ||||||
| Yard House | 256 | 12% | 0% * | 0% | 0% | 0% | 31% | 0% * | 50% | 3% | 9% | 0% | 0% | 9% | |||
| Limited service | Arby’s | 82 | 0% | 0% * | 0% | 0% * | 0% * | 0% * | 0% | 0% * | 19% | 0% | 6% | ||||
| Auntie Anne’s | 153 | 0% | 0% | 0% * | 0% | 0% | 0% | ||||||||||
| Baskin Robbins | 257 | 0% | 0% | 0% * | 0% | ||||||||||||
| Bojangles | 86 | 0% | 0% * | 0% | 0% * | 20% | 0% * | 0% * | 8% | 0% | 0% * | 3% | |||||
| Boston Market | 73 | 0% | 0% * | 0% | 0% | 0% * | 0% | 0% | 0% | 0% | |||||||
| Burger King | 180 | 0% | 0% * | 0% | 0% | 0% | 13% | 0% | 0% | 3% | 0% | 0% * | 1% | ||||
| Captain D’s | 85 | 0% | 0% * | 0% | 0% * | 0% | 0% * | 0% | 0% * | 0% | 0% | ||||||
| Carl’s Jr. | 174 | 0% | 0% * | 0% | 0% | 0% | 0% | 0% | 0% | 8% | 0% | 1% | |||||
| Casey’s General Store | 183 | 0% * | 0% | 0% | 0% * | 0% | 0% * | 0% * | 0% | 0% * | 0% | 0% | 0% | ||||
| Checker’s Drive-In/Rallys | 79 | 0% | 0% | 0% | 0% | 0% * | 0% | 0% | 0% | ||||||||
| Chick-Fil-A | 127 | 0% | 0% * | 0% | 0% * | 5% | 0% | 0% | 0% | 0% * | 0% | 1% | |||||
| Chipotle | 69 | 0% | 0% * | 0% | 0% | ||||||||||||
| Chuck E. Cheese | 193 | 0% | 0% | 0% | 0% * | 0% * | 0% | 0% * | 0% | 0% * | 0% | ||||||
| Church’s Chicken | 141 | 8% | 0% * | 0% | 0% * | 0% * | 6% | 0% * | 0% | 0% | 2% | ||||||
| Ci Ci’s Pizza | 37 | 0% * | 0% * | 0% * | 0% * | 0% | 0% * | 0% | |||||||||
| Culver’s | 291 | 8% | 0% * | 0% | 0% | 0% | 14% | 0% * | 0% | 0% | 0% * | 0% | 1% | ||||
| Dairy Queen | 326 | 0% | 0% * | 0% | 0% | 0% | 39% | 0% | 0% * | 0% | 0% * | 2% | |||||
| Del Taco | 167 | 0% * | 0% * | 0% | 0% * | 0% * | 20% | 0% | 0% * | 4% | 3% | ||||||
| Dominos | 381 | 0% | 0% | 0% * | 0% | 0% | 0% * | 0% | 0% | 0% | |||||||
| Dunkin’ Donuts | 482 | 0% | 0% | 0% * | 0% * | 0% * | 0% | 0% | 0% | ||||||||
| Einstein Bros | 145 | 0% | 0% | 0% | 0% * | 0% * | 0% * | 0% * | 2% | 0% | 0% | 1% | |||||
| El Pollo Loco | 129 | 4% | 0% * | 0% | 9% | 0% | 13% | 0% * | 0% | 4% | |||||||
| Firehouse Subs | 826 | 0% | 0% | 0% | 0% | 39% | 0% * | 0% | 2% | ||||||||
| Five Guys | 31 | 0% * | 50% * | 0% * | 0% * | 0% | 3% | ||||||||||
| Frisch’s Big Boy | 121 | 5% | 0% | 0% | 0% | 0% | 11% | 0% * | 0% * | 14% | 33% | 0% | 0% | 7% | |||
| Hardee’s | 114 | 0% | 0% * | 0% * | 30% | 0% | 6% | 0% | 0% * | 3% | 0% | 8% | |||||
| In-N-Out Burger | 46 | 0% | 0% | 0% * | 0% | ||||||||||||
| Jack in the Box | 100 | 0% | 0% * | 0% * | 6% | 0% * | 25% | 0% | 0% | 3% | 0% | 4% | |||||
| Jamba Juice | 187 | 0% * | 0% * | 0% | 0% | 0% * | 0% * | 0% | 0% | ||||||||
| Jason’s Deli | 344 | 0% | 0% | 0% | 0% * | 0% | 14% | 0% * | 0% | 14% | 0% | 1% | 4% | ||||
| Jersey Mike’s Subs | 811 | 0% | 0% | 0% | 0% * | 12% | 27% | 1% | 0% | 13% | |||||||
| Jimmy John’s | 46 | 0% | 0% | 0% * | 3% | 0% * | 2% | ||||||||||
| KFC | 185 | 0% | 0% * | 0% | 0% | 4% | 0% * | 0% * | 0% | 0% | 1% | ||||||
| Krispy Kreme | 211 | 0% | 0% | 0% | 0% | ||||||||||||
| Krystal | 72 | 0% * | 0% | 0% | 0% | 0% | 0% | 0% | 100% * | 1% | |||||||
| Little Caesars | 72 | 25% | 17% | 0% * | 32% | 0% * | 0% | 13% | |||||||||
| Long John Silver’s | 86 | 0% | 0% * | 0% | 0% * | 0% | 0% * | 0% * | 0% * | 0% | 0% | ||||||
| Marco’s Pizza | 248 | 0% | 0% * | 0% | 0% | 0% | 39% | 0% | 3% | ||||||||
| McAlister’s Deli | 185 | 0% | 0% | 0% | 0% | 0% | 13% | 0% | 0% * | 0% * | 5% | ||||||
| McDonald’s | 226 | 0% * | 0% | 0% | 0% | 0% | 0% | 0% | 0% | 0% | 0% | ||||||
| Moe’s Southwest Grill | 125 | 0% | 0% * | 50% * | 1% | 2% | |||||||||||
| Noodles and Company | 80 | 0% * | 0% * | 0% * | 5% | 0% | 9% | 0% | 4% | ||||||||
| Panda Express | 104 | 0% | 0% | 0% * | 0% | 0% * | 0% | 0% | |||||||||
| Panera Bread | 269 | 0% | 0% | 0% | 0% | 0% | 0% | 2% | 0% | 0% | 0% | ||||||
| Papa John’s | 804 | 6% | 0% | 0% | 0% * | 0% | 0% * | 40% | 0% | 1% | |||||||
| Papa Murphy’s | 111 | 0% * | 0% * | 0% | 0% | 0% | 0% | ||||||||||
| Pizza Hut | 157 | 0% | 0% * | 0% * | 0% * | 0% * | 0% * | 0% | 0% | 0% | |||||||
| Popeyes | 79 | 0% | 0% * | 0% | 0% * | 6% | 0% * | 0% | 11% | 3% | |||||||
| Qdoba | 63 | 0% * | 0% * | 0% | 0% * | 0% | 0% | ||||||||||
| Quiznos | 117 | 0% * | 0% * | 0% * | 32% | 0% | 0% | 21% | |||||||||
| Round Table Pizza | 257 | 0% | 0% * | 0% * | 0% | 0% * | 17% | 0% * | 0% | ||||||||
| Sbarro | 61 | 11% | 32% | 0% | 0% | 13% | |||||||||||
| Sonic | 425 | 0% | 0% * | 0% | 0% | 0% | 17% | 9% | 0% | 0% | 1% | ||||||
| Starbucks | 371 | 0% * | 0% | 0% | 0% | 0% | 0% | 0% | 0% * | 0% | |||||||
| Steak N’ Shake | 445 | 0% | 0% | 0% | 3% | 0% * | 38% | 17% | 0% | 0% | 20% | 0% | 0% | 3% | |||
| Subway | 121 | 0% * | 0% | 0% * | 0% | 7% | 0% | 0% | 3% | ||||||||
| Taco Bell | 174 | 0% | 0% | 0% | 0% | 0% * | 0% * | 0% * | 0% | 0% | 0% | ||||||
| Tim Hortons | 158 | 0% * | 0% | 0% | 0% | 0% | 0% * | 4% | 0% | 0% | 1% | ||||||
| Wendy’s | 111 | 0% | 0% * | 0% | 0% | 0% * | 0% | 0% | 0% | 0% | 0% * | 0% | |||||
| Whataburger | 218 | 0% * | 0% * | 0% | 4% | 0% | 25% | 0% * | 0% | 4% | 0% | 0% | 13% | 5% | |||
| White Castle | 191 | 0% | 0% | 0% | 0% | 0% * | 0% * | 0% | 0% | 0% | |||||||
| Wingstop | 49 | 0% | 0% * | 0% * | 0% | 0% * | 0% * | 0% | |||||||||
| Zaxby’s | 255 | 20% | 0% * | 0% | 0% * | 67% | 0% * | 8% | 57% | 4% | 0% * | 19% | |||||
| Average % of Menu Items Labeled at the 100% DV Threshold | |||||||||||||||||
| Total # Items | Appetizers and Sides | Baked Goods | Beverages | Burgers | Desserts | Entrées | Fried Potatoes | Pizza | Salads | Sandwiches | Soup | Toppings and Ingredients | Kids’ combo meals | Combo meals | Total | ||
| All full-service restaurants | 6542 | 10% | 0% | 0% | 18% | 0% | 22% | 4% | 4% | 7% | 24% | 12% | 0% | 2% | 44% | 11% | |
| All limited-service restaurants | 12,496 | 2% | 0% | 0% | 4% | 0% | 8% | 1% | 2% | 1% | 8% | 9% | 0% | 0% | 13% | 3% | |
| All restaurants | 19,038 | 5% | 0% | 0% | 11% | 0% | 13% | 2% | 3% | 3% | 13% | 11% | 0% | 1% | 34% | 5% | |
Note: Blank cells indicate there were no menu items within the food category for a particular restaurant. * Indicates the total number of items in a food category was less than 5.
References
- National Academies of Sciences Engineering and Medicine Committee to Review the Dietary Reference Intakes for Sodium and Potassium. Dietary Reference Intakes for Sodium and Potassium; Stallings, V.A., Quirk, M., Oria, M., Eds.; The National Academies Press: Washington, DC, USA, 2019; ISBN 978-0-309-48834-1. [Google Scholar]
- Tsao, C.W.; Aday, A.W.; Almarzooq, Z.I.; Anderson, C.A.M.; Arora, P.; Avery, C.L.; Baker-Smith, C.M.; Beaton, A.Z.; Boehme, A.K.; Buxton, A.E.; et al. Heart Disease and Stroke Statistics—2023 Update: A Report From the American Heart Association. Circulation 2023, 143, E254–E743. [Google Scholar] [CrossRef] [PubMed]
- Sodium in Your Diet: Use the Nutrition Facts Label and Reduce Your Intake. Available online: https://www.fda.gov/food/nutrition-education-resources-materials/sodium-your-diet (accessed on 23 April 2024).
- U.S. Department of Agriculture, Agricultural Research Service. Nutrient Intakes from Food and Beverages: Mean Amounts Consumed per Individual, by Gender and Age, What We Eat in America, NHANES 2017-March 2020 Prepandemic. WWEIA Data Tables. Updated 3 August 2022. Available online: https://www.ars.usda.gov/ARSUserFiles/80400530/pdf/1720/Table_1_NIN_GEN_1720.pdf (accessed on 22 April 2024).
- Dehmer, S.P.; Cogswell, M.E.; Ritchey, M.D.; Hong, Y.; Maciosek, M.V.; LaFrance, A.B.; Roy, K. Health and Budgetary Impact of Achieving 10-Year U.S. Sodium Reduction Targets. Am. J. Prev. Med. 2020, 59, 211–218. [Google Scholar] [CrossRef] [PubMed]
- Harnack, L.J.; Cogswell, M.E.; Shikany, J.M.; Gardner, C.D.; Gillespie, C.; Loria, C.M.; Zhou, X.; Yuan, K.; Steffen, L.M. Sources of Sodium in US Adults From 3 Geographic Regions. Circulation 2017, 135, 1775–1783. [Google Scholar] [CrossRef] [PubMed]
- U.S. Department of Agriculture, Agricultural Research Service. All Restaurants: Percent Reporting, Mean Amounts, and Percent of Selected Nutrients from Foods Obtained from All Restaurants, by Gender and Age, What We Eat in America, NHANES 2017-March 2020 Prepandemic. WWEIA Data Tables. Updated August 3, 2022. Available online: https://www.ars.usda.gov/ARSUserFiles/80400530/pdf/1720/Table_53_RST_GEN_1720.pdf (accessed on 23 April 2024).
- Moran, A.J.; Ramirez, M.; Block, J.P. Consumer underestimation of sodium in fast food restaurant meals: Results from a cross-sectional observational study. Appetite 2017, 113, 155–161. [Google Scholar] [CrossRef] [PubMed]
- NYC Health. New Sodium (Salt) Warning Rule: What Food Service Establishments Need to Know. Available online: https://www.nyc.gov/assets/doh/downloads/pdf/cardio/sodium-warning-rule.pdf (accessed on 23 April 2024).
- Sodium Warning Label. Available online: https://foodfitphilly.org/sodiumwarning/ (accessed on 23 April 2024).
- High Sodium Warning Label: Why It Matters. Available online: https://www1.nyc.gov/assets/doh/downloads/pdf/cardio/high-sodium-warning-label.pdf (accessed on 23 April 2024).
- MenuStat Restaurant Data Availability. Available online: https://www.menustat.org/uploads/1/4/1/6/141624194/menustat_restaurant_data_availability.pdf (accessed on 23 April 2024).
- U.S. Census Bureau. North American Industry Classification System. Available online: https://www.census.gov/naics/?input=722511&year=2022&details=722511 (accessed on 23 April 2024).
- U.S. Census Bureau. North American Industry Classification System. Available online: https://www.census.gov/naics/?input=722513&year=2022&details=722513 (accessed on 23 April 2024).
- Dunn, C.G.; Vercammen, K.A.; Frelier, J.M.; Moran, A.J.; Bleich, S.N. Nutrition composition of children’s meals in twenty-six large US chain restaurants. Public Health Nutr. 2020, 23, 2245–2252. [Google Scholar] [CrossRef] [PubMed]
- Schoffman, D.E.; Davidson, C.R.; Hales, S.B.; Crimarco, A.E.; Dahl, A.A.; Turner-McGrievy, G.M. The Fast-Casual Conundrum: Fast-Casual Restaurant Entrées Are Higher in Calories than Fast Food. J. Acad. Nutr. Diet. 2016, 116, 1606–1612. [Google Scholar] [CrossRef]
- Hua, S.V.; Soto, M.J.; Dunn, C.G.; Bleich, S.N.; Vercammen, K.A. Prevalence and nutrient composition of menu offerings targeted to customers with dietary restrictions at US fast casual and full-service restaurants. Public Health Nutr. 2021, 24, 1240–1247. [Google Scholar] [CrossRef] [PubMed]
- Bleich, S.N.; Soto, M.J.; Dunn, C.G.; Moran, A.J.; Block, J.P. Calorie and nutrient trends in large U.S. chain restaurants, 2012–2018. PLoS ONE 2020, 15, e0228891. [Google Scholar] [CrossRef] [PubMed]
- MenuStat Methods. Available online: https://www.menustat.org/uploads/1/4/1/6/141624194/menustat_data_completeness_documentation.pdf (accessed on 23 April 2024).
- Institute of Medicine. Dietary Reference Intakes: The Essential Guide to Nutrient Requirements; Otten, J.J., Hellwig, J.P., Meyers, L.D., Eds.; The National Academies Press: Washington, DC, USA, 2006; p. 11. [Google Scholar]
- Zeballos, E.; Todd, J.E.; Restrepo, B. Frequency and Time of Day That Americans Eat: A Comparison of Data from the American Time Use Survey and the National Health and Nutrition Examination Survey. U.S. Department of Agriculture, Economic Research Service. Technical Bulletin Number 1954. 2019. Available online: https://www.ers.usda.gov/webdocs/publications/93514/tb-1954.pdf?v=7114 (accessed on 23 April 2024).
- Prasad, D.; Jasek, J.P.; Anekwe, A.V.; Dominianni, C.; Mezzacca, T.A.; Sisti, J.S.; Farley, S.M.; Kessler, K. Changes in Consumer Purchasing Patterns at New York City Chain Restaurants following Adoption of the Sodium Warning Icon Rule, 2015–2017. PLoS ONE 2023, 18, e0274044. [Google Scholar] [CrossRef] [PubMed]
- Sisti, J.S.; Prasad, D.; Niederman, S.; Mezzacca, T.A.; Anekwe, A.V.; Clapp, J.; Farley, S.M. Sodium Content of Menu Items in New York City Chain Restaurants following Enforcement of the Sodium Warning Icon Rule, 2015–2017. PLoS ONE 2023, 18, e0274648. [Google Scholar] [CrossRef]
- Correa, T.; Fierro, C.; Reyes, M.; Taillie, L.S.; Carpentier, F.R.D.; Corvalán, C. Why Don’t You [Government] Help Us Make Healthier Foods More Affordable Instead of Bombarding Us with Labels? Maternal Knowledge, Perceptions, and Practices after Full Implementation of the Chilean Food Labelling Law. Int. J. Environ. Res. Public Health 2022, 19, 4547. [Google Scholar] [CrossRef] [PubMed]
- Musicus, A.; Petimar, J.; Cleveland, L.; Hicks, M.; Passey, T.; Roberto, C.; Block, J. Testing the Effects of Sodium Warning Menu Labels on Sales in a Hospital Cafeteria. Obesity 2021, 29, 4–46. [Google Scholar] [CrossRef]
- Riis, N.L.; Bjoernsbo, K.S.; Toft, U.; Trolle, E.; Hyldig, G.; Hartley, I.E.; Keast, R.; Lassen, A.D. Impact of salt reduction interventions on salt taste sensitivity and liking, a cluster randomized controlled trial. Food Qual. Prefer. 2021, 87, 104059. [Google Scholar] [CrossRef]
- Rosa, A.; Pinna, I.; Piras, A.; Porcedda, S.; Masala, C. Flavoring of sea salt with Mediterranean aromatic plants affects salty taste perception. J. Sci. Food Agric. 2022, 102, 6005–6013. [Google Scholar] [CrossRef] [PubMed]
- Dunteman, A.N.; McKenzie, E.N.; Yang, Y.; Lee, Y.; Lee, S.Y. Compendium of sodium reduction strategies in foods: A scoping review. Compr. Rev. Food Sci. Food Saf. 2022, 21, 1300–1335. [Google Scholar] [CrossRef] [PubMed]
- Perez, C.L.; Moran, A.; Headrick, G.; McCarthy, J.; Cradock, A.L.; Pollack Porter, K.M. State and Local Healthy Kids’ Meal Laws in the United States: A Review and Content Analysis. J. Acad. Nutr. Diet. 2022, 122, 1864–1875.e19. [Google Scholar] [CrossRef] [PubMed]

Disclaimer/Publisher’s Note: The statements, opinions and data contained in all publications are solely those of the individual author(s) and contributor(s) and not of MDPI and/or the editor(s). MDPI and/or the editor(s) disclaim responsibility for any injury to people or property resulting from any ideas, methods, instructions or products referred to in the content. |
© 2024 by the authors. Licensee MDPI, Basel, Switzerland. This article is an open access article distributed under the terms and conditions of the Creative Commons Attribution (CC BY) license (https://creativecommons.org/licenses/by/4.0/).