
Microbiome and Metabolite Analysis Insight into the Potential of Shrimp Head Hydrolysate to Alleviate Depression-like Behaviour in Growth-Period Mice Exposed to Chronic Stress

 ,
,
Abstract

1. Introduction
2. Materials and Methods
2.1. Shrimp Head Hydrolysate Preparation
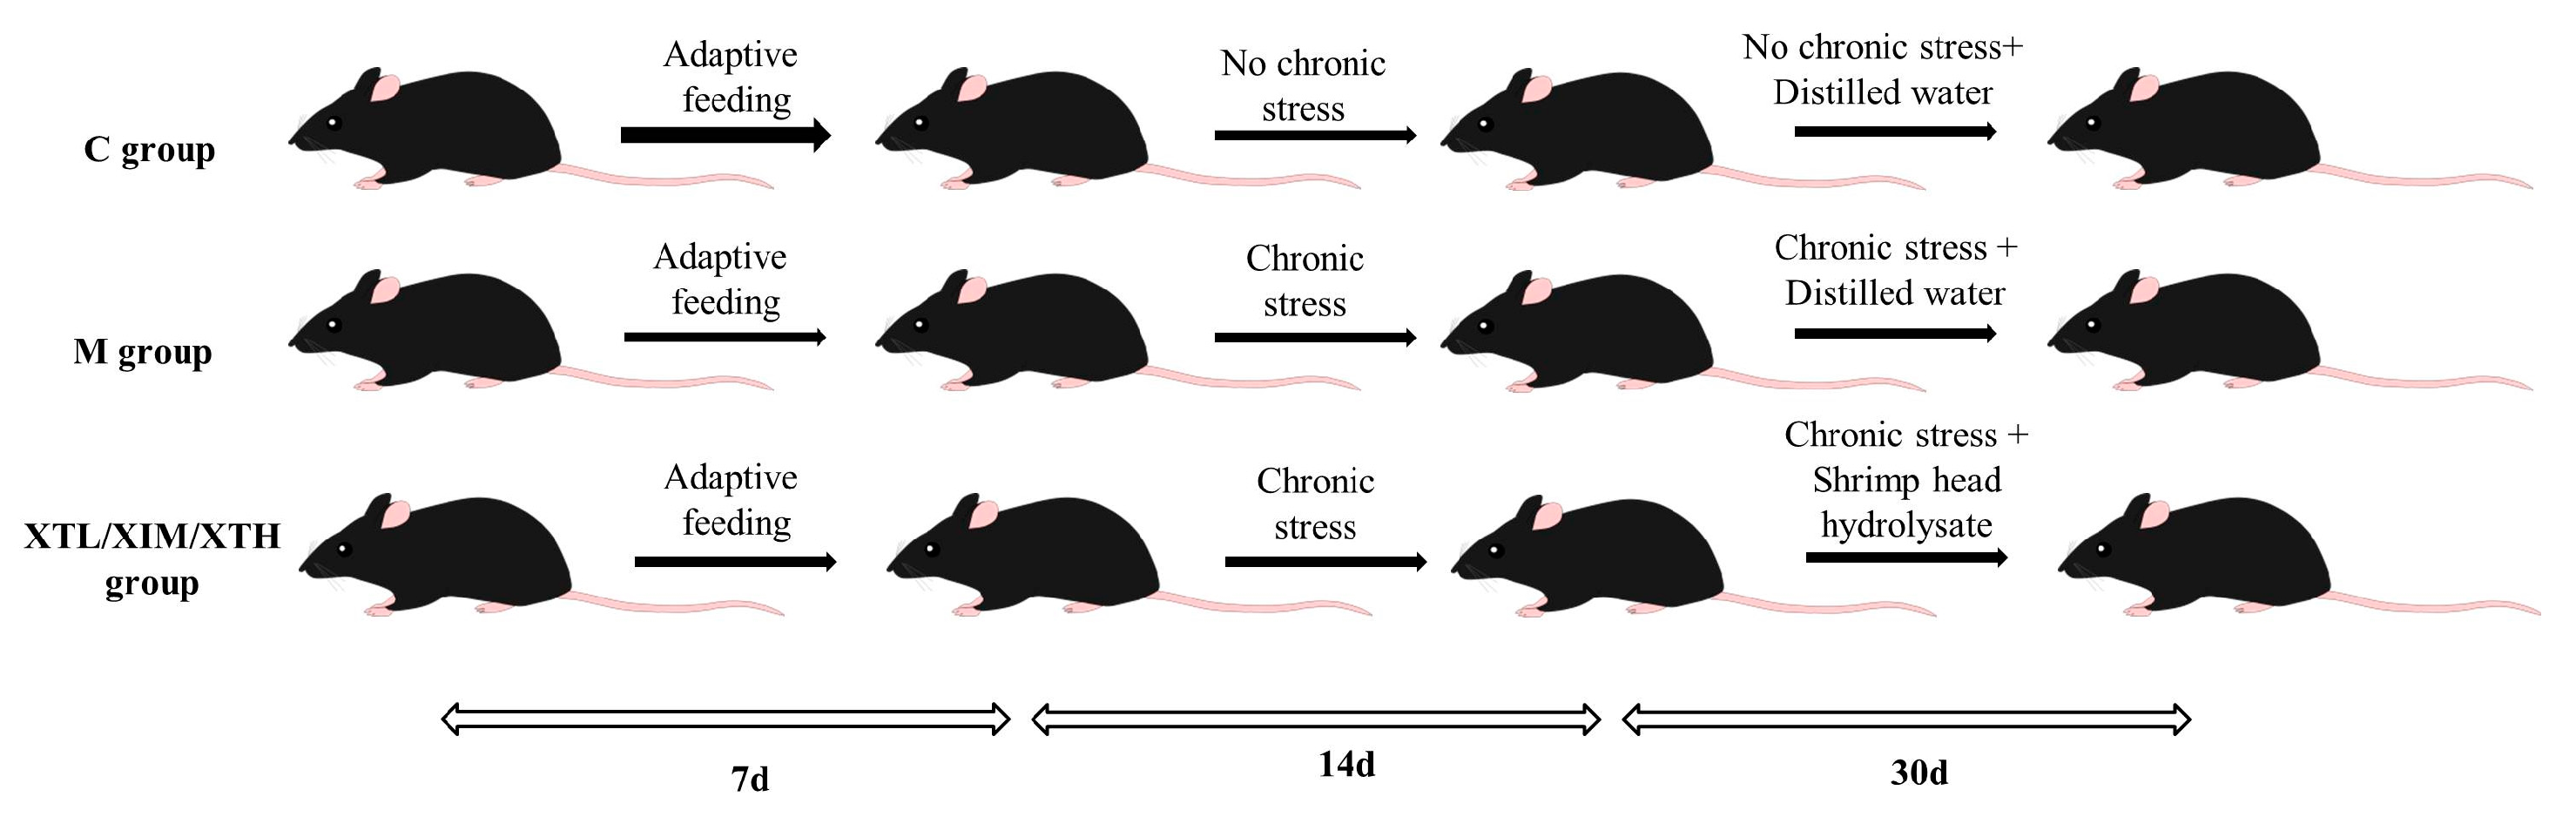
2.2. Animal Treatment
2.3. Samples Collection
2.4. Behavioural Tests
2.4.1. Sucrose Preference Test
2.4.2. Elevated Plus Maze Test
2.4.3. Open-Field Test
2.4.4. Tail Suspension Test
2.5. Gut Microbiota Measurements
2.6. Short-Chain Fatty Acid Measurements
2.7. Neurotransmitter Measurements
2.8. Statistical Analyses
2.8.1. Microbiome Sequence
2.8.2. Alpha and Beta Diversity
2.8.3. Others
3. Results
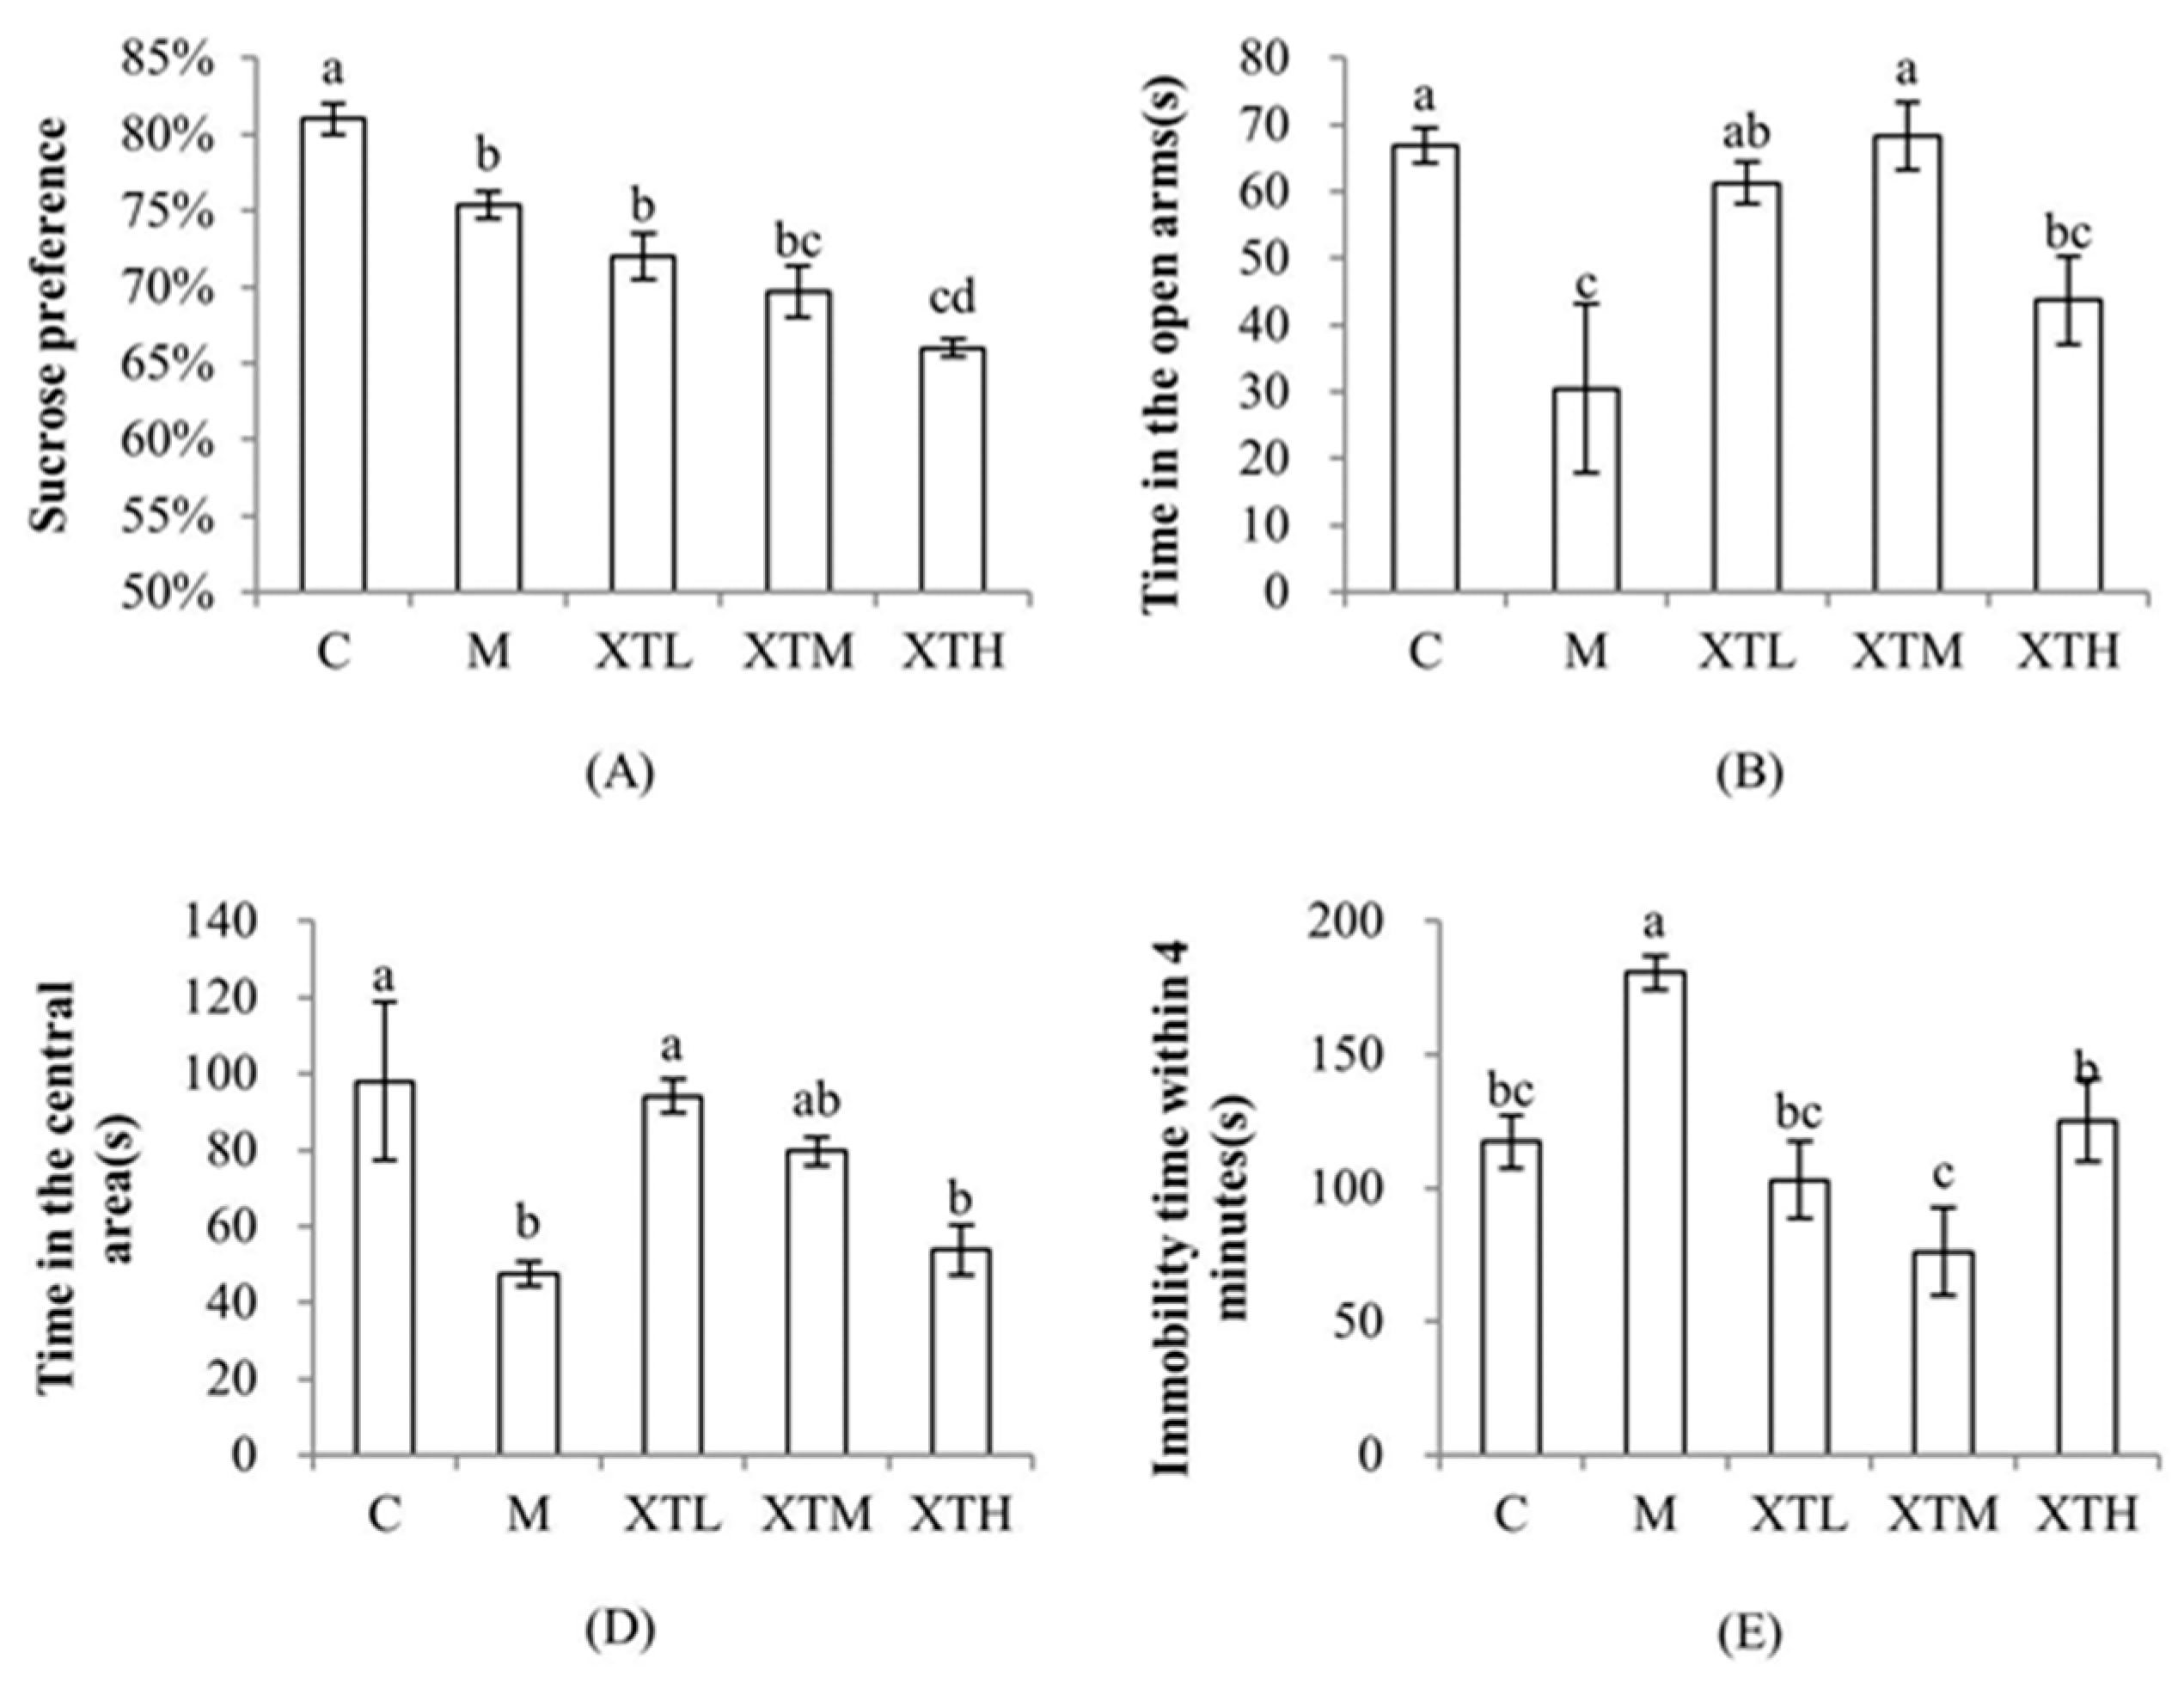
3.1. Regulation of SHH on Behavioural Indexes
3.2. Effect of SHH on Gut Microbiota
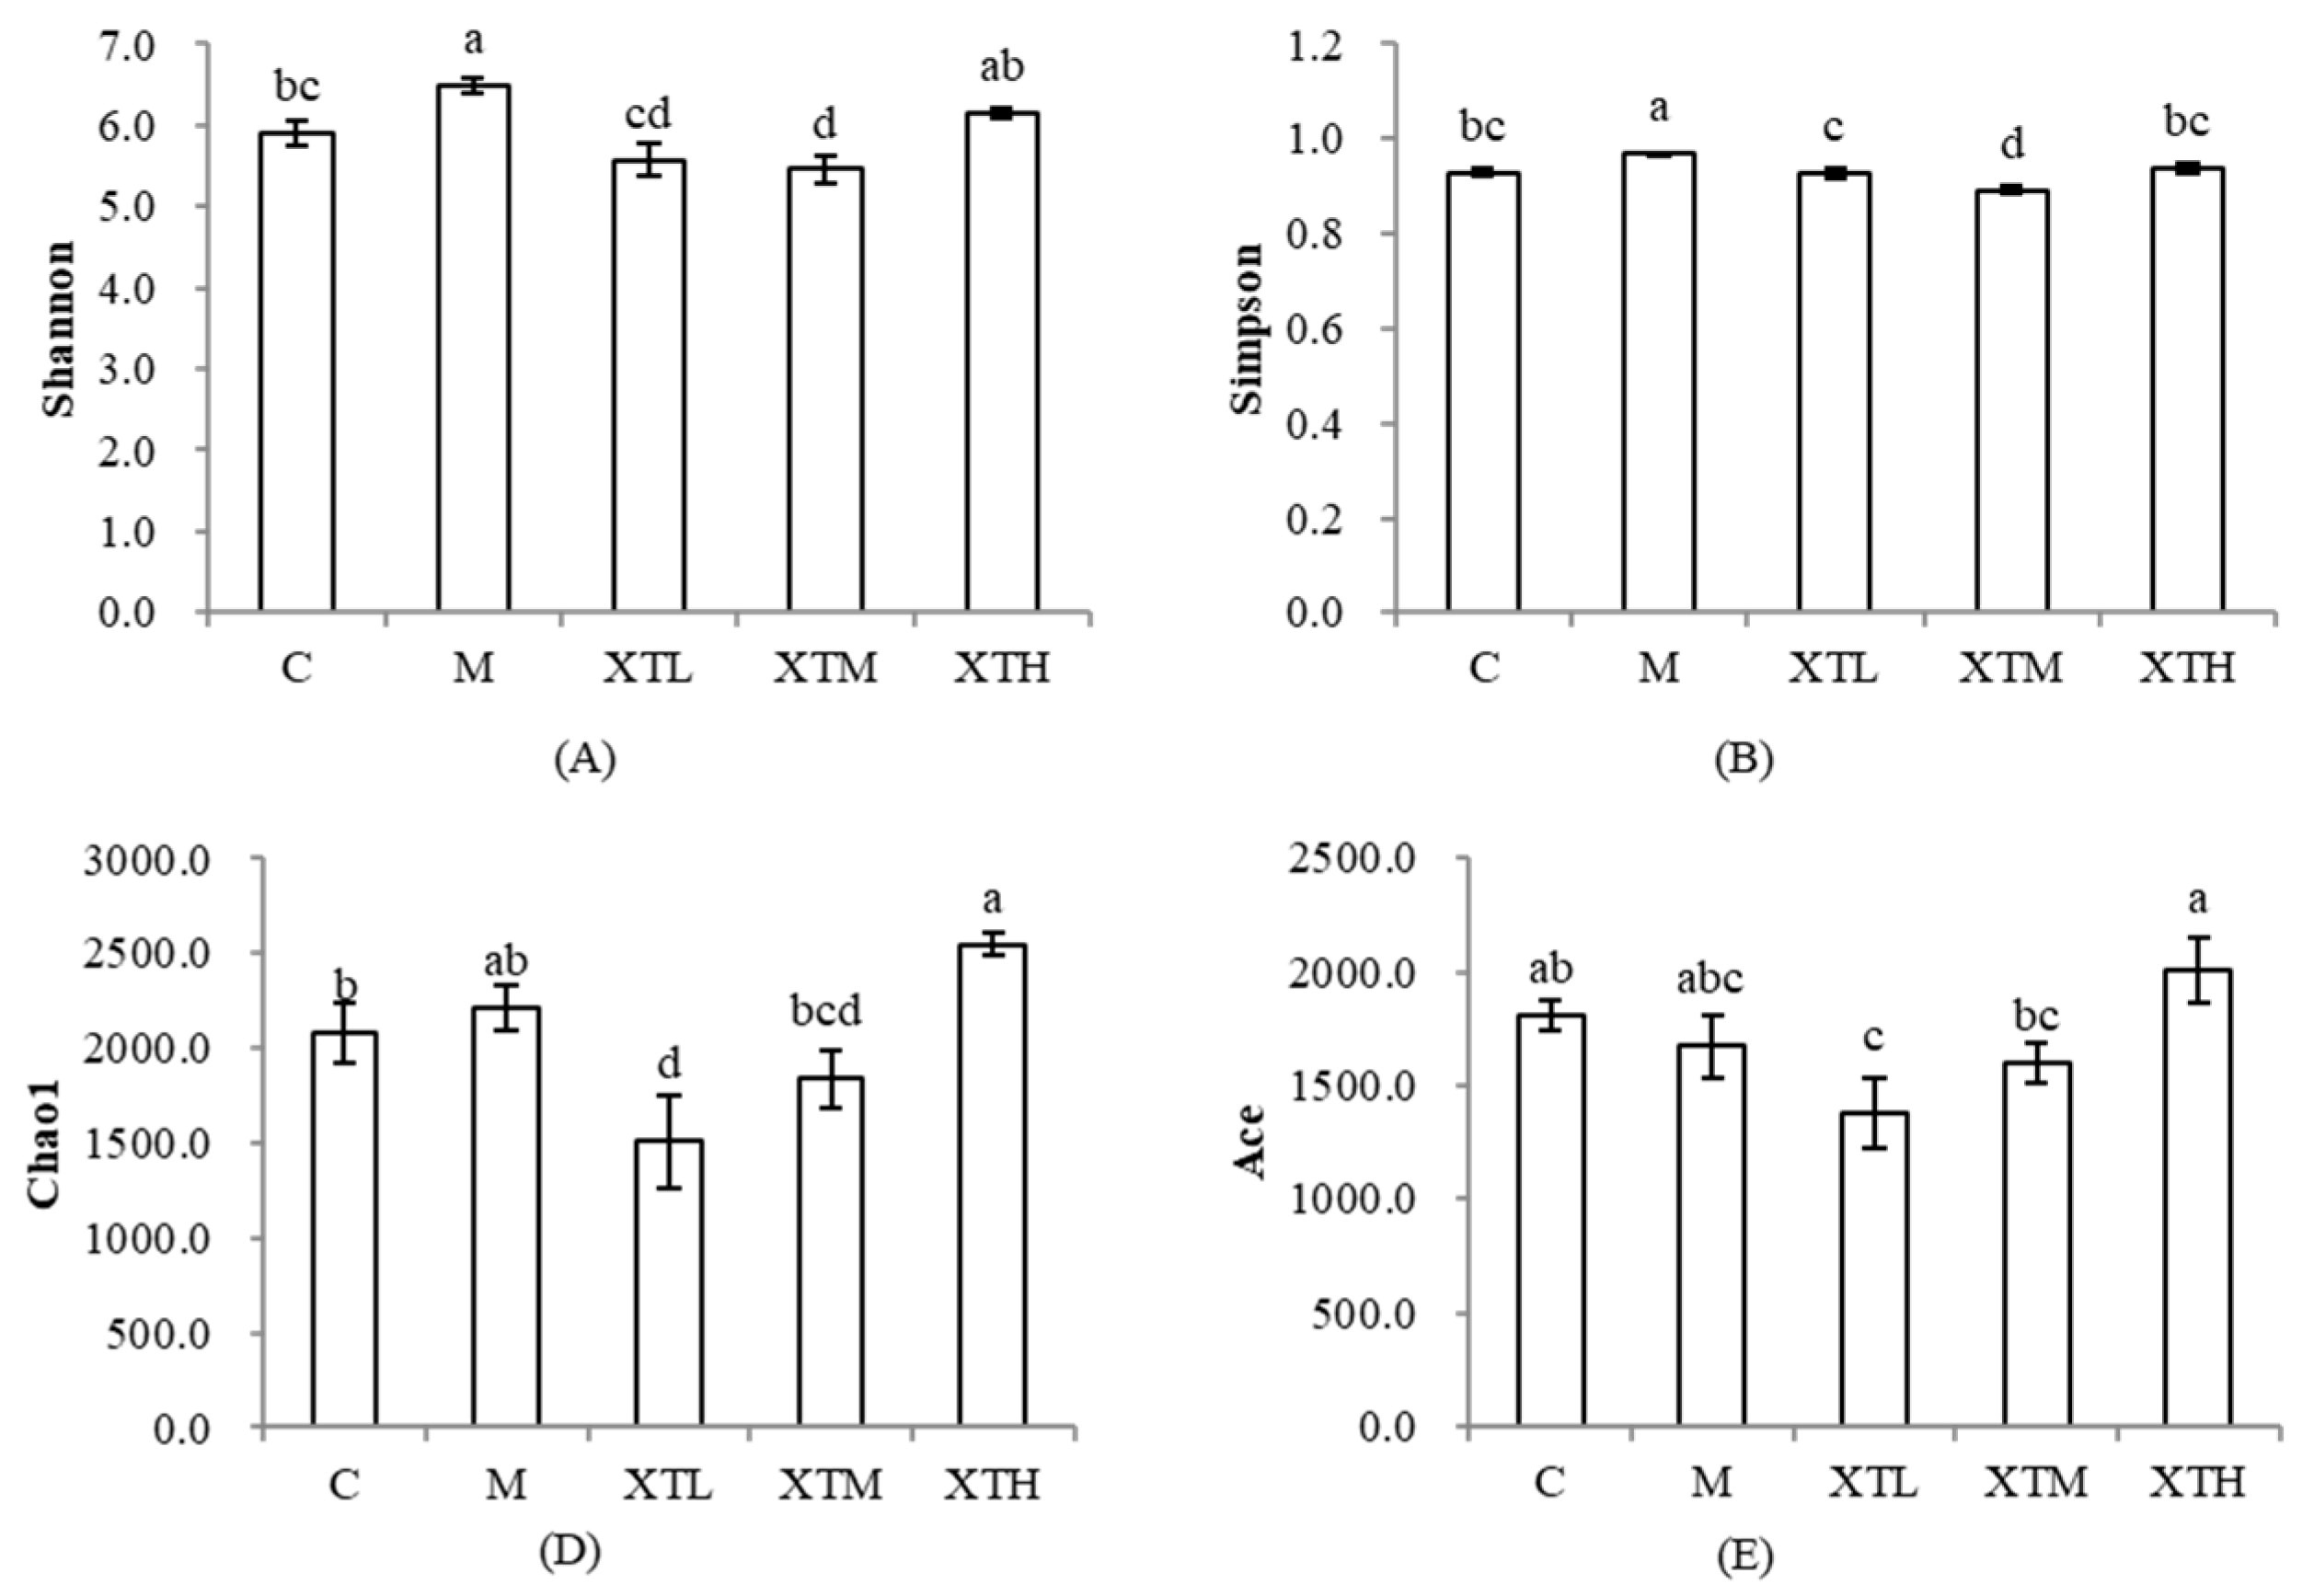
3.2.1. Regulation of α-Diversity
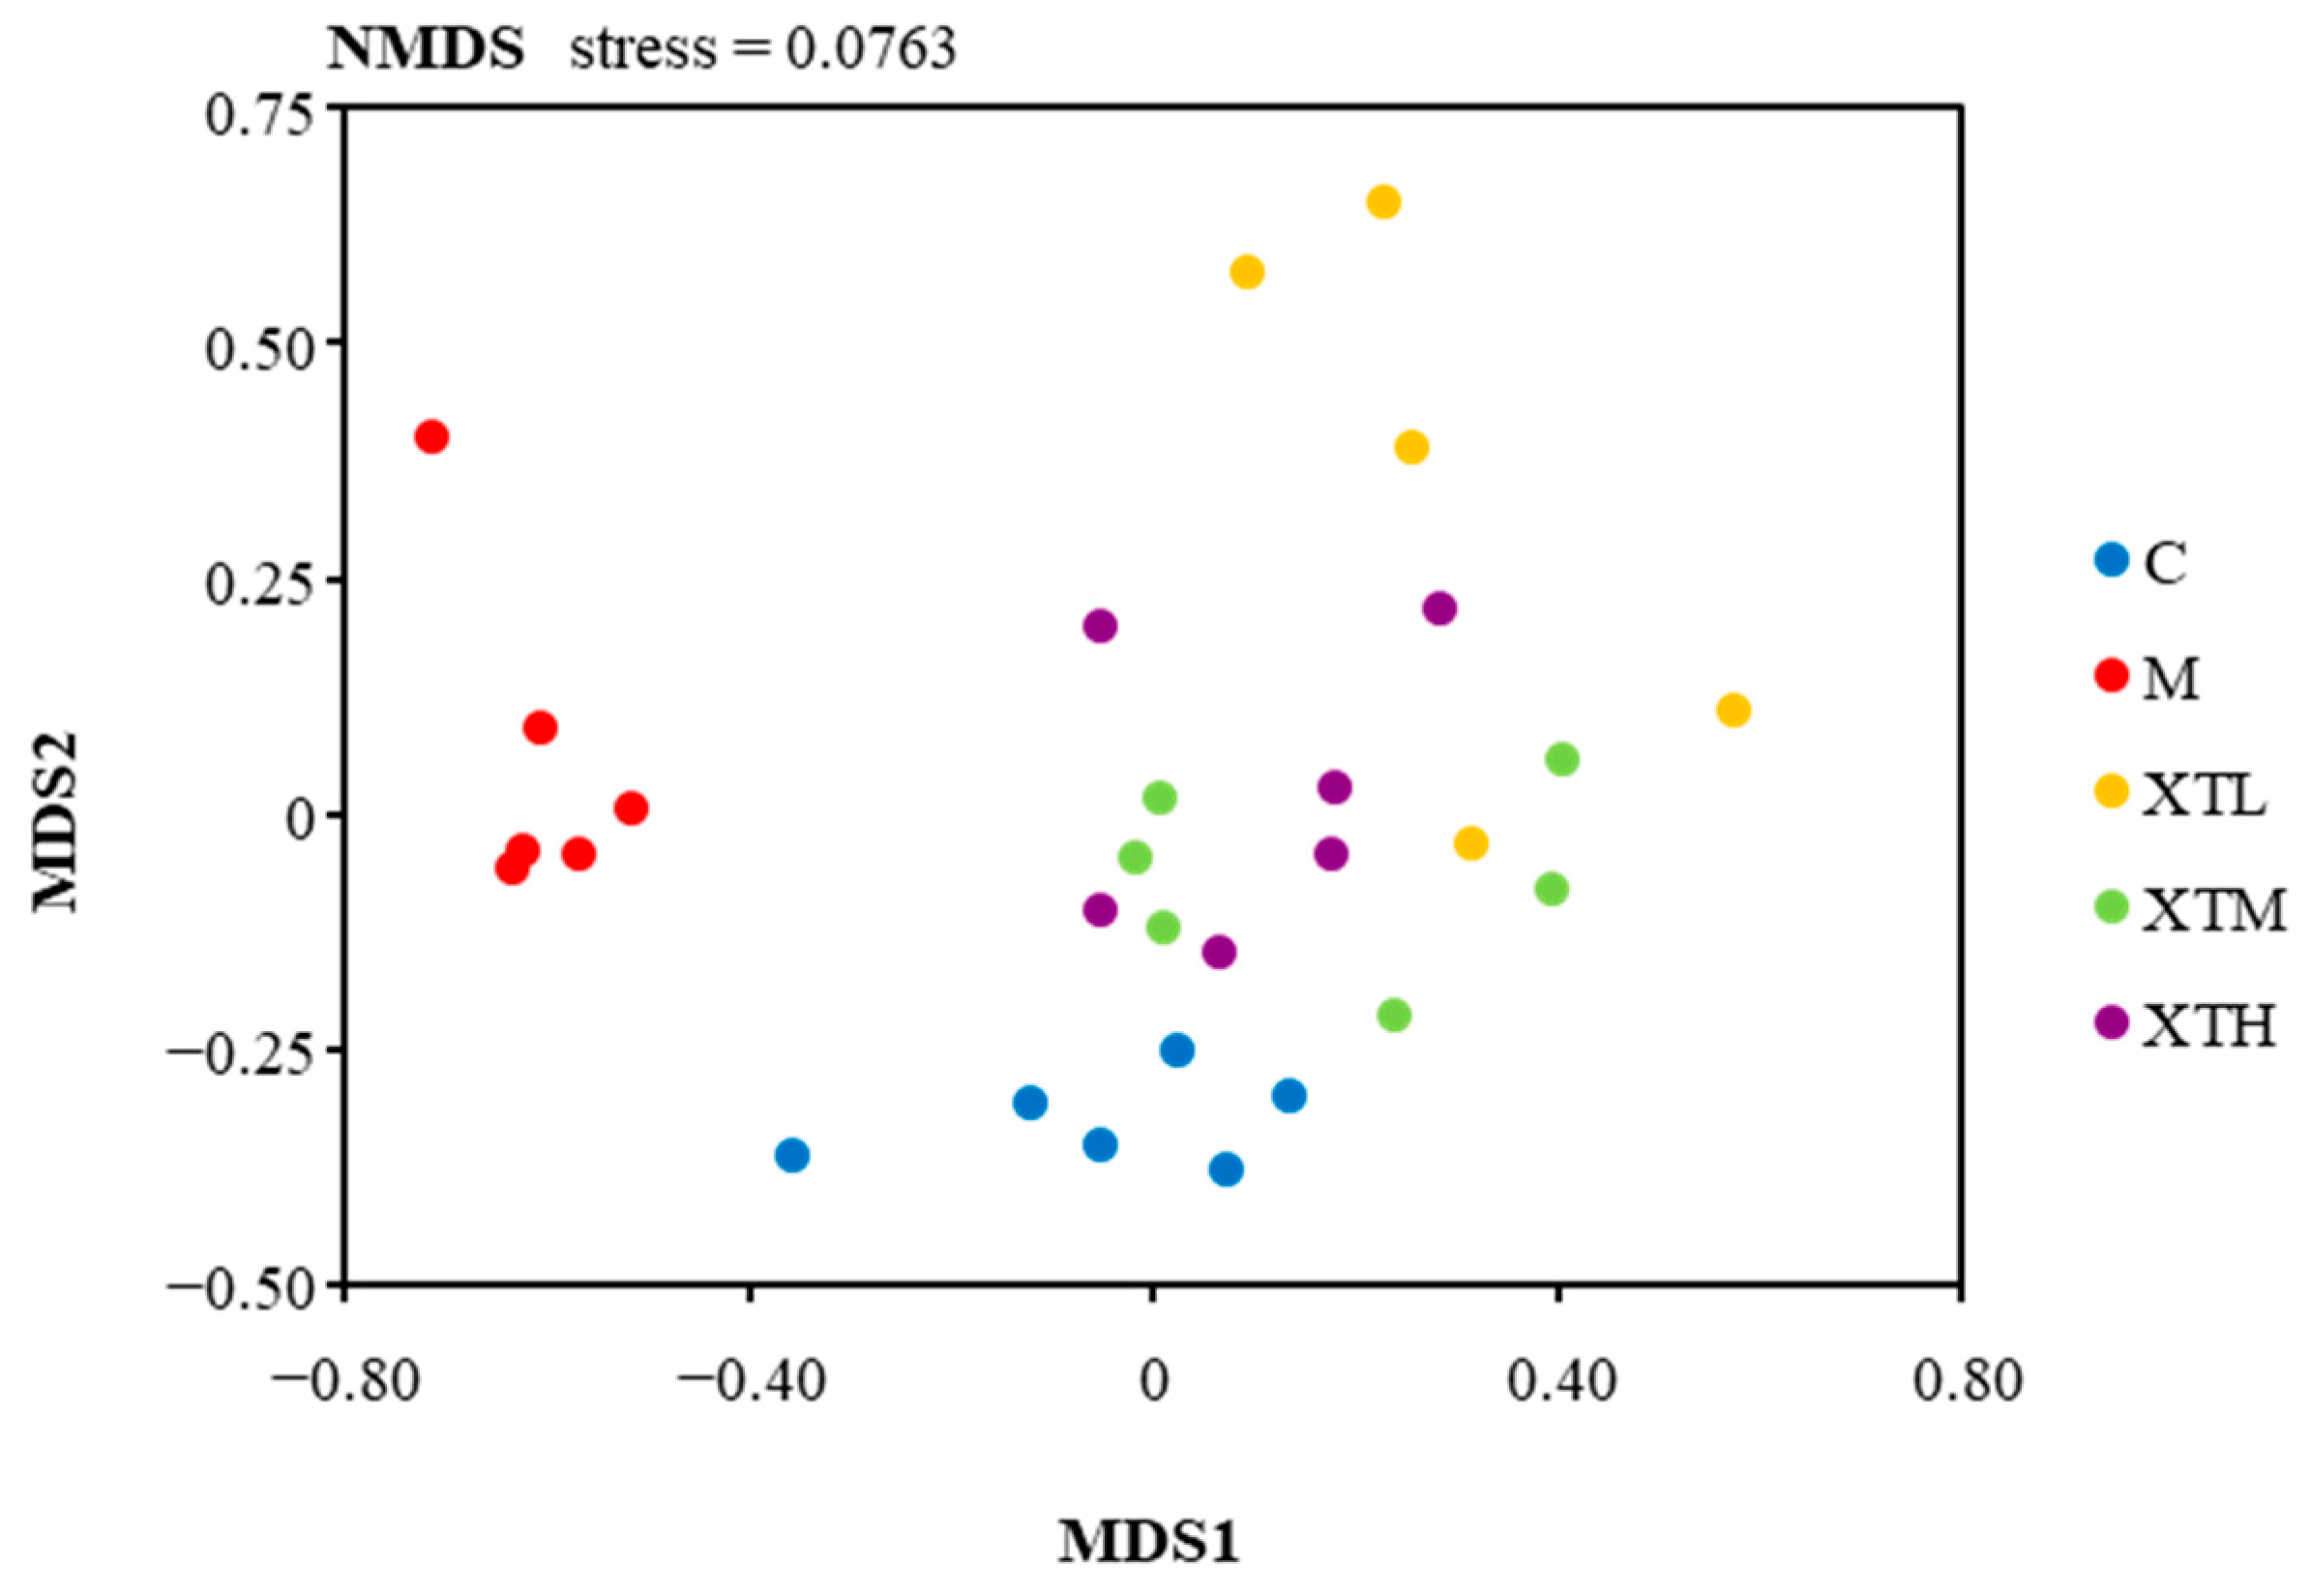
3.2.2. Regulation of β Diversity
3.2.3. Regulation of Species Composition and Differential Microbiota
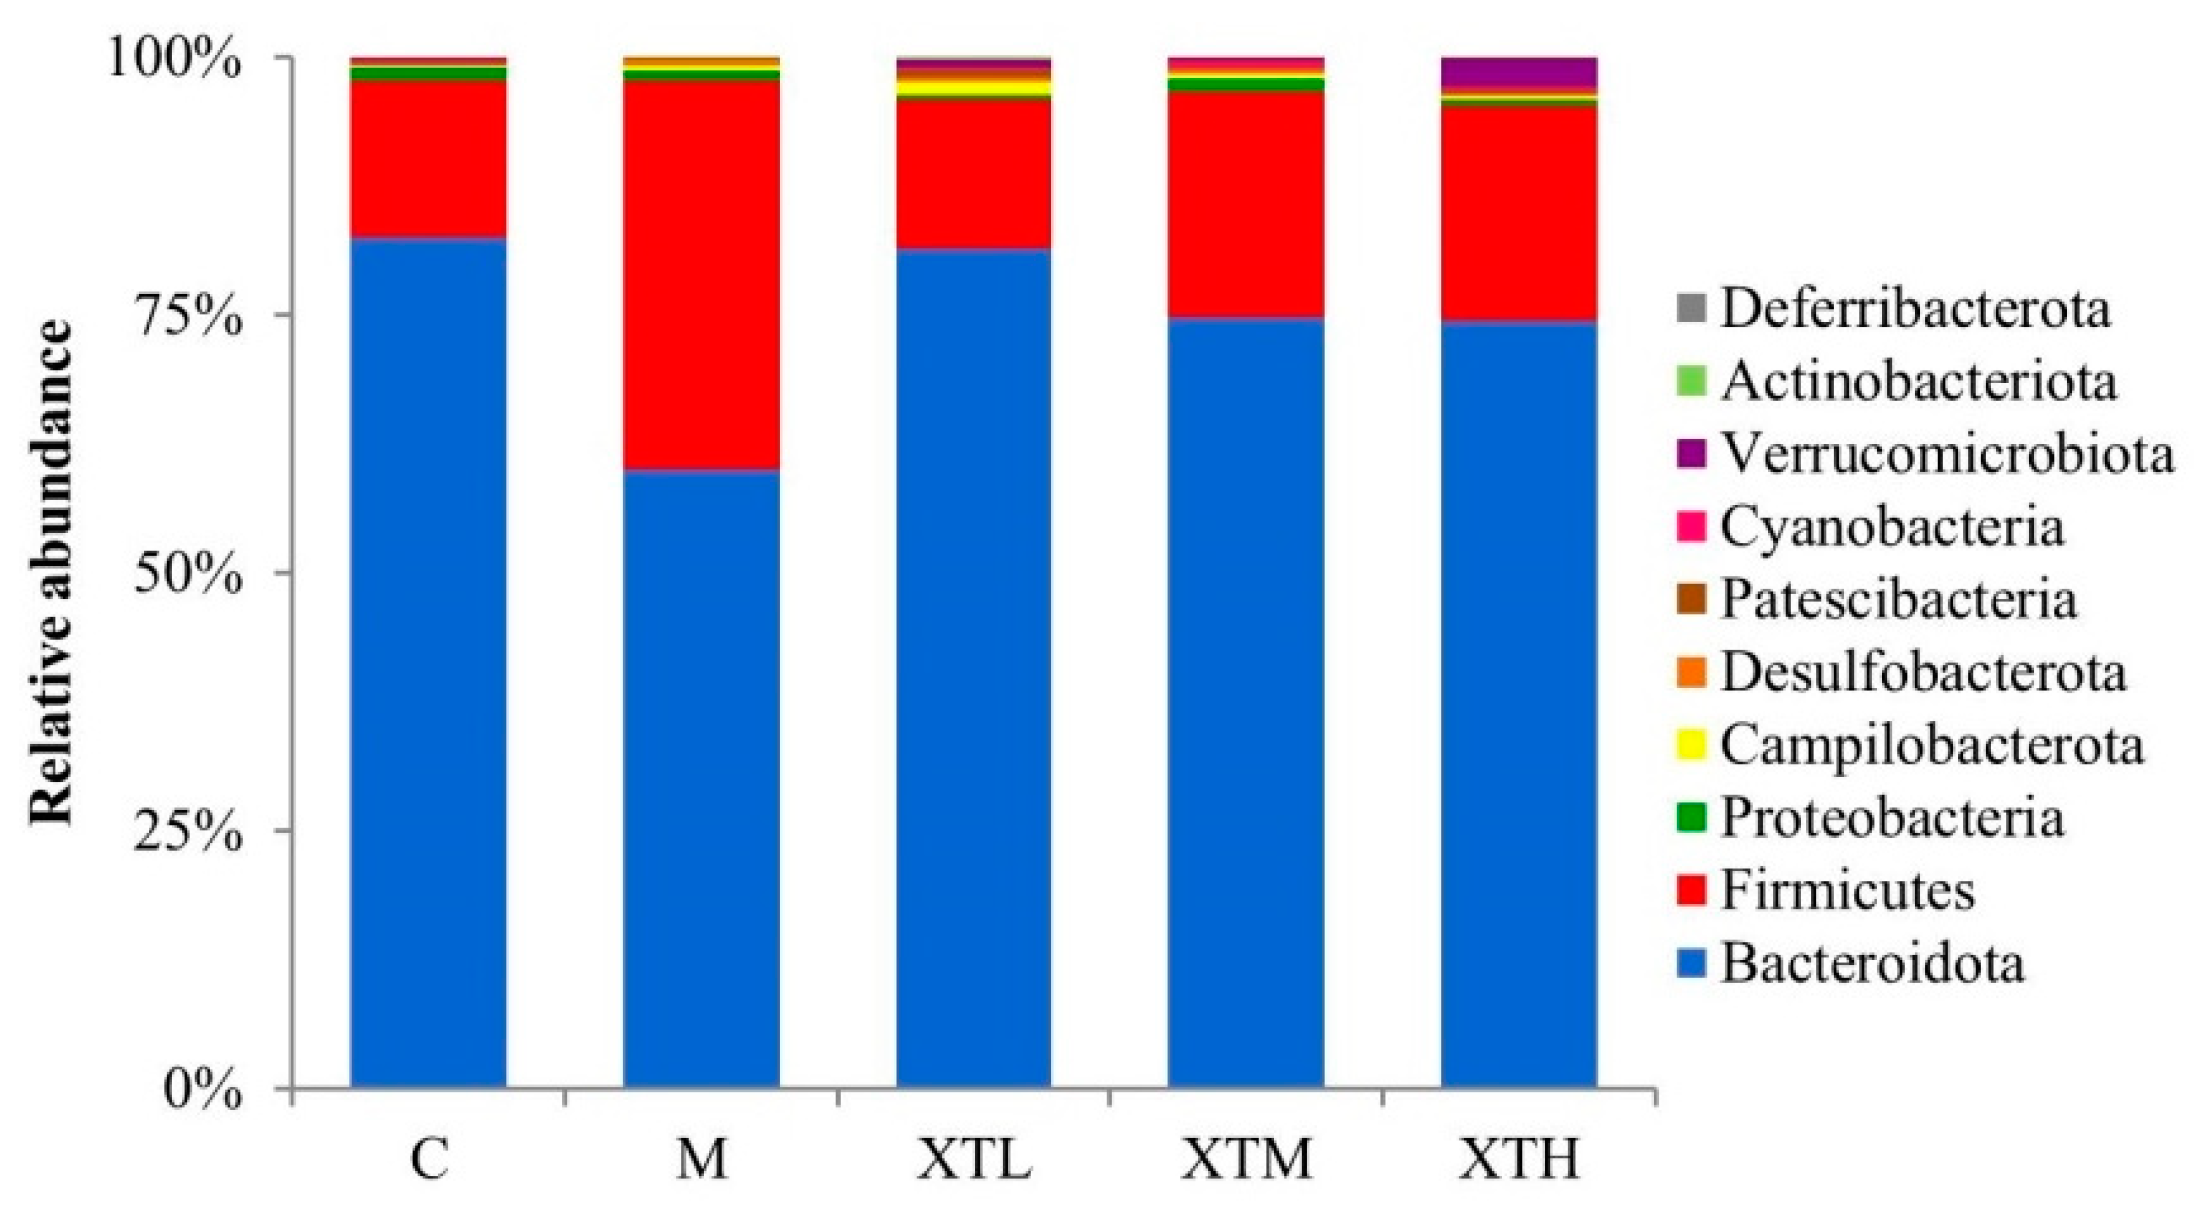
- Phylum level
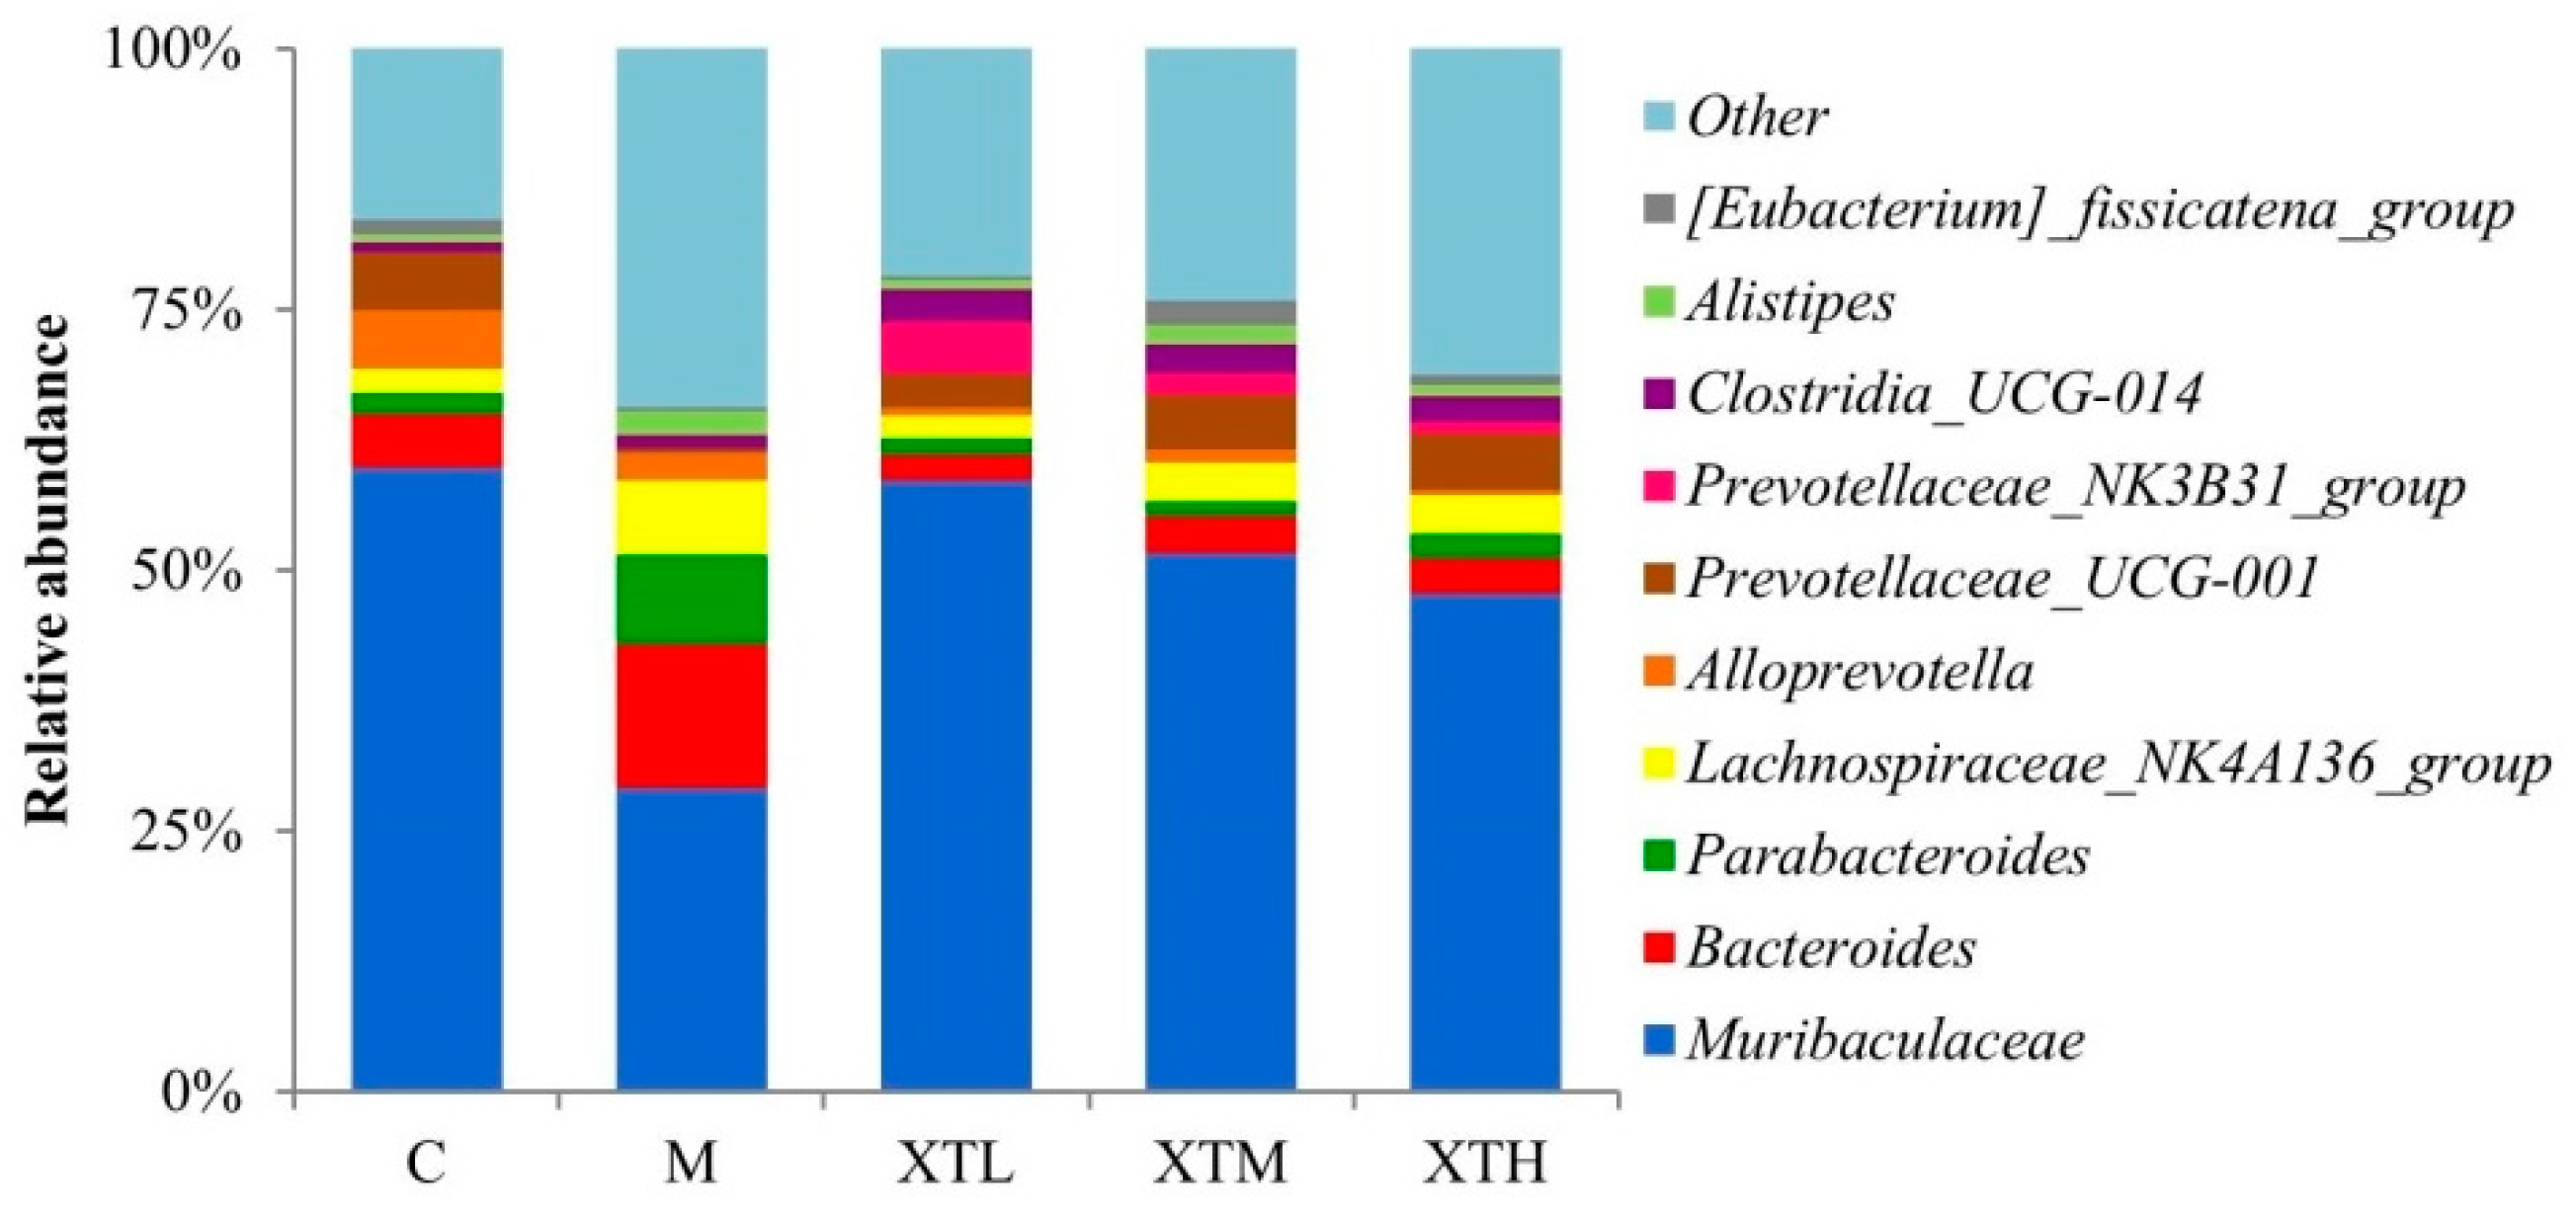
- Genus level
3.3. Regulation of SHH on Gut Microbiota Metabolites
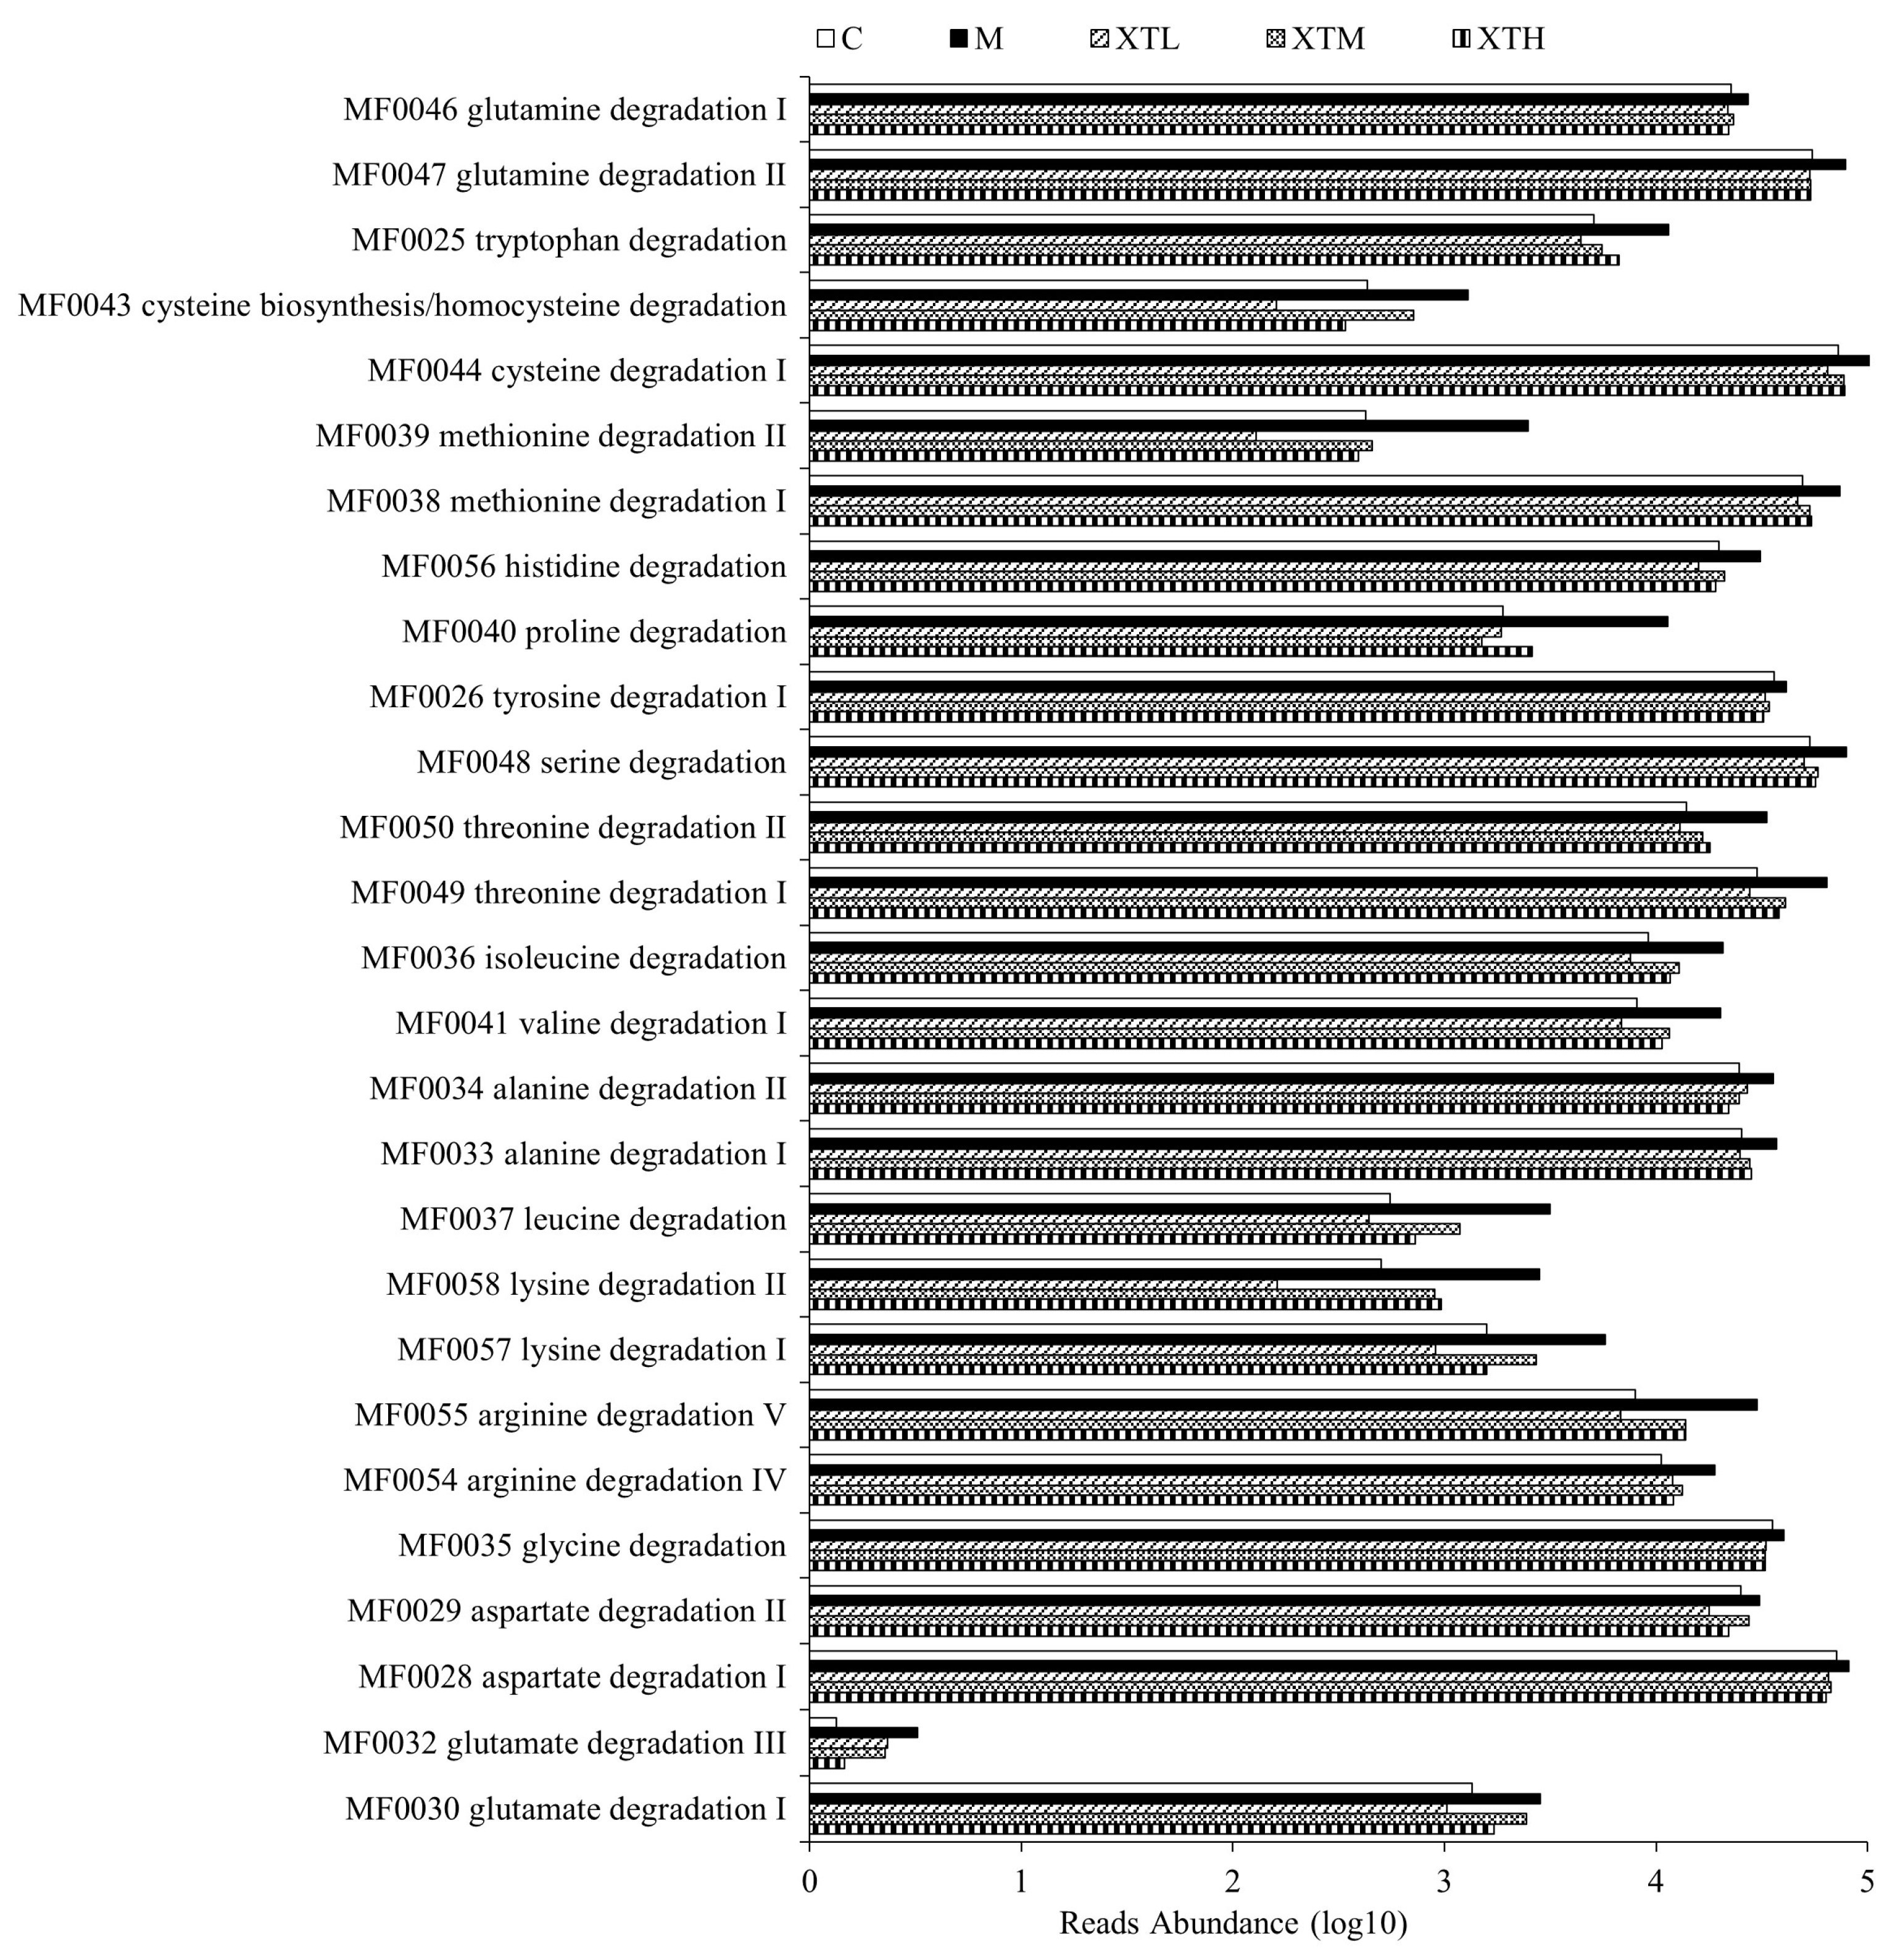
3.3.1. Metabolic Functional Gene Prediction
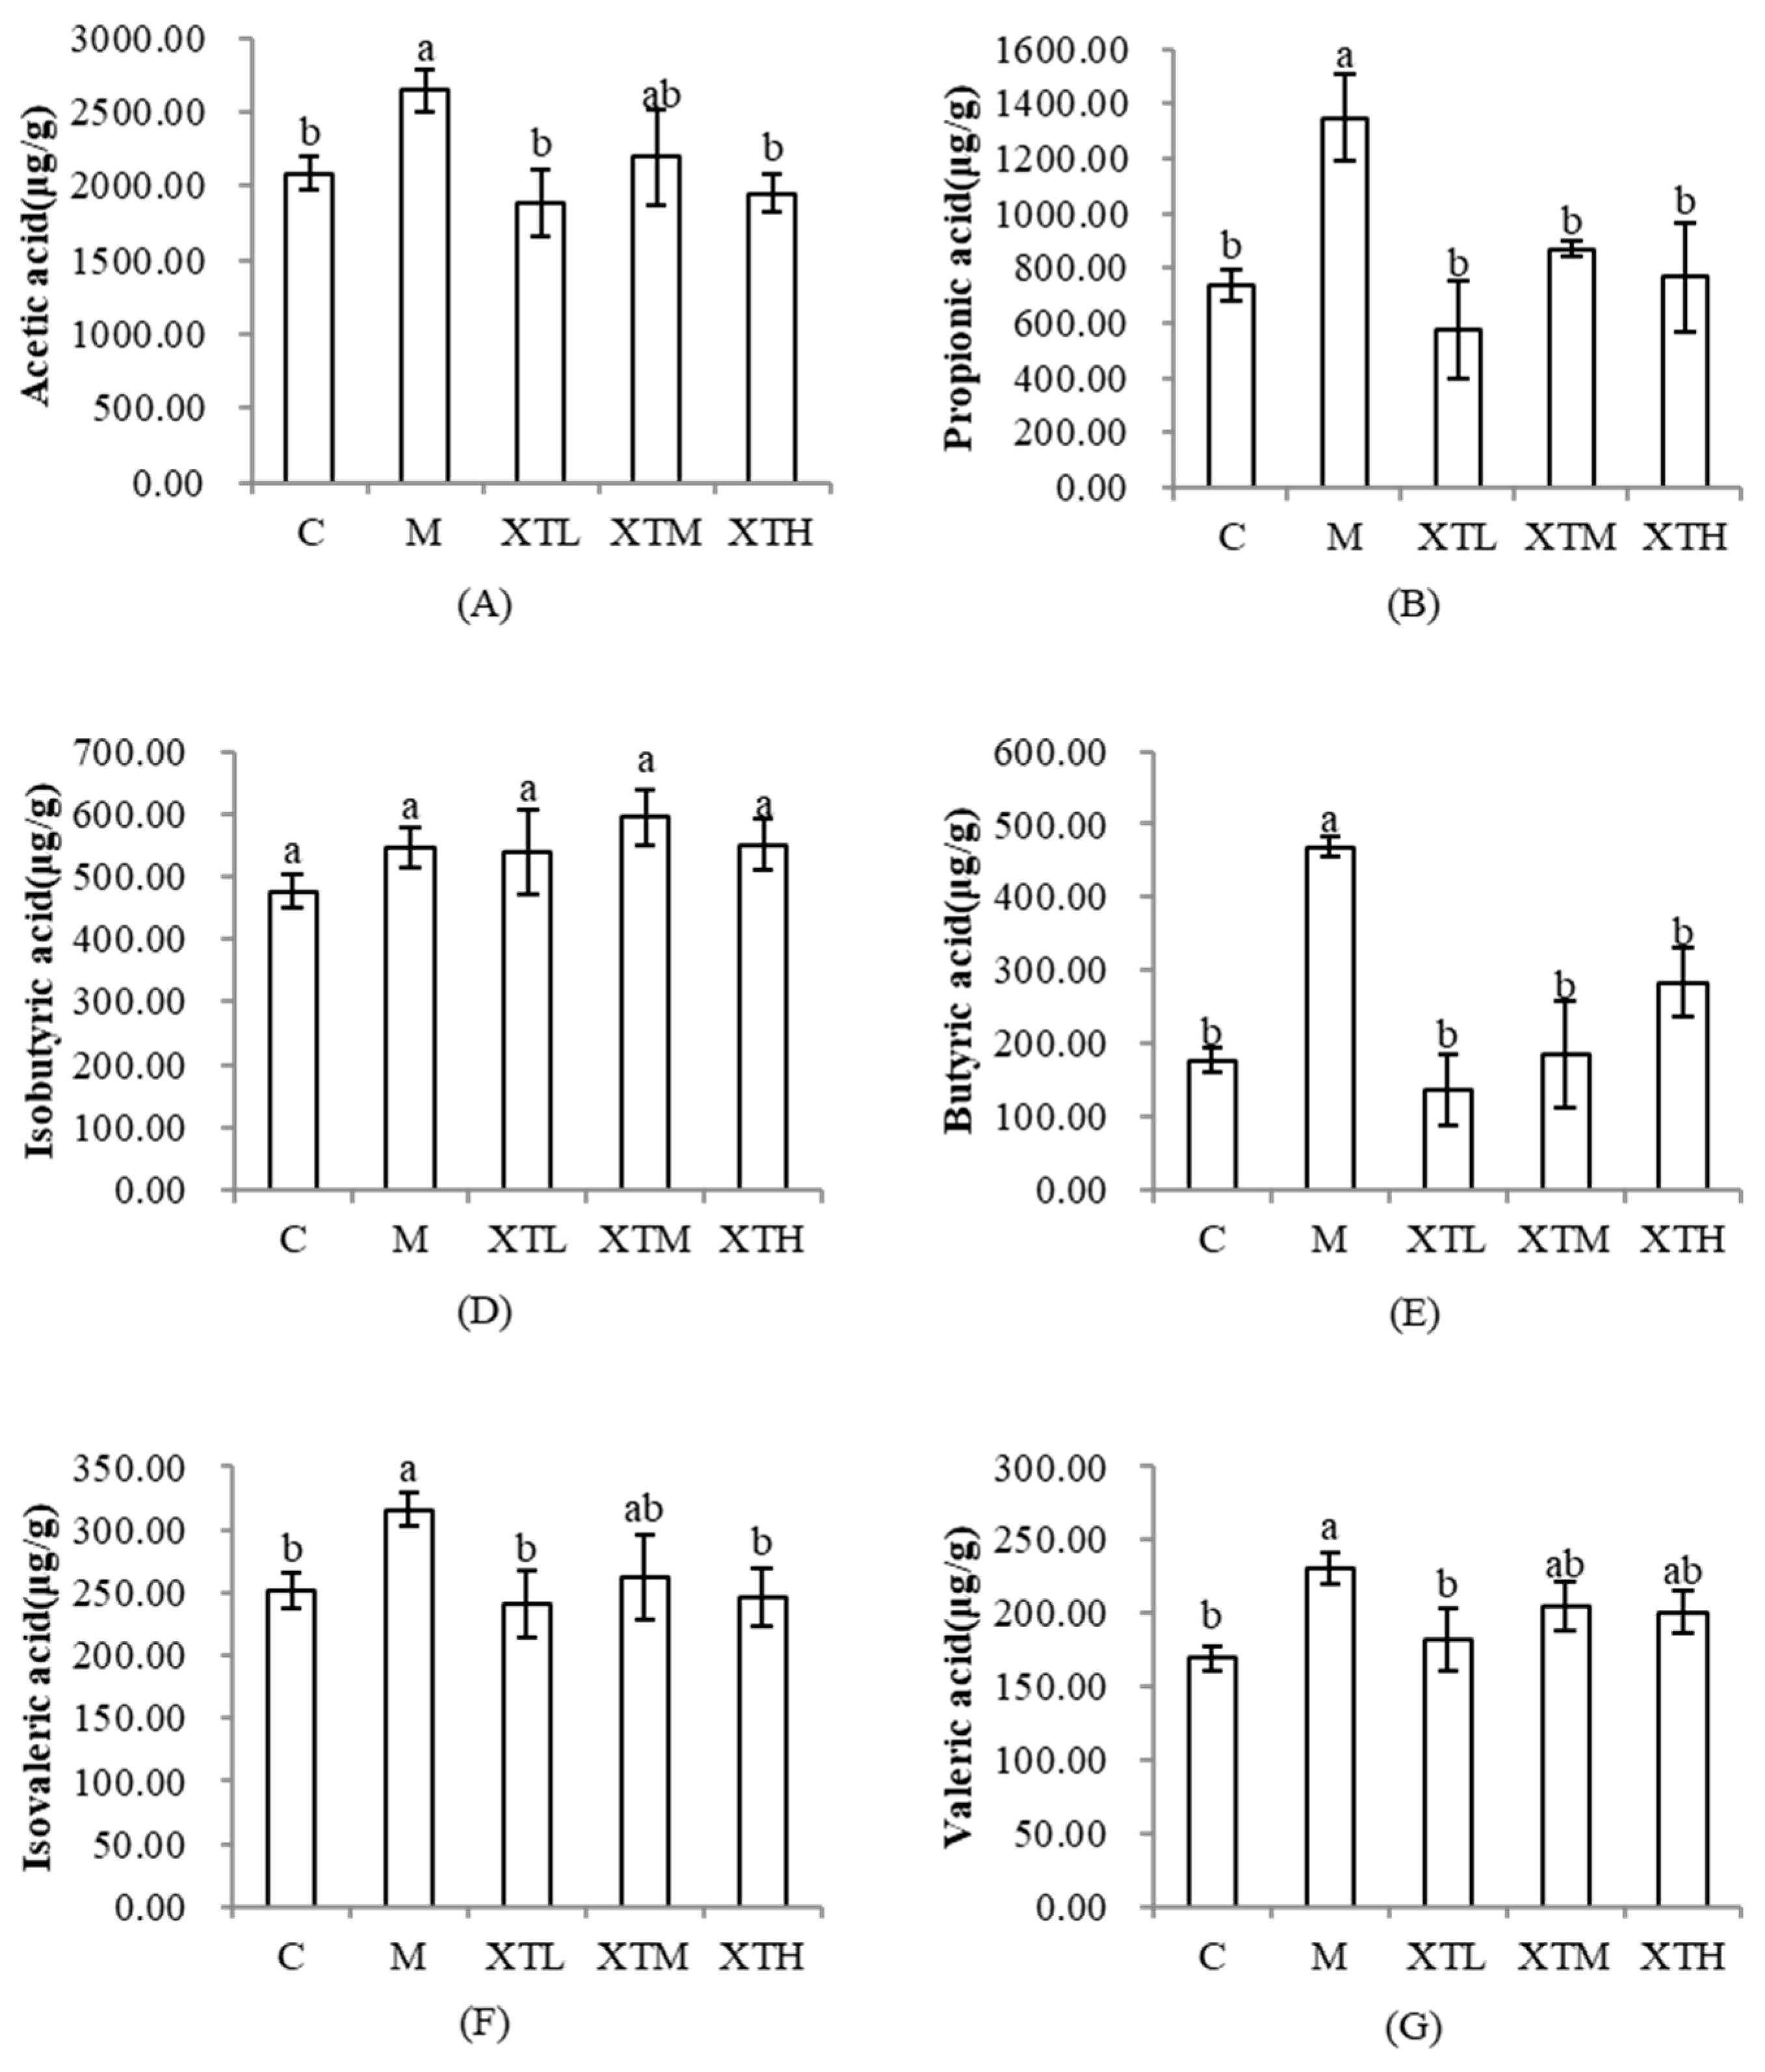
3.3.2. Regulation of Short-Chain Fatty Acids
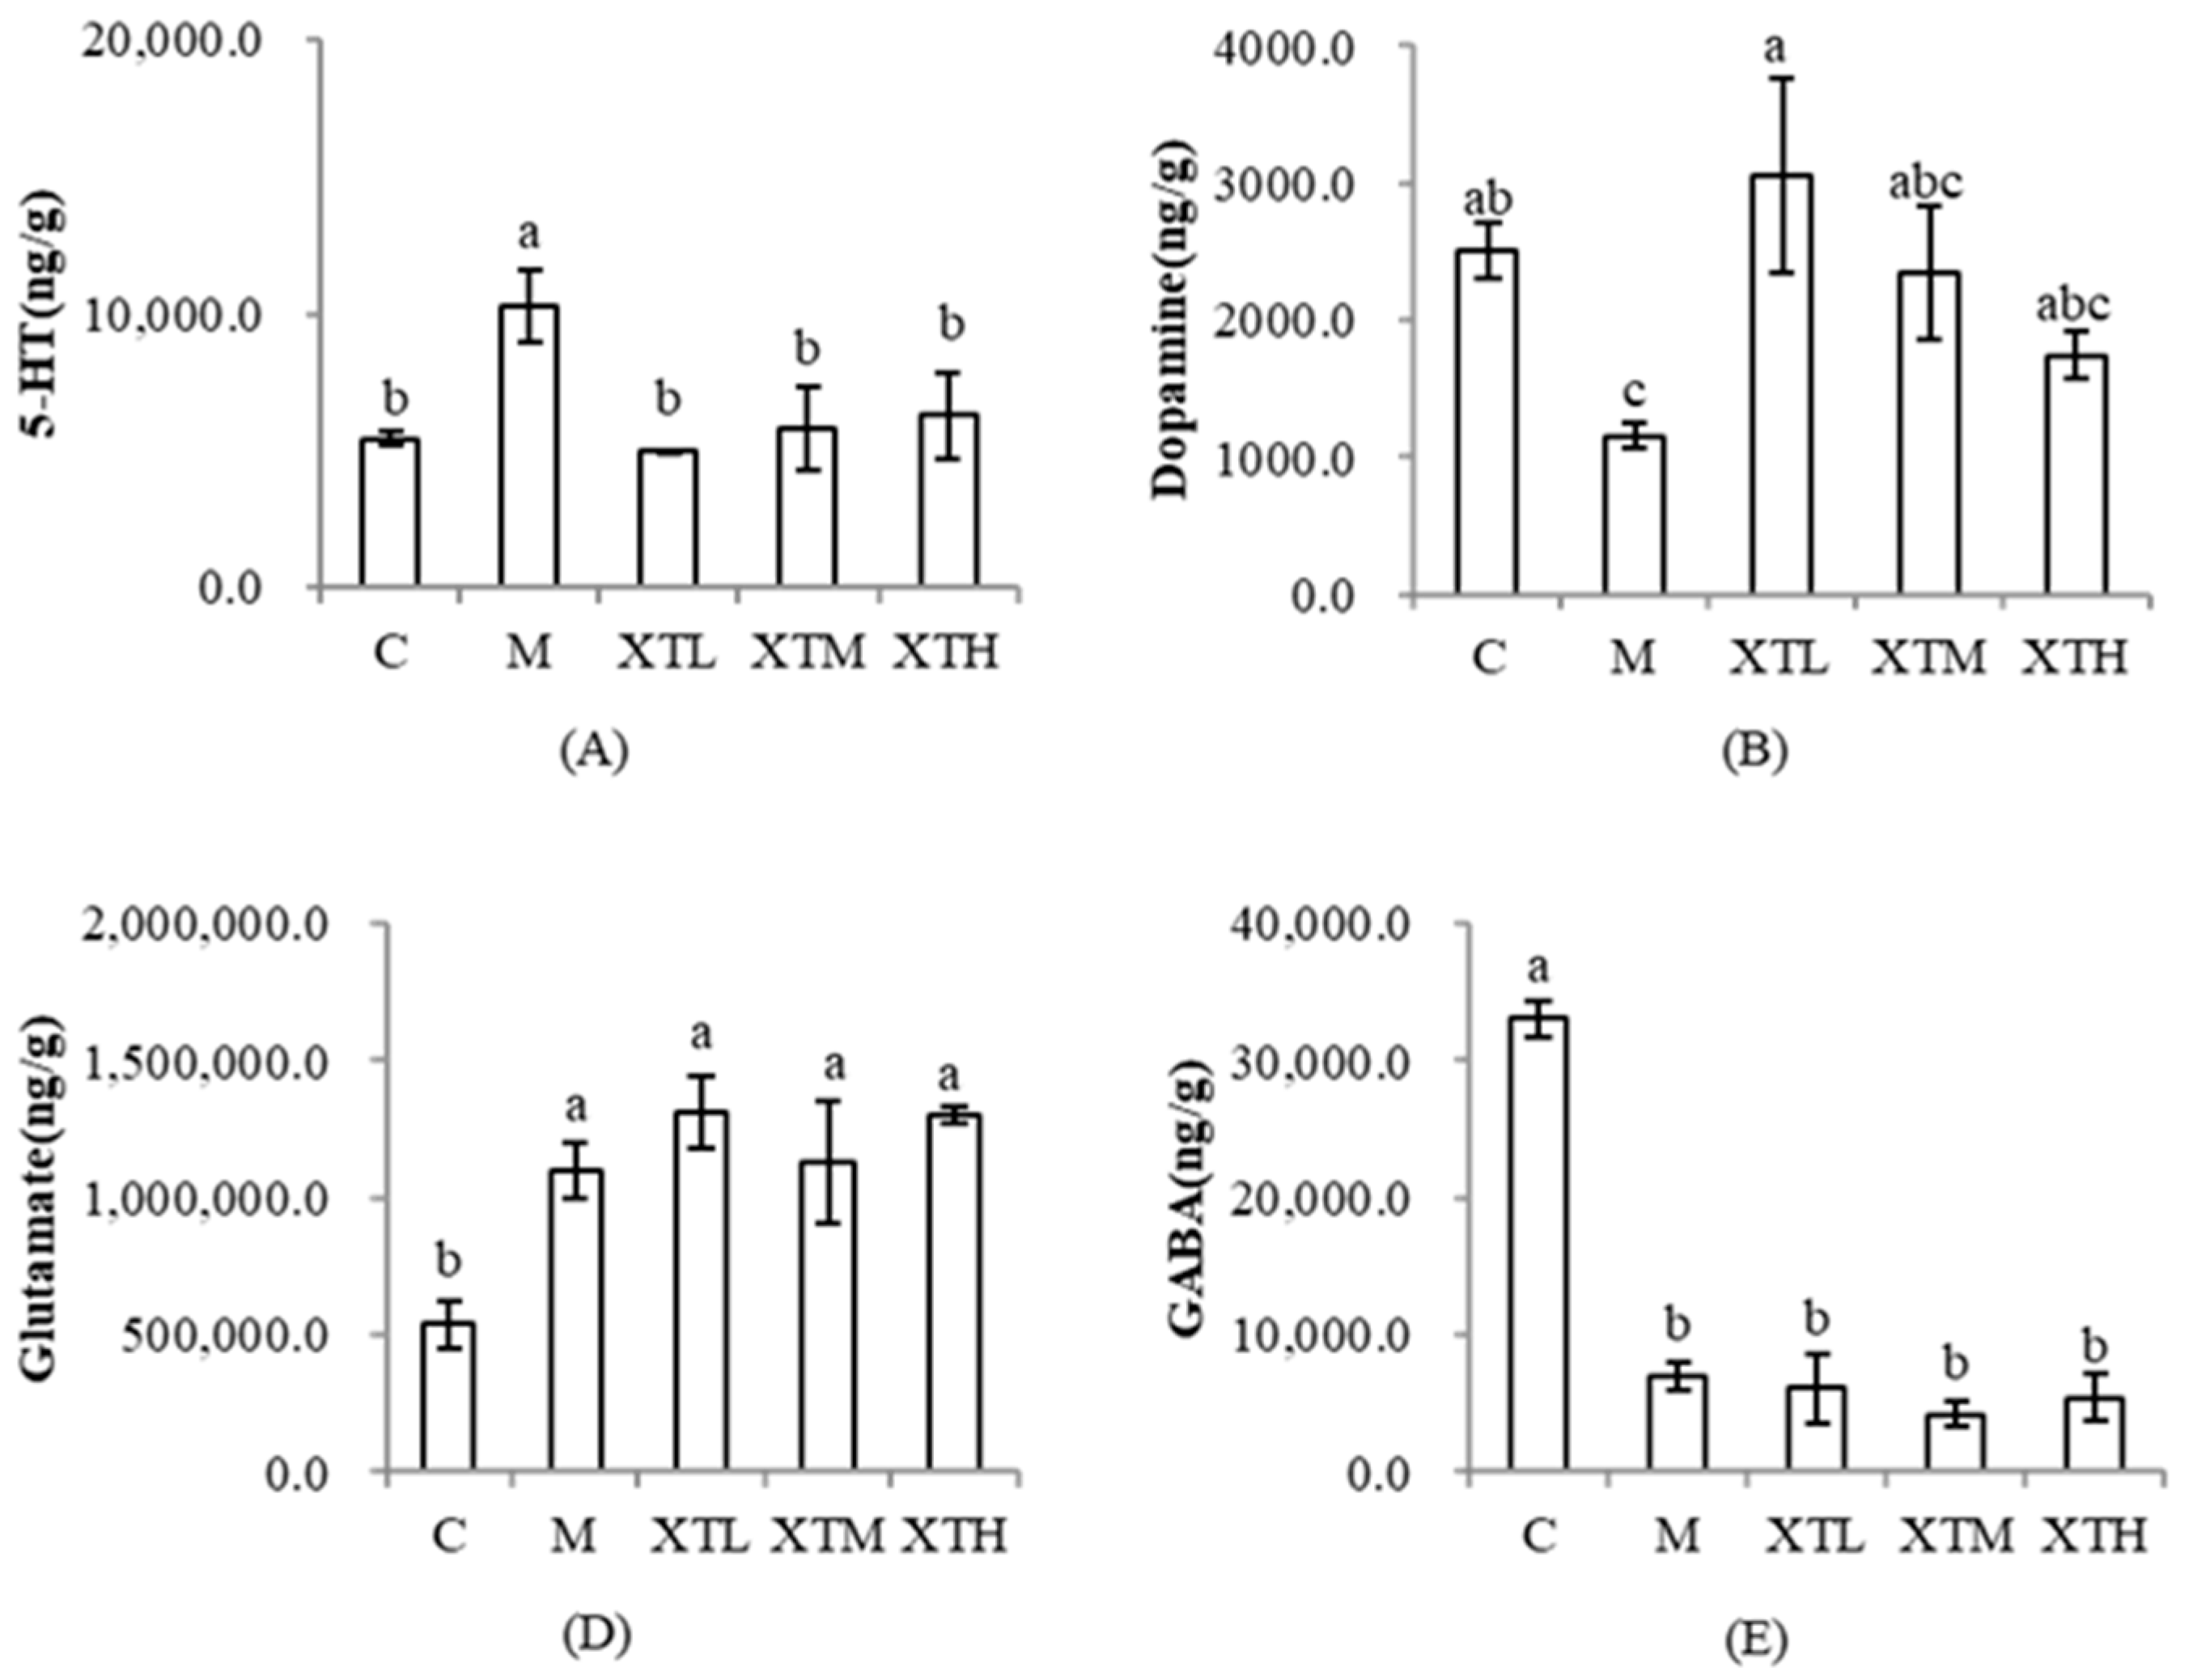
3.3.3. Regulation of Neurotransmitters
3.4. Correlation Analysis
3.4.1. Correlation Analysis of Metabolites and Behavioural Indexes
3.4.2. Correlation Analysis of Differential Flora and Metabolites
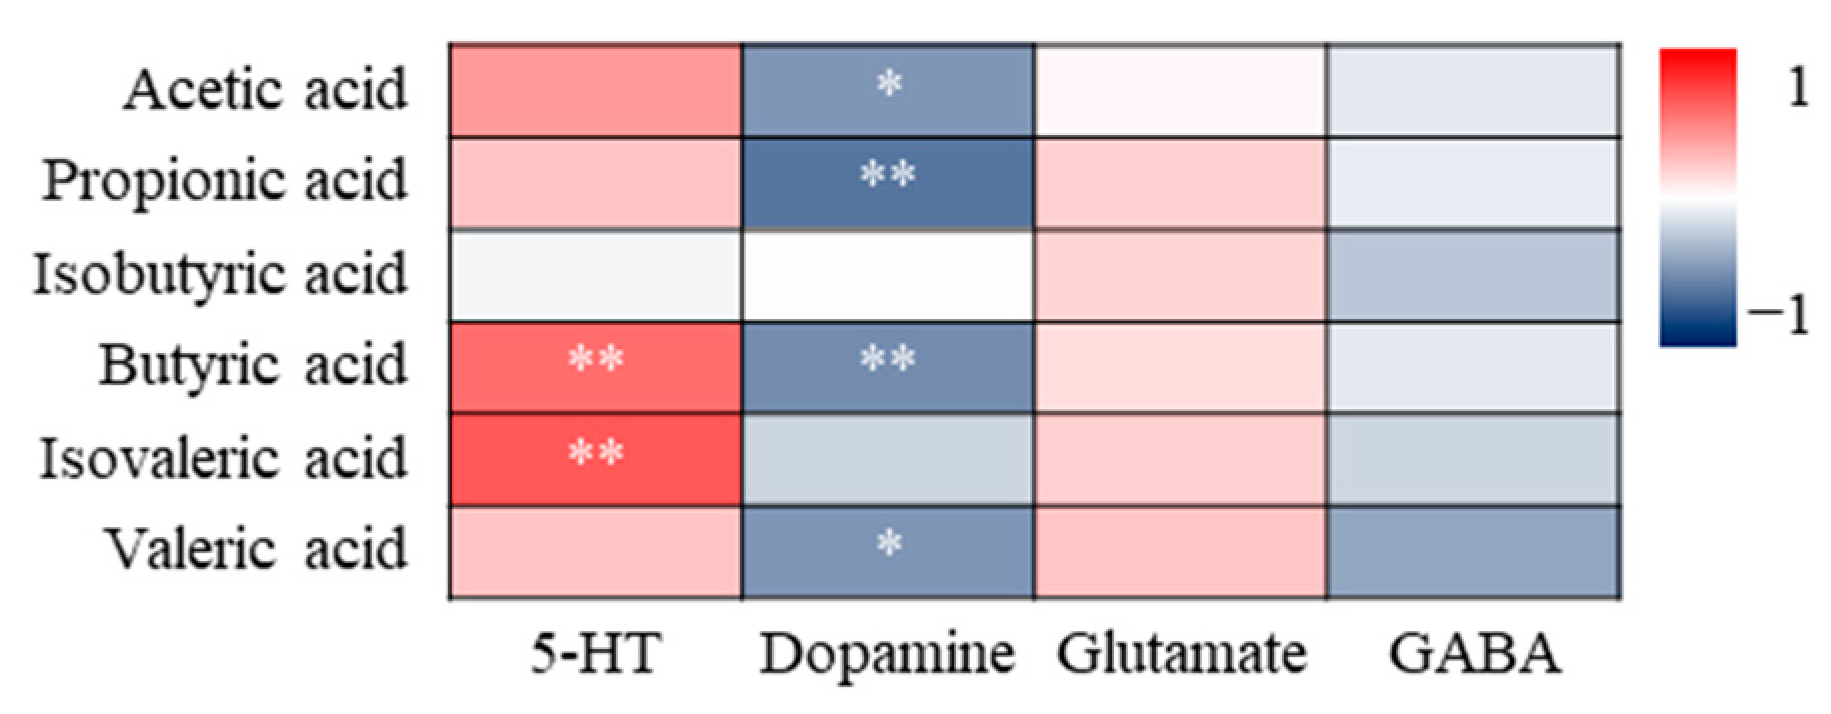
3.4.3. Correlation Analysis of SCFAs and Neurotransmitters
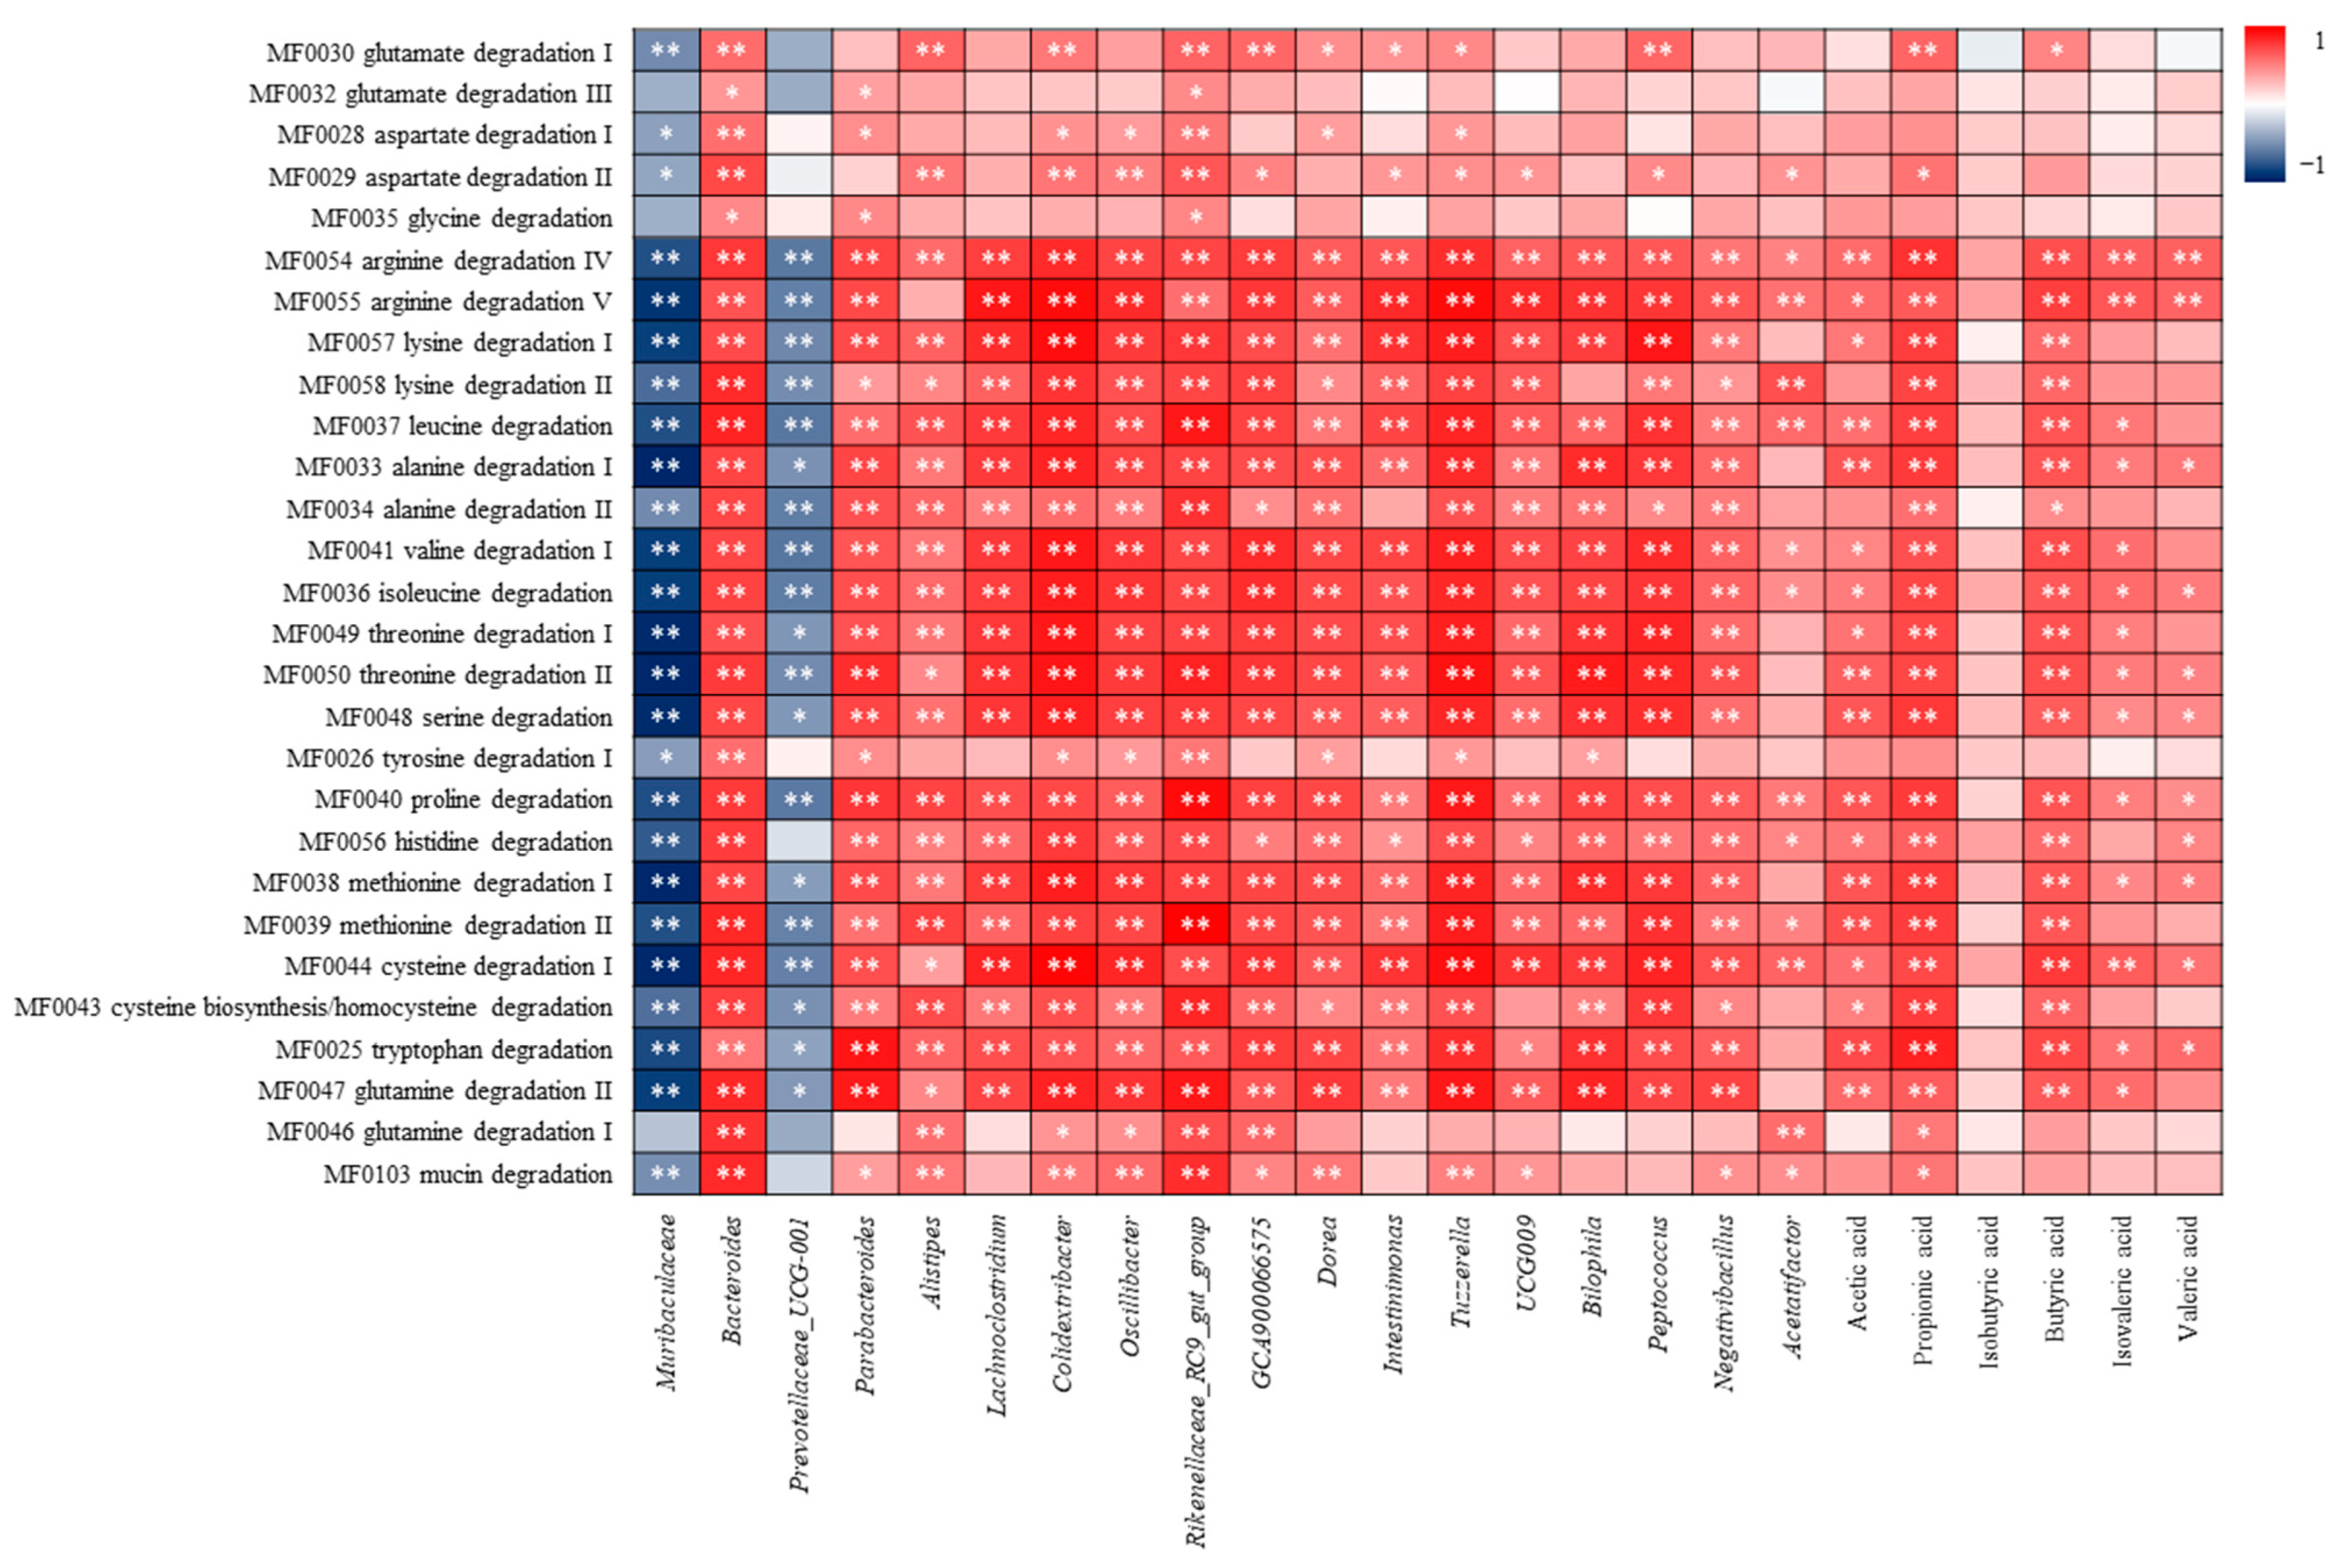
3.4.4. Correlation Analysis of Amino Acid Metabolism and Differential Flora, SCFAs
4. Discussion
5. Conclusions
Author Contributions
Funding
Institutional Review Board Statement
Informed Consent Statement
Data Availability Statement
Conflicts of Interest
Appendix A

| Amino Acids | Mass Fraction (%) |
|---|---|
| Glu | 11.10 |
| Asp | 6.73 |
| Gly | 6.67 |
| Arg | 5.73 |
| Lys | 5.39 |
| Leu | 5.08 |
| Ala | 4.78 |
| Val | 3.79 |
| Ile | 3.20 |
| Thr | 3.18 |
| Phe | 3.06 |
| Ser | 2.99 |
| Tyr | 2.53 |
| Pro | 2.15 |
| His | 1.76 |
| Met | 1.56 |
| Cys | 0.30 |
| Days | Chronic Unpredictable Mild Stress | |
|---|---|---|
| 1 | loud noise for 30 min | |
| 2 | 12 °C water bath for 6 min | |
| 3 | cage tilt for 24 h | continuous light for 24 h |
| 4 | loud noise for 30 min | fasting for 24 h |
| 5 | suspension for 30 min | |
| 6 | 12 °C water bath for 6 min | |
| 7 | water deprivation for 24 h | continuous darkness for 24 h |
| 8 | cage tilt for 24 h | continuous light for 24 h |
| 9 | loud noise for 30 min | |
| 10 | 12 °C water bath for 6 min | |
| 11 | suspension for 30 min | |
| 12 | loud noise for 30 min | |
| 13 | fasting for 24 h | |
| 14 | loud noise for 30 min | suspension for 30 min |
| 15 | water deprivation for 24 h | |
| 16 | 12 °C water bath for 6 min | |
| 17 | cage tilt for 24 h | continuous light for 24 h |
| 18 | fasting for 24 h | |
| 19 | loud noise for 30 min | |
| 20 | suspension for 30 min | |
| 21 | water deprivation for 24 h | continuous darkness for 24 h |
| 22 | cage tilt for 24 h | continuous light for 24 h |
| 23 | loud noise for 30 min | fasting for 24 h |
| 24 | suspension for 30 min | |
| 25 | 12 °C water bath for 6 min | |
| 26 | water deprivation for 24 h | continuous darkness for 24 h |
| 27 | cage tilt for 24 h | continuous light for 24 h |
| 28 | loud noise for 30 min | fasting for 24 h |
| 29 | suspension for 30 min | |
| 30 | 12 °C water bath for 6 min | |
| 31 | cage tilt for 24 h | loud noise for 30 min |
| 32 | suspension for 30 min | |
| 33 | loud noise for 30 min | |
| 34 | suspension for 30 min | |
| 35 | cage tilt for 24 h | loud noise for 30 min |
| 36 | fasting for 24 h | |
| 37 | suspension for 30 min | |
| 38 | cage tilt for 24 h | |
| 39 | water deprivation for 24 h | |
| 40 | loud noise for 30 min | |
| 41 | cage tilt for 24 h | |
| 42 | loud noise for 30 min | |
| 43 | water deprivation for 24 h | |
| 44 | cage tilt for 24 h | |
| Sample | Goods_Coverage |
|---|---|
| C.1 | 0.9973 |
| C.2 | 0.9953 |
| C.3 | 0.9951 |
| C.4 | 0.9955 |
| C.5 | 0.9971 |
| C.6 | 0.9954 |
| M.1 | 0.9962 |
| M.2 | 0.9957 |
| M.3 | 0.9952 |
| M.4 | 0.9949 |
| M.5 | 0.9980 |
| M.6 | 0.9964 |
| XT.L1 | 0.9977 |
| XT.L2 | 0.9973 |
| XT.L3 | 0.9961 |
| XT.L4 | 0.9978 |
| XT.L5 | 0.9955 |
| XT.M1 | 0.9971 |
| XT.M2 | 0.9977 |
| XT.M3 | 0.9961 |
| XT.M4 | 0.9963 |
| XT.M5 | 0.9958 |
| XT.M6 | 0.9954 |
| XT.H1 | 0.9966 |
| XT.H2 | 0.9947 |
| XT.H3 | 0.9945 |
| XT.H4 | 0.9952 |
| XT.H5 | 0.9945 |
| XT.H6 | 0.9954 |
References
- Tran, I.; Gellner, A.K. Long-term effects of chronic stress models in adult mice. J. Neural Transm. 2023, 130, 1133–1151. [Google Scholar] [CrossRef]
- Greene, J.W.; Walker, L.S. Psychosomatic problems and stress in adolescence. Pediatr. Clin. N. Am. 1997, 44, 1557–1572. [Google Scholar] [CrossRef]
- Mojtabai, R.; Olfson, M.; Han, B. National trends in the prevalence and treatment of depression in adolescents and young adults. Pediatrics 2016, 138, e20161878. [Google Scholar] [CrossRef]
- Simkin, D.R. Microbiome and mental health, specifically as it relates to adolescents. Curr. Psychiatry Rep. 2019, 21, 93. [Google Scholar] [CrossRef]
- Twenge, J.M.; Joiner, T.E.; Rogers, M.L.; Martin, G.N. Increases in depressive symptoms, suicide-related outcomes, and suicide rates among U.S. adolescents after 2010 and links to increased new media screen time. Clin. Psychol. Sci. 2017, 6, 3–17. [Google Scholar] [CrossRef]
- Chen, H.; Li, W.; Cao, X.; Liu, P.; Liu, J.; Chen, X.; Luo, C.; Liang, X.; Guo, H.; Zhong, S.; et al. The association between suicide attempts, anxiety, and childhood maltreatment among adolescents and young adults with First depressive episodes. Front. Psychiatry 2021, 12, 745470. [Google Scholar] [CrossRef]
- Seo, H.J.; Song, H.R.; Yim, H.W.; Kim, J.B.; Lee, M.S.; Kim, J.M.; Jun, T.Y. Age-related differences in suicidality between young people and older adults with depression: Data from a nationwide depression cohort study in Korea (the CRESCEND study). Compr. Psychiatry 2015, 56, 85–92. [Google Scholar] [CrossRef]
- Joyce, N.R.; Schuler, M.S.; Hadland, S.E.; Hatfield, L.A. Variation in the 12-month treatment trajectories of children and adolescents after a diagnosis of depression. JAMA Pediatr. 2017, 172, 49–56. [Google Scholar] [CrossRef]
- Teng, T.; Clarke, G.; Wu, J.; Wu, Q.; Maes, M.; Wang, J.; Wu, H.; Yin, B.; Jiang, Y.; Li, X.; et al. Disturbances of purine and lipid metabolism in the microbiota-gut-brain axis in male adolescent nonhuman primates with depressive-like behaviors. J. Adv. Res. 2023. [Google Scholar] [CrossRef]
- Cipriani, A.; Furukawa, T.A.; Salanti, G.; Chaimani, A.; Atkinson, L.Z.; Ogawa, Y.; Geddes, J.R. Comparative efficacy and acceptability of 21 antidepressant drugs for the acute treatment of adults with major depressive disorder: A systematic review and network meta-analysis. Lancet 2018, 391, 1357–1366. [Google Scholar] [CrossRef]
- Liang, X.Q.; Mai, P.Y.; Qin, H.; Li, S.; Ou, W.J.; Liang, J.; Zhong, J.; Liang, M.K. Integrated 16S rRNA sequencing and metabolomics analysis to investigate the antidepressant role of Yang-XinJie-Yu decoction on microbe-gut metabolite in chronic unpredictable mild stress-induced depression rat model. Front. Pharmacol. 2022, 13, 972351. [Google Scholar] [CrossRef]
- Cipriani, A.; Zhou, X.; Del Giovane, C.; Hetrick, S.E.; Qin, B.; Whittington, C.; Xie, P. Comparative efficacy and tolerability of antidepressants for major depressive disorder in children and adolescents: A network meta-analysis. Lancet 2016, 388, 881–890. [Google Scholar] [CrossRef]
- Rang, Y.F.; Liu, H.; Liu, C.H. Potential for non-starch polysaccharides in the prevention and remediation of cognitive impairment: A comprehensive review. Int. J. Biol. Macromol. 2022, 208, 182–195. [Google Scholar] [CrossRef]
- Zhang, R.X.; Zhou, J.; Li, M.X.; Ma, H.G.; Qiu, J.G.; Luo, X.H.; Jia, Z.P. Ameliorating effect and potential mechanism of Rehmannia glutinosa oligosaccharides on the impaired glucose metabolism in chronic stress rats fed with high-fat diet. Phytomedicine 2014, 21, 607–614. [Google Scholar] [CrossRef]
- Juszczyk, G.; Mikulska, J.; Kasperek, K.; Pietrzak, D.; Mrozek, W.; Herbet, M. Chronic stress and oxidative stress as common factors of the pathogenesis of depression and alzheimer’s disease: The role of antioxidants in prevention and treatment. Antioxidants 2021, 10, 1439. [Google Scholar] [CrossRef]
- Yang, E.J.; Frolinger, T.; Iqbal, U.H.; Murrough, J.; Pasinetti, G.M. The bioactive dietary polyphenol preparation alleviates depression and anxiety-like behaviors by modulating the regional heterogeneity of microglia morphology. Mol. Nutr. Food Res. 2023, 67, e2300156. [Google Scholar] [CrossRef]
- Di Miceli, M.; Martinat, M.; Rossitto, M.; Aubert, A.; Alashmali, S.; Bosch-Bouju, C.; Fioramonti, X.; Joffre, C.; Bazinet, R.P.; Layé, S. Dietary long-chain n-3 polyunsaturated fatty acid supplementation alters electrophysiological properties in the nucleus accumbens and emotional behavior in naïve and chronically stressed mice. Int. J. Mol. Sci. 2022, 23, 6650. [Google Scholar] [CrossRef]
- Zheng, P.; Zeng, B.; Zhou, C.; Liu, M.; Fang, Z.; Xu, X.; Xie, P. Gut microbiome remodeling induces depressive-like behaviors through a pathway mediated by the host’s metabolism. Mol. Psychiatry 2016, 21, 786–796. [Google Scholar] [CrossRef]
- Yang, J.; Zheng, P.; Li, Y.; Wu, J.; Tan, X.; Zhou, J.; Xie, P. Landscapes of bacterial and metabolic signatures and their interaction in major depressive disorders. Sci. Adv. 2020, 6, eaba8555. [Google Scholar] [CrossRef]
- Sorboni, S.G.; Moghaddam, H.S.; Jafarzadeh-Esfehani, R.; Soleimanpour, S. A comprehensive review on the role of the gut microbiome in human neurological disorders. Clin. Microbiol. Rev. 2022, 35, e0033820. [Google Scholar] [CrossRef]
- Averina, O.V.; Zorkina, Y.A.; Yunes, R.A.; Kovtun, A.S.; Ushakova, V.M.; Morozova, A.Y.; Chekhonin, V.P. Bacterial metabolites of human gut microbiota correlating with depression. Int. J. Mol. Sci. 2020, 21, 9234. [Google Scholar] [CrossRef]
- Parker, A.; Fonseca, S.; Carding, S.R. Gut microbes and metabolites as modulators of blood-brain barrier integrity and brain health. Gut Microbes 2020, 11, 135–157. [Google Scholar] [CrossRef]
- Den Besten, G.; Lange, K.; Havinga, R.; Van Dijk, T.H.; Gerding, A.; Van Eunen, K.; Muller, M.; Groen, A.K.; Hooiveld, G.J.; Bakker, B.M.; et al. Gut-derived short-chain fatty acids are vividly assimilated into host carbohydrates and lipids. Am. J. Physiol. Gastrointest. Liver Physiol. 2013, 305, 900–910. [Google Scholar] [CrossRef]
- Van der Beek, C.M.; Bloemen, J.G.; van den Broek, M.A.; Lenaerts, K.; Venema, K.; Buurman, W.A.; Dejong, C.H. Hepatic uptake of rectally administered butyrate prevents an increase in systemic butyrate concentrations in humans. J. Nutr. 2015, 145, 2019–2024. [Google Scholar] [CrossRef]
- Martin, C.R.; Osadchiy, V.; Kalani, A.; Mayer, E.A. The brain-gut-microbiome axis. Cell. Mol. Gastroenterol. Hepatol. 2018, 6, 133–148. [Google Scholar] [CrossRef]
- Karl, J.P.; Hatch, A.M.; Arcidiacono, S.M.; Pearce, S.C.; Soares, J.W. Effects of psychological, environmental and physical stressors on the gut microbiota. Front. Microbiol. 2018, 9, 2013. [Google Scholar] [CrossRef]
- Reigstad, C.S.; Salmonson, C.E.; III, J.F.R.; Szurszewski, J.H.; Linden, D.R.; Sonnenburg, J.L.; Farrugia, G.; Kashyap, P.C. Gut microbes promote colonic serotonin production through an effect of short-chain fatty acids on enterochromaffin cells. FASEB J. 2015, 29, 1395–1403. [Google Scholar] [CrossRef]
- van de Wouw, M.; Boehme, M.; Lyte, J.M.; Wiley, N.; Strain, C.; O’Sullivan, O.; Clarke, G.; Stanton, C.; Dinan, T.G.; Cryan, J.F. Short-chain fatty acids: Microbial metabolites that alleviate stress-induced brain–gut axis alterations. J. Physiol. 2018, 596, 4923–4944. [Google Scholar] [CrossRef]
- Farzi, A.; Fröhlich, E.E.; Holzer, P. Gut microbiota and the neuroendocrine system. Neurotherapeutics 2018, 15, 5–22. [Google Scholar] [CrossRef]
- Wang, C.; Sun, D.; Sun, L.; Wang, Y.; Hu, L.; Ye, W.; Fang, Z.; Deng, Q. The intervention of shrimp head enzymatic hydrolysate on capsaicin-induced systemic low-grade inflammation and the structure and function of gut microbiota in mice. Chin. J. Microbiol. 2021, 33, 1–9. [Google Scholar] [CrossRef]
- Hu, Q. Effect of Three Food Extracts on the Regulation of Intestinal Function of an Antibiotic Induced Constipation Mouse Model. Master’s Thesis, Guangdong Ocean University, Zhanjiang, China, 2020. [Google Scholar] [CrossRef]
- Tian, Y.; Li, Y.; Yuan, Y.; Du, R.; Li, X.; Wang, F.; Wang, Y.; Shao, H.; Wang, C. Establishing a long-term depression model in mice; behavior and neuropathological features. Acta Lab. Anim. Sci. Sin. 2020, 28, 358–363. [Google Scholar] [CrossRef]
- Zafar, H.; Saier, M.H. Gut Bacteroides species in health and disease. Gut Microbes 2021, 13, 1848158. [Google Scholar] [CrossRef] [PubMed]
- Cui, Y.; Zhang, L.; Wang, X.; Yi, Y.; Shan, Y.; Liu, B.; Zhou, Y.; Lü, X. Roles of intestinal Parabacteroides in human health and diseases. FEMS Microbiol. Lett. 2022, 369, fnac072. [Google Scholar] [CrossRef] [PubMed]
- Parker, B.J.; Wearsch, P.A.; Veloo, A.C.M.; Rodriguez-Palacios, A. The genus Alistipes: Gut bacteria with emerging implications to inflammation, cancer, and mental health. Front. Immunol. 2020, 11, 906. [Google Scholar] [CrossRef] [PubMed]
- Yutin, N.; Galperin, M.Y. A genomic update on clostridial phylogeny: Gram-negative spore formers and other misplaced clostridia. Environ. Microbiol. 2013, 15, 2631–2641. [Google Scholar] [CrossRef] [PubMed]
- Guo, P.; Zhang, K.; Ma, X.; He, P. Clostridium species as probiotics: Potentials and challenges. J. Anim. Sci. Biotechnol. 2020, 11, 24. [Google Scholar] [CrossRef]
- Liu, X.; Zhang, Y.; Li, W.; Zhang, B.; Yin, J.; Liuqi, S.; Wang, J.; Peng, B.; Wang, S. Fucoidan ameliorated dextran sulfate sodium-induced ulcerative colitis by modulating gut microbiota and bile acid metabolism. J. Agric. Food Chem. 2022, 30, 14864–14876. [Google Scholar] [CrossRef] [PubMed]
- Iino, T.; Mori, K.; Tanaka, K.; Suzuki, K.; Harayama, S. Oscillibacter valericigenes gen. nov., sp. nov., a valerate-producing anaerobic bacterium isolated from the alimentary canal of a Japanese corbicula clam. Int. J. Syst. Evol. Microbiol. 2007, 57, 1840–1845. [Google Scholar] [CrossRef] [PubMed]
- Konikoff, T.; Gophna, U. Oscillospira: A central, enigmatic component of the human gut microbiota. Trends Microbiol. 2016, 24, 523–524. [Google Scholar] [CrossRef]
- Shen, J.; Ding, Y.; Yang, Z.; Zhang, X.; Zhao, M. Effects of changes on gut microbiota in children with acute Kawasaki disease. PeerJ 2020, 8, e9698. [Google Scholar] [CrossRef]
- Bui, T.P.N.; Troise, A.D.; Nijsse, B.; Roviello, G.N.; Fogliano, V.; de Vos, W.M. Intestinimonas-like bacteria are important butyrate producers that utilize Nε-fructosyllysine and lysine in formula-fed infants and adults. J. Funct. Foods 2020, 70, 103974. [Google Scholar] [CrossRef]
- Böck, A. Fermentation. In Encyclopedia of Microbiology; Elsevier: Amsterdam, The Netherlands, 2009; pp. 132–144. [Google Scholar] [CrossRef]
- Neis, E.; Dejong, C.; Rensen, S. The Role of microbial amino acid metabolism in host metabolism. Nutrients 2015, 7, 2930–2946. [Google Scholar] [CrossRef]
- Zhang, X.F. In Vitro Fermentation Model Was Used to Study Amino Acid Metabolism in Human Intestine. Master’s Thesis, Zhejiang Normal University, Jinhua, China, 2021. [Google Scholar] [CrossRef]
- Pereira, F.C.; Wasmund, K.; Cobankovic, I.; Jehmlich, N.; Herbold, C.W.; Lee, K.S.; Sziranyi, B.; Vesely, C.; Decker, T.; Stocker, R.; et al. Rational design of a microbial consortium of mucosal sugar utilizers reduces Clostridiodes difficile colonization. Nat. Commun. 2020, 11, 5104. [Google Scholar] [CrossRef]
- Meng, D.; Liang, L.; Song, H. Physiological function of short-chain fatty acids in the intestine. Chin. J. New Clin. Med. 2018, 11, 198–202. [Google Scholar]
- Chen, Y.; Wan, M.; Zhong, Y.; Gao, T.; Zhang, Y.; Yan, F.; Weng, Z. Partially hydrolyzed guar gum modulates gut microbiota, regulates the levels of neurotransmitters, and prevents cums-induced depressive-like behavior in mice. Mol. Nutr. Food Res. 2021, 65, 2100146. [Google Scholar] [CrossRef]
- Yan, T.; Nian, T.; Liao, Z.; Xiao, F.; Wu, B.; Bi, K.; Jia, Y. Antidepressant effects of a polysaccharide from okra (Abelmoschus esculentus (L) Moench) by anti-inflammation and rebalancing the gut microbiota. Int. J. Biol. Macromol. 2019, 144, 427–440. [Google Scholar] [CrossRef]
- Liu, J.; Fang, Y.; Cui, L.; Wang, Z.; Luo, Y.; Gao, C.; Ge, W.; Huang, T.; Wen, J.; Zhou, T. Butyrate emerges as a crucial effector of zhi-zi-chi decoctions to ameliorate depression via multiple pathways of brain-gut axis. Biomed. Pharmacother. 2022, 149, 112861. [Google Scholar] [CrossRef]
- Li, P.; Huang, W.; Yan, Y.N.; Cheng, W.; Meng, X. Acupuncture can play an antidepressant role by regulating the intestinal microbes and neurotransmitters in a rat model of depression. Med. Sci. Monit. Int. Med. J. Exp. Clin. Res. 2021, 27, e929027. [Google Scholar] [CrossRef]
- Li, Y.; Li, J.; Cheng, R.; Liu, H.; Zhao, Y.; Liu, Y.; Chen, Y.; Sun, Z.; Zhai, Z.; Wu, M.; et al. Alteration of the gut microbiome and correlated metabolism in a rat model of long-term depression. Front. Cell. Infect. Microbiol. 2023, 13, 1116277. [Google Scholar] [CrossRef]
- Cheng, R.; Xu, W.; Wang, J.; Tang, Z.; Zhang, M. The outer membrane protein amuc_1100 of akkermansia muciniphila alleviates the depression-like behavior of depressed mice induced by chronic stress. Biochem. Biophys. Res. Commun. 2021, 566, 170–176. [Google Scholar] [CrossRef]
- Zhang, W.; Qu, W.; Wang, H.; Yan, H. Antidepressants fluoxetine and amitriptyline induce alterations in intestinal microbiota and gut microbiome function in rats exposed to chronic unpredictable mild stress. Transl. Psychiatry 2021, 11, 131. [Google Scholar] [CrossRef] [PubMed]
- Chang, C.J.; Lin, C.S.; Lu, C.C.; Martel, J.; Ko, Y.F.; Ojcius, D.M.; Lai, H.C. Ganoderma lucidum reduces obesity in mice by modulating the composition of the gut microbiota. Nat. Commun. 2015, 6, 7489. [Google Scholar] [CrossRef] [PubMed]


Disclaimer/Publisher’s Note: The statements, opinions and data contained in all publications are solely those of the individual author(s) and contributor(s) and not of MDPI and/or the editor(s). MDPI and/or the editor(s) disclaim responsibility for any injury to people or property resulting from any ideas, methods, instructions or products referred to in the content. |
© 2024 by the authors. Licensee MDPI, Basel, Switzerland. This article is an open access article distributed under the terms and conditions of the Creative Commons Attribution (CC BY) license (https://creativecommons.org/licenses/by/4.0/).
Share and Cite
Hu, L.; Ye, W.; Deng, Q.; Wang, C.; Luo, J.; Huang, L.; Fang, Z.; Sun, L.; Gooneratne, R. Microbiome and Metabolite Analysis Insight into the Potential of Shrimp Head Hydrolysate to Alleviate Depression-like Behaviour in Growth-Period Mice Exposed to Chronic Stress. Nutrients 2024, 16, 1953. https://doi.org/10.3390/nu16121953
Hu L, Ye W, Deng Q, Wang C, Luo J, Huang L, Fang Z, Sun L, Gooneratne R. Microbiome and Metabolite Analysis Insight into the Potential of Shrimp Head Hydrolysate to Alleviate Depression-like Behaviour in Growth-Period Mice Exposed to Chronic Stress. Nutrients. 2024; 16(12):1953. https://doi.org/10.3390/nu16121953
Chicago/Turabian StyleHu, Lianhua, Weichang Ye, Qi Deng, Chen Wang, Jinjin Luo, Ling Huang, Zhijia Fang, Lijun Sun, and Ravi Gooneratne. 2024. "Microbiome and Metabolite Analysis Insight into the Potential of Shrimp Head Hydrolysate to Alleviate Depression-like Behaviour in Growth-Period Mice Exposed to Chronic Stress" Nutrients 16, no. 12: 1953. https://doi.org/10.3390/nu16121953
APA StyleHu, L., Ye, W., Deng, Q., Wang, C., Luo, J., Huang, L., Fang, Z., Sun, L., & Gooneratne, R. (2024). Microbiome and Metabolite Analysis Insight into the Potential of Shrimp Head Hydrolysate to Alleviate Depression-like Behaviour in Growth-Period Mice Exposed to Chronic Stress. Nutrients, 16(12), 1953. https://doi.org/10.3390/nu16121953