
Amelioration of Serum Aβ Levels and Cognitive Impairment in APPPS1 Transgenic Mice Following Symbiotic Administration
 , , , , and
Abstract
:1. Introduction
2. Materials and Methods
2.1. Animals
- Tg mice and Wt littermates fed with a standard diet, identified as Tg and Wt, respectively;
- Tg mice and Wt littermates fed with the standard diet enriched in prebiotics and probiotics, identified as Tg-T and Wt-T, respectively.
2.2. Drugs and Treatment
2.3. Prebiotic Formulation and Administration
2.4. Probiotic Formulation and Administration
2.5. Fecal Collection
2.6. Profiling of the Gut Microbiota
2.7. Behavioral Tests
2.8. Rotarod
2.9. Marble Burying
2.10. Nesting
2.11. Novel Object Recognition (NOR)
2.12. Barnes Maze
2.13. Step-Down Inhibitory Avoidance
2.14. Histology and Histochemistry
2.15. Aβ 1-42 Serum Dosage
2.16. Quantitative and Statistical Analysis
3. Results
3.1. Body Weight
3.2. Food/Water Intake and Fecal Production
3.3. Behavioral Tests
3.3.1. Rotarod
3.3.2. Marble Burying
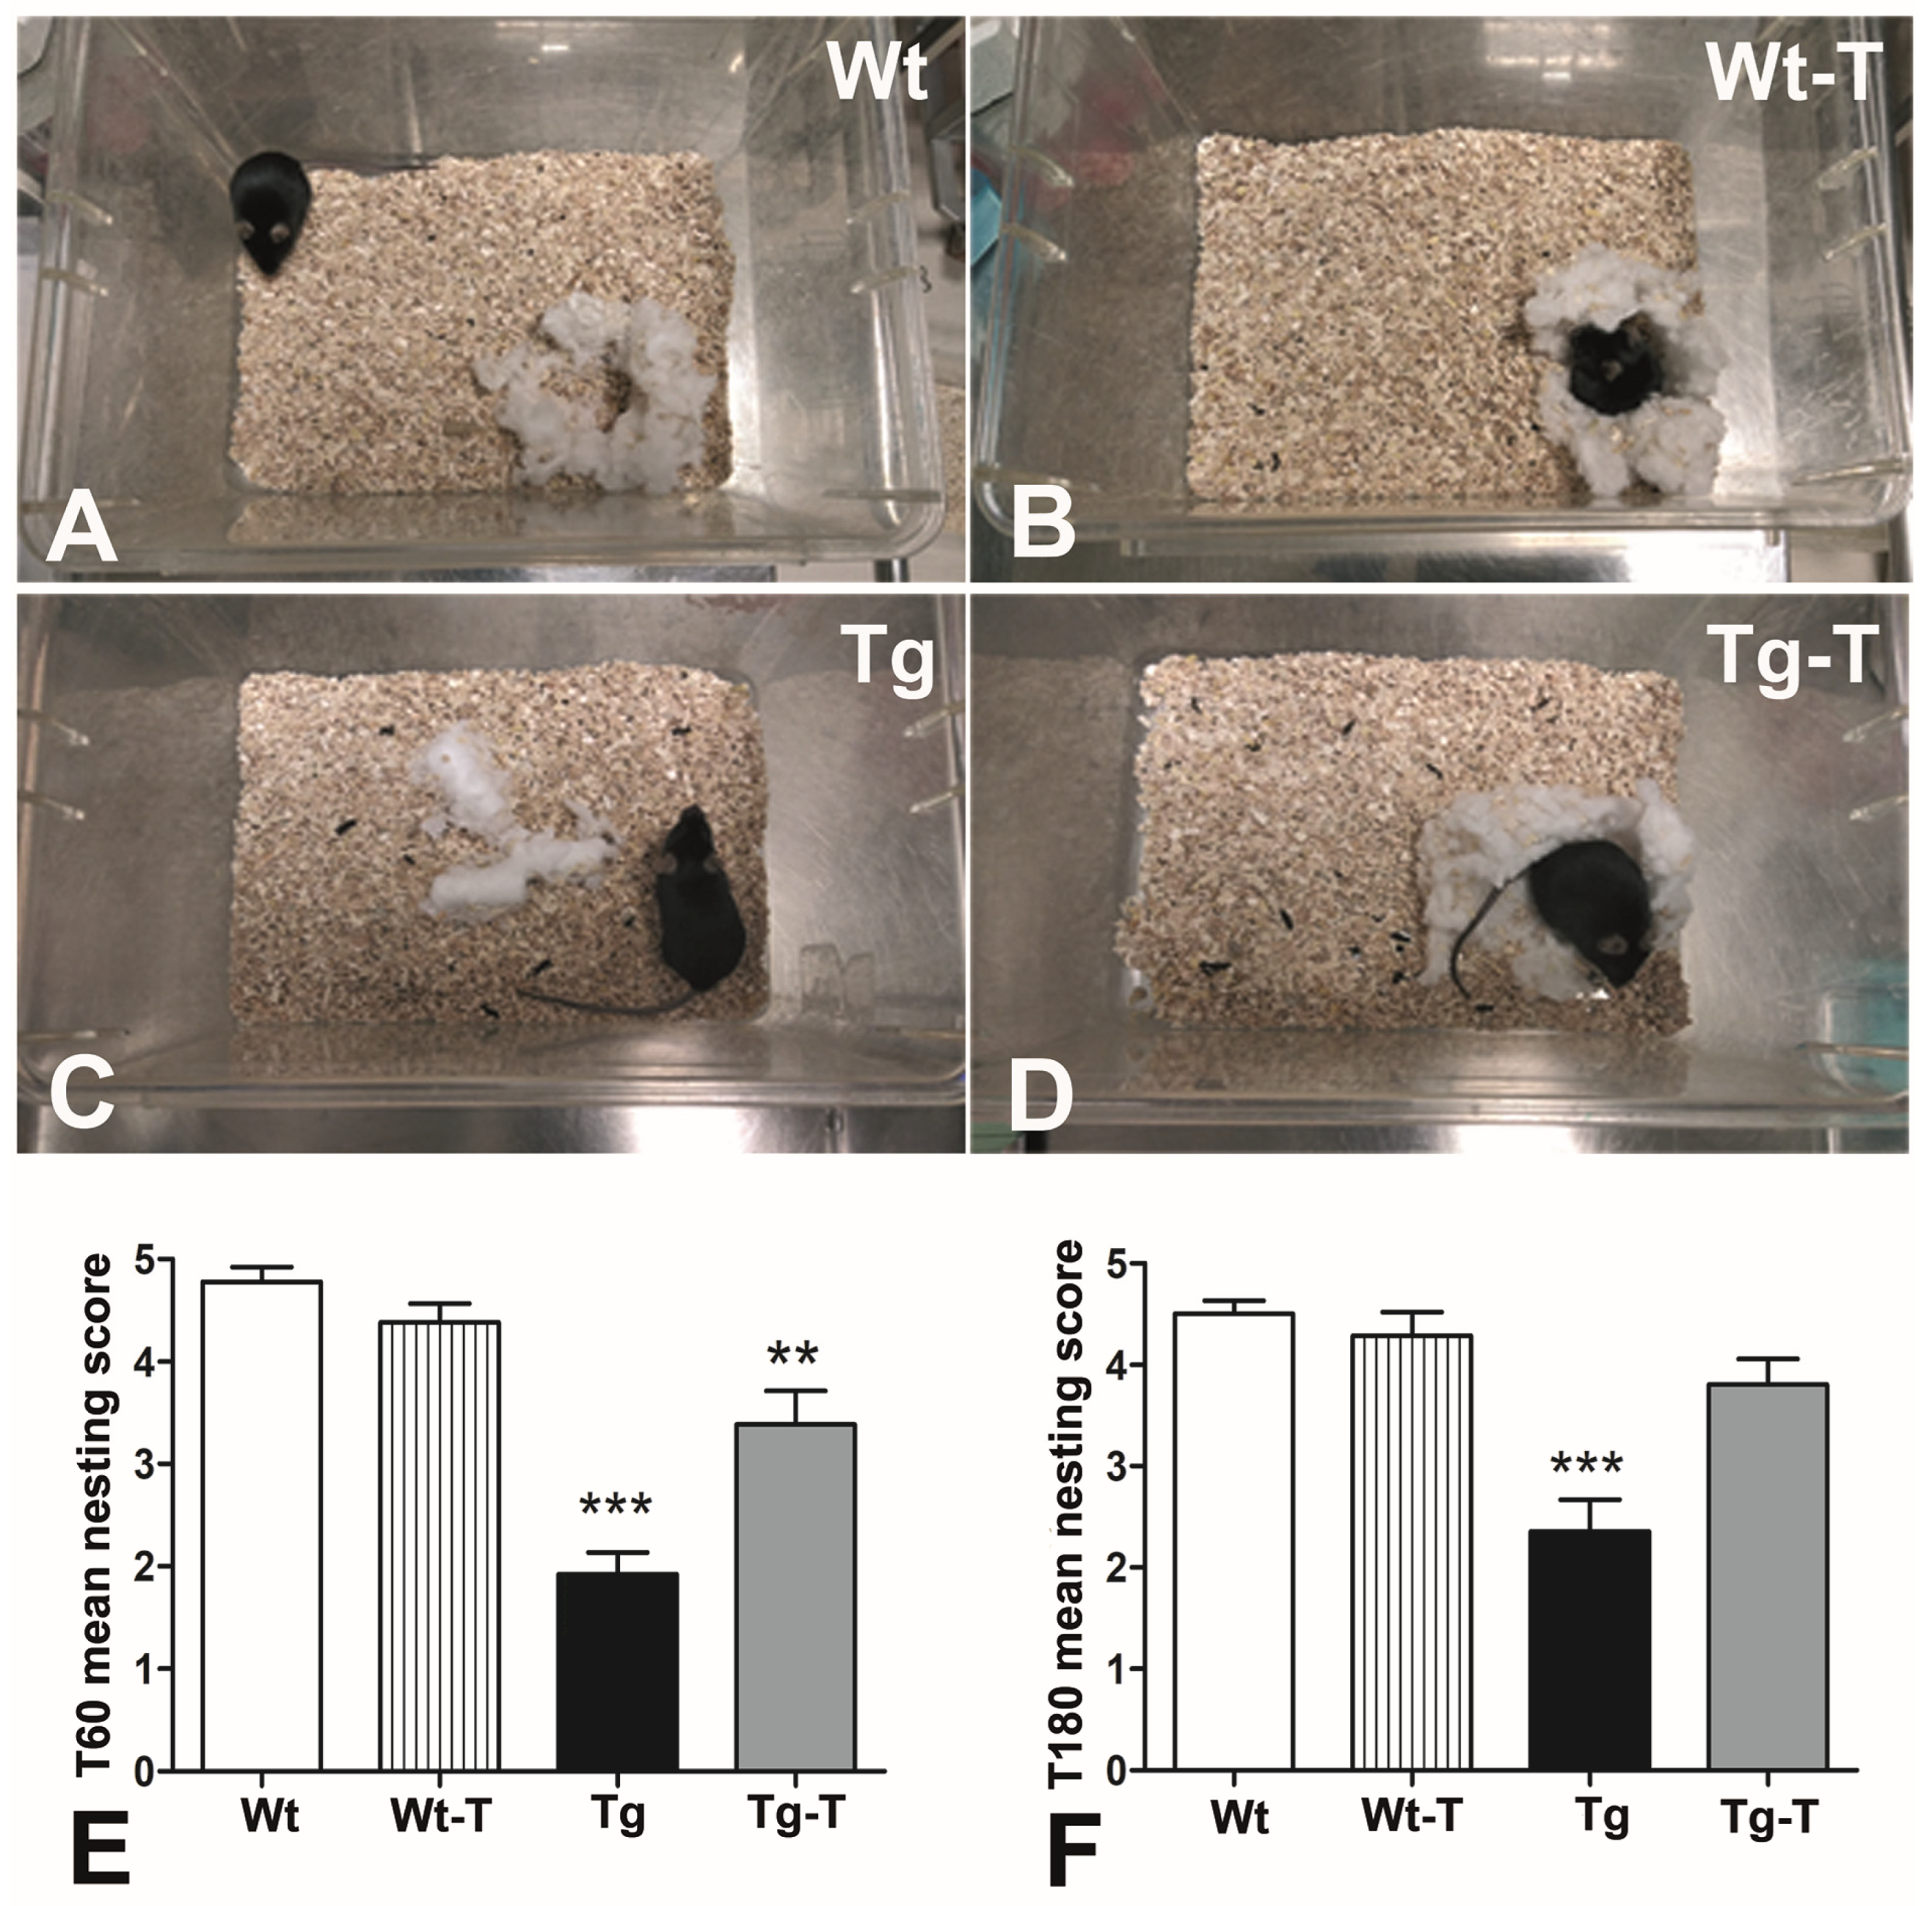
3.3.3. Nesting
3.3.4. Novel Object Recognition (NOR)
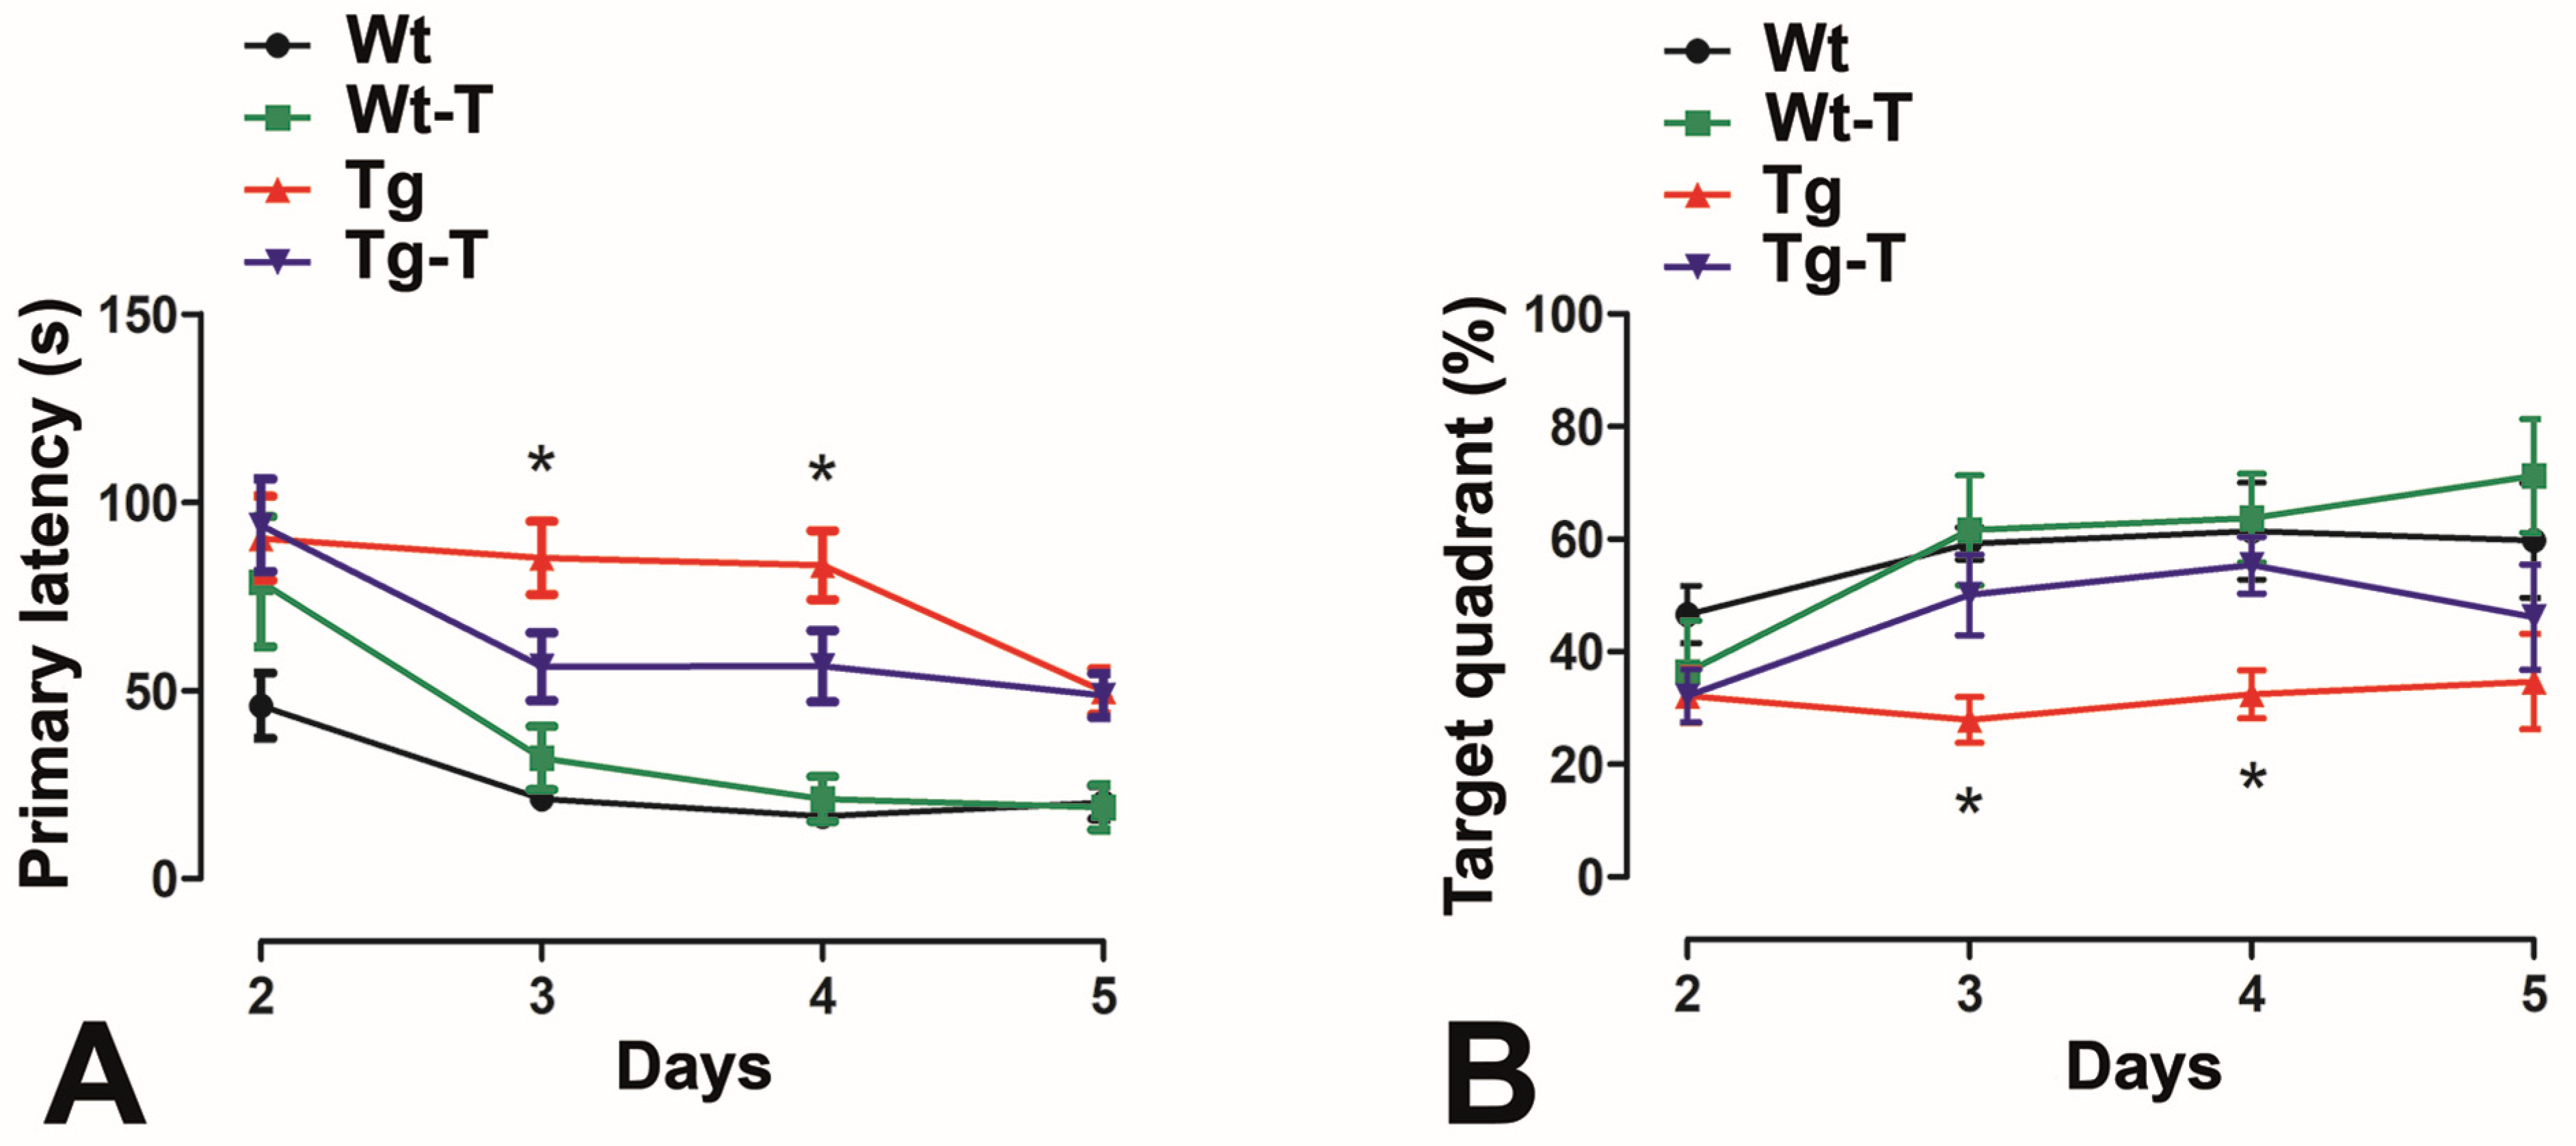
3.3.5. Barnes Maze
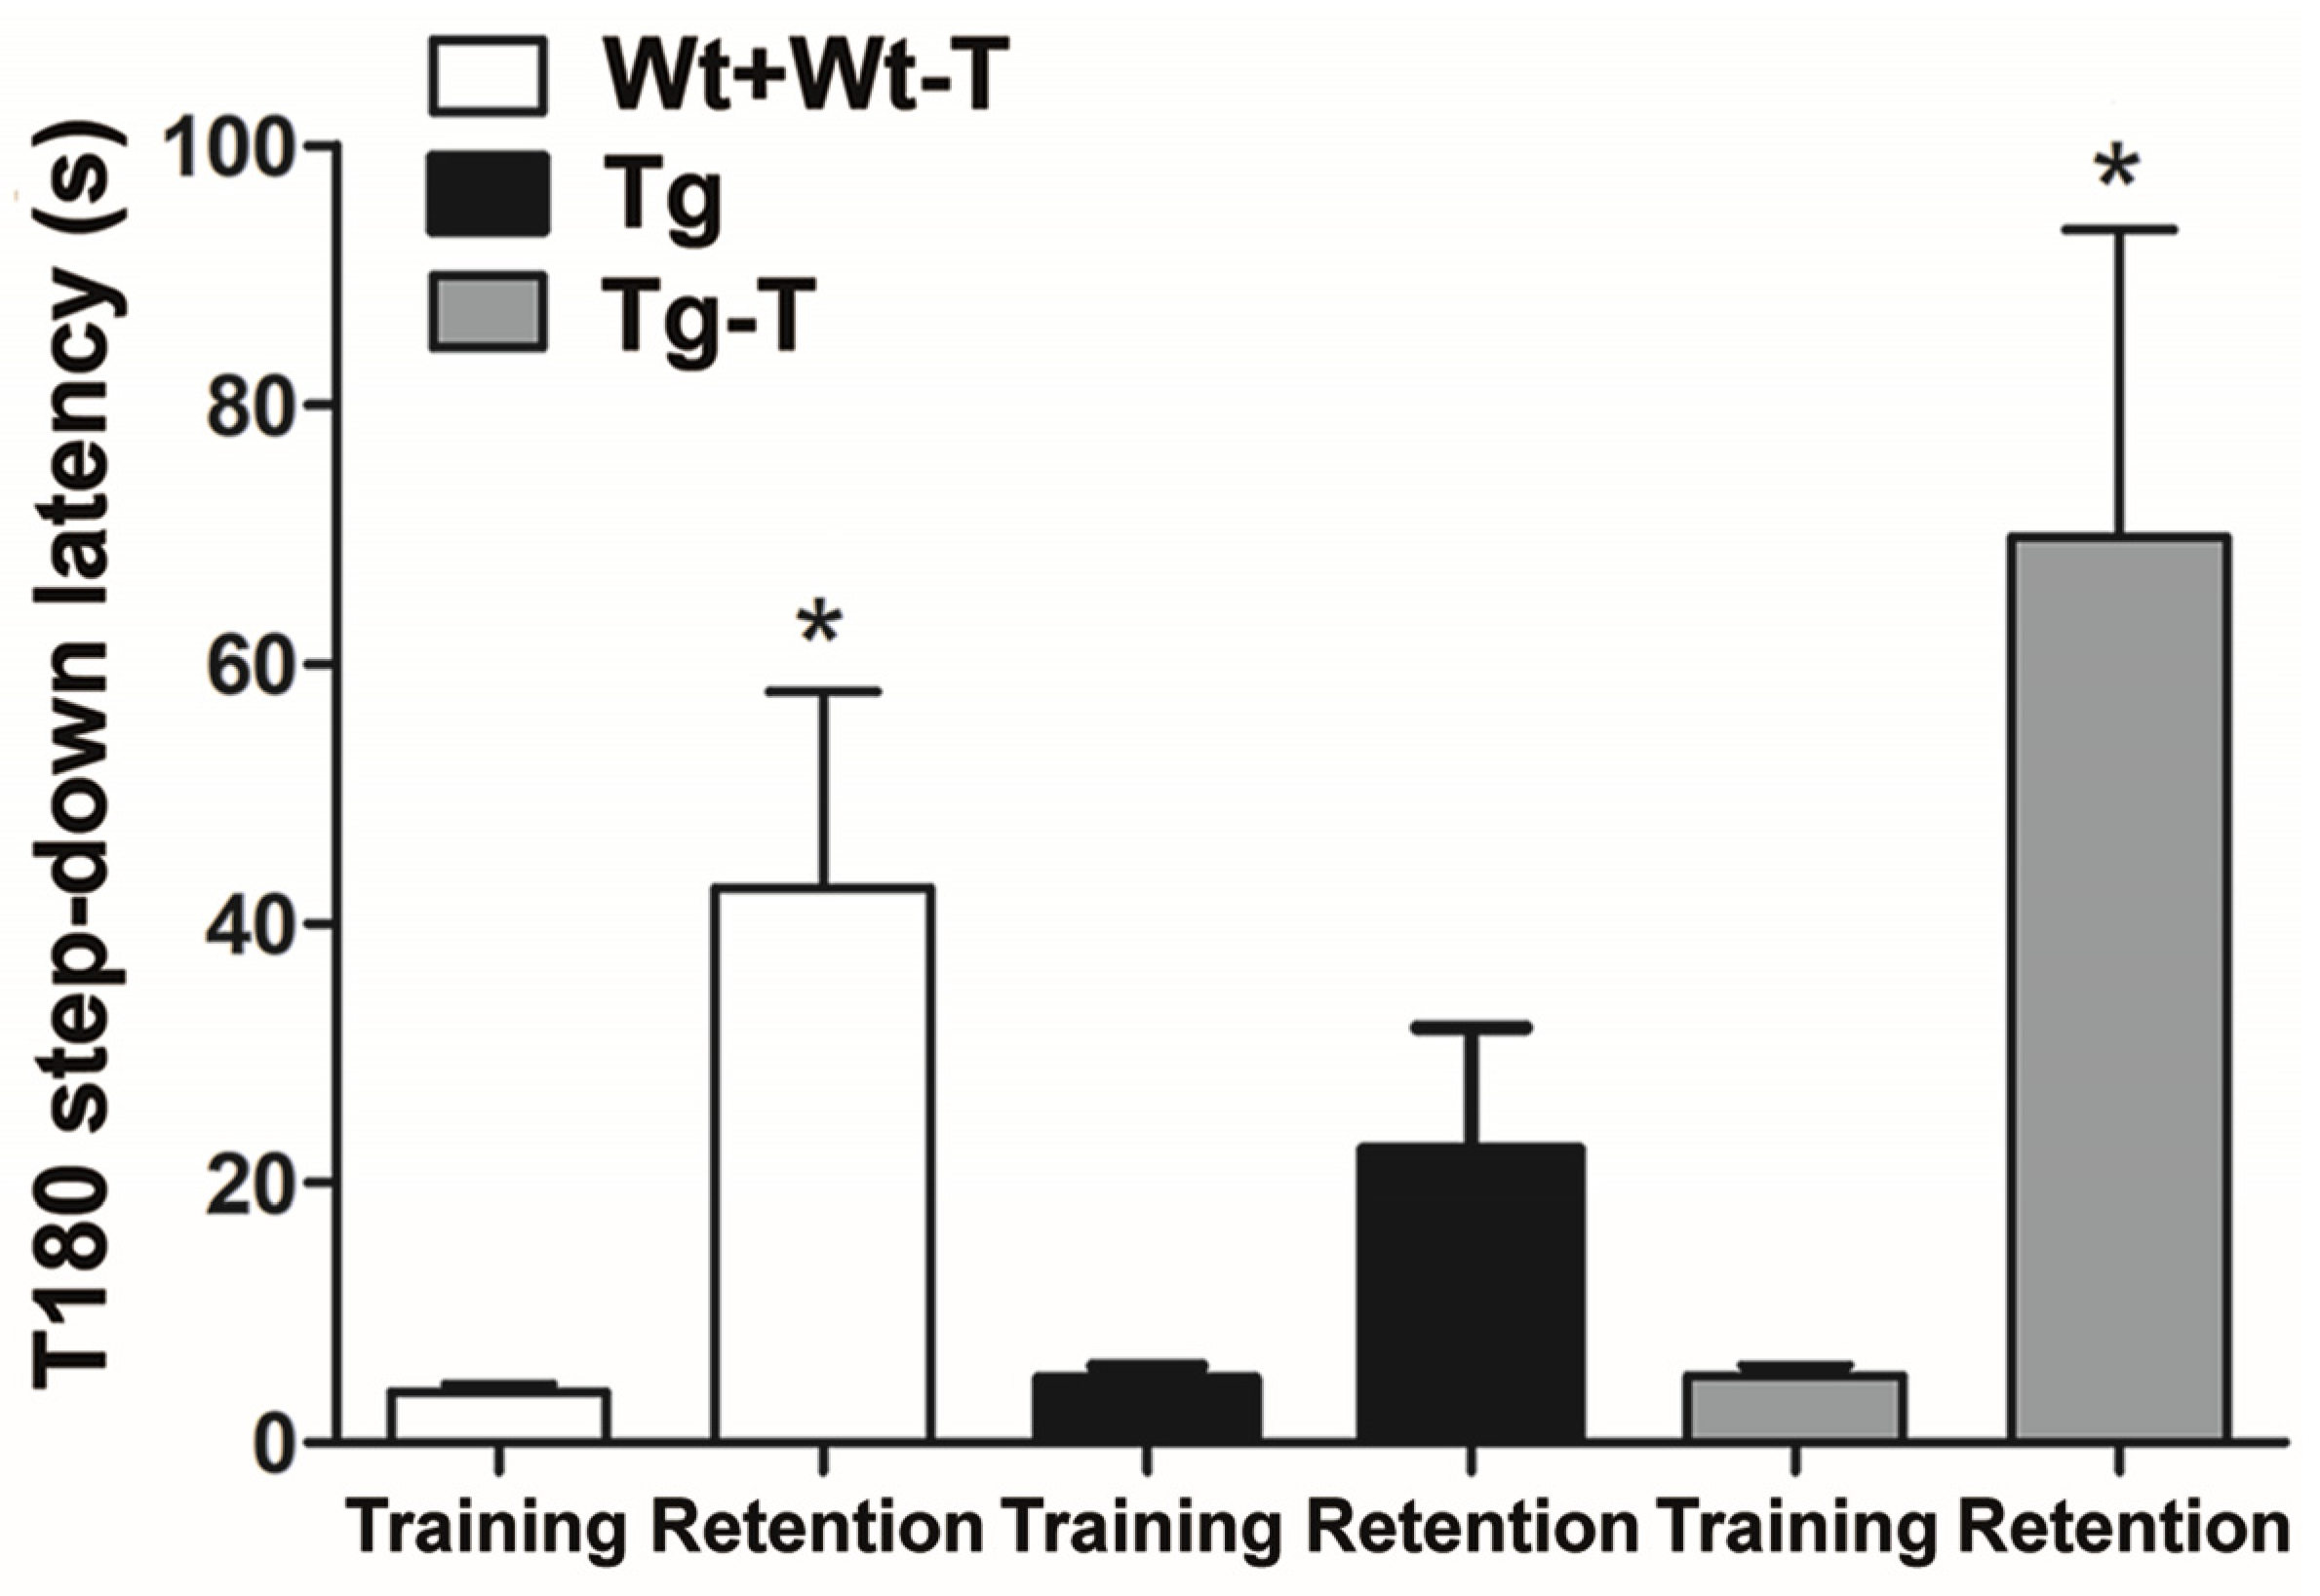
3.3.6. Step-Down Inhibitory Avoidance Test
3.4. Histology and Histochemistry
3.4.1. H&E Staining
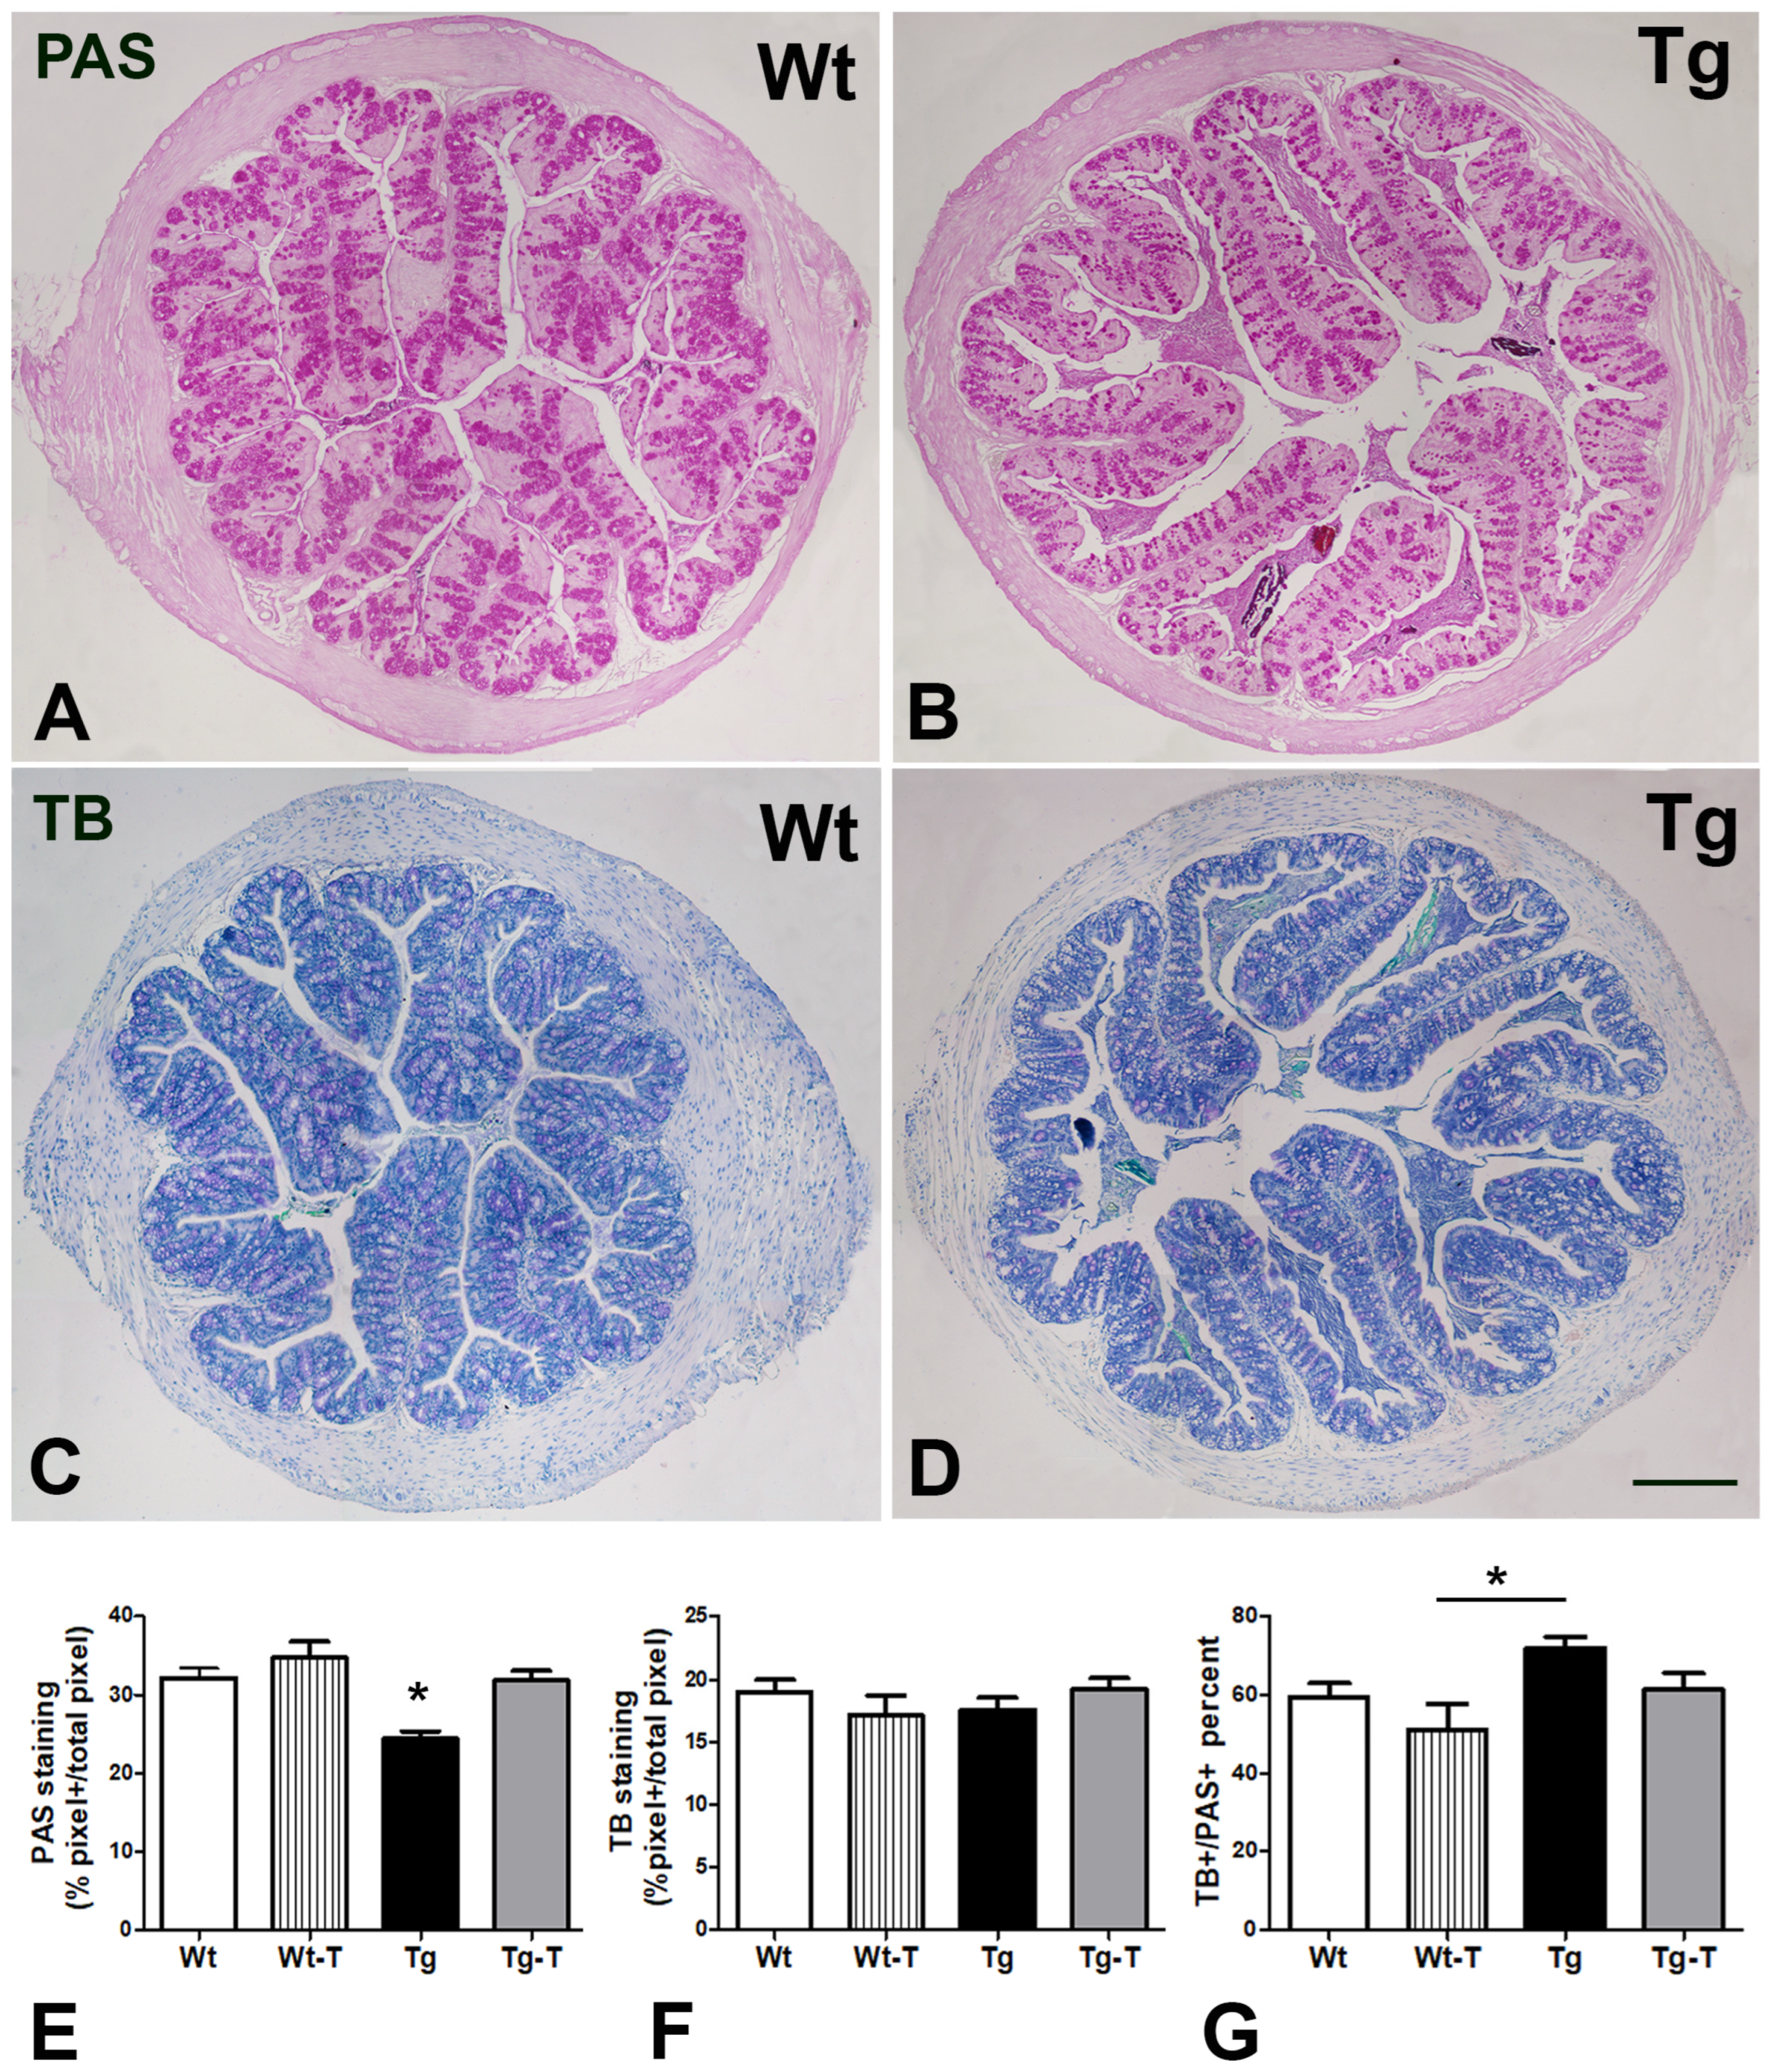
3.4.2. PAS and TB Staining
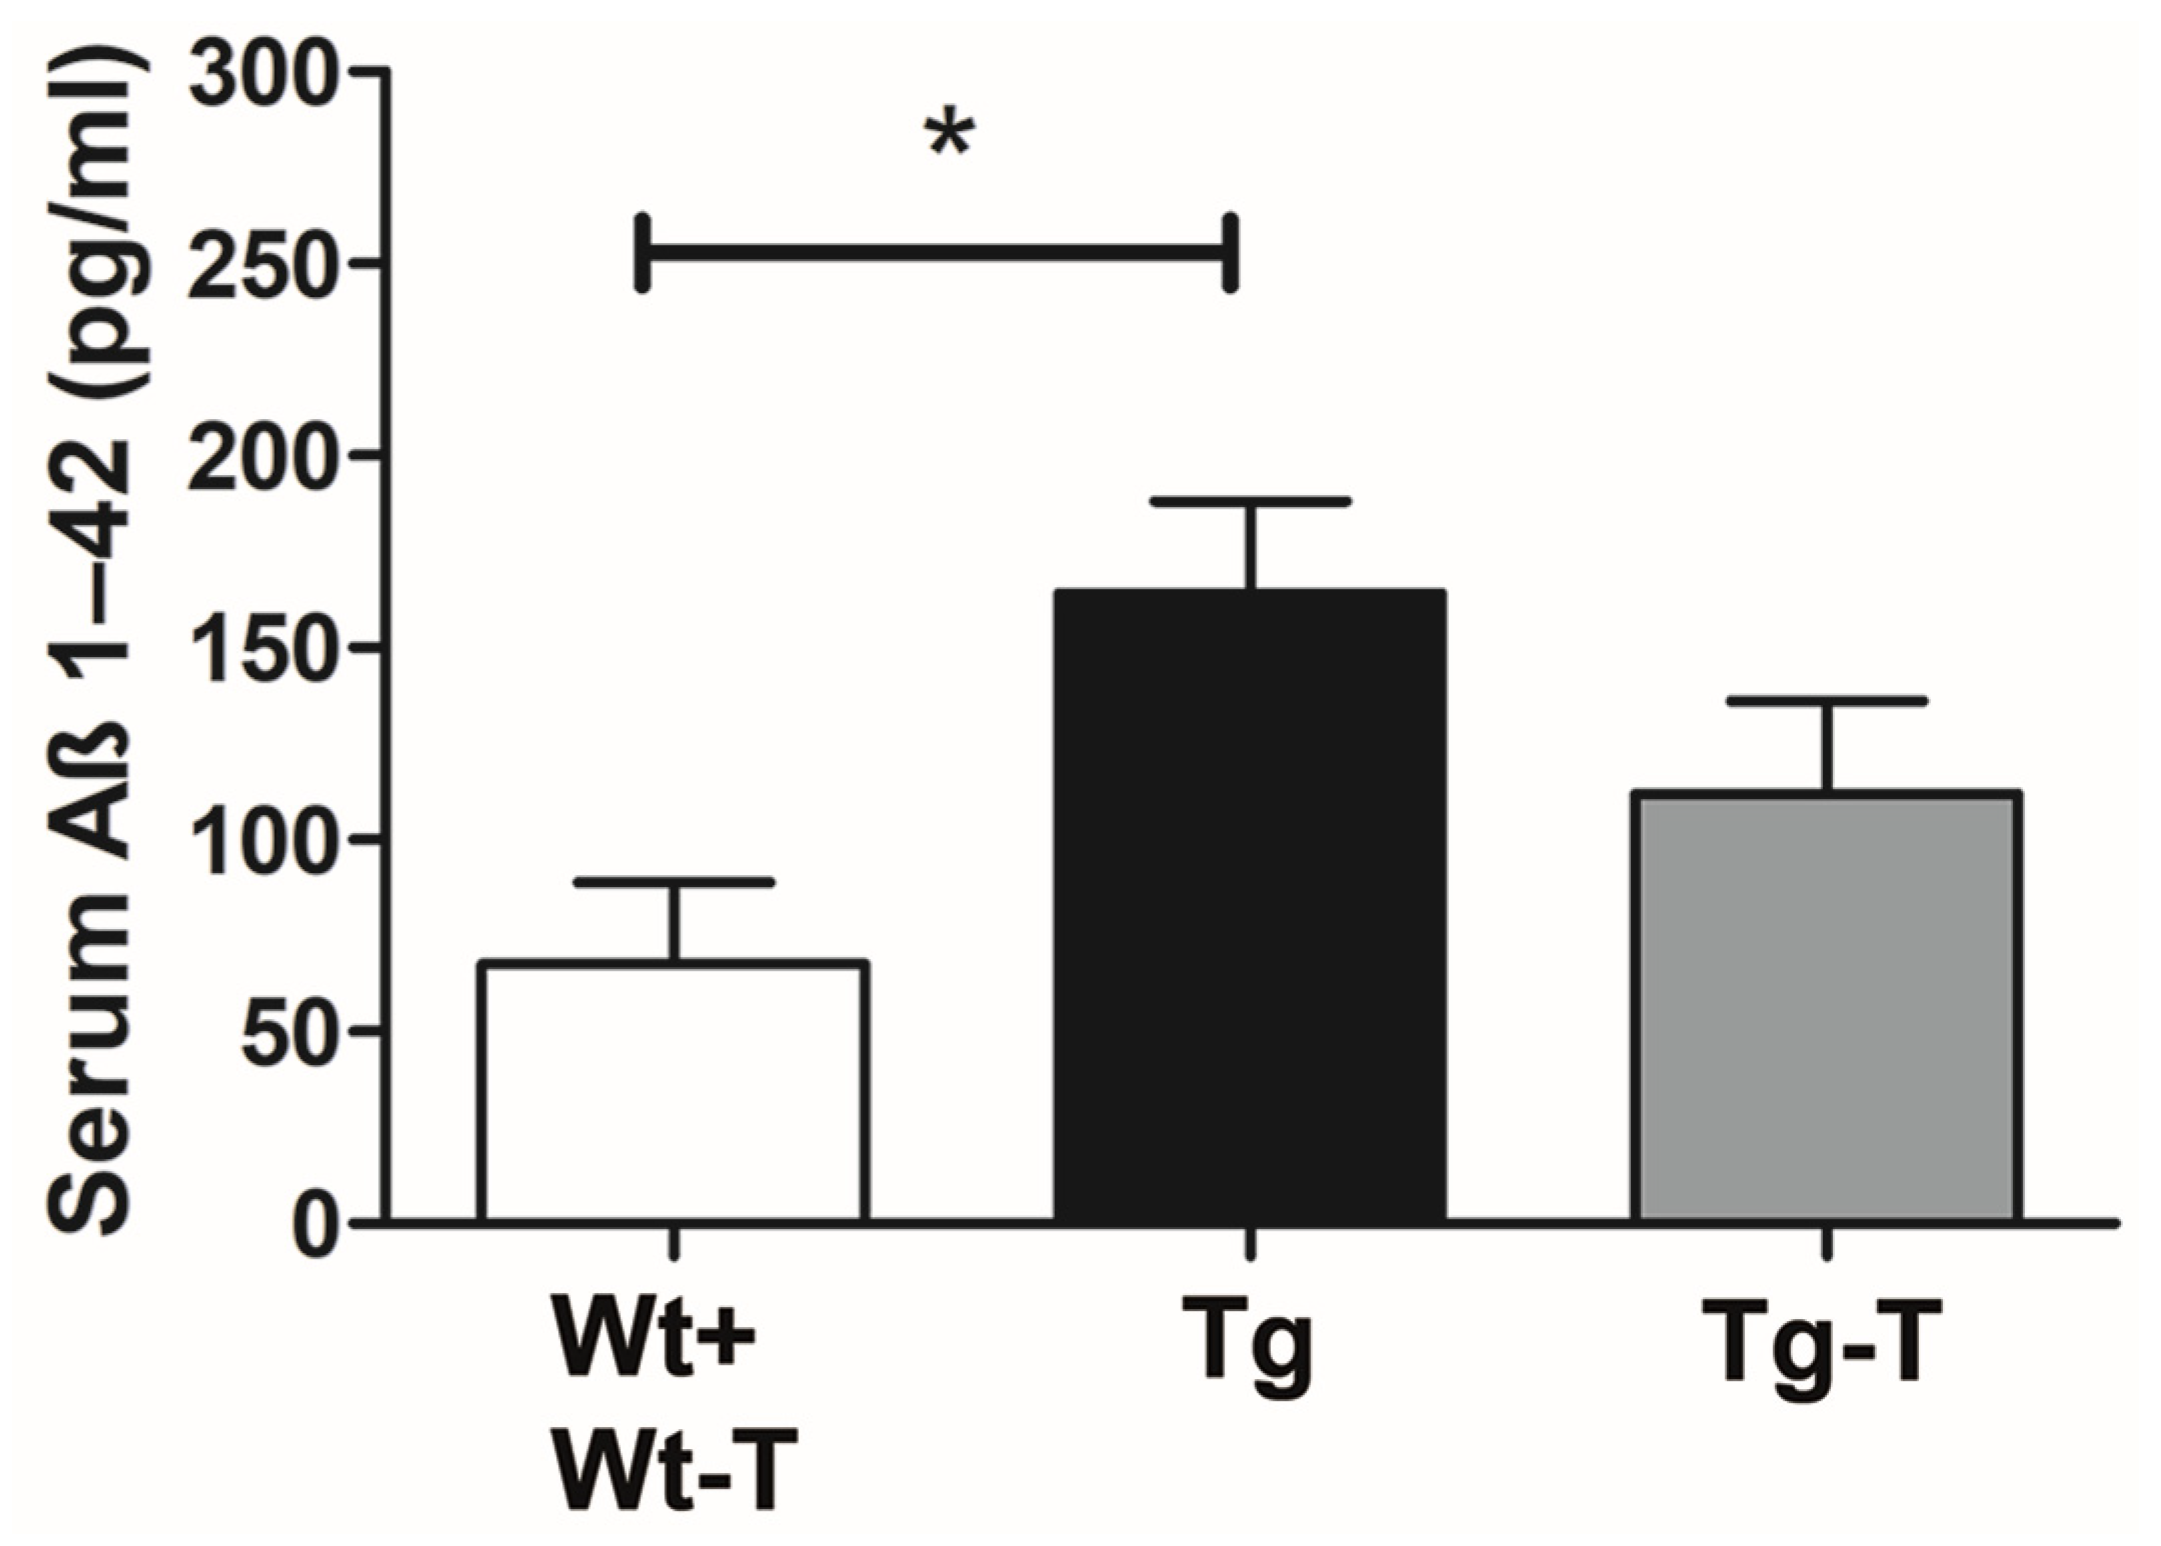
Aβ 1-42 Detection in Serum
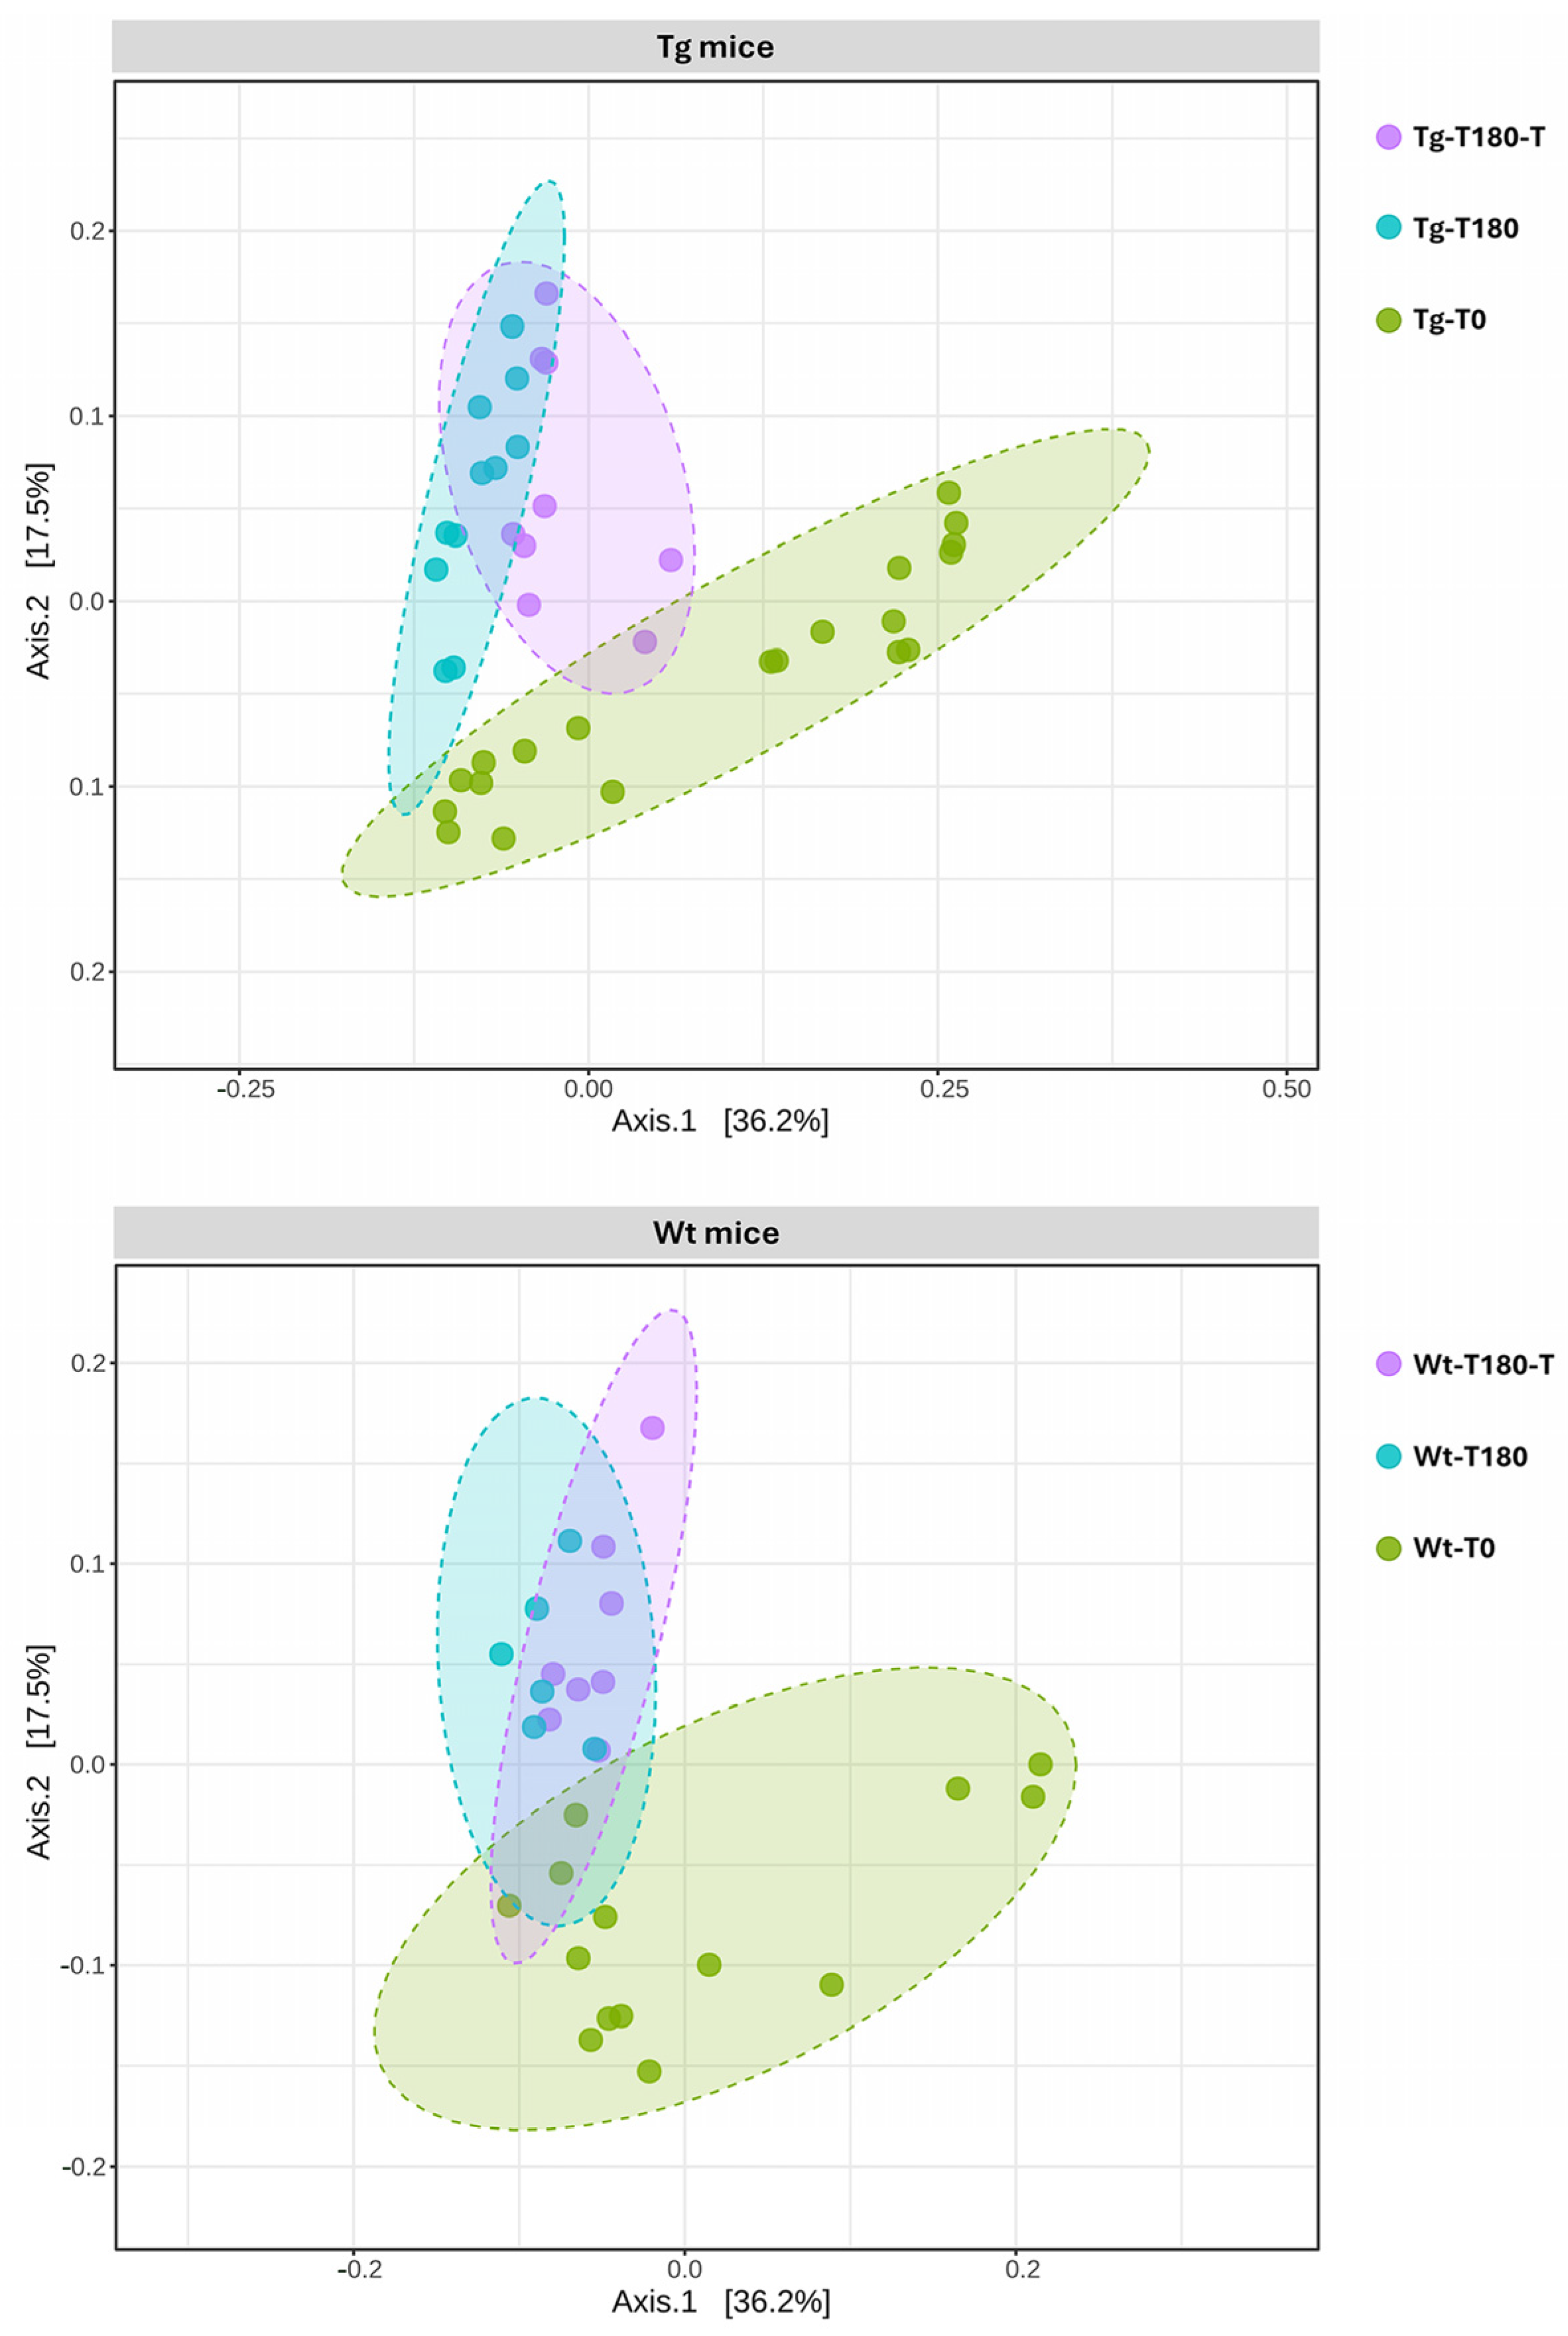
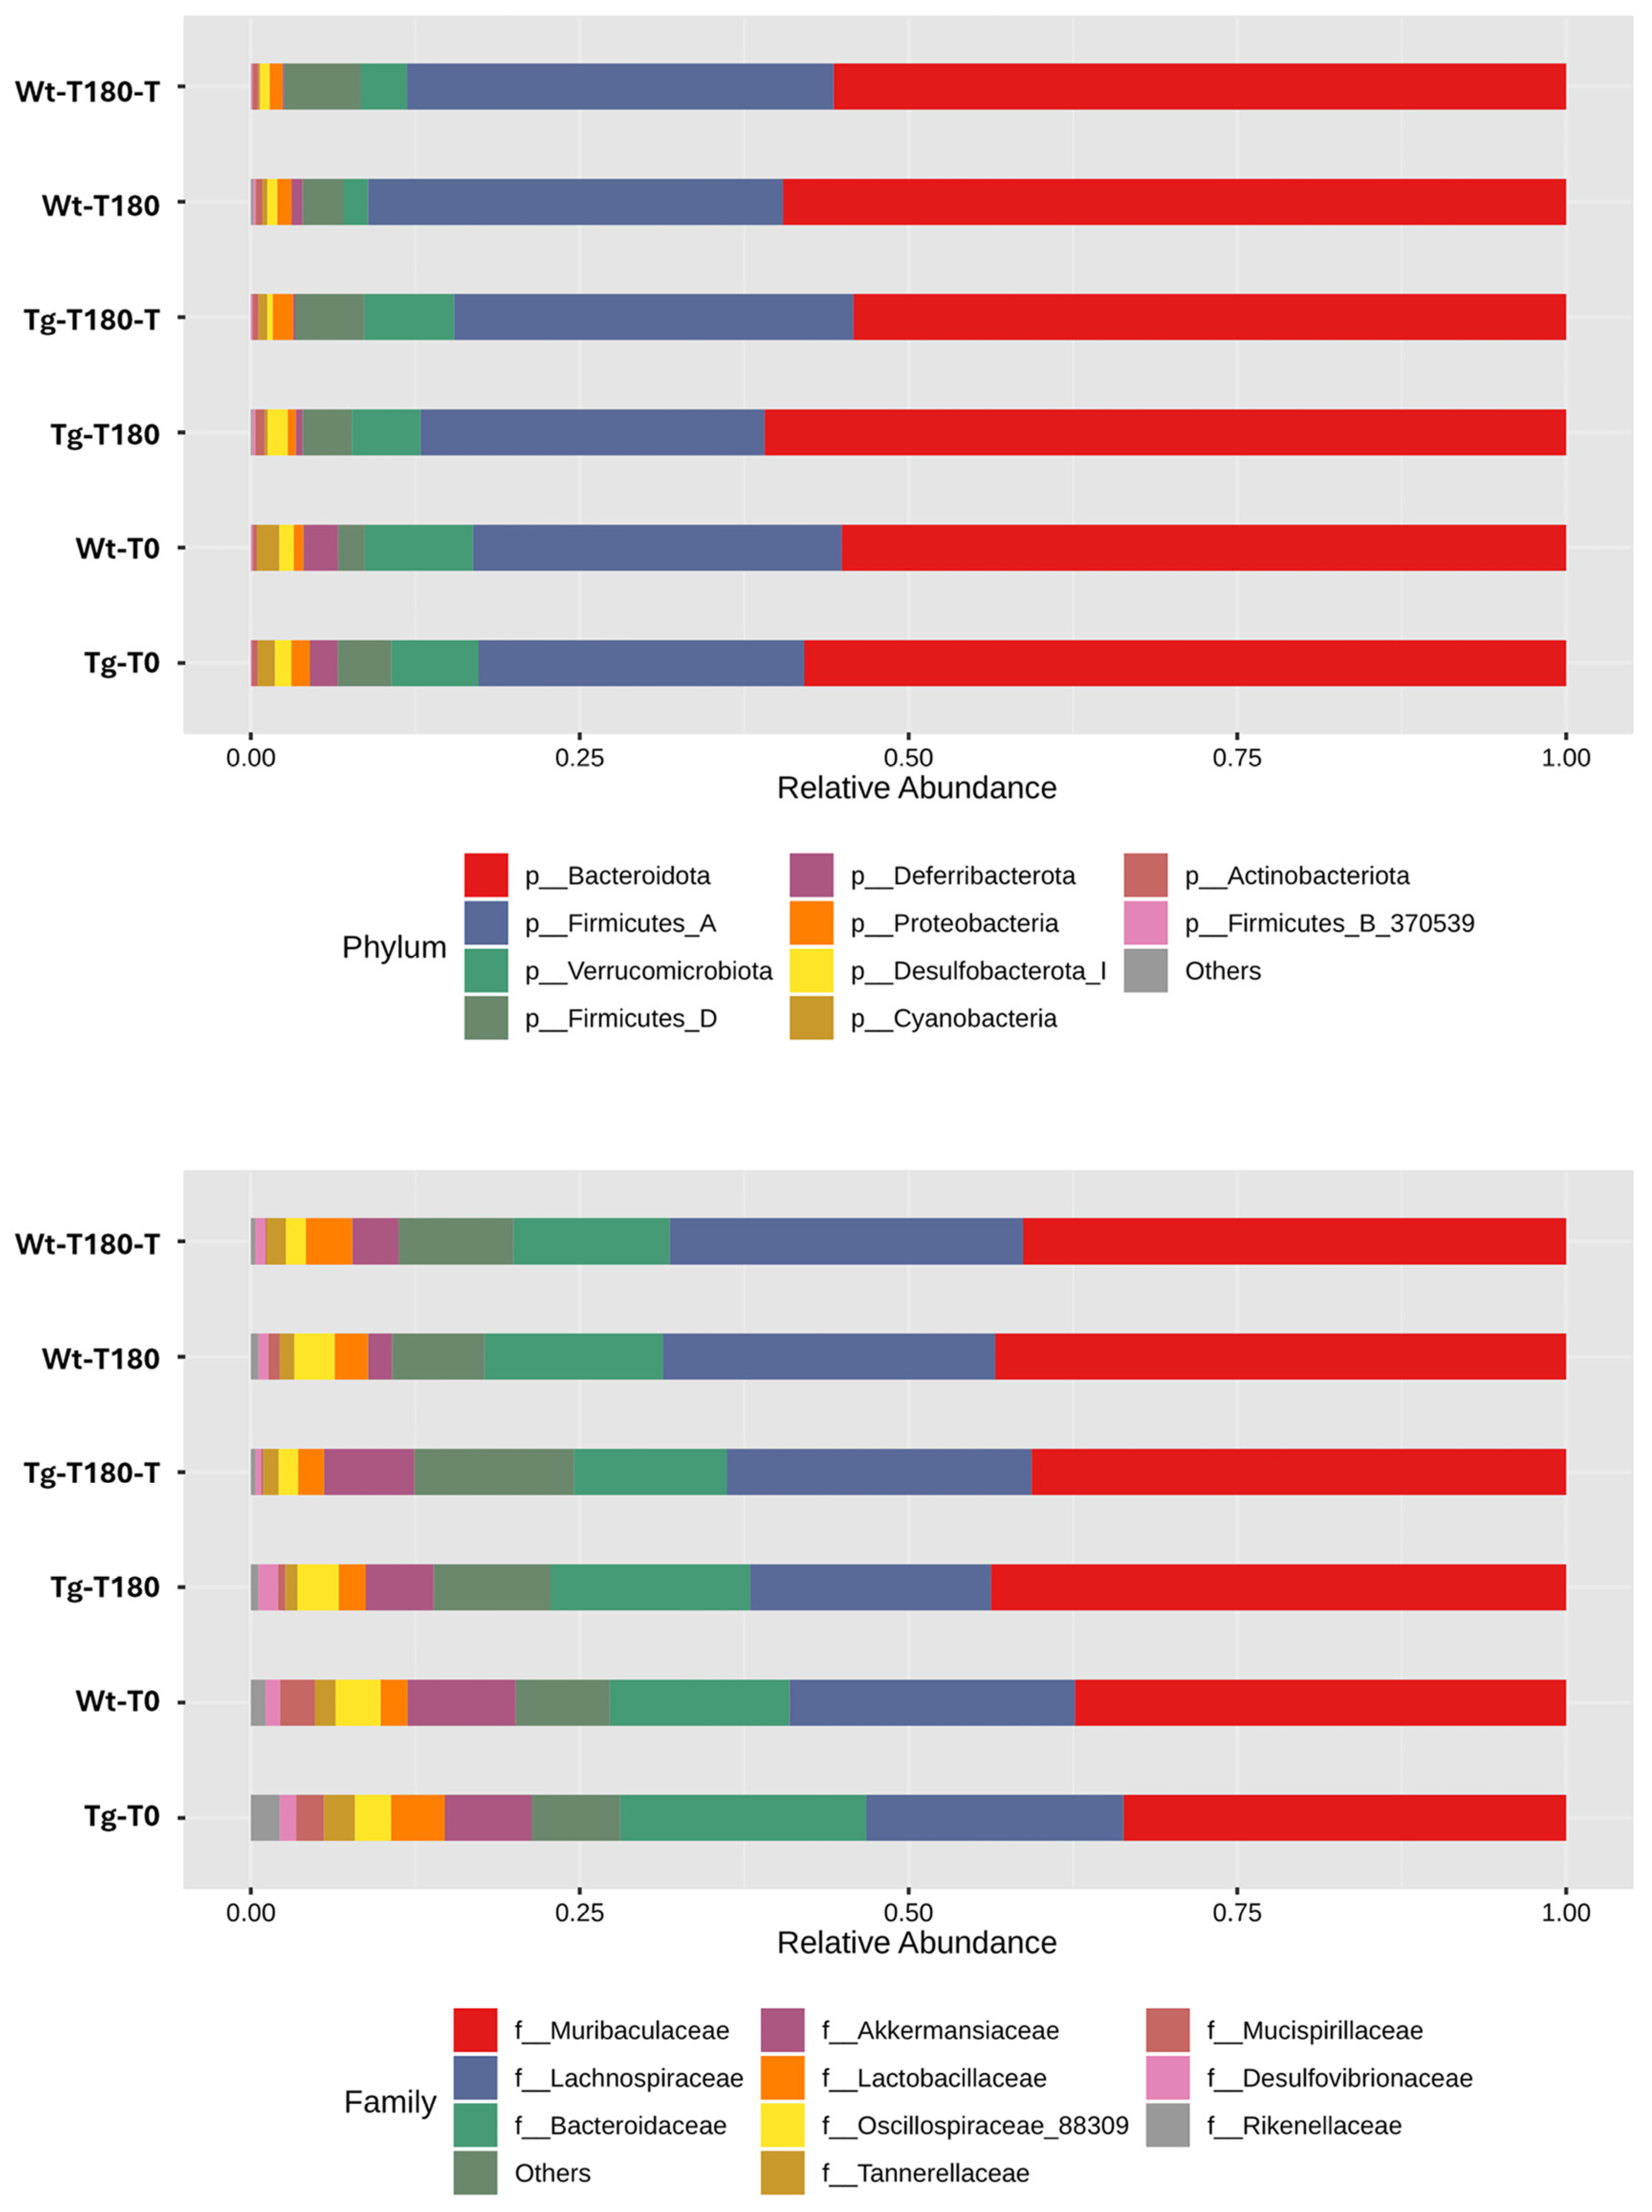
Profiling of the Gut Microbiota
4. Discussion
5. Conclusions
Supplementary Materials
Author Contributions
Funding
Institutional Review Board Statement
Informed Consent Statement
Data Availability Statement
Acknowledgments
Conflicts of Interest
References
- Deture, M.A.; Dickson, D.W. The Neuropathological Diagnosis of Alzheimer’s Disease. Mol. Neurodegener. 2019, 14, 32. [Google Scholar] [CrossRef] [PubMed]
- Koyama, A.; Okereke, O.I.; Yang, T.; Blacker, D.; Selkoe, D.J.; Grodstein, F. Plasma Amyloid-β as a Predictor of Dementia and Cognitive Decline: A Systematic Review and Meta-Analysis. Arch. Neurol. 2012, 69, 824–831. [Google Scholar] [CrossRef] [PubMed]
- Hayden, E.Y.; Teplow, D.B. Amyloid β-Protein Oligomers and Alzheimer’s Disease. Alzheimer’s Res. Ther. 2013, 5, 60. [Google Scholar] [CrossRef]
- Rocchi, A.; Orsucci, D.; Tognoni, G.; Ceravolo, R.; Siciliano, G. The Role of Vascular Factors in Late-Onset Sporadic Alzheimers Disease. Genetic and Molecular Aspects. Curr. Alzheimer Res. 2009, 6, 224–237. [Google Scholar] [CrossRef]
- Nakamura, A.; Kaneko, N.; Villemagne, V.L.; Kato, T.; Doecke, J.; Doré, V.; Fowler, C.; Li, Q.X.; Martins, R.; Rowe, C.; et al. High Performance Plasma Amyloid-β Biomarkers for Alzheimer’s Disease. Nature 2018, 554, 249–254. [Google Scholar] [CrossRef] [PubMed]
- Galloway, S.; Takechi, R.; Nesbit, M.; Pallebage-Gamarallage, M.M.; Lam, V.; Mamo, J.C.L. The Differential Effects of Fatty Acids on Enterocytic Abundance of Amyloid-Beta. Lipids Health Dis. 2019, 18, 209. [Google Scholar] [CrossRef]
- Jin, J.; Xu, Z.; Zhang, L.; Zhang, C.; Zhao, X.; Mao, Y.; Zhang, H.; Liang, X.; Wu, J.; Yang, Y.; et al. Gut-Derived β-Amyloid: Likely a Centerpiece of the Gut–Brain Axis Contributing to Alzheimer’s Pathogenesis. Gut Microbes 2023, 15, 2167172. [Google Scholar] [CrossRef]
- Willyard, C. How Gut Microbes Could Drive Brain Disorders. Nature 2021, 590, 22–25. [Google Scholar] [CrossRef] [PubMed]
- Giovannini, M.G.; Lana, D.; Traini, C.; Vannucchi, M.G. The Microbiota–Gut–Brain Axis and Alzheimer Disease. From Dysbiosis to Neurodegeneration: Focus on the Central Nervous System Glial Cells. J. Clin. Med. 2021, 10, 2358. [Google Scholar] [CrossRef]
- Strandwitz, P. Neurotransmitter Modulation by the Gut Microbiota. Brain Res. 2018, 1693, 128–133. [Google Scholar] [CrossRef]
- Sharon, G.; Sampson, T.R.; Geschwind, D.H.; Mazmanian, S.K. The Central Nervous System and the Gut Microbiome. Cell 2016, 167, 915–932. [Google Scholar] [CrossRef] [PubMed]
- Pigrau, M.; Rodiño-Janeiro, B.K.; Casado-Bedmar, M.; Lobo, B.; Vicario, M.; Santos, J.; Alonso-Cotoner, C. The Joint Power of Sex and Stress to Modulate Brain-Gut-Microbiota Axis and Intestinal Barrier Homeostasis: Implications for Irritable Bowel Syndrome. Neurogastroenterol. Motil. 2016, 28, 463–486. [Google Scholar] [CrossRef] [PubMed]
- Moloney, R.D.; Johnson, A.C.; O’Mahony, S.M.; Dinan, T.G.; Greenwood-Van Meerveld, B.; Cryan, J.F. Stress and the Microbiota-Gut-Brain Axis in Visceral Pain: Relevance to Irritable Bowel Syndrome. CNS Neurosci. Ther. 2016, 22, 102–117. [Google Scholar] [CrossRef] [PubMed]
- Sun, J.; Xu, J.; Yang, B.; Chen, K.; Kong, Y.; Fang, N.; Gong, T.; Wang, F.; Ling, Z.; Liu, J. Effect of Clostridium butyricum against Microglia-Mediated Neuroinflammation in Alzheimer’s Disease via Regulating Gut Microbiota and Metabolites Butyrate. Mol. Nutr. Food Res. 2020, 64, e1900636. [Google Scholar] [CrossRef] [PubMed]
- Harach, T.; Marungruang, N.; Duthilleul, N.; Cheatham, V.; Mc Coy, K.D.; Frisoni, G.; Neher, J.J.; Fåk, F.; Jucker, M.; Lasser, T.B.T. Reduction of Abeta Amyloid Pathology in APPPS1 Transgenic Mice in the Absence of Gut Microbiota. Sci. Rep. 2017, 49, 41802. [Google Scholar] [CrossRef] [PubMed]
- Cattaneo, A.; Cattane, N.; Galluzzi, S.; Provasi, S.; Lopizzo, N.; Festari, C.; Ferrari, C.; Guerra, U.P.; Paghera, B.; Muscio, C.; et al. Association of Brain Amyloidosis with Pro-Inflammatory Gut Bacterial Taxa and Peripheral Inflammation Markers in Cognitively Impaired Elderly. Neurobiol. Aging 2017, 49, 60–68. [Google Scholar] [CrossRef] [PubMed]
- Friedland, R.P.; Chapman, M.R. The Role of Microbial Amyloid in Neurodegeneration. PLoS Pathog. 2017, 13, e1006654. [Google Scholar] [CrossRef] [PubMed]
- Mancuso, C.; Santangelo, R. Alzheimer’s Disease and Gut Microbiota Modifications: The Long Way between Preclinical Studies and Clinical Evidence. Pharmacol. Res. 2018, 129, 329–336. [Google Scholar] [CrossRef] [PubMed]
- Pistollato, F.; Cano, S.S.; Elio, I.; Vergara, M.M.; Giampieri, F.; Battino, M. Role of Gut Microbiota and Nutrients in Amyloid Formation and Pathogenesis of Alzheimer Disease. Nutr. Rev. 2016, 74, 624–634. [Google Scholar] [CrossRef]
- Vogt, N.M.; Kerby, R.L.; Dill-McFarland, K.A.; Harding, S.J.; Merluzzi, A.P.; Johnson, S.C.; Carlsson, C.M.; Asthana, S.; Zetterberg, H.; Blennow, K.; et al. Gut Microbiome Alterations in Alzheimer’s Disease. Sci. Rep. 2017, 7, 13537. [Google Scholar] [CrossRef]
- Pantano, D.; Luccarini, I.; Nardiello, P.; Servili, M.; Stefani, M.; Casamenti, F. Oleuropein Aglycone and Polyphenols from Olive Mill Waste Water Ameliorate Cognitive Deficits and Neuropathology. Br. J. Clin. Pharmacol. 2017, 83, 54–62. [Google Scholar] [CrossRef] [PubMed]
- Bonfili, L.; Cecarini, V.; Cuccioloni, M.; Angeletti, M.; Berardi, S.; Scarpona, S.; Rossi, G.; Eleuteri, A.M. SLAB51 Probiotic Formulation Activates SIRT1 Pathway Promoting Antioxidant and Neuroprotective Effects in an AD Mouse Model. Mol. Neurobiol. 2018, 55, 7987–8000. [Google Scholar] [CrossRef]
- Bonfili, L.; Cecarini, V.; Gogoi, O.; Gong, C.; Cuccioloni, M.; Angeletti, M.; Rossi, G.; Eleuteri, A.M. Microbiota Modulation as Preventative and Therapeutic Approach in Alzheimer’s Disease. FEBS J. 2021, 288, 2836–2855. [Google Scholar] [CrossRef] [PubMed]
- Ou, Z.; Deng, L.; Lu, Z.; Wu, F.; Liu, W.; Huang, D.; Peng, Y. Protective Effects of Akkermansia muciniphila on Cognitive Deficits and Amyloid Pathology in a Mouse Model of Alzheimer’s Disease. Nutr. Diabetes 2020, 10, 12. [Google Scholar] [CrossRef] [PubMed]
- Zhu, G.; Zhao, J.; Zhang, H.; Chen, W.; Wang, G. Probiotics for Mild Cognitive Impairment and Alzheimer’s Disease: A Systematic Review and Meta-Analysis. Foods 2021, 10, 1672. [Google Scholar] [CrossRef]
- Wu, Y.; Niu, X.; Li, P.; Tong, T.; Wang, Q.; Zhang, M.; Li, Y.; Liu, J.; Li, Z. Lactobacillaceae Improve Cognitive Dysfunction via Regulating Gut Microbiota and Suppressing Aβ Deposits and Neuroinflammation in APP/PS1 Mice. Arch. Microbiol. 2023, 205, 118. [Google Scholar] [CrossRef]
- Radde, R.; Bolmont, T.; Kaeser, S.A.; Coomaraswamy, J.; Lindau, D.; Stoltze, L.; Calhoun, M.E.; Jäggi, F.; Wolburg, H.; Gengler, S.; et al. Aβ42-Driven Cerebral Amyloidosis in Transgenic Mice Reveals Early and Robust Pathology. EMBO Rep. 2006, 7, 940–946. [Google Scholar] [CrossRef] [PubMed]
- Rupp, N.J.; Wegenast-Braun, B.M.; Radde, R.; Calhoun, M.E.; Jucker, M. Early Onset Amyloid Lesions Lead to Severe Neuritic Abnormalities and Local, but Not Global Neuron Loss in APPPS1 Transgenic Mice. Neurobiol. Aging 2011, 32, 2324.e1–2324.e6. [Google Scholar] [CrossRef] [PubMed]
- Mao, B.; Li, D.; Zhao, J.; Liu, X.; Gu, Z.; Chen, Y.Q.; Zhang, H.; Chen, W. Metagenomic Insights into the Effects of Fructo-Oligosaccharides (FOS) on the Composition of Fecal Microbiota in Mice. J. Agric. Food Chem. 2015, 63, 856–863. [Google Scholar] [CrossRef]
- Gui, Q.F.; Lu, H.F.; Zhang, C.X.; Xu, Z.R.; Yang, Y.M. Well-Balanced Commensal Microbiota Contributes to Anti-Cancer Response in a Lung Cancer Mouse Model. Genet. Mol. Res. 2015, 14, 5642–5651. [Google Scholar] [CrossRef]
- Verdenelli, M.C.; Ghelfi, F.; Silvi, S.; Orpianesi, C.; Cecchini, C.; Cresci, A. Probiotic Properties of Lactobacillus Rhamnosus and Lactobacillus paracasei Isolated from Human Faeces. Eur. J. Nutr. 2009, 48, 355–363. [Google Scholar] [CrossRef]
- Bolyen, E.; Rideout, J.R.; Dillon, M.R.; Bokulich, N.A.; Abnet, C.C.; Al-Ghalith, G.A.; Alexander, H.; Alm, E.J.; Arumugam, M.; Asnicar, F.; et al. Reproducible, Interactive, Scalable and Extensible Microbiome Data Science Using QIIME 2. Nat. Biotechnol. 2019, 37, 852–857. [Google Scholar] [CrossRef]
- Callahan, B.J.; McMurdie, P.J.; Rosen, M.J.; Han, A.W.; Johnson, A.J.A.; Holmes, S.P. DADA2: High-Resolution Sample Inference from Illumina Amplicon Data. Nat. Methods 2016, 13, 581–583. [Google Scholar] [CrossRef] [PubMed]
- Deacon, R. Assessing Burrowing, Nest Construction, and Hoarding in Mice. J. Vis. Exp. 2012, 59, e2607. [Google Scholar] [CrossRef]
- Bevins, R.A.; Besheer, J. Object Recognition in Rats and Mice: A One-Trial Non-Matching-to-Sample Learning Task to Study “Recognition Memory”. Nat. Protoc. 2006, 1, 1306–1311. [Google Scholar] [CrossRef] [PubMed]
- Pitts, M. Barnes Maze Procedure for Spatial Learning and Memory in Mice. Bio-Protocol 2018, 8, e2744. [Google Scholar] [CrossRef]
- Robinson, M.D.; McCarthy, D.J.; Smyth, G.K. EdgeR: A Bioconductor Package for Differential Expression Analysis of Digital Gene Expression Data. Bioinformatics 2009, 26, 139–140. [Google Scholar] [CrossRef] [PubMed]
- Mallick, H.; Rahnavard, A.; McIver, L.J.; Ma, S.; Zhang, Y.; Nguyen, L.H.; Tickle, T.L.; Weingart, G.; Ren, B.; Schwager, E.H.; et al. Multivariable Association Discovery in Population-Scale Meta-Omics Studies. PLoS Comput. Biol. 2021, 17, e1009442. [Google Scholar] [CrossRef] [PubMed]
- Selkoe, D.J.; Hardy, J. The Amyloid Hypothesis of Alzheimer’s Disease at 25 Years. EMBO Mol. Med. 2016, 8, 595–608. [Google Scholar] [CrossRef]
- Galimberti, D.; Scarpini, E. Behavioral Genetics of Neurodegenerative Disorders. Curr. Top. Behav. Neurosci. 2012, 12, 615–631. [Google Scholar] [CrossRef]
- Samaey, C.; Schreurs, A.; Stroobants, S.B.D. Early Cognitive and Behavioral Deficits in Mouse Models for Tauopathy and Alzheimer’s Disease. Front. Aging Neurosci. 2019, 11, 335. [Google Scholar] [CrossRef] [PubMed]
- Li, Z.; Zhu, H.; Guo, Y.; Du, X.Q.C. Gut Microbiota Regulate Cognitive Deficits and Amyloid Deposition in a Model of Alzheimer’s Disease. J. Neurochem. 2020, 155, 448–461. [Google Scholar] [CrossRef] [PubMed]
- Chui, Z.S.W.; Chan, L.M.L.; Zhang, E.W.H.; Liang, S.; Choi, E.P.H.; Lok, K.Y.W.; Tun, H.M.K.J. Effects of Microbiome-Based Interventions on Neurodegenerative Diseases: A Systematic Review and Meta-Analysis. Sci. Rep. 2024, 14, 9558. [Google Scholar] [CrossRef] [PubMed]
- Gabrielli, M.G.; Tomassoni, D. Starch-Enriched Diet Modulates the Glucidic Profile in the Rat Colonic Mucosa. Eur. J. Nutr. 2018, 57, 1109–1121. [Google Scholar] [CrossRef] [PubMed]
- Juge, N. Relationship between Mucosa-Associated Gut Microbiota and Human Diseases. Biochem. Soc. Trans. 2022, 50, 1225–1236. [Google Scholar] [CrossRef] [PubMed]
- Brownlee, I.A.; Havler, M.E.; Dettmar, P.W.; Allen, A.; Pearson, J.P. Colonic Mucus: Secretion and Turnover in Relation to Dietary Fibre Intake. Proc. Nutr. Soc. 2003, 62, 245–249. [Google Scholar] [CrossRef] [PubMed]
- Guarino, M.P.L.; Altomare, A.; Emerenziani, S.; Di Rosa, C.; Ribolsi, M.; Balestrieri, P.; Iovino, P.; Rocchi, G.; Cicala, M. Mechanisms of Action of Prebiotics and Their Effects on Gastro-Intestinal Disorders in Adults. Nutrients 2020, 12, 1037. [Google Scholar] [CrossRef] [PubMed]
- Derrien, M.; van Passel, M.W.J.; van de Bovenkamp, J.H.B.; Schipper, R.G.; de Vos, W.M.; Dekker, J. Mucin-Bacterial Interactions in the Human Oral Cavity and Digestive Tract. Gut Microbes 2010, 1, 254–268. [Google Scholar] [CrossRef] [PubMed]
- Tailford, L.E.; Crost, E.H.; Kavanaugh, D.; Juge, N. Mucin Glycan Foraging in the Human Gut Microbiome. Front. Genet. 2015, 5, 81. [Google Scholar] [CrossRef]
- Everard, A.; Belzer, C.; Geurts, L.; Ouwerkerk, J.P.; Druart, C.; Bindels, L.B.; Guiot, Y.; Derrien, M.; Muccioli, G.G.; Delzenne, N.M.; et al. Cross-Talk between Akkermansia muciniphila and Intestinal Epithelium Controls Diet-Induced Obesity. Proc. Natl. Acad. Sci. USA 2013, 110, 9066–9071. [Google Scholar] [CrossRef]
- Cani, P.D.; Depommier, C.; Derrien, M.; Everard, A.; de Vos, W.M. Akkermansia muciniphila: Paradigm for next-Generation Beneficial Microorganisms. Nat. Rev. Gastroenterol. Hepatol. 2022, 19, 625–637. [Google Scholar] [CrossRef] [PubMed]
- Steenland, K.; Levey, A.I.; Goldstein, F.C.; Power, M.C.; Weuve, J.; Gagne, J.J.; McQueen, M.B.; Viswanathan, A.; Blacker, D. Hypertension and Alzheimer Disease: Is There a Link? Epidemiology 2012, 23, 176–178. [Google Scholar] [CrossRef]
- Bengoetxea, X.; Rodriguez-Perdigon, M.; Ramirez, M.J. Object Recognition Test for Studying Cognitive Impairments in Animal Models of Alzheimer’s Disease. Front. Biosci. 2015, 7, 10–29. [Google Scholar]
- Fuentes, P. Clinical Diagnosis in Preclinical Stage of Alzheimer’s Disease. Arch. Med. Res. 2012, 43, 667–670. [Google Scholar] [CrossRef] [PubMed]
- Bach, M.E.; Hawkins, R.D.; Osman, M.; Kandel, E.R.; Mayford, M. Impairment of Spatial but Not Contextual Memory in CaMKII Mutant Mice with a Selective Loss of Hippocampal LTP in the Range of the theta Frequency. Cell 1995, 81, 905–915. [Google Scholar] [CrossRef]
- Barnes, C.A. Memory Deficits Associated with Senescence: A Neurophysiological and Behavioral Study in the Rat. J. Comp. Physiol. Psychol. 1979, 93, 74–104. [Google Scholar] [CrossRef]
- Gao, K.; Chen, C.; Ke, X.; Fan, Q.; Wang, H.; Li, Y.; Chen, S. Improvements of Age-Related Cognitive Decline in Mice by Lactobacillus helveticus WHH1889, a Novel Strain with Psychobiotic Properties. Nutrients 2023, 15, 3852. [Google Scholar] [CrossRef]
- Zhu, G.; Zhao, J.; Zhang, H.; Wang, G.; Chen, W. Gut Microbiota and Its Metabolites: Bridge of Dietary Nutrients and Alzheimer’s Disease. Adv. Nutr. 2023, 14, 819–839. [Google Scholar] [CrossRef]
- Medeiros, D.; McMurry, K.; Pfeiffer, M.; Newsome, K.; Testerman, T.; Graf, J.; Silver, A.C.; Sacchetti, P. Slowing Alzheimer’s Disease Progression through Probiotic Supplementation. Front. Neurosci. 2024, 18, 1309075. [Google Scholar] [CrossRef]
- Marano, G.; Mazza, M.; Lisci, F.M.; Ciliberto, M.; Traversi, G.; Kotzalidis, G.D.; De Berardis, D.; Laterza, L.; Sani, G.; Gasbarrini, A.; et al. The Microbiota-Gut-Brain Axis. Physiol. Rev. 2019, 99, 1877–2013. [Google Scholar] [CrossRef]
- Grabrucker, S.; Marizzoni, M.; Silajžić, E.; Lopizzo, N.; Mombelli, E.; Nicolas, S.; Dohm-Hansen, S.; Scassellati, C.; Moretti, D.V.; Rosa, M.; et al. Microbiota from Alzheimer’s Patients Induce Deficits in Cognition and Hippocampal Neurogenesis. Brain 2023, 146, 4916–4934. [Google Scholar] [CrossRef] [PubMed]
- Hung, C.-C.; Chang, C.-C.; Huang, C.-W.; Nouchi, R.; Cheng, C.-H. Gut Microbiota in Patients with Alzheimer’s Disease Spectrum: A Systematic Review and Meta-Analysis. Aging 2022, 14, 477–496. [Google Scholar] [CrossRef] [PubMed]


| Body Weight Gain | ||||
|---|---|---|---|---|
| 2nd month of Life | Wt | Wt-T | Tg | Tg-T |
| Male | 23.91 ± 0.32 g | 22.54 ± 0.48 g | 21.72 ± 0.10 g | 22.02 ± 0.6 g |
| Female | 18 ± 0.36 g | 19.35 ± 0.31 g | 17.68 ± 0.36 g | 17.69 ± 0.59 g |
| 8th month of Life | Wt | Wt-T | Tg | Tg-T |
| Male | 32.11 ± 1.17 g | 30.52 ± 0.35 g | 29.9 ± 0.92 g | 30.59 ± 0.44 g |
| Female | 25.47 ± 1.5 g | 25.65 ± 0.89 g | 24.65 ± 0.4 g | 23.92 ± 0.24 g |
| Wt-180 Groups | ||||||
| Phylum | Class | Order | Family | P | FDR | Trend Observed in Treated vs. Untreated |
| Micutes | Bacilli | Erysipelotrichales | Coprobacillaceae | 1.056 × 10⁻⁴ | 0.0044351 | |
| Bacteroidota | Bacteroidia | Bacteroidales | Marinifilaceae | 0.0021527 | 0.045206 | ↓ |
| Tg-180 Groups | ||||||
| Phylum | Class | Order | Family | P | FDR | Trend Observed in Treated vs. Untreated |
| Patescibacteria | Saccharimonadia | Saccharimonadales | Nanosyncoccaceae | 3.9799 × 10⁻⁷ | 1.6715 × 10⁻⁵ | ↓ |
| Firmicutes | Bacilli | RF39 | UBA660 | 7.783 × 10⁻⁵ | 8.1722 × 10⁻⁴ | ↓ |
| Firmicutes | Clostridia | Oscillospirales | Acutalibacteraceae | 2.7145 × 10⁻⁴ | 0.0022802 | ↓ |
| Firmicutes | Clostridia | Christensenellales | Borkfalkiaceae | 0.0017769 | 0.010662 | |
| Firmicutes | Clostridia | Christensenellales | CAG−74 | 1.9848 × 10⁻⁵ | 4.1681 × 10⁻⁴ | ↓ |
| Desulfobacterota | Desulfovibrionia | Desulfovibrionales | Desulfovibrionace | 0.0041844 | 0.021968 | ↓ |
| Proteobacteria | Alphaproteobacteria | D84 | Rs_D84 | 0.0047901 | 0.022354 | |
Disclaimer/Publisher’s Note: The statements, opinions and data contained in all publications are solely those of the individual author(s) and contributor(s) and not of MDPI and/or the editor(s). MDPI and/or the editor(s) disclaim responsibility for any injury to people or property resulting from any ideas, methods, instructions or products referred to in the content. |
© 2024 by the authors. Licensee MDPI, Basel, Switzerland. This article is an open access article distributed under the terms and conditions of the Creative Commons Attribution (CC BY) license (https://creativecommons.org/licenses/by/4.0/).
Share and Cite
Traini, C.; Bulli, I.; Sarti, G.; Morecchiato, F.; Coppi, M.; Rossolini, G.M.; Di Pilato, V.; Vannucchi, M.G. Amelioration of Serum Aβ Levels and Cognitive Impairment in APPPS1 Transgenic Mice Following Symbiotic Administration. Nutrients 2024, 16, 2381. https://doi.org/10.3390/nu16152381
Traini C, Bulli I, Sarti G, Morecchiato F, Coppi M, Rossolini GM, Di Pilato V, Vannucchi MG. Amelioration of Serum Aβ Levels and Cognitive Impairment in APPPS1 Transgenic Mice Following Symbiotic Administration. Nutrients. 2024; 16(15):2381. https://doi.org/10.3390/nu16152381
Chicago/Turabian StyleTraini, Chiara, Irene Bulli, Giorgia Sarti, Fabio Morecchiato, Marco Coppi, Gian Maria Rossolini, Vincenzo Di Pilato, and Maria Giuliana Vannucchi. 2024. "Amelioration of Serum Aβ Levels and Cognitive Impairment in APPPS1 Transgenic Mice Following Symbiotic Administration" Nutrients 16, no. 15: 2381. https://doi.org/10.3390/nu16152381