
The Association between Body Composition Phenotype and Insulin Resistance in Post-COVID-19 Syndrome Patients without Diabetes: A Cross-Sectional, Single-Center Study
 , , ,
, , ,
Abstract
:1. Introduction
2. Materials and Methods
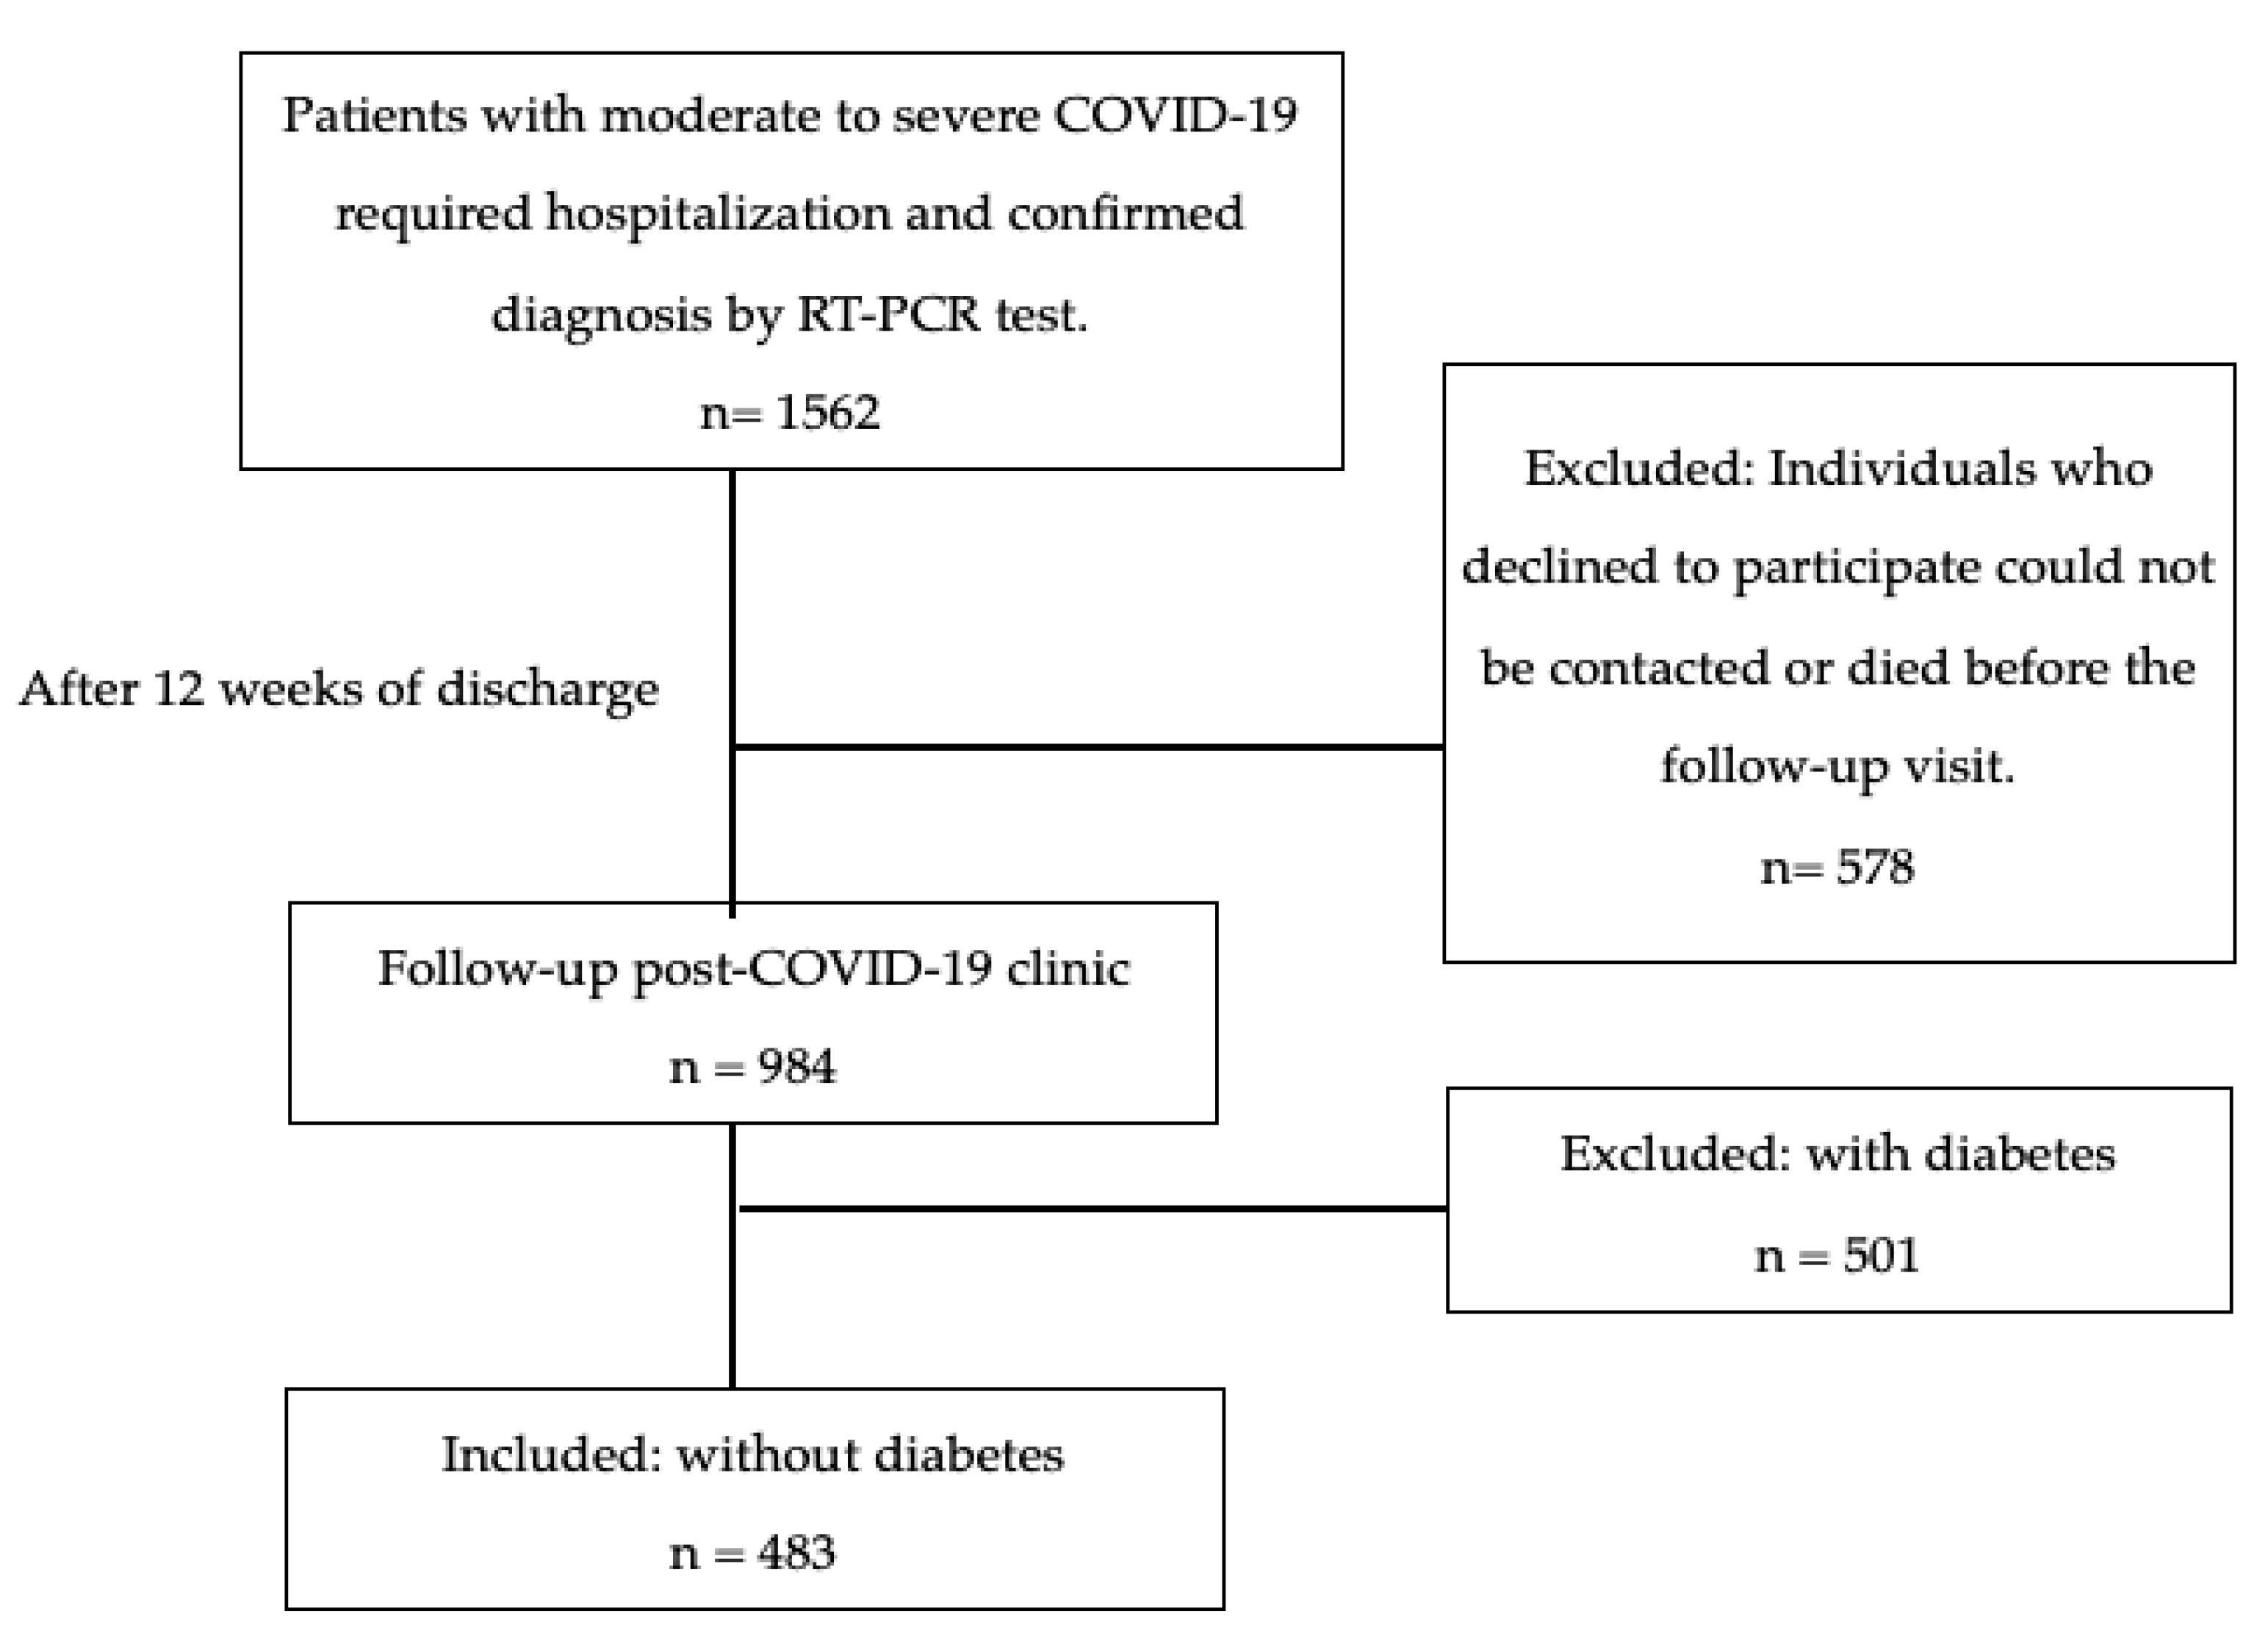
2.1. Study Design and Population
Outcome Measures
2.2. Insulin Resistance (IR)
2.3. Metabolic Syndrome (MetS)
2.4. Anthropometry
2.5. Handgrip Strength (HGS)
2.6. Body Composition
2.7. Body Composition Phenotype
2.8. Statistical Analysis
3. Results
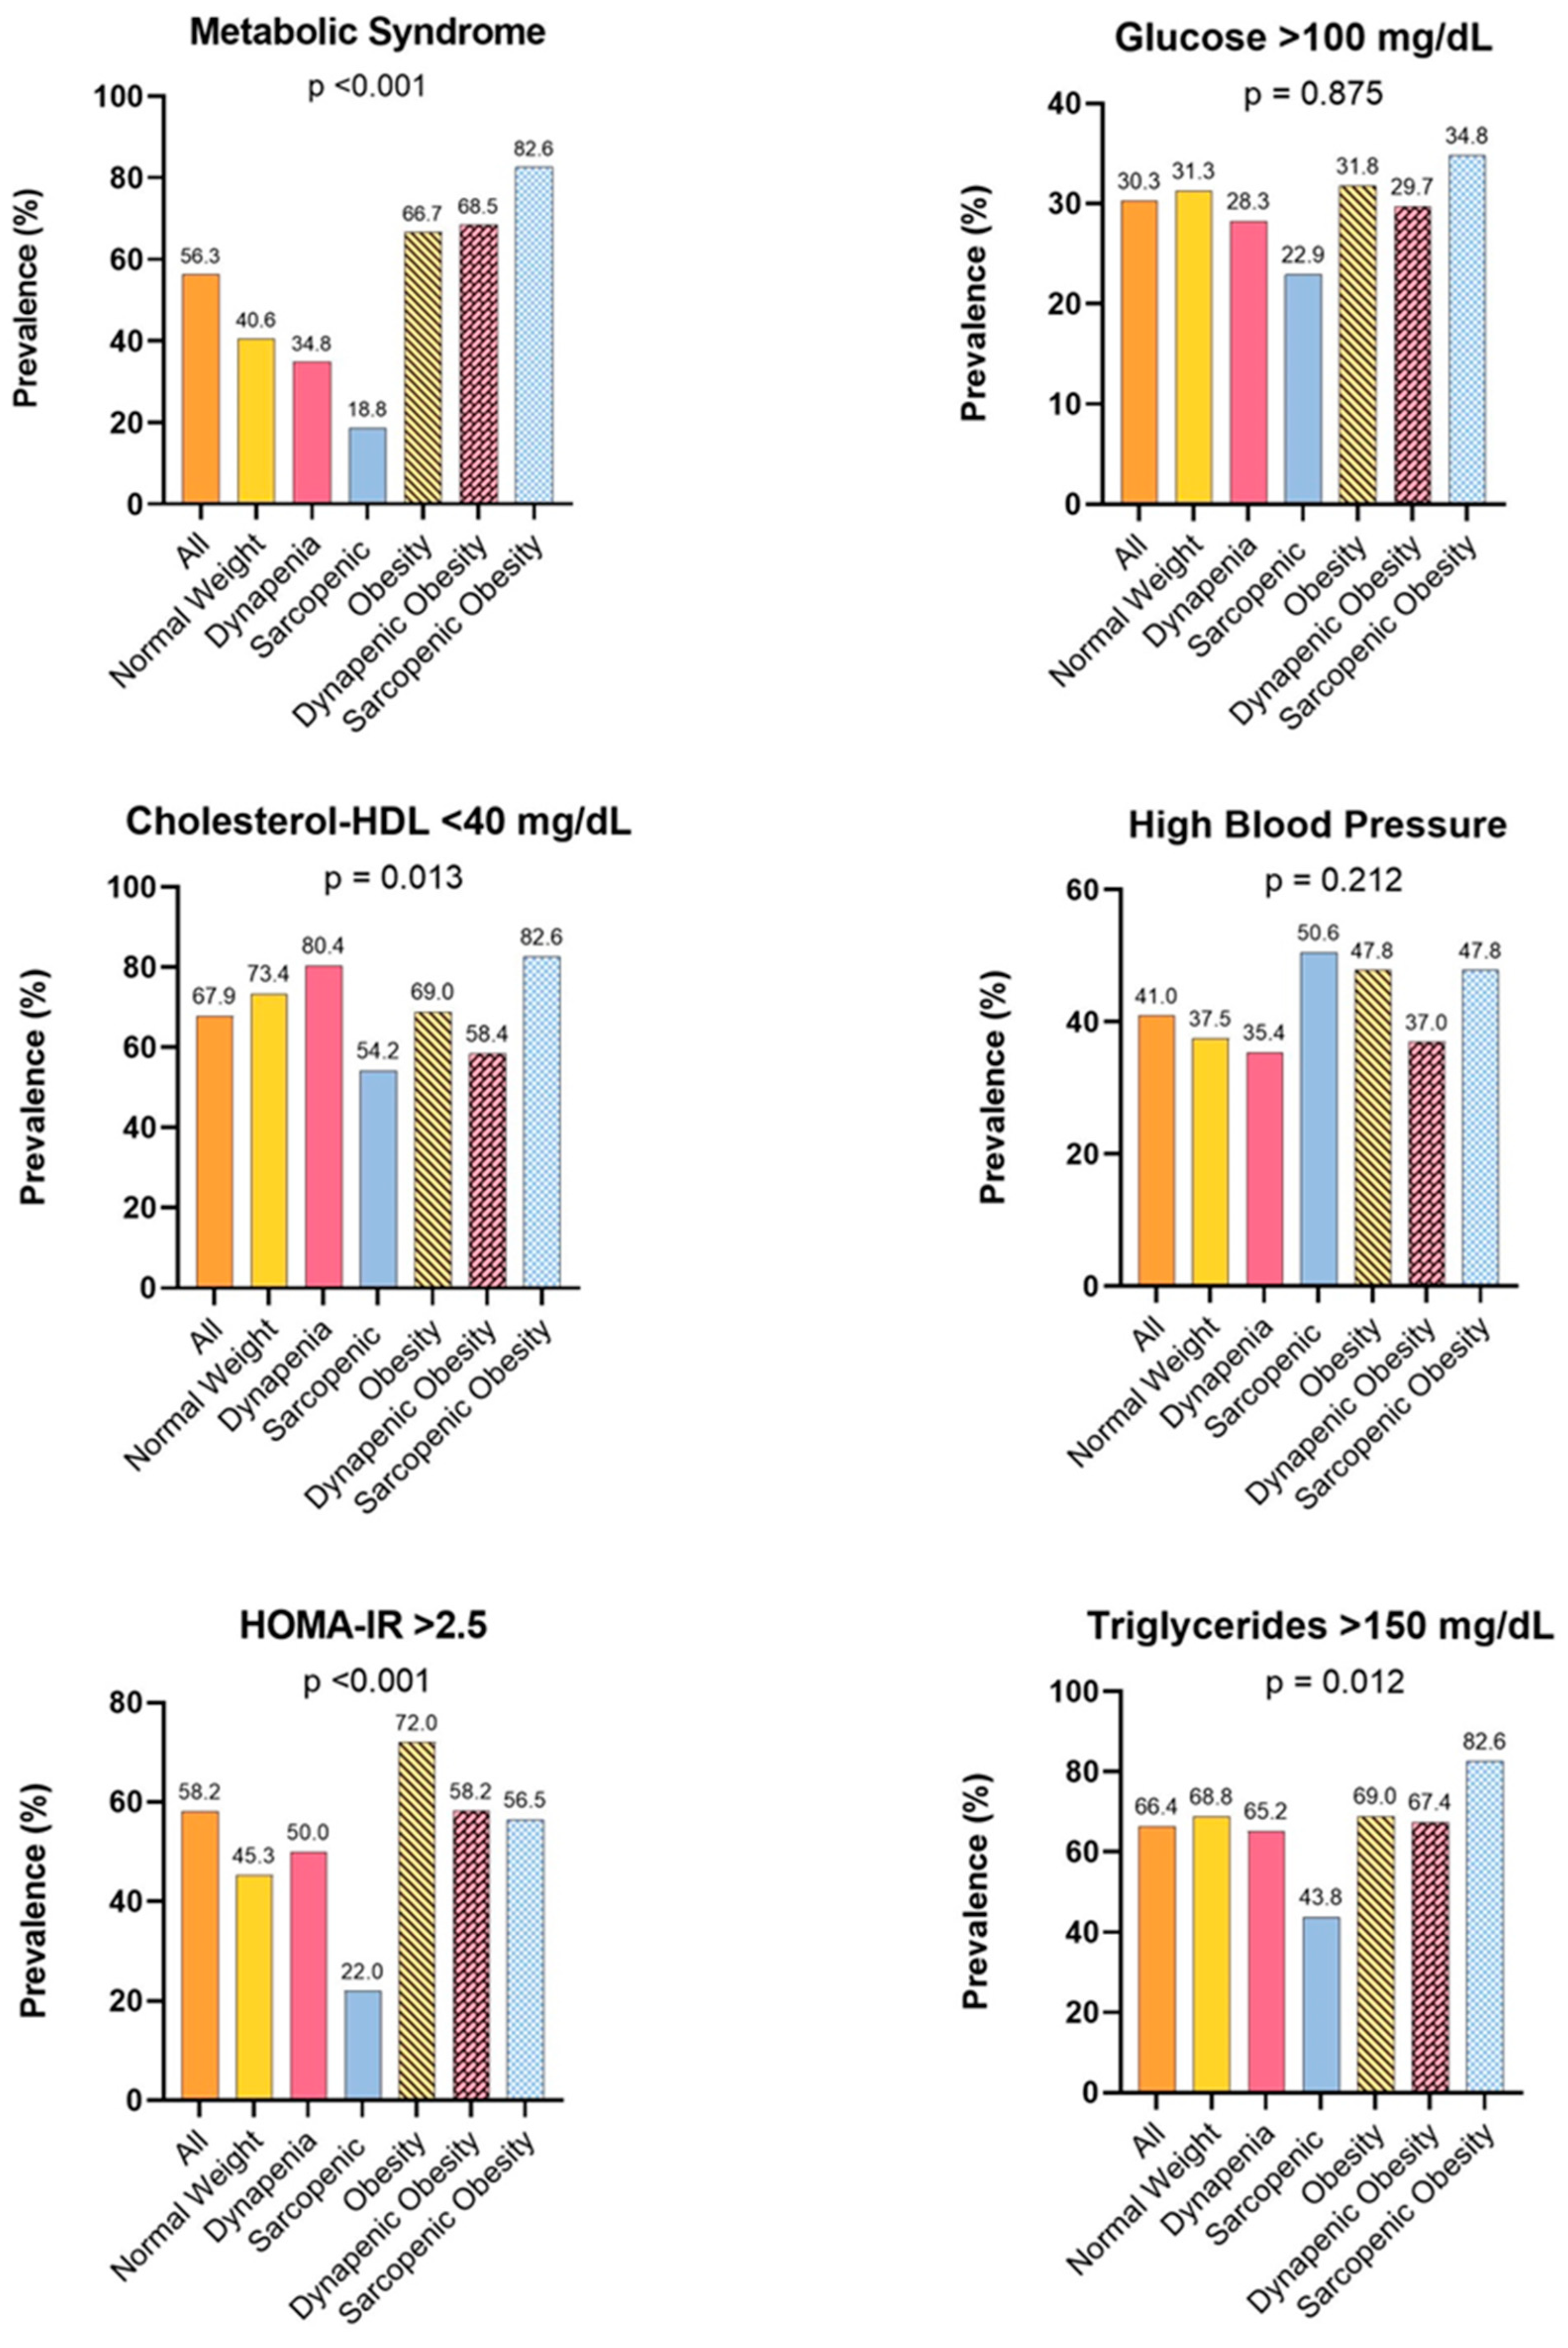
3.1. Metabolic Alterations
3.2. Risk Factors Associated with IR
4. Discussion
Strengths and Limitations
5. Conclusions
Author Contributions
Funding
Institutional Review Board Statement
Informed Consent Statement
Data Availability Statement
Acknowledgments
Conflicts of Interest
References
- National Institute for Health and Care Excellence. Clinical Guidelines. In COVID-19 Rapid Guideline: Managing the Long-Term Effects of COVID-19; National Institute for Health and Care Excellence (NICE): London, UK, 2020. [Google Scholar]
- Fernández-de-Las-Peñas, C.; Palacios-Ceña, D.; Gómez-Mayordomo, V.; Florencio, L.L.; Cuadrado, M.L.; Plaza-Manzano, G.; Navarro-Santana, M. Prevalence of post-COVID-19 symptoms in hospitalized and non-hospitalized COVID-19 survivors: A systematic review and meta-analysis. Eur. J. Intern. Med. 2021, 92, 55–70. [Google Scholar] [CrossRef] [PubMed]
- Chen, C.; Haupert, S.R.; Zimmermann, L.; Shi, X.; Fritsche, L.G.; Mukherjee, B. Global Prevalence of Post-Coronavirus Disease 2019 (COVID-19) Condition or Long COVID: A Meta-Analysis and Systematic Review. J. Infect. Dis. 2022, 226, 1593–1607. [Google Scholar] [CrossRef] [PubMed]
- Gupta, A.; Madhavan, M.V.; Sehgal, K.; Nair, N.; Mahajan, S.; Sehrawat, T.S.; Bikdeli, B.; Ahluwalia, N.; Ausiello, J.C.; Wan, E.Y.; et al. Extrapulmonary manifestations of COVID-19. Nat. Med. 2020, 26, 1017–1032. [Google Scholar] [CrossRef] [PubMed]
- González-Islas, D.; Sánchez-Moreno, C.; Orea-Tejeda, A.; Hernández-López, S.; Salgado-Fernández, F.; Keirns-Davis, C.; Galicia-Amor, S.; Trejo-Mellado, E.; Gochicoa-Rangel, L.; Castorena-Maldonado, A. Body composition and risk factors associated with sarcopenia in post-COVID patients after moderate or severe COVID-19 infections. BMC Pulm. Med. 2022, 22, 223. [Google Scholar] [CrossRef]
- Huang, C.; Huang, L.; Wang, Y.; Li, X.; Ren, L.; Gu, X.; Kang, L.; Guo, L.; Liu, M.; Zhou, X.; et al. 6-month consequences of COVID-19 in patients discharged from hospital: A cohort study. Lancet 2023, 401, e21–e33. [Google Scholar] [CrossRef] [PubMed]
- López-Sampalo, A.; Cobos-Palacios, L.; Vilches-Pérez, A.; Sanz-Cánovas, J.; Vargas-Candela, A.; Mancebo-Sevilla, J.J.; Hernández-Negrín, H.; Gómez-Huelgas, R.; Bernal-López, M.R. COVID-19 in Older Patients: Assessment of Post-COVID-19 Sarcopenia. Biomedicines 2023, 11, 733. [Google Scholar] [CrossRef] [PubMed]
- Ramírez-Vélez, R.; Legarra-Gorgoñon, G.; Oscoz-Ochandorena, S.; García-Alonso, Y.; García-Alonso, N.; Oteiza, J.; Ernaga Lorea, A.; Correa-Rodríguez, M.; Izquierdo, M. Reduced muscle strength in patients with long-COVID-19 syndrome is mediated by limb muscle mass. J. Appl. Physiol. 2023, 134, 50–58. [Google Scholar] [CrossRef] [PubMed]
- Cruz-Jentoft, A.J.; Bahat, G.; Bauer, J.; Boirie, Y.; Bruyère, O.; Cederholm, T.; Cooper, C.; Landi, F.; Rolland, Y.; Sayer, A.A.; et al. Sarcopenia: Revised European consensus on definition and diagnosis. Age Ageing 2019, 48, 16–31. [Google Scholar] [CrossRef] [PubMed]
- Arnlöv, J.; Ingelsson, E.; Sundström, J.; Lind, L. Impact of body mass index and the metabolic syndrome on the risk of cardiovascular disease and death in middle-aged men. Circulation 2010, 121, 230–236. [Google Scholar] [CrossRef] [PubMed]
- Beaudart, C.; Zaaria, M.; Pasleau, F.; Reginster, J.Y.; Bruyère, O. Health Outcomes of Sarcopenia: A Systematic Review and Meta-Analysis. PLoS ONE 2017, 12, e0169548. [Google Scholar] [CrossRef] [PubMed]
- Celis-Morales, C.A.; Welsh, P.; Lyall, D.M.; Steell, L.; Petermann, F.; Anderson, J.; Iliodromiti, S.; Sillars, A.; Graham, N.; Mackay, D.F.; et al. Associations of grip strength with cardiovascular, respiratory, and cancer outcomes and all cause mortality: Prospective cohort study of half a million UK Biobank participants. BMJ 2018, 361, k1651. [Google Scholar] [CrossRef] [PubMed]
- Wang, D.X.M.; Yao, J.; Zirek, Y.; Reijnierse, E.M.; Maier, A.B. Muscle mass, strength, and physical performance predicting activities of daily living: A meta-analysis. J. Cachexia Sarcopenia Muscle 2020, 11, 3–25. [Google Scholar] [CrossRef]
- Gil, S.; Jacob Filho, W.; Shinjo, S.K.; Ferriolli, E.; Busse, A.L.; Avelino-Silva, T.J.; Longobardi, I.; de Oliveira Júnior, G.N.; Swinton, P.; Gualano, B.; et al. Muscle strength and muscle mass as predictors of hospital length of stay in patients with moderate to severe COVID-19: A prospective observational study. J. Cachexia Sarcopenia Muscle 2021, 12, 1871–1878. [Google Scholar] [CrossRef] [PubMed]
- Yang, T.; Li, Z.; Jiang, L.; Xi, X. Corticosteroid use and intensive care unit-acquired weakness: A systematic review and meta-analysis. Crit. Care 2018, 22, 187. [Google Scholar] [CrossRef] [PubMed]
- Forcina, L.; Miano, C.; Scicchitano, B.M.; Rizzuto, E.; Berardinelli, M.G.; De Benedetti, F.; Pelosi, L.; Musarò, A. Increased Circulating Levels of Interleukin-6 Affect the Redox Balance in Skeletal Muscle. Oxid. Med. Cell. Longev. 2019, 2019, 3018584. [Google Scholar] [CrossRef] [PubMed]
- Disser, N.P.; De Micheli, A.J.; Schonk, M.M.; Konnaris, M.A.; Piacentini, A.N.; Edon, D.L.; Toresdahl, B.G.; Rodeo, S.A.; Casey, E.K.; Mendias, C.L. Musculoskeletal Consequences of COVID-19. J. Bone Jt. Surg. 2020, 102, 1197–1204. [Google Scholar] [CrossRef]
- Li, J.; Li, Y.; Wang, Z.; Liu, N.; He, L.; Zhang, H. Increased risk of new-onset diabetes in patients with COVID-19: A systematic review and meta-analysis. Front. Public Health 2023, 11, 1170156. [Google Scholar] [CrossRef] [PubMed]
- Álvarez-Hernández, J.; Matía-Martín, P.; Cáncer-Minchot, E.; Cuerda, C. Long-term outcomes in critically ill patients who survived COVID-19: The NUTRICOVID observational cohort study. Clin. Nutr. 2023, 42, 2029–2035. [Google Scholar] [CrossRef] [PubMed]
- Joaquín, C.; Bretón, I.; Ocón Bretón, M.J.; Burgos, R.; Bellido, D.; Matía-Martín, P.; Martínez Olmos, M.; Zugasti, A.; Riestra, M.; Botella, F.; et al. Nutritional and Morphofunctional Assessment of Post-ICU Patients with COVID-19 at Hospital Discharge: NutriEcoMuscle Study. Nutrients 2024, 16, 886. [Google Scholar] [CrossRef] [PubMed]
- LoMauro, A.; Gervasoni, F.; Ricci, V.; Salce, G.; Andreoli, A.; Pantoni, L.; Özçakar, L. Sarcopenia and Multisensory Integration Deficit in Post-COVID Syndrome Patients: The Clinical, Ultrasound and Robotic Evaluation Protocol in a Cross-sectional Study. Am. J. Phys. Med. Rehabil. 2024, 103, 181–187. [Google Scholar] [CrossRef] [PubMed]
- Di Meo, S.; Iossa, S.; Venditti, P. Skeletal muscle insulin resistance: Role of mitochondria and other ROS sources. J. Endocrinol. 2017, 233, R15–R42. [Google Scholar] [CrossRef] [PubMed]
- Kalinkovich, A.; Livshits, G. Sarcopenic obesity or obese sarcopenia: A cross talk between age-associated adipose tissue and skeletal muscle inflammation as a main mechanism of the pathogenesis. Ageing Res. Rev. 2017, 35, 200–221. [Google Scholar] [CrossRef] [PubMed]
- Wu, H.; Ballantyne, C.M. Skeletal muscle inflammation and insulin resistance in obesity. J. Clin. Investig. 2017, 127, 43–54. [Google Scholar] [CrossRef] [PubMed]
- Gluvic, Z.; Zaric, B.; Resanovic, I.; Obradovic, M.; Mitrovic, A.; Radak, D.; Isenovic, E.R. Link between Metabolic Syndrome and Insulin Resistance. Curr. Vasc. Pharmacol. 2017, 15, 30–39. [Google Scholar] [CrossRef] [PubMed]
- Rubio-Ruiz, M.E.; Guarner-Lans, V.; Pérez-Torres, I.; Soto, M.E. Mechanisms Underlying Metabolic Syndrome-Related Sarcopenia and Possible Therapeutic Measures. Int. J. Mol. Sci. 2019, 20, 647. [Google Scholar] [CrossRef] [PubMed]
- Donini, L.M.; Busetto, L.; Bischoff, S.C.; Cederholm, T.; Ballesteros-Pomar, M.D.; Batsis, J.A.; Bauer, J.M.; Boirie, Y.; Cruz-Jentoft, A.J.; Dicker, D.; et al. Definition and Diagnostic Criteria for Sarcopenic Obesity: ESPEN and EASO Consensus Statement. Obes. Facts 2022, 15, 321–335. [Google Scholar] [CrossRef] [PubMed]
- Wu, H.; Liu, M.; Chi, V.T.Q.; Wang, J.; Zhang, Q.; Liu, L.; Meng, G.; Yao, Z.; Bao, X.; Gu, Y.; et al. Handgrip strength is inversely associated with metabolic syndrome and its separate components in middle aged and older adults: A large-scale population-based study. Metab. Clin. Exp. 2019, 93, 61–67. [Google Scholar] [CrossRef] [PubMed]
- Hwang, J.; Park, S. Gender-Specific Prevalence and Risk Factors of Sarcopenic Obesity in the Korean Elderly Population: A Nationwide Cross-Sectional Study. Int. J. Environ. Res. Public Health 2023, 20, 1140. [Google Scholar] [CrossRef] [PubMed]
- Durward, C.M.; Hartman, T.J.; Nickols-Richardson, S.M. All-cause mortality risk of metabolically healthy obese individuals in NHANES III. J. Obes. 2012, 2012, 460321. [Google Scholar] [CrossRef] [PubMed]
- Executive Summary of The Third Report of The National Cholesterol Education Program (NCEP) Expert Panel on Detection, Evaluation, And Treatment of High Blood Cholesterol In Adults (Adult Treatment Panel III). JAMA 2001, 285, 2486–2497. [CrossRef] [PubMed]
- Lohman, T.G.; Roche, A.F.; Martorell, R. Anthropometric Standardization Reference Manual; Human Kinetics Books: Champaign, IL, USA, 1988; Volume 177. [Google Scholar]
- Rodríguez-García, W.D.; García-Castañeda, L.; Orea-Tejeda, A.; Mendoza-Núñez, V.; González-Islas, D.G.; Santillán-Díaz, C.; Castillo-Martínez, L. Handgrip strength: Reference values and its relationship with bioimpedance and anthropometric variables. Clin. Nutr. ESPEN 2017, 19, 54–58. [Google Scholar] [CrossRef]
- Lukaski, H.C.; Johnson, P.E.; Bolonchuk, W.W.; Lykken, G.I. Assessment of fat-free mass using bioelectrical impedance measurements of the human body. Am. J. Clin. Nutr. 1985, 41, 810–817. [Google Scholar] [CrossRef] [PubMed]
- Sergi, G.; De Rui, M.; Veronese, N.; Bolzetta, F.; Berton, L.; Carraro, S.; Bano, G.; Coin, A.; Manzato, E.; Perissinotto, E. Assessing appendicular skeletal muscle mass with bioelectrical impedance analysis in free-living Caucasian older adults. Clin. Nutr. 2015, 34, 667–673. [Google Scholar] [CrossRef] [PubMed]
- Batsis, J.A.; Singh, S.; Lopez-Jimenez, F. Anthropometric measurements and survival in older Americans: Results from the third National Health and Nutrition Examination Survey. J. Nutr. Health Aging 2014, 18, 123–130. [Google Scholar] [CrossRef]
- Chen, L.; Liu, X.; Wang, Q.; Jia, L.; Song, K.; Nie, S.; Zhang, Y.; Cao, D.; Zhao, D.; Li, Z.; et al. Better pulmonary function is associated with greater handgrip strength in a healthy Chinese Han population. BMC Pulm. Med. 2020, 20, 114. [Google Scholar] [CrossRef] [PubMed]
- Chites, V.S.; Teixeira, P.P.; Lima, J.; Burgel, C.F.; Gattermann Pereira, T.; Silva, F.M. Reduced Handgrip Strength in Hospital Admission Predicts Prolonged Hospital Stay and Death but Is Not Accurate to Identify Malnutrition: A Longitudinal Study of Reduced Handgrip Strength in Hospitalized Patients. J. Parenter. Enter. Nutr. 2021, 45, 1016–1022. [Google Scholar] [CrossRef] [PubMed]
- Wilkinson, T.J.; Yates, T.; Baker, L.A.; Zaccardi, F.; Smith, A.C. Sarcopenic obesity and the risk of hospitalization or death from coronavirus disease 2019: Findings from UK Biobank. JCSM Rapid Commun. 2022, 5, 3–9. [Google Scholar] [CrossRef] [PubMed]
- Longobardi, I.; Goessler, K.; de Oliveira Júnior, G.N.; Prado, D.; Santos, J.V.P.; Meletti, M.M.; de Andrade, D.C.O.; Gil, S.; Boza, J.; Lima, F.R.; et al. Effects of a 16-week home-based exercise training programme on health-related quality of life, functional capacity, and persistent symptoms in survivors of severe/critical COVID-19: A randomised controlled trial. Br. J. Sports Med. 2023, 57, 1295–1303. [Google Scholar] [CrossRef] [PubMed]
- Reid, M.B.; Li, Y.P. Tumor necrosis factor-alpha and muscle wasting: A cellular perspective. Respir. Res. 2001, 2, 269–272. [Google Scholar] [CrossRef] [PubMed]
- Aon, M.A.; Bhatt, N.; Cortassa, S.C. Mitochondrial and cellular mechanisms for managing lipid excess. Front. Physiol. 2014, 5, 282. [Google Scholar] [CrossRef] [PubMed]
- Ali, A.M.; Kunugi, H. Skeletal Muscle Damage in COVID-19: A Call for Action. Medicina 2021, 57, 372. [Google Scholar] [CrossRef] [PubMed]
- Di Girolamo, F.G.; Fiotti, N.; Sisto, U.G.; Nunnari, A.; Colla, S.; Mearelli, F.; Vinci, P.; Schincariol, P.; Biolo, G. Skeletal Muscle in Hypoxia and Inflammation: Insights on the COVID-19 Pandemic. Front. Nutr. 2022, 9, 865402. [Google Scholar] [CrossRef] [PubMed]
- Baker, J.F.; Mostoufi-Moab, S.; Long, J.; Zemel, B.; Ibrahim, S.; Taratuta, E.; Leonard, M.B. Intramuscular Fat Accumulation and Associations With Body Composition, Strength, and Physical Functioning in Patients With Rheumatoid Arthritis. Arthritis Care Res. 2018, 70, 1727–1734. [Google Scholar] [CrossRef] [PubMed]
- Thiebaud, D.; Jacot, E.; DeFronzo, R.A.; Maeder, E.; Jequier, E.; Felber, J.P. The effect of graded doses of insulin on total glucose uptake, glucose oxidation, and glucose storage in man. Diabetes 1982, 31, 957–963. [Google Scholar] [CrossRef] [PubMed]
- Son, J.W.; Lee, S.S.; Kim, S.R.; Yoo, S.J.; Cha, B.Y.; Son, H.Y.; Cho, N.H. Low muscle mass and risk of type 2 diabetes in middle-aged and older adults: Findings from the KoGES. Diabetologia 2017, 60, 865–872. [Google Scholar] [CrossRef] [PubMed]
- Poggiogalle, E.; Lubrano, C.; Gnessi, L.; Mariani, S.; Di Martino, M.; Catalano, C.; Lenzi, A.; Donini, L.M. The decline in muscle strength and muscle quality in relation to metabolic derangements in adult women with obesity. Clin. Nutr. 2019, 38, 2430–2435. [Google Scholar] [CrossRef] [PubMed]
- Bonaldo, P.; Sandri, M. Cellular and molecular mechanisms of muscle atrophy. Dis. Models Mech. 2013, 6, 25–39. [Google Scholar] [CrossRef] [PubMed]
- Baczek, J.; Silkiewicz, M.; Wojszel, Z.B. Myostatin as a Biomarker of Muscle Wasting and other Pathologies-State of the Art and Knowledge Gaps. Nutrients 2020, 12, 2401. [Google Scholar] [CrossRef] [PubMed]
- Postic, C.; Girard, J. Contribution of de novo fatty acid synthesis to hepatic steatosis and insulin resistance: Lessons from genetically engineered mice. J. Clin. Investig. 2008, 118, 829–838. [Google Scholar] [CrossRef] [PubMed]
- Visser, M.; Pahor, M.; Taaffe, D.R.; Goodpaster, B.H.; Simonsick, E.M.; Newman, A.B.; Nevitt, M.; Harris, T.B. Relationship of interleukin-6 and tumor necrosis factor-alpha with muscle mass and muscle strength in elderly men and women: The Health ABC Study. J. Gerontol. A Biol. Sci. Med. Sci. 2002, 57, M326–M332. [Google Scholar] [CrossRef] [PubMed]
- Hamer, M.; Molloy, G.J. Association of C-reactive protein and muscle strength in the English Longitudinal Study of Ageing. Age 2009, 31, 171–177. [Google Scholar] [CrossRef]


| All n = 483 | HOMA-IR > 2.5 n = 281 | HOMA-IR < 2.5 n = 202 | p-Value | |
|---|---|---|---|---|
| Age, y | 52.69 ± 14.75 | 50.4 ± 14.04 | 55.89 ± 15.16 | <0.001 |
| Male, n (%) | 324 (67.08) | 188 (66.90) | 136 (67.33) | 0.922 |
| Co-morbidities | ||||
| Hypertension, n (%) | 153 (31.68) | 90 (32.03) | 63 (31.19) | 0.845 |
| Ischemic cardiopathy, n (%) | 32 (6.63) | 17 (6.05) | 15 (7.43) | 0.549 |
| Pulmonary disease, n (%) | 75 (15.53) | 39 (13.88) | 36 (17.08) | 0.238 |
| Thyroid disease, n (%) | 32 (6.63) | 20 (7.12) | 12 (5.94) | 0.608 |
| Hepatopathy, n (%) | 8 (1.66) | 3 (1.07) | 5 (2.48) | 0.232 |
| HIV, n (%) | 7 (1.45) | 4 (1.42) | 3 (1.49) | 0.955 |
| Asthma, n (%) | 13 (2.69) | 8 (2.85) | 5 (2.48) | 0.803 |
| COPD, n (%) | 16 (3.31) | 4 (1.42) | 12 (5.94) | 0.006 |
| Hospitalary parameters | ||||
| Hospital stay, d | 17 [10,11,12,13,14,15,16,17,18,19,20,21,22,23,24,25,26,27,28,29] | 15 [6,7,8,9,10,11,12,13,14,15,16,17,18,19,20,21,22,23,24,25,26] | 20 [6,7,8,9,10,11,12,13,14,15,16,17,18,19,20,21,22,23,24,25,26,27,28,29,30,31,32,33,34] | 0.006 |
| Mechanical ventilation, n (%) | 289 (60.33) | 163 (58.63) | 126 (62.69) | 0.371 |
| Body composition | ||||
| Weight, kg | 81.6 ± 18.8 | 86.6 ± 17.98 | 74.60 ± 17.80 | <0.001 |
| Height, cm | 163.47 ± 9.63 | 164.40 ± 8.78 | 162.18 ± 10.59 | 0.012 |
| BMI, kg/m2 | 30.44 ± 6.37 | 32.01 ± 6.05 | 28.27 ± 6.17 | <0.001 |
| Handgrip strength, kg | 24.85 ± 9.87 | 26.11 ± 9.41 | 23.10 ± 10.24 | <0.001 |
| Prediction marker, 200/5 kHz | 0.79 ± 0.05 | 0.79 ± 0.05 | 0.79 ± 0.05 | 0.811 |
| Phase angle, ° | 6.01 ± 1.52 | 6.24 ± 1.41 | 5.71 ± 1.60 | <0.001 |
| ASM/height2, kg/m2 | 7.79 ± 1.40 | 8.01 ± 1.12 | 7.48 ± 1.67 | <0.001 |
| Fat mass, kg | 30.08 ± 10.70 | 32.23 ± 8.84 | 27.09 ± 12.26 | <0.001 |
| Body composition phenotype | ||||
| Normal weight, n (%) | 64 (13.25) | 29 (10.32) | 35 (17.33) | <0.001 |
| Dynapenia, n (%) | 46 (9.52) | 23 (8.19) | 23 (11.39) | |
| Sarcopenia, n (%) | 48 (9.94) | 11 (3.91) | 37 (18.32) | |
| Obesity, n (%) | 211 (43.69) | 152 (54.09) | 59 (29.21) | |
| Dynapenic obesity, n (%) | 91 (18.84) | 53 (18.86) | 38 (18.81) | |
| Sarcopenic obesity, n (%) | 23 (4.76) | 13 (4.63) | 10 (4.95) | |
| OR | 95% CI | p-Value | |
|---|---|---|---|
| Age, y | 0.97 | 0.96 to 0.98 | <0.001 |
| Male | 0.98 | 0.66 to 1.44 | 0.922 |
| Co-morbidities | |||
| Hypertension | 1.03 | 0.70 to 1.53 | 0.845 |
| Ischemic cardiopathy | 0.80 | 0.39 to 1.64 | 0.549 |
| Pulmonary disease | 0.74 | 0.45 to 1.21 | 0.239 |
| Thyroid disease | 1.21 | 0.57 to 2.54 | 0.608 |
| Hepatopathy | 0.42 | 0.10 to 1.79 | 0.245 |
| HIV | 0.95 | 0.21 to 4.32 | 0.955 |
| Asthma | 1.15 | 0.37 to 3.58 | 0.804 |
| COPD | 0.22 | 0.07 to 0.71 | 0.012 |
| Hospitalary parameters | |||
| Length of hospital stay, d | 0.98 | 0.97 to 0.99 | 0.001 |
| Mechanical ventilation | 0.84 | 0.58 to 1.22 | 0.371 |
| Body composition | |||
| Weight, kg | 1.04 | 1.02 to 1.05 | <0.001 |
| Height, cm | 1.02 | 1.00 to 1.04 | 0.013 |
| BMI, kg/m2 | 1.12 | 1.08 to 1.16 | <0.001 |
| Handgrip strength, kg | 1.03 | 1.01 to 1.05 | 0.001 |
| Prediction marker, 200/5 kHz | 0.55 | 0.004 to 69.75 | 0.810 |
| Phase angle, ° | 1.32 | 1.13 to 1.52 | <0.001 |
| ASM/height2, kg/m2 | 1.37 | 1.17 to 1.60 | <0.001 |
| Fat mass, % | 1.05 | 1.03 to 1.07 | <0.001 |
| Body composition phenotype | |||
| Normal weight | 1 | Reference | |
| Dynapenia | 1.20 | 0.56 to 2.57 | 0.627 |
| Sarcopenia | 0.35 | 0.15 to 0.82 | 0.016 |
| Obesity | 3.10 | 1.74 to 5.53 | <0.001 |
| Dynapenic obesity | 3.75 | 1.15 to 12.21 | 0.028 |
| Sarcopenic obesity | 1.11 | 0.32 to 3.81 | 0.862 |
Disclaimer/Publisher’s Note: The statements, opinions and data contained in all publications are solely those of the individual author(s) and contributor(s) and not of MDPI and/or the editor(s). MDPI and/or the editor(s) disclaim responsibility for any injury to people or property resulting from any ideas, methods, instructions or products referred to in the content. |
© 2024 by the authors. Licensee MDPI, Basel, Switzerland. This article is an open access article distributed under the terms and conditions of the Creative Commons Attribution (CC BY) license (https://creativecommons.org/licenses/by/4.0/).
Share and Cite
González-Islas, D.; Flores-Cisneros, L.; Orea-Tejeda, A.; Keirns-Davis, C.; Hernández-López, N.; Arcos-Pacheco, L.P.; Zurita-Sandoval, A.; Albarran-López, F.; García-Castañeda, L.; Salgado-Fernández, F.; et al. The Association between Body Composition Phenotype and Insulin Resistance in Post-COVID-19 Syndrome Patients without Diabetes: A Cross-Sectional, Single-Center Study. Nutrients 2024, 16, 2468. https://doi.org/10.3390/nu16152468
González-Islas D, Flores-Cisneros L, Orea-Tejeda A, Keirns-Davis C, Hernández-López N, Arcos-Pacheco LP, Zurita-Sandoval A, Albarran-López F, García-Castañeda L, Salgado-Fernández F, et al. The Association between Body Composition Phenotype and Insulin Resistance in Post-COVID-19 Syndrome Patients without Diabetes: A Cross-Sectional, Single-Center Study. Nutrients. 2024; 16(15):2468. https://doi.org/10.3390/nu16152468
Chicago/Turabian StyleGonzález-Islas, Dulce, Laura Flores-Cisneros, Arturo Orea-Tejeda, Candace Keirns-Davis, Nadia Hernández-López, Laura Patricia Arcos-Pacheco, Andrea Zurita-Sandoval, Frida Albarran-López, Luis García-Castañeda, Fernanda Salgado-Fernández, and et al. 2024. "The Association between Body Composition Phenotype and Insulin Resistance in Post-COVID-19 Syndrome Patients without Diabetes: A Cross-Sectional, Single-Center Study" Nutrients 16, no. 15: 2468. https://doi.org/10.3390/nu16152468