

Effects of Ketogenic Diet on Increased Ethanol Consumption Induced by Social Stress in Female Mice
 , , and
Abstract
:1. Introduction
2. Materials and Methods
2.1. Subjects
2.2. Experimental Design
2.3. Apparatus and Procedure
2.3.1. Feeding Conditions, Body Weight, Kcal Intake, and Ketosis State
2.3.2. Drug Treatment
2.3.3. Vicarious Social Defeat (VSD)
2.3.4. Social Interaction Test (SIT)
2.3.5. Drinking in the Dark Test (DID)
2.3.6. Oral Ethanol Self-Administration (SA)
2.3.7. Determination of Plasma Corticosterone (ELISA)
2.3.8. Tissue Sampling and Biochemical Analyses
2.3.9. RNA Isolation, Reverse Transcription, and Quantitative RT-PCR
2.4. Statistical Analysis
3. Results
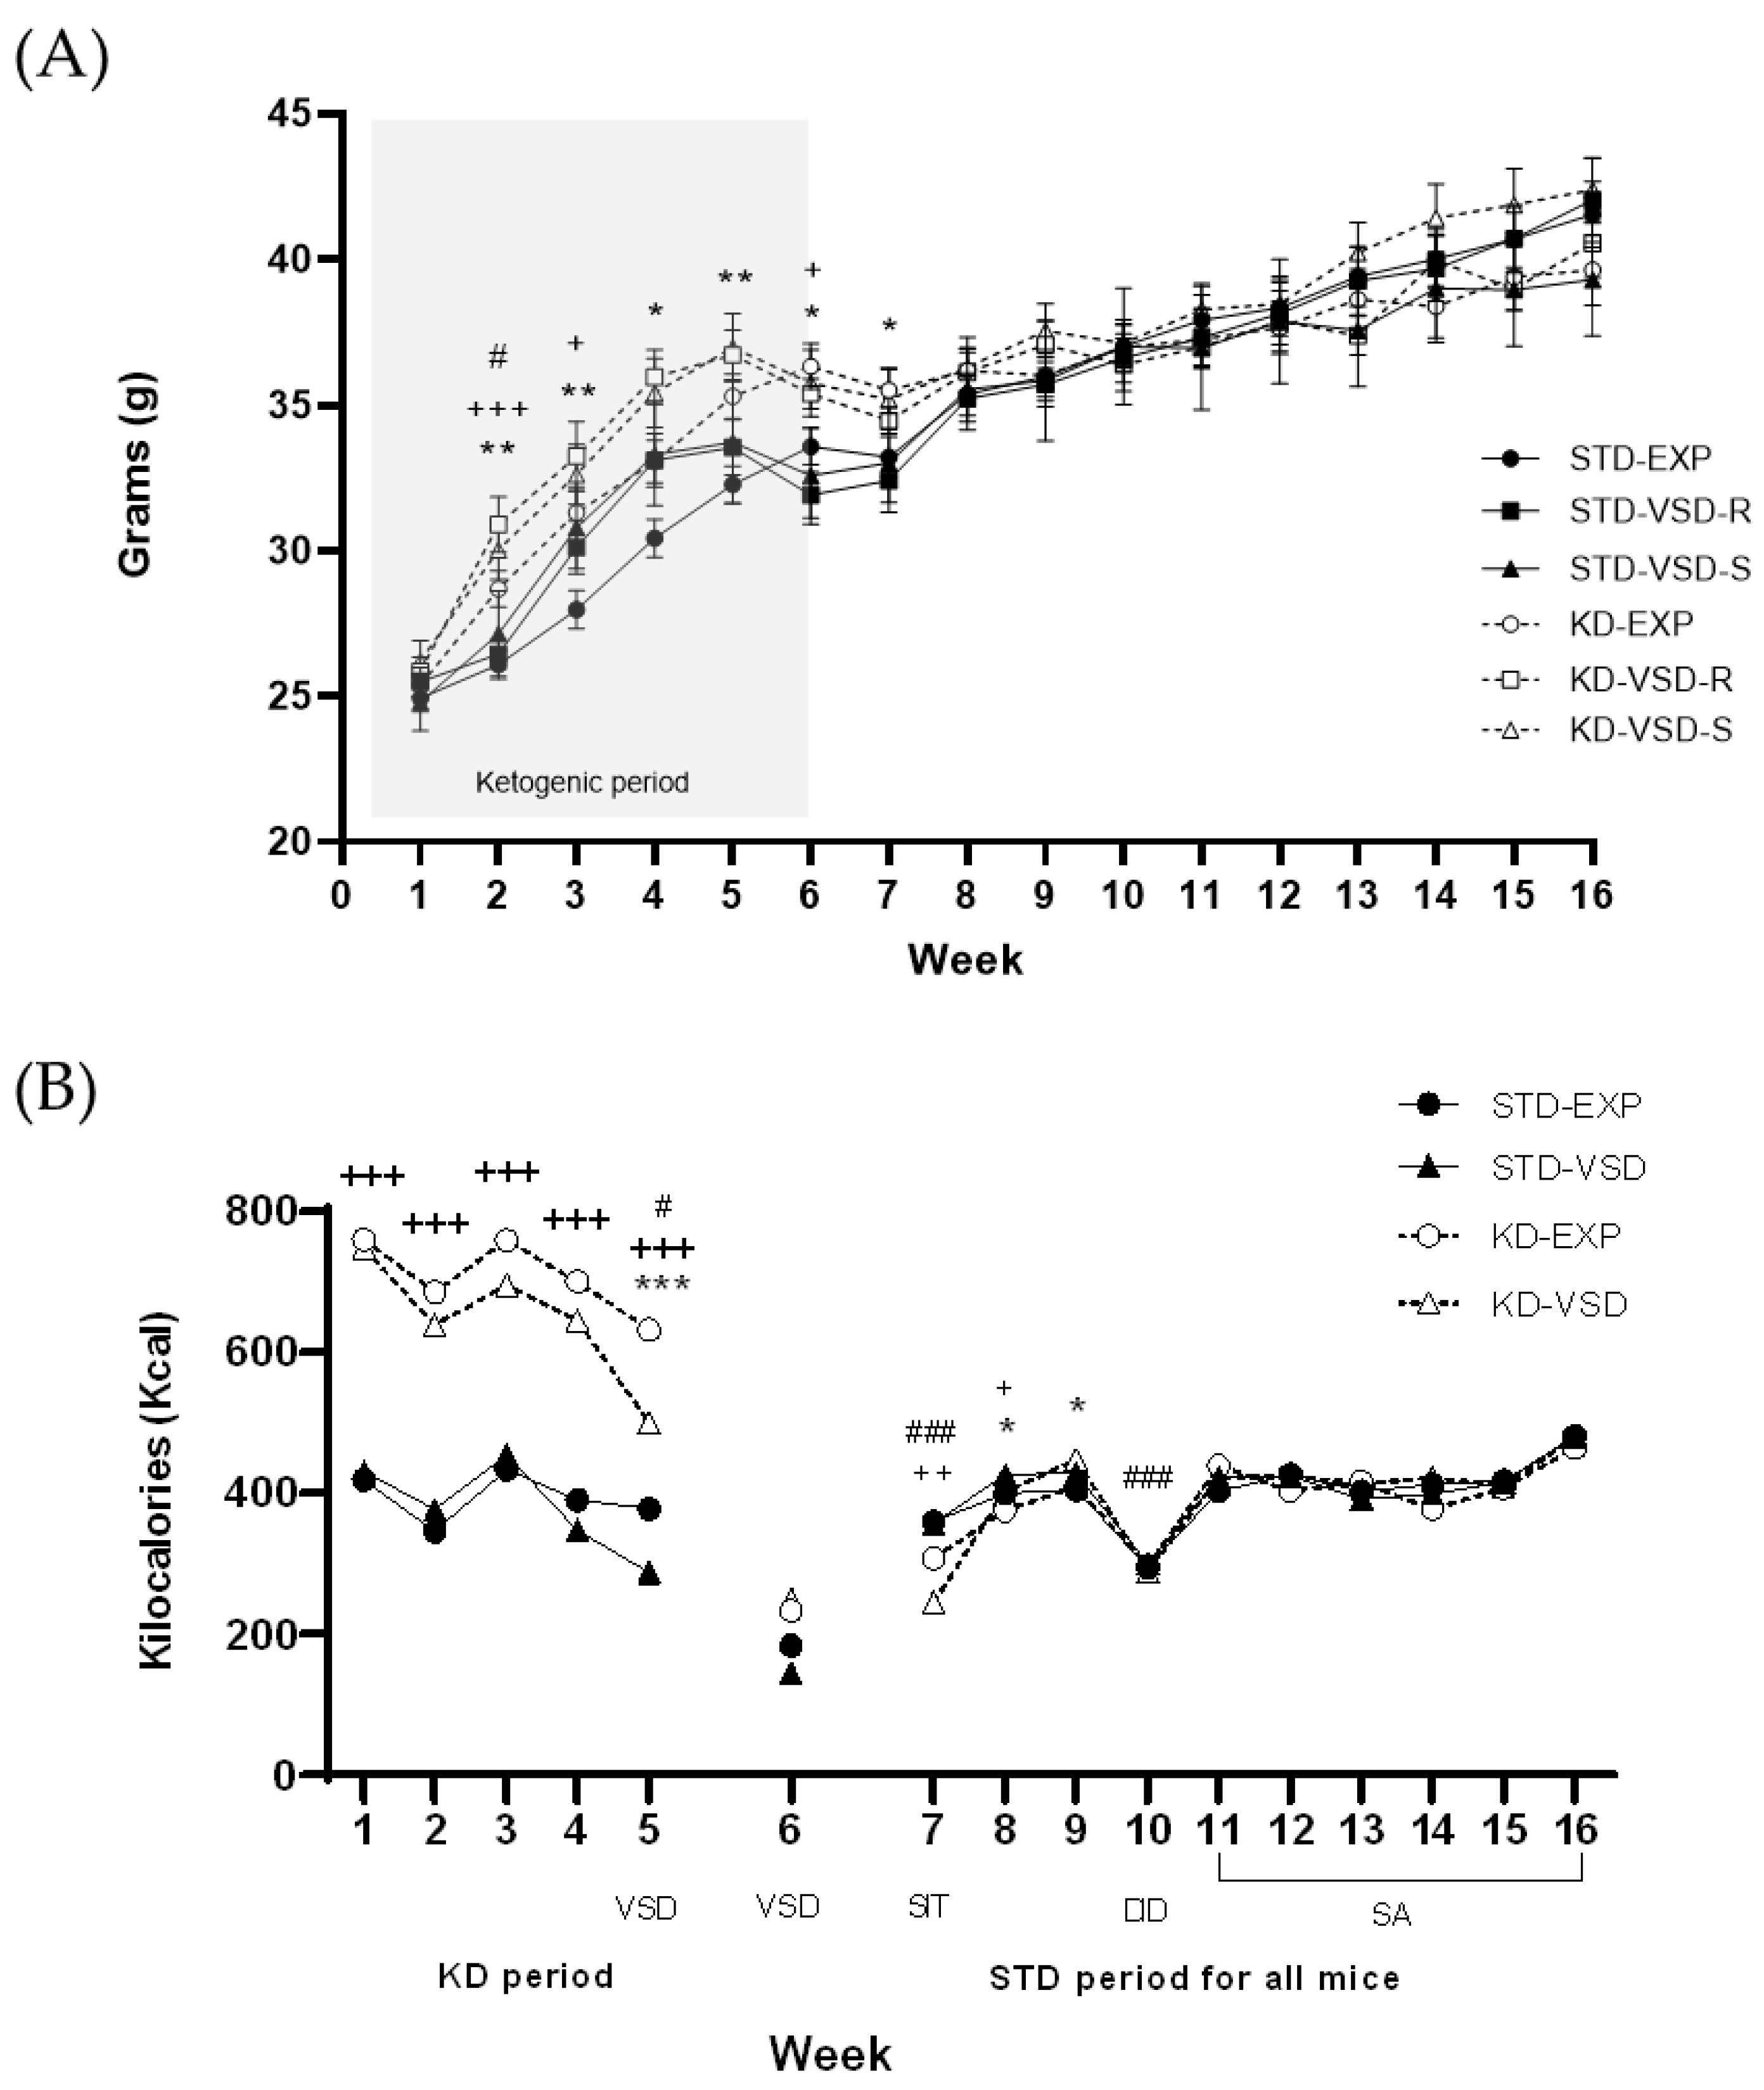
3.1. Body Weight
3.2. The Kcal Intake
3.3. Ketosis State
3.4. Corticosterone Levels
3.5. Social Interaction Test (SIT)
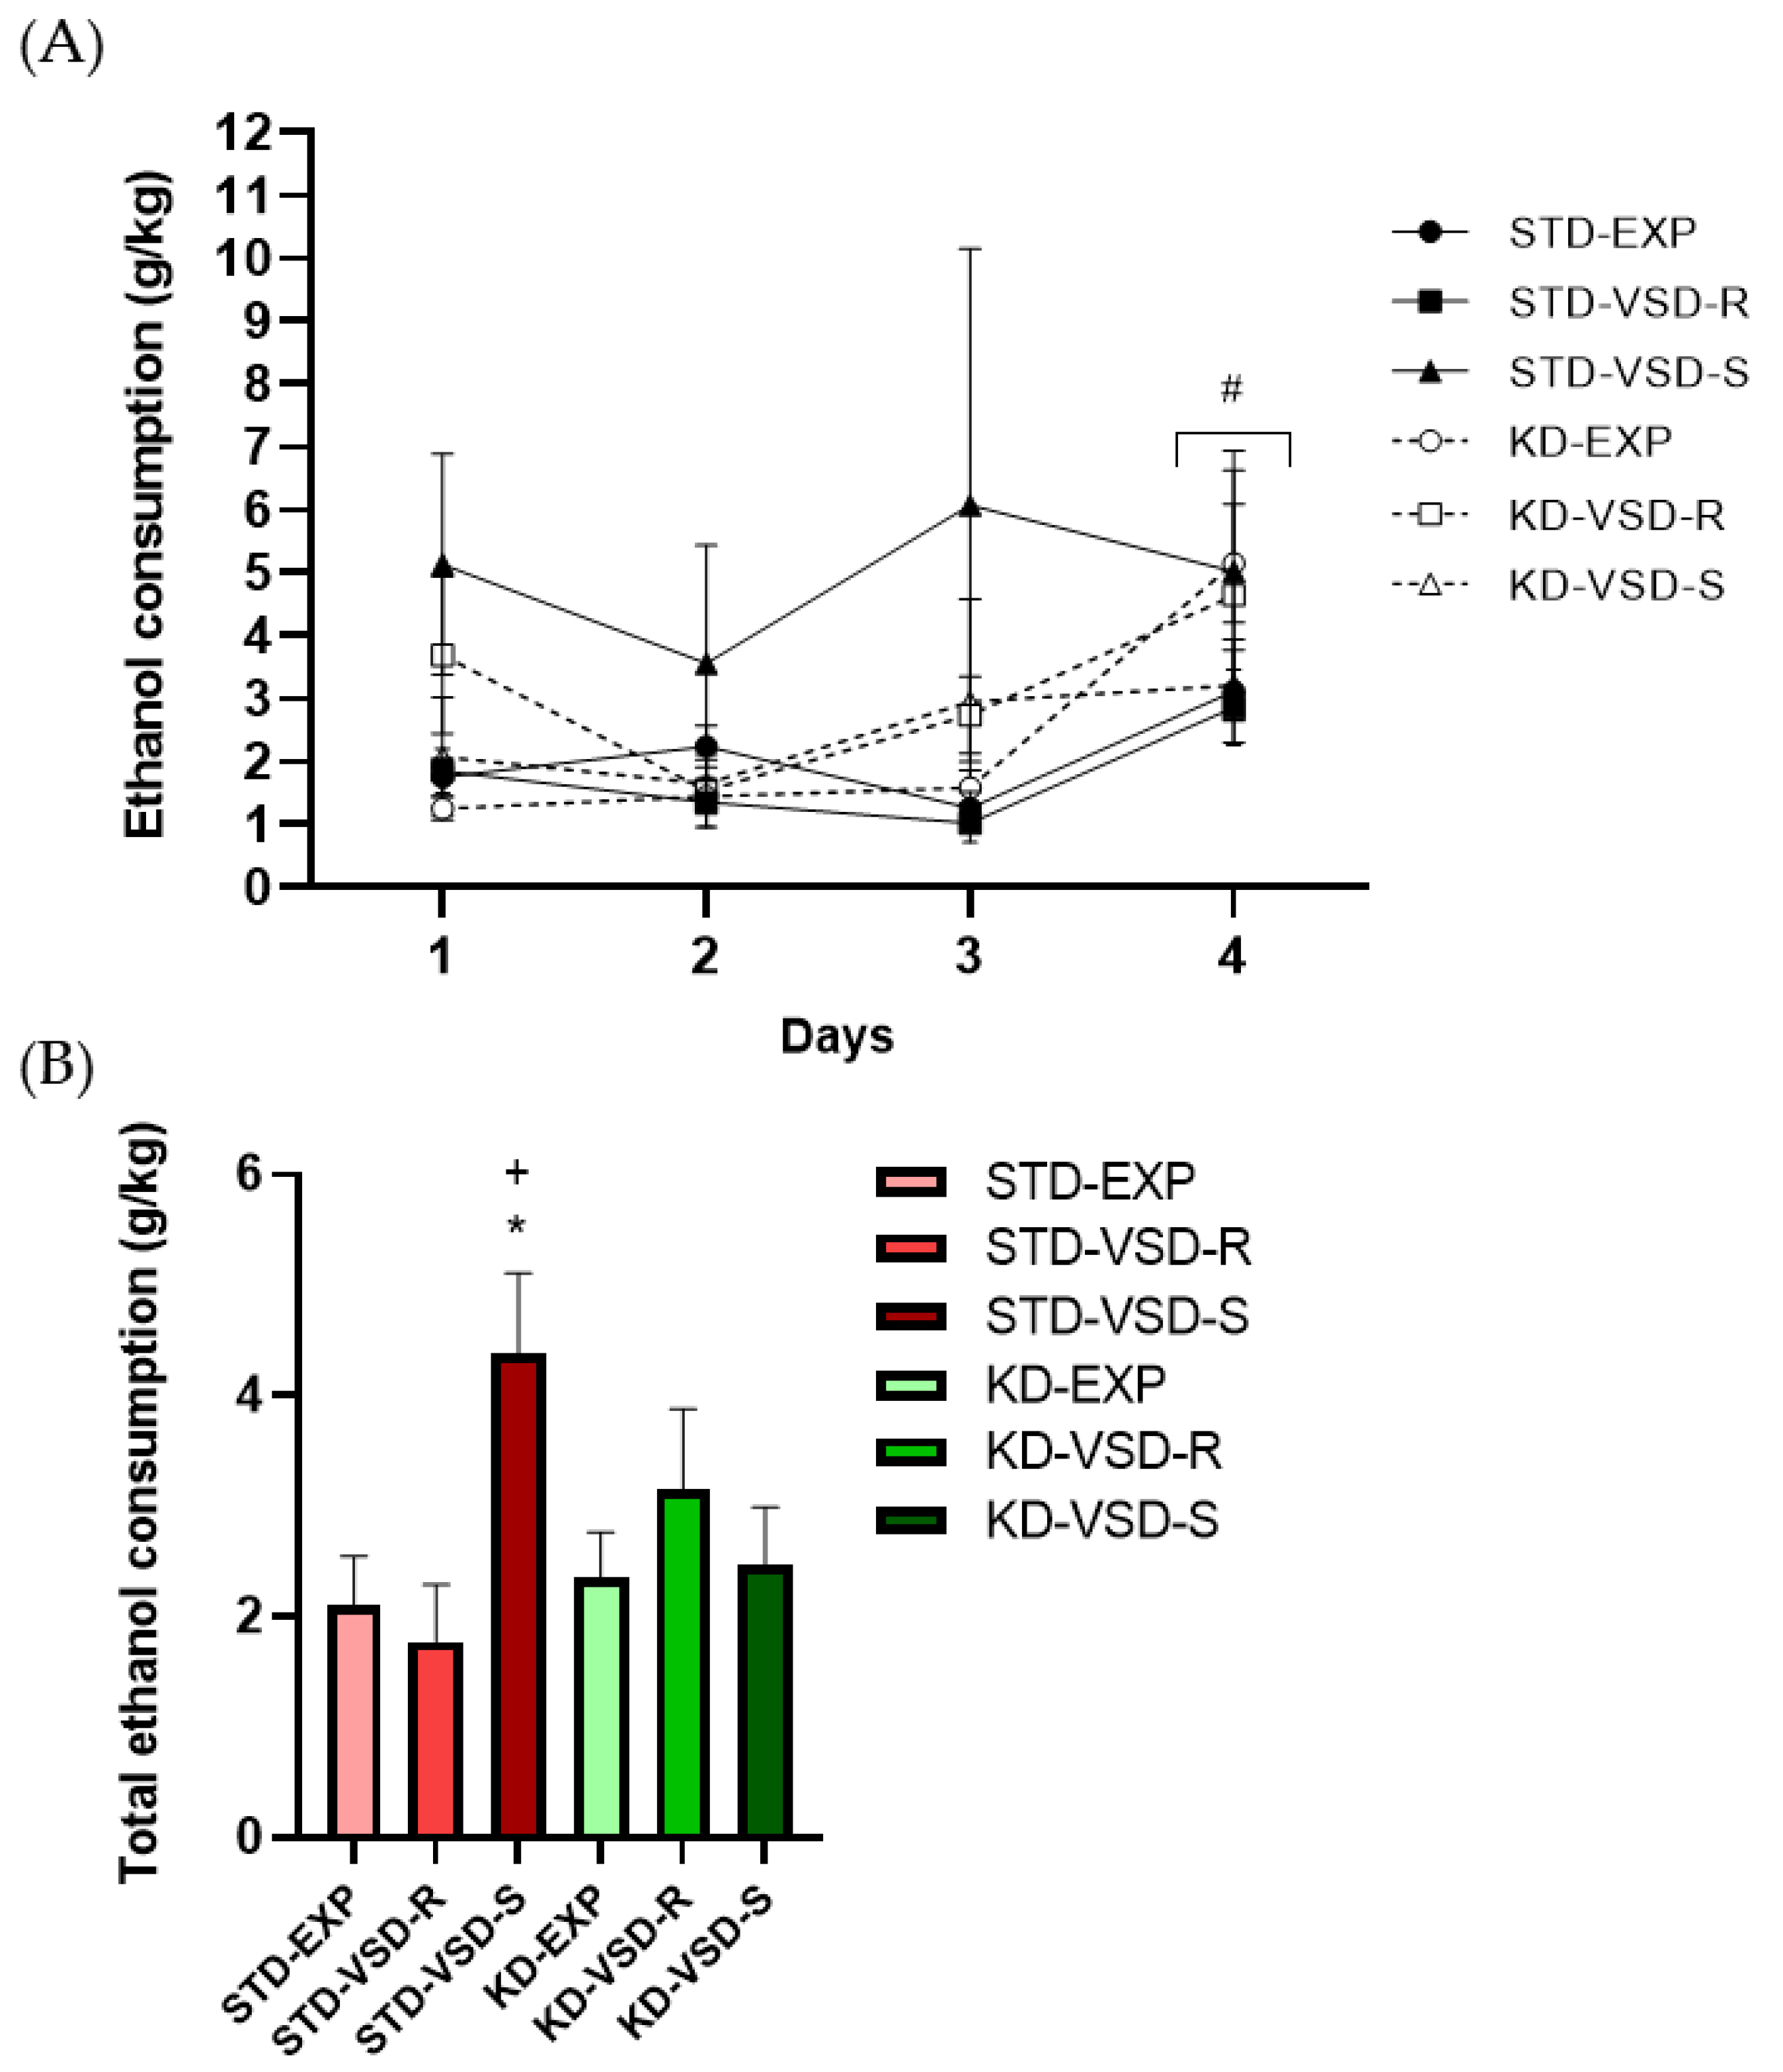
3.6. Drinking in the Dark (DID)
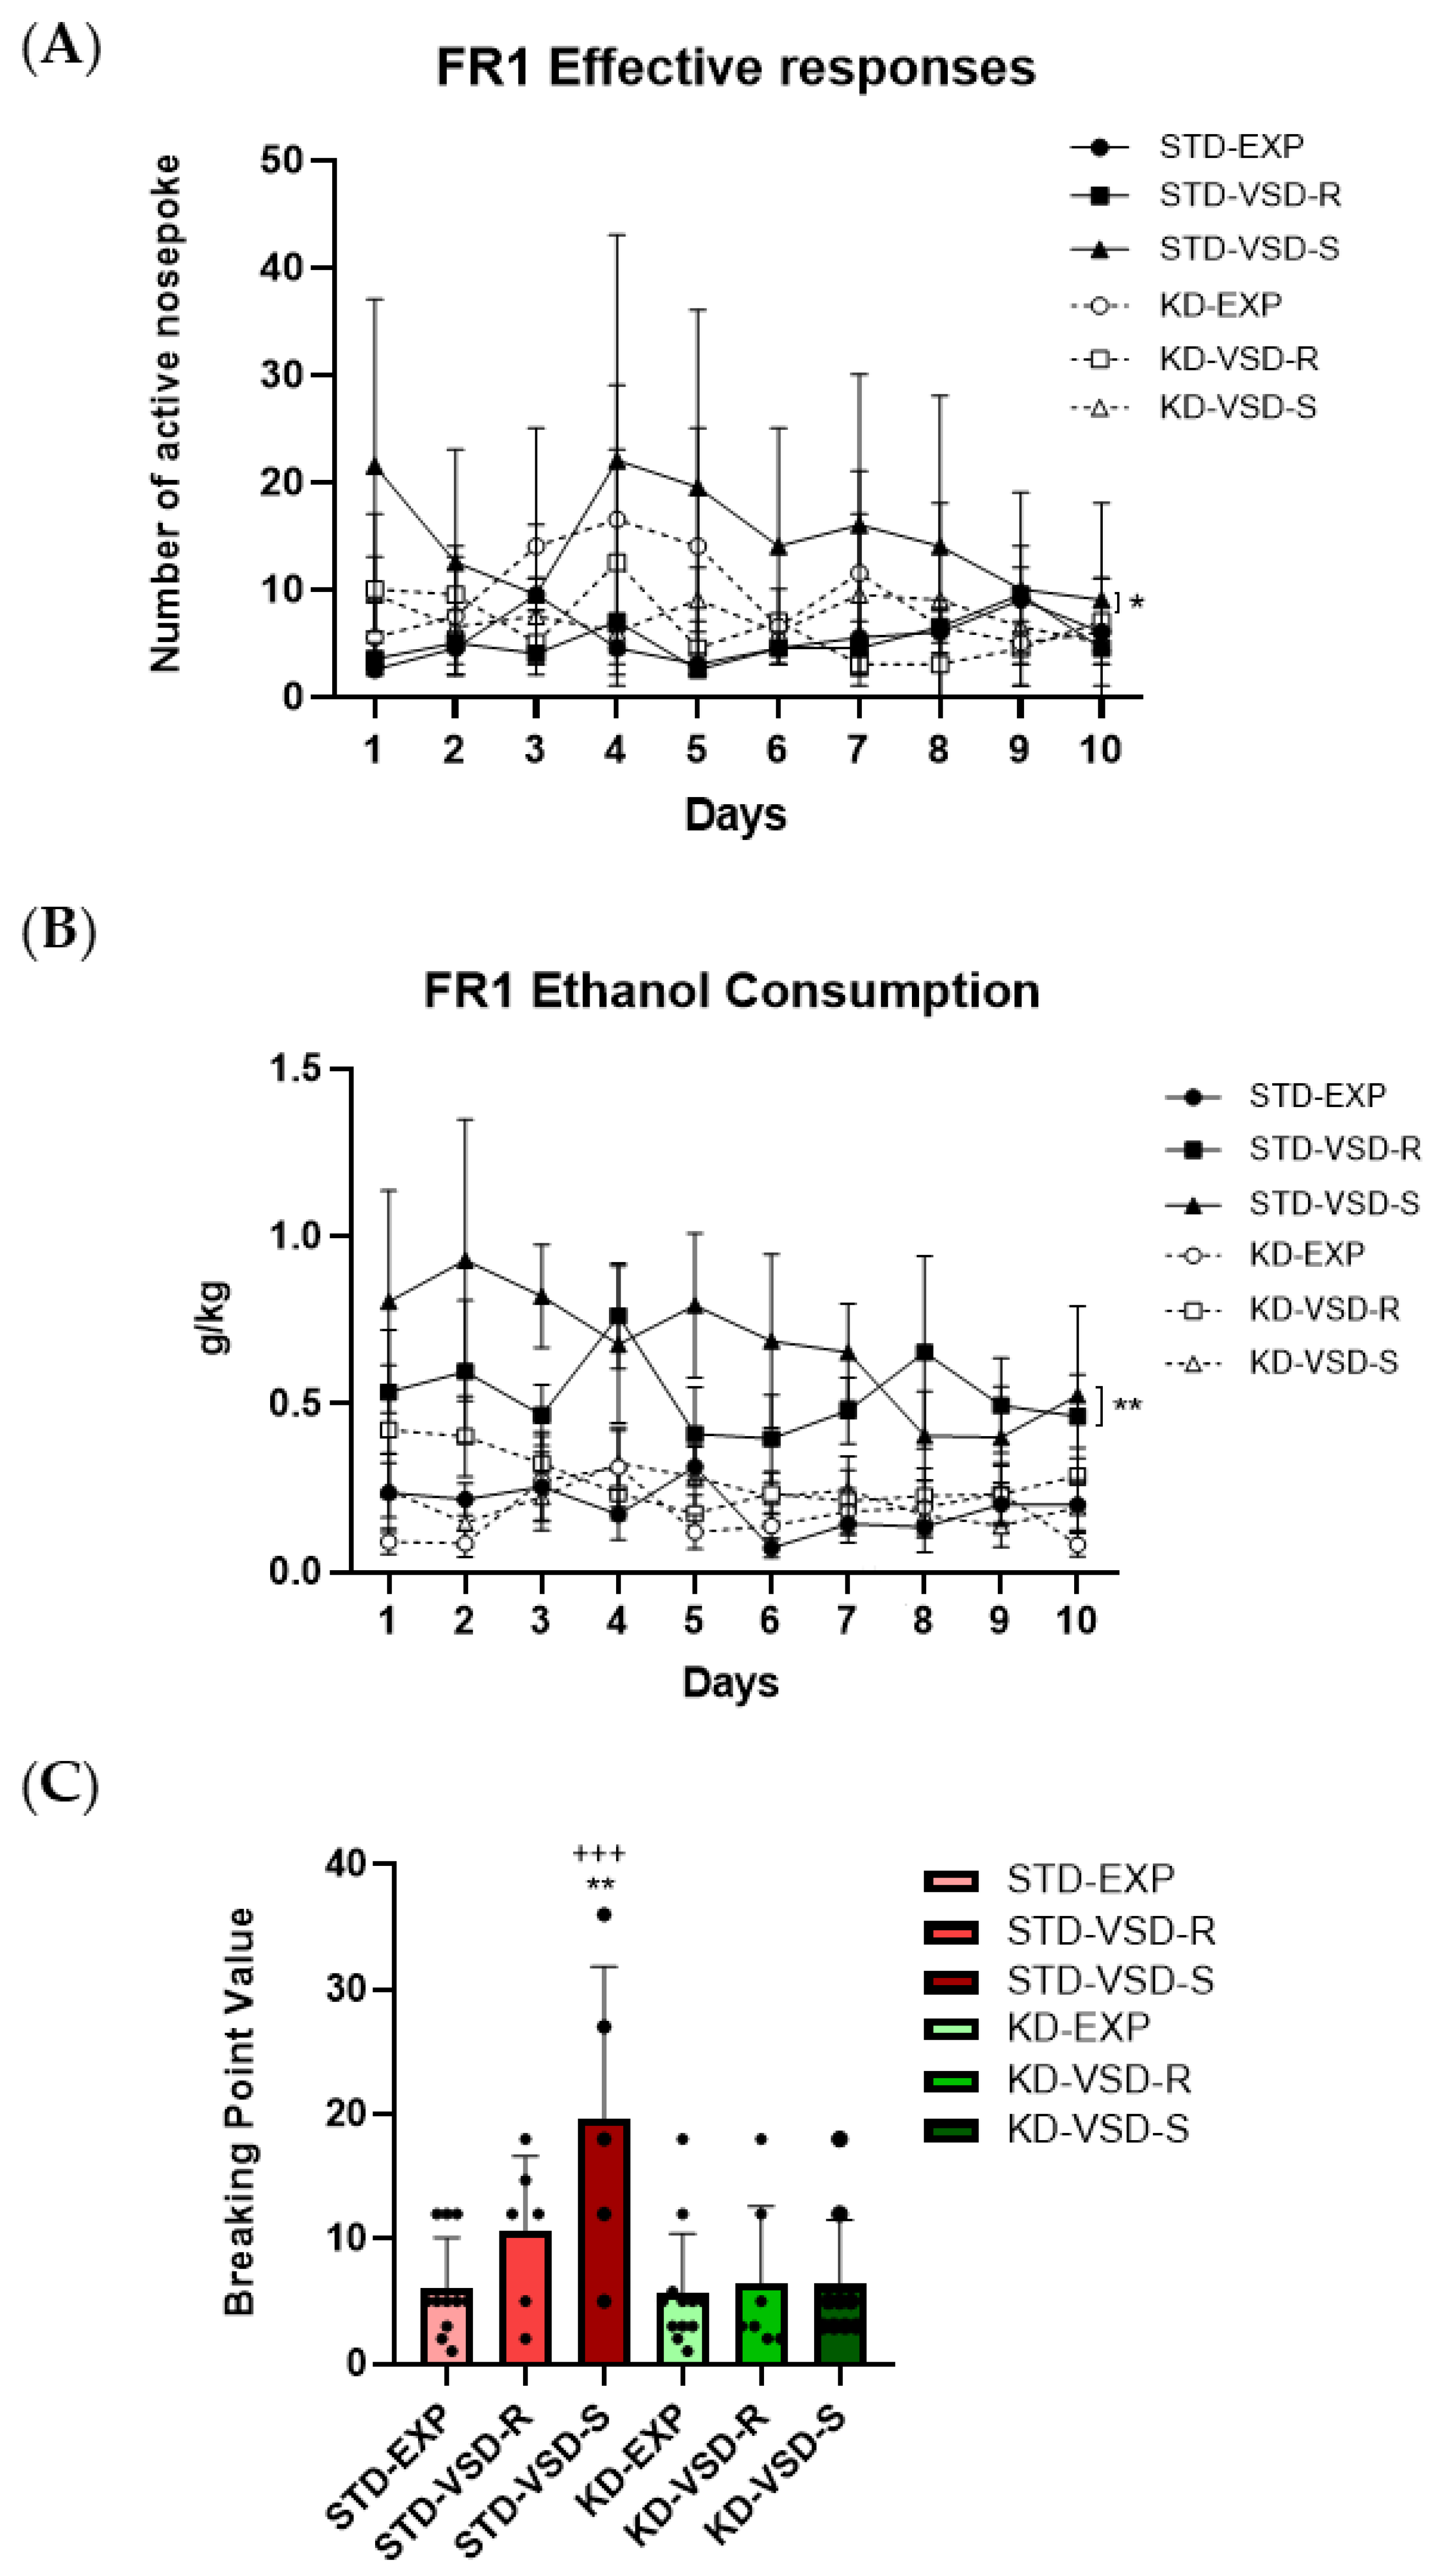
3.7. Oral Ethanol Self-Administration (SA)
3.8. Gene Expression
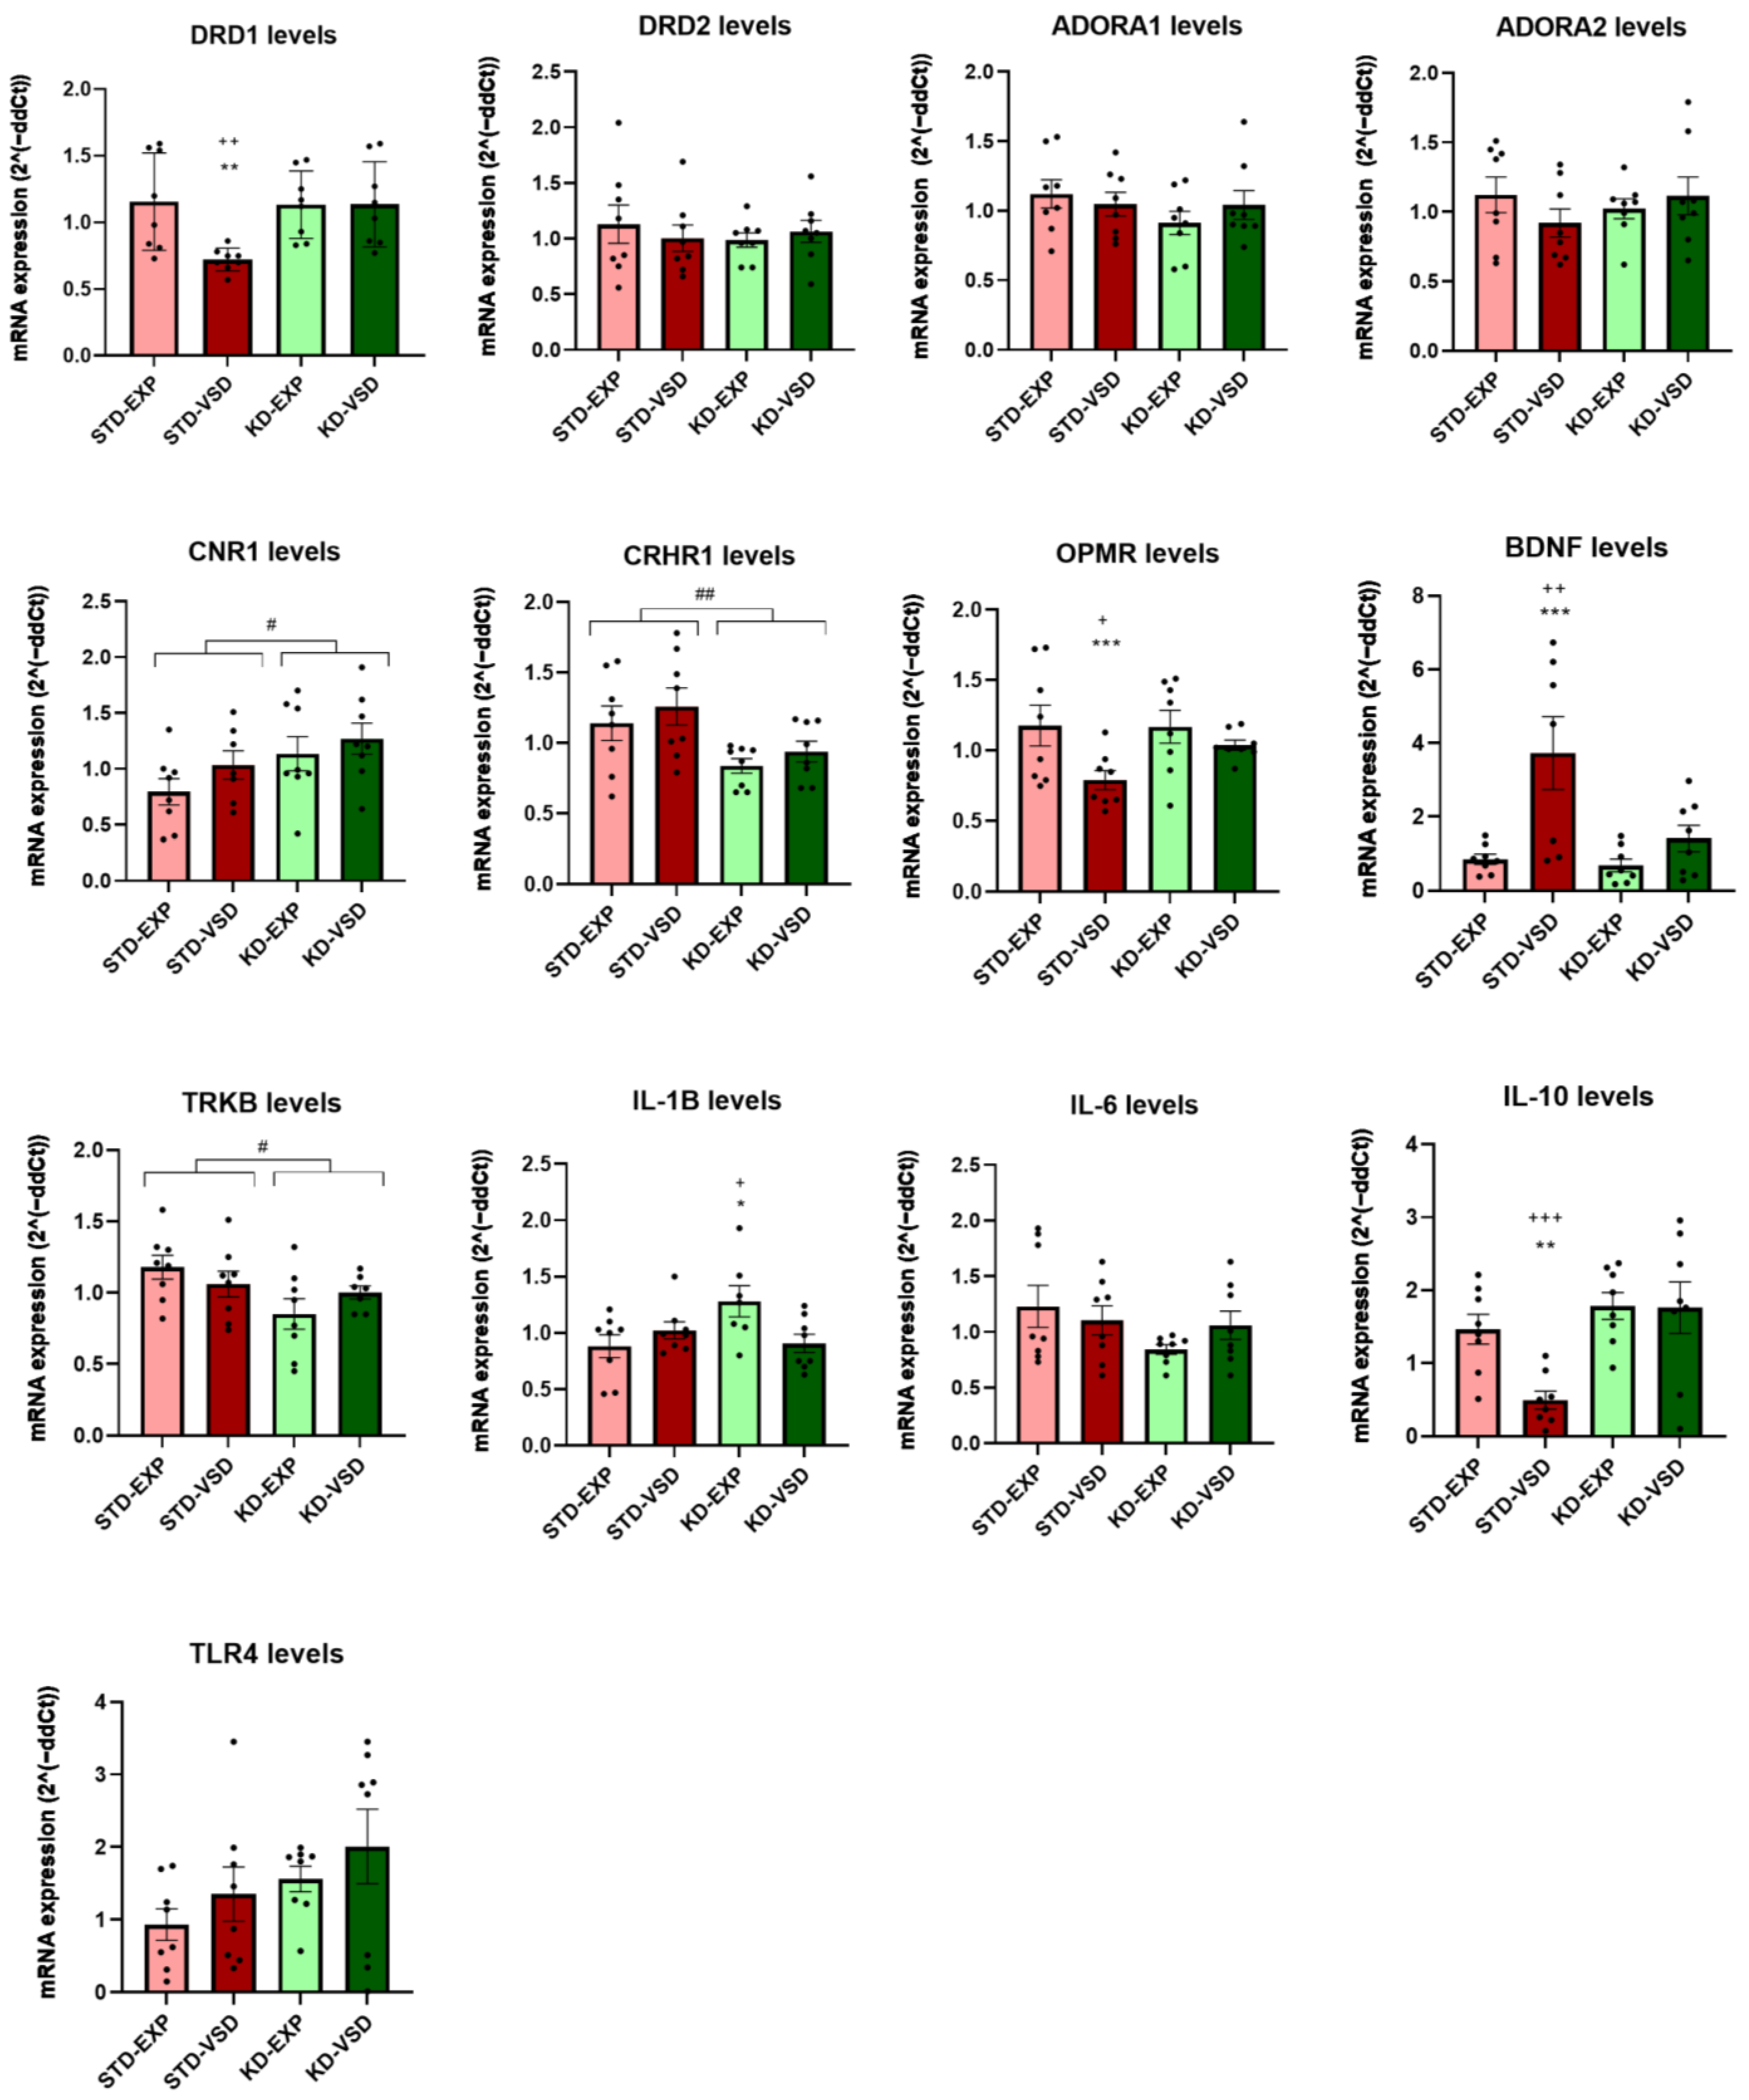
3.8.1. Striatum Samples
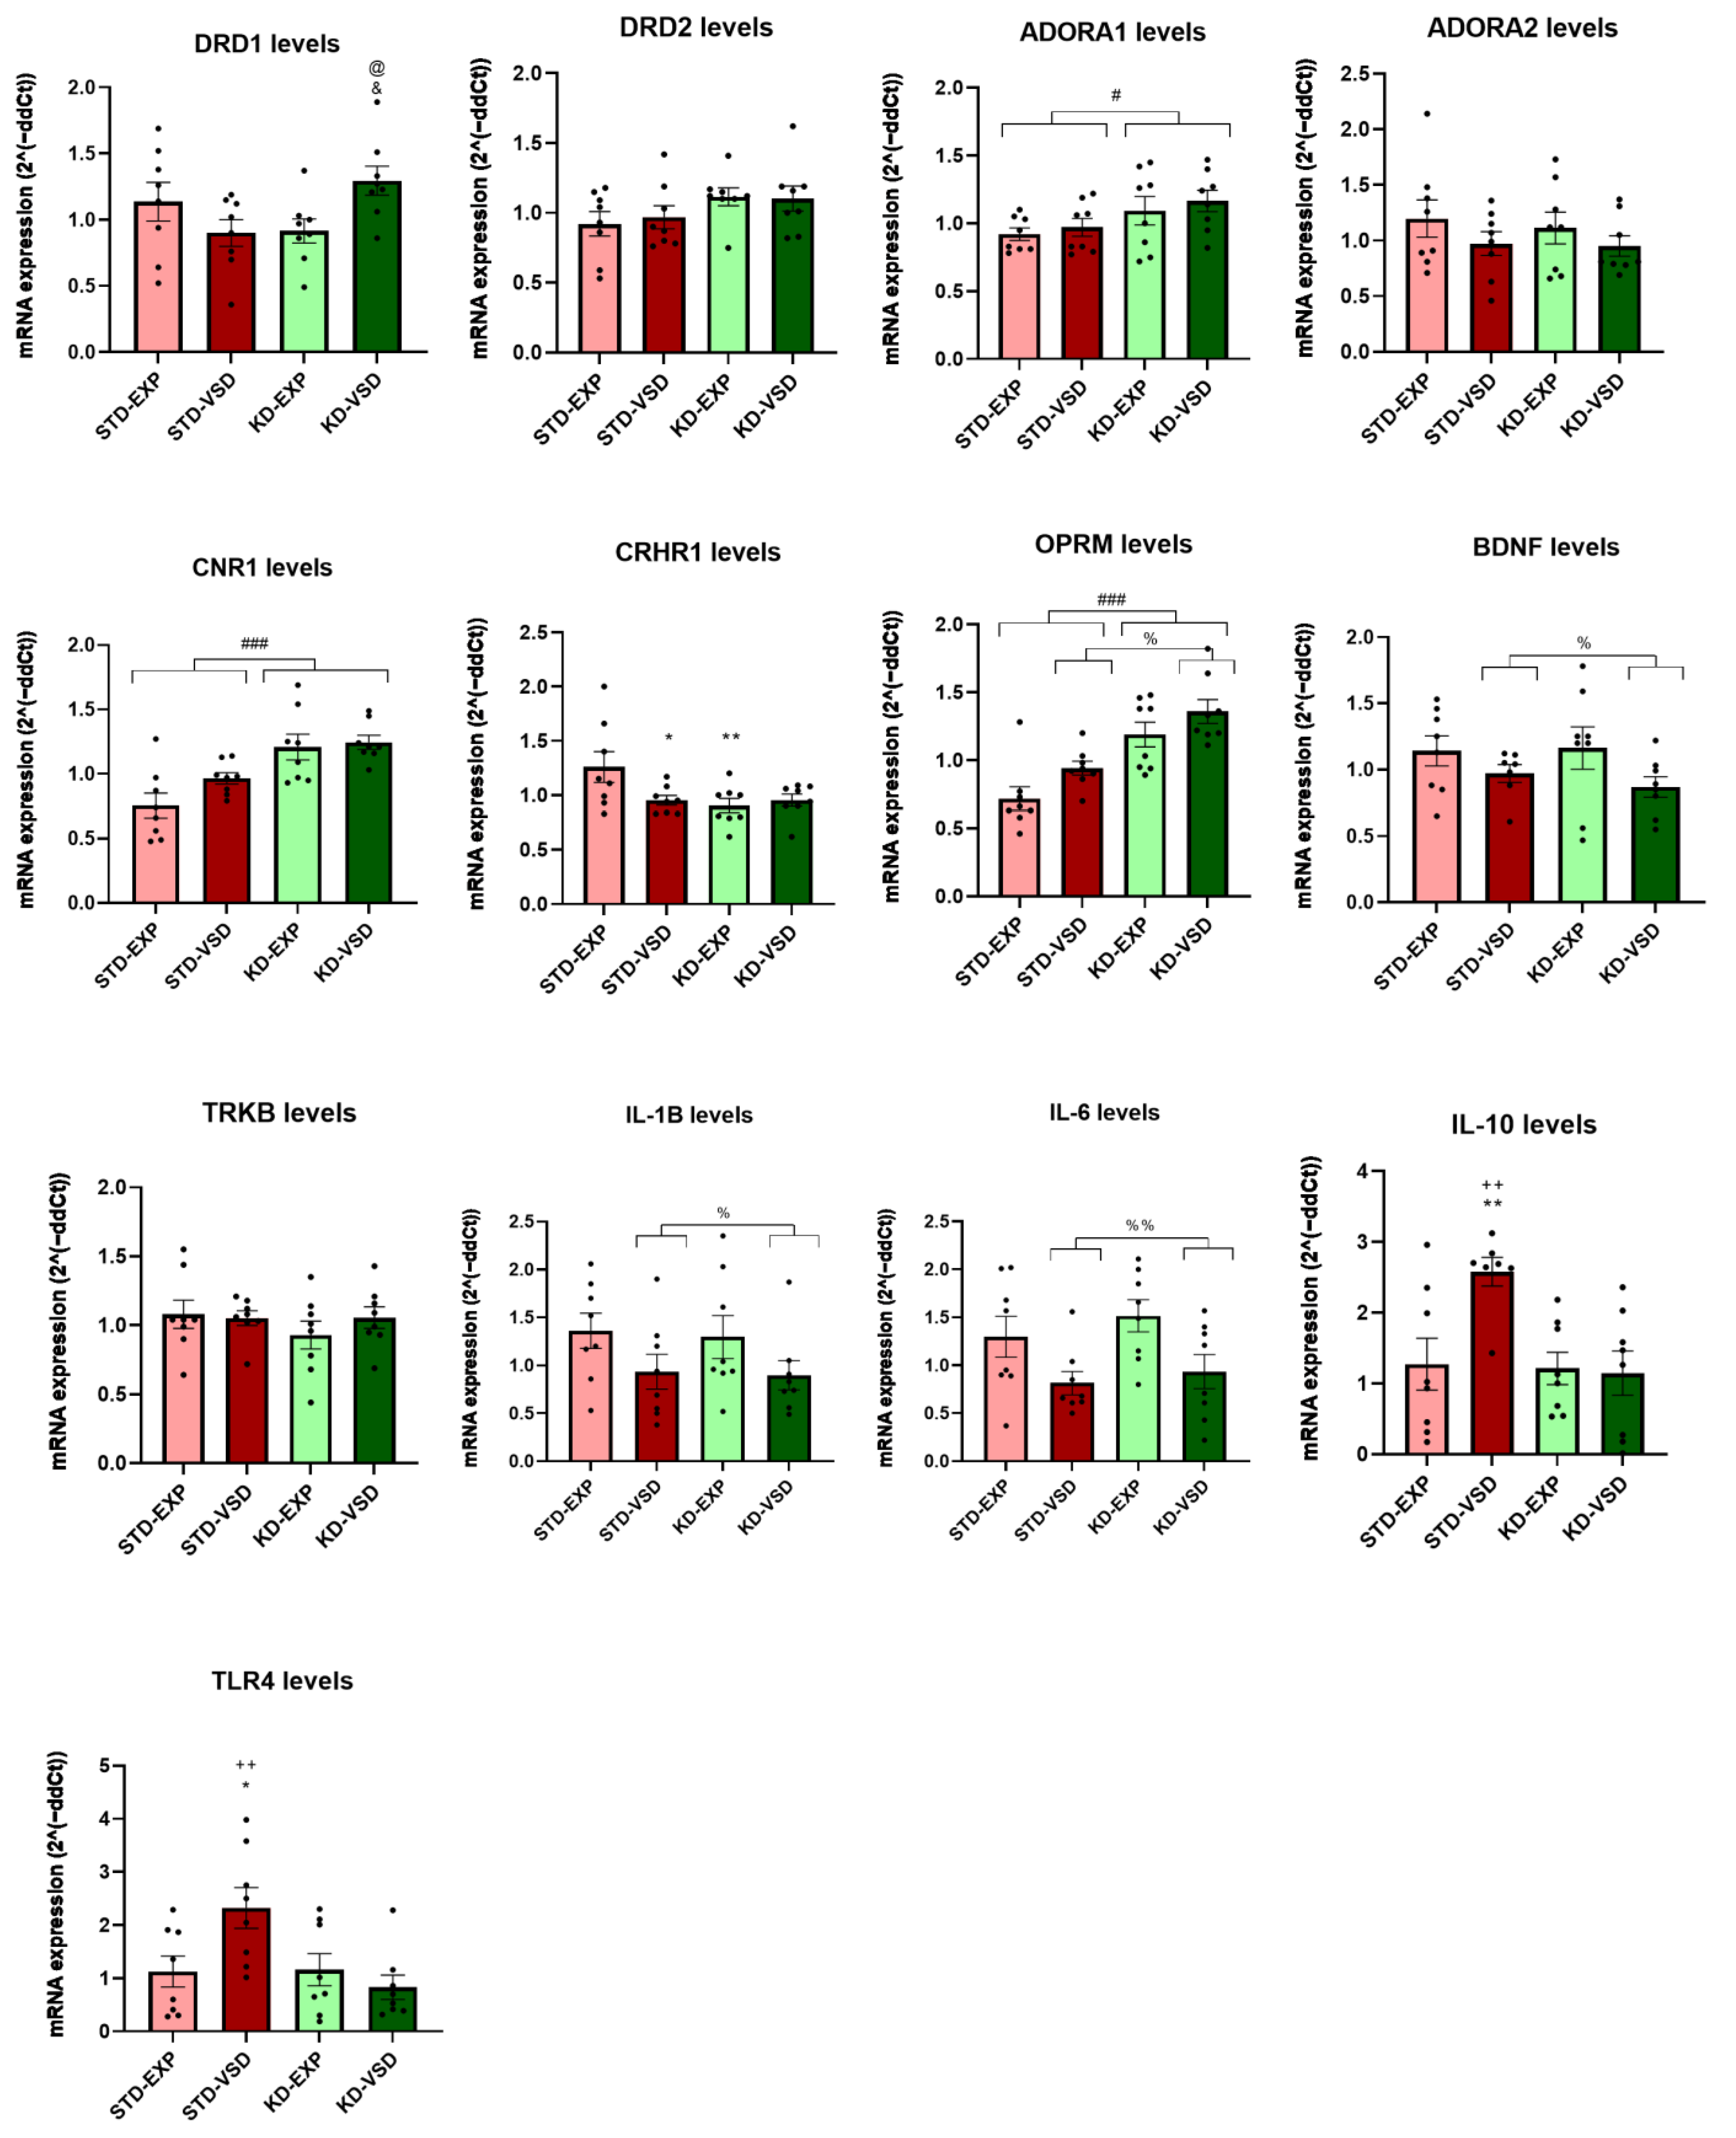
3.8.2. Hippocampus Samples
4. Discussion
4.1. KD Increased βHB Levels, Body Weight, and Kcal Intake
4.2. KD Increases the Percentage of Susceptible Female Mice According to the SIT Ratio
4.3. VSD Increased Ethanol Consumption and KD Blocked This Effect
4.4. KD Induces Long-Lasting Changes in Gene Expression
5. Conclusions
Author Contributions
Funding
Institutional Review Board Statement
Informed Consent Statement
Data Availability Statement
Conflicts of Interest
References
- Reguilón, M.D.; Ferrer-Pérez, C.; Ballestín, R.; Miñarro, J.; Rodríguez-Arias, M. Voluntary wheel running protects against the increase in ethanol consumption induced by social stress in mice. Drug Alcohol Depend. 2020, 212, 108004. [Google Scholar] [CrossRef]
- Ródenas-González, F.; Arenas, M.C.; Blanco-Gandía, M.C.; Manzanedo, C.; Rodríguez-Arias, M. Vicarious Social Defeat Increases Conditioned Rewarding Effects of Cocaine and Ethanol Intake in Female Mice. Biomedicines 2023, 11, 502. [Google Scholar] [CrossRef] [PubMed]
- Beutel, T.F.; Zwerenz, R.; Michal, M. Psychosocial stress impairs health behavior in patients with mental disorders. BMC Psychiatry 2018, 18, 375. [Google Scholar] [CrossRef] [PubMed]
- Swaab, D.F.; Bao, A. Sex differences in stress-related disorders: Major depressive disorder, bipolar disorder, and posttraumatic stress disorder. Handb. Clin. Neurol. 2020, 175, 335–358. [Google Scholar] [CrossRef] [PubMed]
- Holly, E.N.; Miczek, K.A. Ventral tegmental area dopamine revisited: Effects of acute and repeated stress. Psychopharmacology 2015, 233, 163–186. [Google Scholar] [CrossRef] [PubMed]
- Montagud-romero, S.; Blanco-gandía, M.C.; Reguilón, M.D.; Ferrer-pérez, C.; Ballestín, R.; Miñarro, J.; Rodríguez-arias, M. Social defeat stress: Mechanisms underlying the increase in rewarding effects of drugs of abuse. Eur. J. Neurosci. 2018, 48, 2948–2970. [Google Scholar] [CrossRef]
- Newman, E.L.; Leonard, M.Z.; Arena, D.T.; De Almeida, R.M.M.; Miczek, K.A. Social defeat stress and escalation of cocaine and alcohol consumption: Focus on CRF. Neurobiol. Stress 2018, 9, 151–165. [Google Scholar] [CrossRef]
- Norman, K.J.; Seiden, J.A.; Klickstein, J.A.; Han, X.; Hwa, L.S.; Debold, J.F.; Miczek, K.A. Social stress and escalated drug self-administration in mice I. Alcohol and corticosterone. Psychopharmacology 2014, 232, 991–1001. [Google Scholar] [CrossRef]
- Hammels, C.; Pishva, E.; De Vry, J.; Van Den Hove, D.L.A.; Prickaerts, J.; Van Winkel, R.; Selten, J.; Lesch, K.; Daskalakis, N.P.; Steinbusch, H.W.M.; et al. Defeat stress in rodents: From behavior to molecules. Neurosci. Biobehav. Rev. 2015, 59, 111–140. [Google Scholar] [CrossRef]
- Ferrer-Pérez, C.; Castro-Zavala, A.; Luján, M.Á.; Filarowska, J.; Ballestín, R.; Miñarro, J.; Valverde, O.; Rodríguez-Arias, M. Oxytocin prevents the increase of cocaine-related responses produced by social defeat. Neuropharmacology 2018, 146, 50–64. [Google Scholar] [CrossRef]
- Montagud-Romero, S.; Nuñez, C.; Blanco-Gandia, M.C.; Martínez-Laorden, E.; Aguilar, M.A.; Navarro-Zaragoza, J.; Almela, P.; Milanés, M.; Laorden, M.; Miñarro, J.; et al. Repeated social defeat and the rewarding effects of cocaine in adult and adolescent mice: Dopamine transcription factors, proBDNF signaling pathways, and the TrkB receptor in the mesolimbic system. Psychopharmacology 2017, 234, 2063–2075. [Google Scholar] [CrossRef]
- Ferrer-Pérez, C.; Reguilón, M.D.; Miñarro, J.; Rodríguez-Arias, M. Endogenous oxytocin is essential for the buffering effects of pair housing against the increase in cocaine reward induced by social stress. Physiol. Behav. 2020, 221, 112913. [Google Scholar] [CrossRef]
- Montagud-Romero, S.; Montesinos, J.; Pavón, F.J.; Blanco-Gandia, M.C.; Ballestín, R.; Rodríguez De Fonseca, F.; Miñarro, J.; Guerri, C.; Rodríguez-Arias, M. Social defeat-induced increase in the conditioned rewarding effects of cocaine: Role of CX3CL1. Prog. Neuro-Psychopharmacol. Biol. Psychiatry 2020, 96, 109753. [Google Scholar] [CrossRef]
- Rodríguez-Arias, M.; Montagud-Romero, S.; Guardia Carrión, A.M.; Ferrer-Pérez, C.; Pérez-Villalba, A.; Marco, E.; López Gallardo, M.; Viveros, M.; Miñarro, J. Social stress during adolescence activates long-term microglia inflammation insult in reward processing nuclei. PLoS ONE 2018, 13, e0206421. [Google Scholar] [CrossRef]
- Montagud-Romero, S.; Reguilon, M.D.; Roger-Sanchez, C.; Pascual, M.; Aguilar, M.A.; Guerri, C.; Miñarro, J.; Rodríguez-Arias, M. Role of dopamine neurotransmission in the long-term effects of repeated social defeat on the conditioned rewarding effects of cocaine. Prog. Neuro-Psychopharmacol. Biol. Psychiatry 2016, 71, 144–154. [Google Scholar] [CrossRef]
- Avgustinovich, D.F.; Alekseyenko, O.V. [3 H] SCH 23390 Binding in Various Brain Regions of C57BL/6J Mice with Repeated Experience of Victory or Social Defeat in Agonistic Interactions. Physiol. Res. 2009, 59, 455–458. [Google Scholar] [CrossRef] [PubMed]
- Huang, G.; Zhao, T.; Gao, X.; Zhang, H.; Xu, Y.; Li, H.; Lv, L. Effect of chronic social defeat stress on behaviors and dopamine receptor in adult mice. Prog. Neuro-Psychopharmacol. Biol. Psychiatry 2015, 66, 73–79. [Google Scholar] [CrossRef]
- González-Portilla, M.; Montagud-Romero, S.; Rodríguez De Fonseca, F.; Rodríguez-Arias, M. Oleoylethanolamide restores stress-induced prepulse inhibition deficits and modulates inflammatory signaling in a sex-dependent manner. Psychopharmacology 2023. [Google Scholar] [CrossRef] [PubMed]
- Iñiguez, S.D.; Flores-Ramirez, F.J.; Riggs, L.M.; Alipio, J.B.; Garcia-Carachure, I.; Hernandez, M.A.; Sanchez, D.O.; Lobo, M.K.; Serrano, P.A.; Braren, S.H.; et al. Vicarious Social Defeat Stress Induces Depression-Related Outcomes in Female Mice. Biol. Psychiatry 2018, 83, 9–17. [Google Scholar] [CrossRef]
- Huang, M.; Su, S.; Goldberg, J.; Miller, A.H.; Levantsevych, O.M.; Shallenberger, L.; Pimple, P.; Pearce, B.; Bremner, J.D.; Vaccarino, V. Longitudinal association of inflammation with depressive symptoms: A 7-year cross-lagged twin difference study. Brain Behav. Immun. 2018, 75, 200–207. [Google Scholar] [CrossRef] [PubMed]
- Breymeyer, K.L.; Lampe, J.W.; Mcgregor, B.A.; Neuhouser, M.L. Subjective mood and energy levels of healthy weight and overweight/obese healthy adults on high-and low-glycemic load experimental diets. Appetite 2016, 107, 253–259. [Google Scholar] [CrossRef] [PubMed]
- Blanco-Gandía, M.C.; Aracil-Fernández, A.; Montagud-Romero, S.; Aguilar, M.A.; Manzanares, J.; Miñarro, J.; Rodríguez-Arias, M. Changes in gene expression and sensitivity of cocaine reward produced by a continuous fat diet. Psychopharmacology 2017, 234, 2337–2352. [Google Scholar] [CrossRef]
- Blanco-Gandía, M.C.; Ledesma, J.C.; Aracil-Fernández, A.; Navarrete, F.; Montagud-Romero, S.; Aguilar, M.A.; Manzanares, J.; Miñarro, J.; Rodríguez-Arias, M. The rewarding effects of ethanol are modulated by binge eating of a high-fat diet during adolescence. Neuropharmacology 2017, 121, 219–230. [Google Scholar] [CrossRef] [PubMed]
- Blanco-Gandía, M.C.; Cantacorps, L.; Aracil-Fernández, A.; Montagud-Romero, S.; Aguilar, M.A.; Manzanares, J.; Valverde, O.; Miñarro, J.; Rodríguez-Arias, M. Effects of bingeing on fat during adolescence on the reinforcing effects of cocaine in adult male mice. Neuropharmacology 2016, 113, 31–44. [Google Scholar] [CrossRef] [PubMed]
- Blanco-Gandía, M.C.; Miñarro, J.; Aguilar, M.A.; Rodríguez-Arias, M. Increased ethanol consumption after interruption of fat bingeing. PLoS ONE 2018, 13, e0194431. [Google Scholar] [CrossRef]
- Martins De Carvalho, L.; Lauar Gonçalves, J.; Sondertoft Braga Pedersen, A.; Damasceno, S.; Elias Moreira Júnior, R.; Uceli Maioli, T.; Faria, A.M.C.D.; Brunialti Godard, A.L. High-fat diet withdrawal modifies alcohol preference and transcription of dopaminergic and GABAergic receptors. J. Neurogenet. 2018, 33, 10–20. [Google Scholar] [CrossRef]
- Ródenas-González, F.; Blanco-Gandía, M.D.C.; Pascual, M.; Molari, I.; Guerri, C.; López, J.M.; Rodríguez-Arias, M. A limited and intermittent access to a high-fat diet modulates the effects of cocaine-induced reinstatement in the conditioned place preference in male and female mice. Psychopharmacology 2021, 238, 2091–2103. [Google Scholar] [CrossRef]
- Kasprowska-Liśkiewicz, D.; Liśkiewicz, A.D.; Nowacka-Chmielewska, M.M.; Nowicka, J.; Małecki, A.; Barski, J.J. The ketogenic diet affects the social behavior of young male rats. Physiol. Behav. 2017, 179, 168–177. [Google Scholar] [CrossRef]
- Kessler, S.K.; Gallagher, P.R.; Shellhaas, R.A.; Clancy, R.R.; Bergqvist, A.G.C. Early EEG improvement after ketogenic diet initiation. Epilepsy Res. 2011, 94, 94–101. [Google Scholar] [CrossRef]
- Wells, J.; Swaminathan, A.; Paseka, J.; Hanson, C. Efficacy and Safety of a Ketogenic Diet in Children and Adolescents with Refractory Epilepsy—A Review. Nutrients 2020, 12, 1809. [Google Scholar] [CrossRef]
- Yao, J.; Chen, S.; Mao, Z.; Cadenas, E.; Brinton, R.D. 2-Deoxy-D-Glucose Treatment Induces Ketogenesis, Sustains Mitochondrial Function, and Reduces Pathology in Female Mouse Model of Alzheimer’s Disease. PLoS ONE 2011, 6, e21788. [Google Scholar] [CrossRef]
- Koh, S.; Dupuis, N.; Auvin, S. Ketogenic diet and Neuroinflammation. Epilepsy Res. 2020, 167, 106454. [Google Scholar] [CrossRef] [PubMed]
- Maalouf, M.; Rho, J.M.; Mattson, M.P. The neuroprotective properties of calorie restriction, the ketogenic diet, and ketone bodies. Brain Res. Rev. 2008, 59, 293–315. [Google Scholar] [CrossRef]
- Bough, K.J.; Wetherington, J.; Hassel, B.; Pare, J.F.; Gawryluk, J.W.; Greene, J.G.; Shaw, R.; Smith, Y.; Geiger, J.D.; Dingledine, R.J. Mitochondrial biogenesis in the anticonvulsant mechanism of the ketogenic diet. Ann. Neurol. 2006, 60, 223–235. [Google Scholar] [CrossRef] [PubMed]
- Blanco-Gandía, M.D.C.; Ródenas-González, F.; Pascual, M.; Reguilón, M.D.; Guerri, C.; Miñarro, J.; Rodríguez-Arias, M. Ketogenic Diet Decreases Alcohol Intake in Adult Male Mice. Nutrients 2021, 13, 2167. [Google Scholar] [CrossRef]
- Ródenas-González, F.; Blanco-Gandía, M.C.; Miñarro, J.; Rodríguez-Arias, M. Effects of ketosis on cocaine-induced reinstatement in male mice. Neurosci. Lett. 2022, 778, 136619. [Google Scholar] [CrossRef] [PubMed]
- Bornebusch, A.B.; Mason, G.F.; Tonetto, S.; Damsgaard, J.; Gjedde, A.; Fink-Jensen, A.; Thomsen, M. Effects of ketogenic diet and ketone monoester supplement on acute alcohol withdrawal symptoms in male mice. Psychopharmacology 2021, 238, 833–844. [Google Scholar] [CrossRef] [PubMed]
- Mahajan, V.R.; Elvig, S.K.; Vendruscolo, L.F.; Koob, G.F.; Darcey, V.L.; King, M.T.; Kranzler, H.R.; Volkow, N.D.; Wiers, C.E. Nutritional Ketosis as a Potential Treatment for Alcohol Use Disorder. Front. Psychiatry 2021, 12, 781668. [Google Scholar] [CrossRef]
- Wiers, C.E.; Vendruscolo, L.F.; Van Der Veen, J.; Manza, P.; Shokri-Kojori, E.; Kroll, D.S.; Feldman, D.E.; Mcpherson, K.L.; Biesecker, C.L.; Zhang, R.; et al. Ketogenic diet reduces alcohol withdrawal symptoms in humans and alcohol intake in rodents. Sci. Adv. 2021, 7, 15. [Google Scholar] [CrossRef]
- Dencker, D.; Molander, A.; Thomsen, M.; Schlumberger, C.; Wortwein, G.; Weikop, P.; Benveniste, H.; Volkow, N.D.; Fink-jensen, A. Ketogenic Diet Suppresses Alcohol Withdrawal Syndrome in Rats. Alcohol. Clin. Exp. Res. 2017, 42, 270–277. [Google Scholar] [CrossRef]
- Ródenas-González, F.; Blanco-Gandía, M.C.; Miñarro, J.; Rodríguez-Arias, M. Cognitive profile of male mice exposed to a Ketogenic Diet. Physiol. Behav. 2022, 254, 113883. [Google Scholar] [CrossRef] [PubMed]
- Ruskin, D.N.; Kawamura, M.; Masino, S.A. Reduced Pain and Inflammation in Juvenile and Adult Rats Fed a Ketogenic Diet. PLoS ONE 2009, 4, e8349. [Google Scholar] [CrossRef]
- Li, L.; Durand-De Cuttoli, R.; Aubry, A.V.; Burnett, C.J.; Cathomas, F.; Parise, L.F.; Chan, K.L.; Morel, C.; Yuan, C.; Shimo, Y.; et al. Social trauma engages lateral septum circuitry to occlude social reward. Nature 2022, 613, 696–703. [Google Scholar] [CrossRef] [PubMed]
- Pantoja-Urbán, A.H.; Richer, S.; Mittermaier, A.; Giroux, M.; Nouel, D.; Hernandez, G.; Flores, C. Gains and Losses: Resilience to Social Defeat Stress in Adolescent Female Mice. Biol. Psychiatry 2024, 95, 37–47. [Google Scholar] [CrossRef] [PubMed]
- Rhodes, J.S.; Best, K.; Belknap, J.K.; Finn, D.A.; Crabbe, J.C. Evaluation of a simple model of ethanol drinking to intoxication in C57BL/6J mice. Physiol. Behav. 2005, 84, 53–63. [Google Scholar] [CrossRef] [PubMed]
- Guan, Y.; Huang, G.; Xu, M.; Gao, F.; Lin, S.; Huang, J.; Wang, J.; Li, Y.; Wu, C.; Yao, S.; et al. Anti-depression effects of ketogenic diet are mediated via the restoration of microglial activation and neuronal excitability in the lateral habenula. Brain Behav. Immun. 2020, 88, 748–762. [Google Scholar] [CrossRef]
- Olivito, I.; Avolio, E.; Minervini, D.; Soda, T.; Rocca, C.; Angelone, T.; Iaquinta, F.S.; Bellizzi, D.; De Rango, F.; Bruno, R.; et al. Ketogenic diet ameliorates autism spectrum disorders-like behaviors via reduced inflammatory factors and microbiota remodeling in BTBR T+ Itpr3tf/J mice. Exp. Neurol. 2023, 366, 114432. [Google Scholar] [CrossRef]
- Politi, K.; Shemer-Meiri, L.; Shuper, A.; Aharoni, S. The Ketogenic Diet 2011: How It Works. Epilepsy Res. Treat. 2011, 2011, 963637. [Google Scholar] [CrossRef]
- Huang, J.; Li, Y.; Wu, C.; Zhang, Y.; Zhao, S.; Chen, Y.; Deng, Y.; Xuan, A.; Sun, X. The effect of ketogenic diet on behaviors and synaptic functions of naive mice. Brain Behav. 2019, 9, e01246. [Google Scholar] [CrossRef]
- Hernandez, A.R.; Hernandez, C.M.; Campos, K.; Truckenbrod, L.; Federico, Q.; Moon, B.; Mcquail, J.A.; Maurer, A.P.; Bizon, J.L.; Burke, S.N. A Ketogenic Diet Improves Cognition and Has Biochemical Effects in Prefrontal Cortex That Are Dissociable From Hippocampus. Front. Aging Neurosci. 2018, 10, 391. [Google Scholar] [CrossRef]
- Rojas-Morales, P.; Pedraza-Chaverri, J.; Tapia, E. Ketone bodies, stress response, and redox homeostasis. Redox Biol. 2019, 29, 101395. [Google Scholar] [CrossRef]
- Kolb, H.; Kempf, K.; Röhling, M.; Lenzen-Schulte, M.; Schloot, N.C.; Martin, S. Ketone bodies: From enemy to friend and guardian angel. BMC Med. 2021, 19, 313. [Google Scholar] [CrossRef] [PubMed]
- Newman, J.C.; Covarrubias, A.J.; Zhao, M.; Yu, X.; Gut, P.; Ng, C.; Huang, Y.; Haldar, S.; Verdin, E. Ketogenic Diet Reduces Midlife Mortality and Improves Memory in Aging Mice. Cell Metab. 2017, 26, 547–557. [Google Scholar] [CrossRef]
- Roberts, M.N.; Wallace, M.A.; Tomilov, A.A.; Zhou, Z.; Marcotte, G.R.; Tran, D.; Perez, G.; Gutierrez-Casado, E.; Koike, S.; Knotts, T.A.; et al. A Ketogenic Diet Extends Longevity and Healthspan in Adult Mice. Cell Metab. 2017, 26, 539–546. [Google Scholar] [CrossRef] [PubMed]
- Ferrere, G.; Alou, M.T.; Liu, P.; Goubet, A.; Fidelle, M.; Kepp, O.; Durand, S.; Iebba, V.; Fluckiger, A.; Daillère, R.; et al. Ketogenic diet and ketone bodies enhance the anticancer effects of PD-1 blockade. JCI Insight 2021, 6, e145207. [Google Scholar] [CrossRef] [PubMed]
- Ribeiro, L.C.; Chittó, A.L.; Müller, A.P.; Rocha, J.K.; Castro Da Silva, M.; Quincozes-santos, A.; Nardin, P.; Rotta, L.N.; Ziegler, D.R.; Gonçalves, C.; et al. Ketogenic diet-fed rats have increased fat mass and phosphoenolpyruvate carboxykinase activity. Mol. Nutr. Food Res. 2008, 52, 1365–1371. [Google Scholar] [CrossRef]
- Stone, A.A.; Brownell, K.D. The stress-eating paradox: Multiple daily measurements in adult males and females. Psychol. Health 2007, 9, 425–436. [Google Scholar] [CrossRef]
- Joseph, P.V.; Zhou, Y.; Brooks, B.; Mcduffie, C.; Agarwal, K.; Chao, A.M. Relationships among Alcohol Drinking Patterns, Macronutrient Composition, and Caloric Intake: National Health and Nutrition Examination Survey 2017–2018. Alcohol Alcohol. 2022, 57, 559–565. [Google Scholar] [CrossRef]
- Higuera-Sainz, J.L.; Pimentel-Jaimes, J.A.; Mendoza-Catalan, G.S.; Rieke-Campoy, U.; Ponce y Ponce de Leon, G.; Camargo-Bravo, A. Alcohol consumption as a risk factor to acquire overweight and obesity. Ra Ximhai 2017, 13, 53–62. [Google Scholar]
- Golden, S.A.; Covington, H.E.; Berton, O.; Russo, S.J. A standardized protocol for repeated social defeat stress in mice. Nat. Protoc. 2011, 6, 1183–1191. [Google Scholar] [CrossRef]
- González Ibáñez, F.; Halvorson, T.; Sharma, K.; Mckee, C.G.; Carrier, M.; Picard, K.; Vernoux, N.; Bisht, K.; Deslauriers, J.; Lalowski, M.; et al. Ketogenic diet changes microglial morphology and the hippocampal lipidomic profile differently in stress susceptible versus resistant male mice upon repeated social defeat. Brain Behav. Immun. 2023, 114, 383–406. [Google Scholar] [CrossRef] [PubMed]
- Reguilón, M.D.; Ferrer-Pérez, C.; Manzanedo, C.; Miñarro, J.; Rodríguez-Arias, M. Ethanol intake in male mice exposed to social defeat: Environmental enrichment potentiates resilience. Neurobiol. Stress 2021, 15, 100413. [Google Scholar] [CrossRef] [PubMed]
- Taylor, S.E.; Klein, L.C.; Lewis, B.P.; Gruenewald, T.L.; Gurung, R.A.; Updegraff, J.A. Biobehavioral responses to stress in females: Tend-and-befriend, not fight-or-flight. Psychol. Rev. 2000, 107, 411–429. [Google Scholar] [CrossRef] [PubMed]
- Takahashi, A.; Chung, J.R.; Zhang, S.; Zhang, H.; Grossman, Y.; Aleyasin, H.; Flanigan, M.E.; Pfau, M.L.; Menard, C.; Dumitriu, D.; et al. Establishment of a repeated social defeat stress model in female mice. Sci. Rep. 2017, 7, 12838. [Google Scholar] [CrossRef]
- Kim, H.J.; Lee, J.H.; Yun, K.; Kim, J. Alterations in Striatal Circuits Underlying Addiction-Like Behaviors. Mol. Cells 2017, 40, 379–385. [Google Scholar] [CrossRef]
- Lipton, D.M.; Gonzales, B.J.; Citri, A. Dorsal Striatal Circuits for Habits, Compulsions and Addictions. Front. Syst. Neurosci. 2019, 13, 28. [Google Scholar] [CrossRef]
- Ironside, M.; Kumar, P.; Kang, M.; Pizzagalli, D.A. Brain mechanisms mediating effects of stress on reward sensitivity. Curr. Opin. Behav. Sci. 2018, 22, 106–113. [Google Scholar] [CrossRef]
- Larosa, A.; Wong, T.P. The hippocampus in stress susceptibility and resilience: Reviewing molecular and functional markers. Prog. Neuro-Psychopharmacol. Biol. Psychiatry 2022, 119, 10601. [Google Scholar] [CrossRef]
- Avchalumov, Y.; Mandyam, C.D. Plasticity in the Hippocampus, Neurogenesis and Drugs of Abuse. Brain Sci. 2021, 11, 404. [Google Scholar] [CrossRef]
- Masino, S.A.; Kawamura, M.; Wasser, C.D.; Pomeroy, L.T.; Ruskin, D.N. Adenosine, Ketogenic Diet and Epilepsy: The Emerging Therapeutic Relationship Between Metabolism and Brain Activity. Curr. Neuropharmacol. 2009, 7, 257–268. [Google Scholar] [CrossRef]
- Gamelin, F.; Aucouturier, J.; Iannotti, F.A.; Piscitelli, F.; Mazzarella, E.; Aveta, T.; Leriche, M.; Dupont, E.; Cieniewski-Bernard, C.; Leclair, E.; et al. Exercise training and high-fat diet elicit endocannabinoid system modifications in the rat hypothalamus and hippocampus. J. Physiol. Biochem. 2017, 73, 335–347. [Google Scholar] [CrossRef] [PubMed]
- Backström, T.; Winberg, S. Central corticotropin releasing factor and social stress. Front. Neurosci. 2013, 7, 117. [Google Scholar] [CrossRef]
- Maguire, J. The relationship between GABA and stress: ‘it’s complicated’. J. Physiol. 2018, 596, 1781–1782. [Google Scholar] [CrossRef] [PubMed]
- Qiao, Y.; Li, L.; Hu, S.; Yang, Y.; Ma, Z.; Huang, L.; An, Y.; Yuan, Y.; Lin, Y.; Xu, W.; et al. Ketogenic diet-produced β-hydroxybutyric acid accumulates brain GABA and increases GABA/glutamate ratio to inhibit epilepsy. Cell Discov. 2024, 10, 17. [Google Scholar] [CrossRef]
- Kovalenko, I.L.; Smagin, D.A.; Galyamina, A.G.; Orlov, Y.L.; Kudryavtseva, N.N. Changes in the expression of dopaminergic genes in brain structures of male mice exposed to chronic social defeat Stress: An RNA-seq study. Mol. Biol. 2016, 50, 161–163. [Google Scholar] [CrossRef]
- Foll, B.L.; Gallo, A.; Strat, Y.L.; Lu, L.; Gorwood, P. Genetics of dopamine receptors and drug addiction: A comprehensive review. Behav. Pharmacol. 2009, 20, 1–17. [Google Scholar] [CrossRef] [PubMed]
- Franco, R.; Ferré, S.; Agnati, L.; Torvinen, M.; Ginés, S.; Hillion, J.; Casadó, V.; Lledó, P.; Zoli, M.; Lluis, C.; et al. Evidence for Adenosine/Dopamine Receptor Interactions: Indications for Heteromerization. Neuropsychopharmacology 2000, 23, S50–S59. [Google Scholar] [CrossRef]
- Fuxe, K.; Marcellino, D.; Borroto-escuela, D.O.; Guescini, M.; Fernández-dueñas, V.; Tanganelli, S.; Rivera, A.; Ciruela, F.; Agnati, L.F. Adenosine–Dopamine Interactions in the Pathophysiology and Treatment of CNS Disorders. CNS Neurosci. Ther. 2010, 16, 18–42. [Google Scholar] [CrossRef]
- Jonsson, S.; Ericson, M.; Söderpalm, B. Modest Long-Term Ethanol Consumption Affects Expression of Neurotransmitter Receptor Genes in the Rat Nucleus Accumbens. Alcohol. Clin. Exp. Res. 2013, 38, 722–729. [Google Scholar] [CrossRef]
- Kurrikoff, K.; Inno, J.; Matsui, T.; Vasar, E. Stress-induced analgesia in mice: Evidence for interaction between endocannabinoids and cholecystokinin. Eur. J. Neurosci. 2008, 27, 2147–2155. [Google Scholar] [CrossRef]
- Rodriguez-Arias, M.; Navarrete, F.; Blanco-Gandia, M.C.; Arenas, M.C.; Bartoll-Andrés, A.; Aguilar, M.A.; Rubio, G.; Miñarro, J.; Manzanares, J. Social defeat in adolescent mice increases vulnerability to alcohol consumption. Addict. Biol. 2016, 21, 87–97. [Google Scholar] [CrossRef] [PubMed]
- Beltran, N.M. Morphine-Induced Tolerance Is Reduced by the Consumption of a Ketogenic Diet, but Not a High Fat/High Carbohydrate Diet. Master’s Thesis, The University of Texas, El Paso, TX, USA, December 2022. [Google Scholar]
- Pagliusi, M.; Franco, D.; Cole, S.; Morais-Silva, G.; Chandra, R.; Fox, M.E.; Iñiguez, S.D.; Sartori, C.R.; Lobo, M.K. The BDNF-TrkB Pathway Acts Through Nucleus Accumbens D2 Expressing Neurons to Mediate Stress Susceptible Outcomes. Front. Psychiatry 2022, 13, 854494. [Google Scholar] [CrossRef] [PubMed]
- Miyanishi, H.; Muramatsu, S.; Nitta, A. Striatal Shati/Nat8l–BDNF pathways determine the sensitivity to social defeat stress in mice through epigenetic regulation. Neuropsychopharmacology 2021, 46, 1594–1605. [Google Scholar] [CrossRef] [PubMed]
- Marmigère, F.; Givalois, L.; Rage, F.; Arancibia, S.; Tapia-arancibia, L. Rapid induction of BDNF expression in the hippocampus during immobilization stress challenge in adult rats. Hippocampus 2003, 13, 646–655. [Google Scholar] [CrossRef]
- Murakami, S.; Imbe, H.; Morikawa, Y.; Kubo, C.; Senba, E. Chronic stress, as well as acute stress, reduces BDNF mRNA expression in the rat hippocampus but less robustly. Neurosci. Res. 2005, 53, 129–139. [Google Scholar] [CrossRef]
- Sourbron, J.; Thevissen, K.; Lagae, L. The Ketogenic Diet Revisited: Beyond Ketones. Front. Neurol. 2021, 12, 720073. [Google Scholar] [CrossRef]
- Yang, H.; Guo, R.; Wu, J.; Peng, Y.; Xie, D.; Zheng, W.; Huang, X.; Liu, D.; Liu, W.; Huang, L.; et al. The Antiepileptic Effect of the Glycolytic Inhibitor 2-Deoxy-d-Glucose is Mediated by Upregulation of KATP Channel Subunits Kir6.1 and Kir6.2. Neurochem. Res. 2013, 38, 677–685. [Google Scholar] [CrossRef]
- Garriga-Canut, M.; Schoenike, B.; Qazi, R.; Bergendahl, K.; Daley, T.J.; Pfender, R.M.; Morrison, J.F.; Ockuly, J.; Stafstrom, C.; Sutula, T.; et al. 2-Deoxy-D-glucose reduces epilepsy progression by NRSF-CtBP–dependent metabolic regulation of chromatin structure. Nat. Neurosci. 2006, 9, 1382–1387. [Google Scholar] [CrossRef]
- Montagud-Romero, S.; Reguilón, M.D.; Pascual, M.; Blanco-Gandía, M.C.; Guerri, C.; Miñarro, J.; Rodríguez-Arias, M. Critical role of TLR4 in uncovering the increased rewarding effects of cocaine and ethanol induced by social defeat in male mice. Neuropharmacology 2020, 182, 108368. [Google Scholar] [CrossRef] [PubMed]
- Niraula, A.; Witcher, K.G.; Sheridan, J.F.; Godbout, J.P. Interleukin-6 Induced by Social Stress Promotes a Unique Transcriptional Signature in the Monocytes That Facilitate Anxiety. Biol. Psychiatry 2019, 85, 679–689. [Google Scholar] [CrossRef]
- Díez-Solinska, A.; Lebeña, A.; Garmendia, L.; Labaka, A.; Azkona, G.; Perez-Tejada, J.; Vegas, O. Chronic social instability stress down-regulates IL-10 and up-regulates CX3CR1 in tumor-bearing and non-tumor-bearing female mice. Behav. Brain Res. 2022, 435, 114063. [Google Scholar] [CrossRef] [PubMed]
- Marshall, S.A.; Mcclain, J.A.; Kelso, M.L.; Hopkins, D.M.; Pauly, J.R.; Nixon, K. Microglial activation is not equivalent to neuroinflammation in alcohol-induced neurodegeneration: The importance of microglia phenotype. Neurobiol. Dis. 2013, 54, 239–251. [Google Scholar] [CrossRef]
- Suryanarayanan, A.; Carter, J.M.; Landin, J.D.; Morrow, A.L.; Werner, D.F.; Spigelman, I. Role of interleukin-10 (IL-10) in regulation of GABAergic transmission and acute response to ethanol. Neuropharmacology 2016, 107, 181–188. [Google Scholar] [CrossRef]
- Sethuraman, A.; Rao, P.; Pranay, A.; Xu, K.; Lamanna, J.; Puchowicz, M.A. Chronic Ketosis Modulates HIF1α-Mediated Inflammatory Response in Rat Brain. Adv. Exp. Med. Biol. 2022, 1395, 75–79. [Google Scholar] [CrossRef]
- Polito, R.; La Torre, M.E.; Moscatelli, F.; Cibelli, G.; Valenzano, A.; Panaro, M.A.; Monda, M.; Messina, A.; Monda, V.; Pisanelli, D.; et al. The Ketogenic Diet and Neuroinflammation: The Action of Beta-Hydroxybutyrate in a Microglial Cell Line. Int. J. Mol. Sci. 2023, 24, 3102. [Google Scholar] [CrossRef]
- Timberlake, M.; Prall, K.; Roy, B.; Dwivedi, Y. Unfolded protein response and associated alterations in toll-like receptor expression and interaction in the hippocampus of restraint rats. Psychoneuroendocrinology 2018, 89, 185–193. [Google Scholar] [CrossRef]
- Dilimulati, D.; Zhang, F.; Shao, S.; Lv, T.; Lu, Q.; Cao, M.; Jin, Y.; Jia, F.; Zhang, X. Ketogenic Diet Modulates Neuroinflammation via Metabolites from Lactobacillus reuteri After Repetitive Mild Traumatic Brain Injury in Adolescent Mice. Cell Mol. Neurobiol. 2022, 43, 907–923. [Google Scholar] [CrossRef] [PubMed]
- Sun, W.; Wang, Q.; Zhang, R.; Zhang, N. Ketogenic diet attenuates neuroinflammation and induces conversion of M1 microglia to M2 in an EAE model of multiple sclerosis by regulating the NF-κB/NLRP3 pathway and inhibiting HDAC3 and P2X7R activation. Food Funct. 2023, 14, 7247–7269. [Google Scholar] [CrossRef] [PubMed]
- Youm, Y.H.; Nguyen, K.Y.; Grant, R.W.; Goldberg, E.L.; Bodogai, M.; Kim, D.; D’agostino, D.; Planavsky, N.; Lupfer, C.; Kanneganti, T.D.; et al. The ketone metabolite β-hydroxybutyrate blocks NLRP3 inflammasome–mediated inflammatory disease. Nat. Med. 2015, 21, 263–269. [Google Scholar] [CrossRef]


| Gene | Assay Codes |
|---|---|
| DrD1 | Mm02620146 |
| DrD2 | Mm00438545 |
| ADORA1 | Mm01308023 |
| ADORA2 | Mm00802075 |
| Cnr1 | Mm01212171 |
| Crhr1 | Mm00432670 |
| Oprm1 | Mm01188089 |
| β-Glucuronidase | Mm00446953 |
| Gene | Primer Sequences (5′ to 3′) |
|---|---|
| IL-1β | F: GACCCCAAAAGATGAAGGGCT R: TGTGCTGCTGCGAGATTTGA |
| IL-6 | F: AAGCCAGAGTCCTTCAGAGAGA R: TCTTGGTCCTTAGCCACTCCT |
| IL-10 | F: TACCTGGTAGAAGTGATGCC R: CATCATGTATGCTTCTATGC |
| TLR4 | F: TGCCTCTCTTGCATCTGGCTGG R: CTGTCAGTACCAAGGTTGAGAGCTGG |
| BDNF | F: CGCCAAGGTGGATGAGAGTT R: TTCGGCTTTGCTCAGTGGAT |
| TRKB | F: CCACGGATGTTGCTGACCAAAG R: GCCAAACTTGGAATGTCTCGCC |
| Cyclophilin A | F: GTCTCCTTCGAGCTGTTTGC R: GATGCCAGGACCTGTATGCT |
| Gene | Striatum | Hippocampus |
|---|---|---|
| ADORA 1 | No differences | KD increased expression levels |
| DRD1 | VSD reduced expression levels and KD blocks this effect | VSD and KD increased expression levels |
| CNR1 | KD increased expression levels | KD increased expression levels |
| OPRM | VSD reduced expression levels and KD blocks this effect | VSD and KD increased expression levels |
| CRHR1 | KD reduced expression levels | KD reduced expression levels |
| BDNF | VSD increased expression levels and KD blocks this effect | VSD reduced expression levels |
| TrkB | KD decreased expression levels | No differences |
| IL-1β | KD without VSD exposure increased expression levels | VSD reduced expression levels |
| IL-6 | No differences | VSD reduced expression levels |
| IL-10 | VSD reduced expression levels and KD blocks this effect | VSD increased expression levels and KD blocks this effect |
| TLR4 | No differences | VSD increased expression levels and KD blocks this effect |
Disclaimer/Publisher’s Note: The statements, opinions and data contained in all publications are solely those of the individual author(s) and contributor(s) and not of MDPI and/or the editor(s). MDPI and/or the editor(s) disclaim responsibility for any injury to people or property resulting from any ideas, methods, instructions or products referred to in the content. |
© 2024 by the authors. Licensee MDPI, Basel, Switzerland. This article is an open access article distributed under the terms and conditions of the Creative Commons Attribution (CC BY) license (https://creativecommons.org/licenses/by/4.0/).
Share and Cite
Torres-Rubio, L.; Reguilón, M.D.; Mellado, S.; Pascual, M.; Rodríguez-Arias, M. Effects of Ketogenic Diet on Increased Ethanol Consumption Induced by Social Stress in Female Mice. Nutrients 2024, 16, 2814. https://doi.org/10.3390/nu16172814
Torres-Rubio L, Reguilón MD, Mellado S, Pascual M, Rodríguez-Arias M. Effects of Ketogenic Diet on Increased Ethanol Consumption Induced by Social Stress in Female Mice. Nutrients. 2024; 16(17):2814. https://doi.org/10.3390/nu16172814
Chicago/Turabian StyleTorres-Rubio, Laura, Marina D. Reguilón, Susana Mellado, María Pascual, and Marta Rodríguez-Arias. 2024. "Effects of Ketogenic Diet on Increased Ethanol Consumption Induced by Social Stress in Female Mice" Nutrients 16, no. 17: 2814. https://doi.org/10.3390/nu16172814