
Nutrient-Dense African Indigenous Vegetables and Grains in the FAO Food Composition Table for Western Africa (WAFCT) Identified Using Nutrient-Rich Food (NRF) Scores


Abstract
:1. Introduction
2. Materials and Methods
2.1. Nutrient Composition Database
2.2. Nutrient-Rich Food Indices
2.3. Statistical Analysis
3. Results
3.1. Nutrient Density
3.1.1. Nutrient Density of African Indigenous Vegetables (AIVs)
3.1.2. Nutrient Density of African Indigenous Grains (AIG)
4. Discussion
5. Conclusions
Author Contributions
Funding
Data Availability Statement
Acknowledgments
Conflicts of Interest
Appendix A

| Food Group | Examples |
|---|---|
| Vegetables | Cabbage, carrot, eggplant, onion, pepper, tomato, wild spinach |
| African indigenous vegetables | Amaranth leaves, spider plant, jute mallow, cowpea leaves, native eggplant, pumpkin leaves, moringa, sweet potato leaves, okra leaves |
| Cereals (non-indigenous grains) | Maize, wheat, rice, oats, bread |
| African indigenous grains | Fonio, pearl millet, teff, sorghum, native rice |
| Fish and seafood | African carp, anchovy, Atlantic cod, barracuda, bayad, catfish, mackerel, mahi mahi, mola carpet, perch, shrimp, tilapia, tuna |
| Meat and poultry | Beef kidney, beef liver, beef meat, camel meat, chicken giblets, chicken liver, chicken meat, game meat, goat meat, lamb meat, ostrich meat, pork meat, rabbit meat |
| Eggs | Chicken eggs, duck eggs, quail eggs, turkey eggs |
| Fruits | Apple, avocado, African black plum, banana, dates, figs, guava, mango, Orange, pineapple, tamarind, watermelon |
| Soups and sauces | Curry sauce with beef meat, fish and vegetable soup, clear sauce with fish, chicken soup |
| Beverages | Fruit juice, ovaltine, fruit nectar, soybean milk, teas |
| Legumes | African locust bean, Bambara groundnut, white beans, cowpeas, ground beans, lentils, soya beans |
| Milk and its products | Cow milk, cheese, camel milk, yoghurt |
| Nuts and seeds | Cashew nut, cola nut, bitter cola seeds, groundnut, hibiscus seed, melon seeds, pumpkin seeds, sesame seeds |
| Starchy roots, and tubers | Cassava, cocoyam, plantain, sweet potato, potato, water yam |
| Fats and oils | Butter, coconut oil, corn oil, cottonseed oil, groundnut oil, margarine, palm oil, soya oil, sunflower oil, vegetable oil |
| Miscellaneous | Honey, jam, sugar, sweets, vinegar |
References
- Von Grebmer, K.; Saltzman, A.; Birol, E.; Wiesmann, D.; Prasai, N.; Yin, S.; Yohannes, Y.; Menon, P.; Thompson, J.; Sonntag, A. 2014 Global Hunger Index: The Challenge of Hidden Hunger; Welthungerhilfe, International Food Policy Research Institute, and Concern Worldwide: Bonn, Germany; Washington, DC, USA; Dublin, Ireland, 2014; Available online: https://ebrary.ifpri.org/utils/getfile/collection/p15738coll2/id/128360/filename/128571.pdf (accessed on 1 August 2024).
- Stevens, G.A.; Beal, T.; Mbuya, M.N.N.; Luo, H.; Neufeld, L.M.; Addo, O.Y.; Adu-Afarwuah, S.; Alayón, S.; Bhutta, Z.; Brown, K.H.; et al. Micronutrient Deficiencies among Preschool-Aged Children and Women of Reproductive Age Worldwide: A Pooled Analysis of Individual-Level Data from Population-Representative Surveys. Lancet Glob. Health 2022, 10, e1590–e1599. [Google Scholar] [CrossRef] [PubMed]
- Beal, T.; Ortenzi, F. Priority Micronutrient Density in Foods. Front. Nutr. 2022, 9, 806566. [Google Scholar] [CrossRef]
- Beal, T.; Massiot, E.; Arsenault, J.E.; Smith, M.R.; Hijmans, R.J. Global Trends in Dietary Micronutrient Supplies and Estimated Prevalence of Inadequate Intakes. PLoS ONE 2017, 12, e0175554. [Google Scholar] [CrossRef]
- Nair, M.K.; Augustine, L.F.; Konapur, A. Food-Based Interventions to Modify Diet Quality and Diversity to Address Multiple Micronutrient Deficiency. Front. Public Health 2016, 3, 277. [Google Scholar] [CrossRef] [PubMed]
- Lowe, N.M. The Global Challenge of Hidden Hunger: Perspectives from the Field. Proc. Nutr. Soc. 2021, 80, 283–289. [Google Scholar] [CrossRef]
- Food and Agriculture Organization of the United Nations. Minimum Dietary Diversity for Women: An Updated Guide to Measurement—From Collection to Action; FAO: Rome, Italy, 2021; ISBN 978-92-5-133993-0. [Google Scholar]
- Gómez, G.; Nogueira Previdelli, Á.; Fisberg, R.M.; Kovalskys, I.; Fisberg, M.; Herrera-Cuenca, M.; Cortés Sanabria, L.Y.; Yépez García, M.C.; Rigotti, A.; Liria-Domínguez, M.R.; et al. Dietary Diversity and Micronutrients Adequacy in Women of Childbearing Age: Results from ELANS Study. Nutrients 2020, 12, 1994. [Google Scholar] [CrossRef] [PubMed]
- Adubra, L.; Savy, M.; Fortin, S.; Kameli, Y.; Kodjo, N.E.; Fainke, K.; Mahamadou, T.; Le Port, A.; Martin-Prevel, Y. The Minimum Dietary Diversity for Women of Reproductive Age (MDD-W) Indicator Is Related to Household Food Insecurity and Farm Production Diversity: Evidence from Rural Mali. Curr. Dev. Nutr. 2019, 3, nzz002. [Google Scholar] [CrossRef]
- Food and Agriculture Organization of the United Nations. Food-Based Dietary Guidelines. Available online: http://www.fao.org/nutrition/education/food-dietary-guidelines/home/en/ (accessed on 1 August 2024).
- Ministry of Food and Agriculture; University of Ghana School of Public Health. Food-Based Dietary Guidelines; Ministry of Food and Agriculture: Accra, Ghana, 2023. Available online: https://res.cloudinary.com/dltpgmjmq/image/upload/q_auto:good/user-media-prod/Ghana_Food-Based_Dietary_Guidelines_2023_tcaeqt (accessed on 1 August 2024).
- Ministry of Agriculture, Forestry and Food Security; Ministry of Health and Sanitation Sierra Leone. Food-Based Dietary Guidelines for Healthy Eating. Available online: http://www.fao.org/nutrition/education-nutritionnelle/food-dietary-guidelines/regions/sierra-leone/fr/ (accessed on 1 August 2024).
- Federal Ministry of Health. Food-Based Dietary Guidelines for Nigeria. Available online: http://www.fao.org/nutrition/educacion-nutricional/food-dietary-guidelines/regions/nigeria/es/ (accessed on 1 August 2024).
- Regional Institute of Public Health of Ouidah. Guide Alimentaire Du Bénin. Available online: http://www.fao.org/nutrition/education/food-dietary-guidelines/regions/benin/en/ (accessed on 1 August 2024).
- Drewnowski, A.; Maillot, M.; Darmon, N. Testing Nutrient Profile Models in Relation to Energy Density and Energy Cost. Eur. J. Clin. Nutr. 2009, 63, 674–683. [Google Scholar] [CrossRef]
- WHO Regional Office for Africa. Nutrient Profile Model for the WHO African Region: A Tool for Implementing WHO Recommendations on the Marketing of Foods and Non-Alcoholic Beverages to Children; WHO: Brazzaville, Congo, 2018; Available online: https://www.who.int/publications-detail-redirect/9789290234401 (accessed on 1 August 2024).
- Drewnowski, A.; Amanquah, D.; Gavin-Smith, B. Perspective: How to Develop Nutrient Profiling Models Intended for Global Use: A Manual. Adv. Nutr. 2021, 12, 609–620. [Google Scholar] [CrossRef]
- World Health Organization. Nutrient Profiling: Report of a WHO/IASO Technical Meeting, London, United Kingdom 4-6 October 2010; World Health Organization: Geneva, Switzerland, 2011; ISBN 978-92-4-150220-7. [Google Scholar]
- Fulgoni, V.L.; Keast, D.R.; Drewnowski, A. Development and Validation of the Nutrient-Rich Foods Index: A Tool to Measure Nutritional Quality of Foods. J. Nutr. 2009, 139, 1549–1554. [Google Scholar] [CrossRef]
- Vincent, A.; Grande, F.; Campaoré, E.; Amponsah Annor, G.; Addy, P.; Chinelo Aburime, L.; Ahmed, D.; Bih Loh, A.M.; Dahdouh Cabia, S.; Deflache, N.; et al. FAO/INFOODS Food Composition Table for Western Africa (2019) User Guide & Condensed Food Composition Table; FAO: Rome, Italy, 2020; Available online: https://www.fao.org/3/ca7779b/CA7779B.PDF (accessed on 1 August 2024).
- U.S. Department of Agriculture. USDA Food and Nutrient Database for Dietary Studies 2017–2018; U.S. Department of Agriculture: Washington, DC, USA, 2018. Available online: https://www.ars.usda.gov/ARSUserFiles/80400530/pdf/fndds/2017_2018_FNDDS_Doc.pdf (accessed on 1 August 2024).
- Wanselius, J.; Axelsson, C.; Moraeus, L.; Berg, C.; Mattisson, I.; Larsson, C. Procedure to Estimate Added and Free Sugars in Food Items from the Swedish Food Composition Database Used in the National Dietary Survey Riksmaten Adolescents 2016–17. Nutrients 2019, 11, 1342. [Google Scholar] [CrossRef]
- Drewnowski, A. The Nutrient Rich Foods Index Helps to Identify Healthy, Affordable Foods. Am. J. Clin. Nutr. 2010, 91, 1095S–1101S. [Google Scholar] [CrossRef] [PubMed]
- Lewis, J. Codex Nutrient Reference Values; FAO; WHO: Rome, Italy, 2019; ISBN 978-92-5-131957-4. [Google Scholar]
- Linus Pauling Institute. Micronutrient Inadequacies in the US Population: An Overview. Available online: https://lpi.oregonstate.edu/mic/micronutrient-inadequacies/overview (accessed on 1 August 2024).
- Shelef, O.; Weisberg, P.J.; Provenza, F.D. The Value of Native Plants and Local Production in an Era of Global Agriculture. Front. Plant Sci. 2017, 8, 2069. [Google Scholar] [CrossRef]
- Merchant, E.V.; Odendo, M.; Ndinya, C.; Nyabinda, N.; Maiyo, N.; Downs, S.; Hoffman, D.J.; Simon, J.E. Barriers and Facilitators in Preparation and Consumption of African Indigenous Vegetables: A Qualitative Exploration From Kenya. Front. Sustain. Food Syst. 2022, 6, 801527. [Google Scholar] [CrossRef]
- Chivenge, P.; Mabhaudhi, T.; Modi, A.T.; Mafongoya, P. The Potential Role of Neglected and Underutilised Crop Species as Future Crops under Water Scarce Conditions in Sub-Saharan Africa. Int. J. Environ. Res. Public Health 2015, 12, 5685–5711. [Google Scholar] [CrossRef] [PubMed]
- Simon, J.; Weller, S.; Hoffman, D.; Govindasamy, R.; Morin, X.; Merchant, E.; Dinssa, F.; Wyk, E.V.; Byrnes, D.; Odendo, M.; et al. Improving Income and Nutrition of Smallholder Farmers in Eastern Africa Using a Market-First Science-Driven Approach to Enhance Value Chain Production of African Indigenous Vegetables. J. Med. Act. Plants 2020, 9, 289–309. [Google Scholar] [CrossRef]
- Galbete, C.; Nicolaou, M.; Meeks, K.A.; de-Graft Aikins, A.; Addo, J.; Amoah, S.K.; Smeeth, L.; Owusu-Dabo, E.; Klipstein-Grobusch, K.; Bahendeka, S.; et al. Food Consumption, Nutrient Intake, and Dietary Patterns in Ghanaian Migrants in Europe and Their Compatriots in Ghana. Food Nutr. Res. 2017, 61, 1341809. [Google Scholar] [CrossRef]
- National Research Council. Lost Crops of Africa: Volume I: Grains; National Academies Press: Washington, DC, USA, 1996; ISBN 978-0-309-04990-0. [Google Scholar]
- Held, L. Is Fonio the Ancient Grain of the Future? Available online: https://civileats.com/2021/01/04/is-fonio-the-ancient-grain-of-the-future/ (accessed on 1 August 2024).
- Whole Grains Council. Whole Grains and the African Heritage Diet. Available online: https://wholegrainscouncil.org/blog/2018/02/whole-grains-and-african-heritage-diet (accessed on 1 August 2024).
- Samuels, R. Different Types of African Indigenous Grains. Available online: https://crushmag-online.com/different-types-of-african-indigenous-grains/ (accessed on 1 August 2024).
- Beal, T.; Gardner, C.D.; Herrero, M.; Iannotti, L.L.; Merbold, L.; Nordhagen, S.; Mottet, A. Friend or Foe? The Role of Animal-Source Foods in Healthy and Environmentally Sustainable Diets. J. Nutr. 2023, 153, 409–425. [Google Scholar] [CrossRef]
- Food and Agriculture Organization of the United Nations. Contribution of Terrestrial Animal Source Food to Healthy Diets for Improved Nutrition and Health Outcomes: An Evidence and Policy Overview on the State of Knowledge and Gaps; FAO: Rome, Italy, 2023; Available online: http://www.fao.org/documents/card/en/c/cc3912en (accessed on 1 August 2024).
- Tigchelaar, M.; Leape, J.; Micheli, F.; Allison, E.H.; Basurto, X.; Bennett, A.; Bush, S.R.; Cao, L.; Cheung, W.W.L.; Crona, B.; et al. The Vital Roles of Blue Foods in the Global Food System. Glob. Food Secur. 2022, 33, 100637. [Google Scholar] [CrossRef]
- Xu, X.; Sharma, P.; Shu, S.; Lin, T.-S.; Ciais, P.; Tubiello, F.N.; Smith, P.; Campbell, N.; Jain, A.K. Global Greenhouse Gas Emissions from Animal-Based Foods Are Twice Those of Plant-Based Foods. Nat. Food 2021, 2, 724–732. [Google Scholar] [CrossRef]
- Hedenus, F.; Wirsenius, S.; Johansson, D.J.A. The Importance of Reduced Meat and Dairy Consumption for Meeting Stringent Climate Change Targets. Clim. Change 2014, 124, 79–91. [Google Scholar] [CrossRef]
- Milman, O. Why Eating Less Meat Is the Best Thing You Can Do for the Planet in 2019. Available online: https://www.theguardian.com/environment/2018/dec/21/lifestyle-change-eat-less-meat-climate-change (accessed on 1 August 2024).
- Greenpeace. Eating Less Meat, More Plants Helps the Environment. Available online: https://www.greenpeace.org/usa/sustainable-agriculture/eco-farming/eat-more-plants/#:~:text=But%20we%20all%20must%20develop,caused%20by%20industrial%20livestock%20production (accessed on 1 August 2024).
- Willett, W.; Rockström, J.; Loken, B.; Springmann, M.; Lang, T.; Vermeulen, S.; Garnett, T.; Tilman, D.; DeClerck, F.; Wood, A.; et al. Food in the Anthropocene: The EAT–Lancet Commission on Healthy Diets from Sustainable Food Systems. Lancet 2019, 393, 447–492. [Google Scholar] [CrossRef]
- Haddad, L. Eat Less Meat: If Only It Were That Simple. Available online: https://www.rural21.com/english/opinion-corner/detail/article/eat-less-meat-if-only-it-were-that-simple.html (accessed on 1 August 2024).
- De Bruyn, J.; Ferguson, E.; Allman-Farinelli, M.; Darnton-Hill, I.; Maulaga, W.; Msuya, J.; Alders, R. Food Composition Tables in Resource-Poor Settings: Exploring Current Limitations and Opportunities, with a Focus on Animal-Source Foods in Sub-Saharan Africa. Br. J. Nutr. 2016, 116, 1709–1719. [Google Scholar] [CrossRef]
- Drewnowski, A. Uses of Nutrient Profiling to Address Public Health Needs: From Regulation to Reformulation. Proc. Nutr. Soc. 2017, 76, 220–229. [Google Scholar] [CrossRef] [PubMed]
- Reardon, T.; Tschirley, D.; Liverpool-Tasie, L.S.O.; Awokuse, T.; Fanzo, J.; Minten, B.; Vos, R.; Dolislager, M.; Sauer, C.; Dhar, R.; et al. The Processed Food Revolution in African Food Systems and the Double Burden of Malnutrition. Glob. Food Secur. 2021, 28, 100466. [Google Scholar] [CrossRef] [PubMed]
- Masters, W.A.; Bai, Y.; Herforth, A.; Sarpong, D.B.; Mishili, F.; Kinabo, J.; Coates, J.C. Measuring the Affordability of Nutritious Diets in Africa: Price Indexes for Diet Diversity and the Cost of Nutrient Adequacy. Am. J. Agric. Econ. 2018, 100, 1285–1301. [Google Scholar] [CrossRef]
- Bai, Y.; Alemu, R.; Block, S.A.; Headey, D.; Masters, W.A. Cost and Affordability of Nutritious Diets at Retail Prices: Evidence from 177 Countries. Food Policy 2021, 99, 101983. [Google Scholar] [CrossRef]
- Mendoza-Velázquez, A.; Guzmán-Rodríguez, M.; Lara-Arévalo, J.; Drewnowski, A. The Nutrient Rich Food Price Index: A Nutrition-Relevant Adaptation of the Laspeyres Price Index to Track the Cost of Affordable Nutrient Density. Front. Nutr. 2023, 10, 1107573. [Google Scholar] [CrossRef]
- Han, X.; Ding, S.; Lu, J.; Li, Y. Global, Regional, and National Burdens of Common Micronutrient Deficiencies from 1990 to 2019: A Secondary Trend Analysis Based on the Global Burden of Disease 2019 Study. eClinicalMedicine 2022, 44, 101299. [Google Scholar] [CrossRef]
- UN Network for SUN Compendium of Actions for Nutrition—UNSCN. Available online: https://www.unscn.org/en/unscn-publications?idnews=1384 (accessed on 1 August 2024).
| Nutrients to Encourage | Reference Daily Values * |
|---|---|
| Protein (g) | 50 |
| Fiber (g) | 25 |
| Vitamin A (RAE) | 800 |
| Vitamin C (mg) | 100 |
| Vitamin D (mcg) | 15 |
| Calcium (mg) | 1000 |
| Iron (mg) | 14 |
| Potassium (mg) | 3500 |
| Magnesium (mg) | 310 |
| Zinc (mg) | 11 |
| Folate (mcg) | 400 |
| Copper (mcg) | 900 |
| Vitamin B1 (mg) | 1.2 |
| Vitamin B2 (mg) | 1.2 |
| Vitamin B3 (mg NE) | 15 |
| Vitamin B6 (mg) | 1.3 |
| Vitamin B12 (mcg) | 2.4 |
| Nutrients to limit | Maximum recommended values |
| Saturated fat (g) | 20 |
| Added sugars (g) | 50 |
| Sodium (mg) | 2000 |
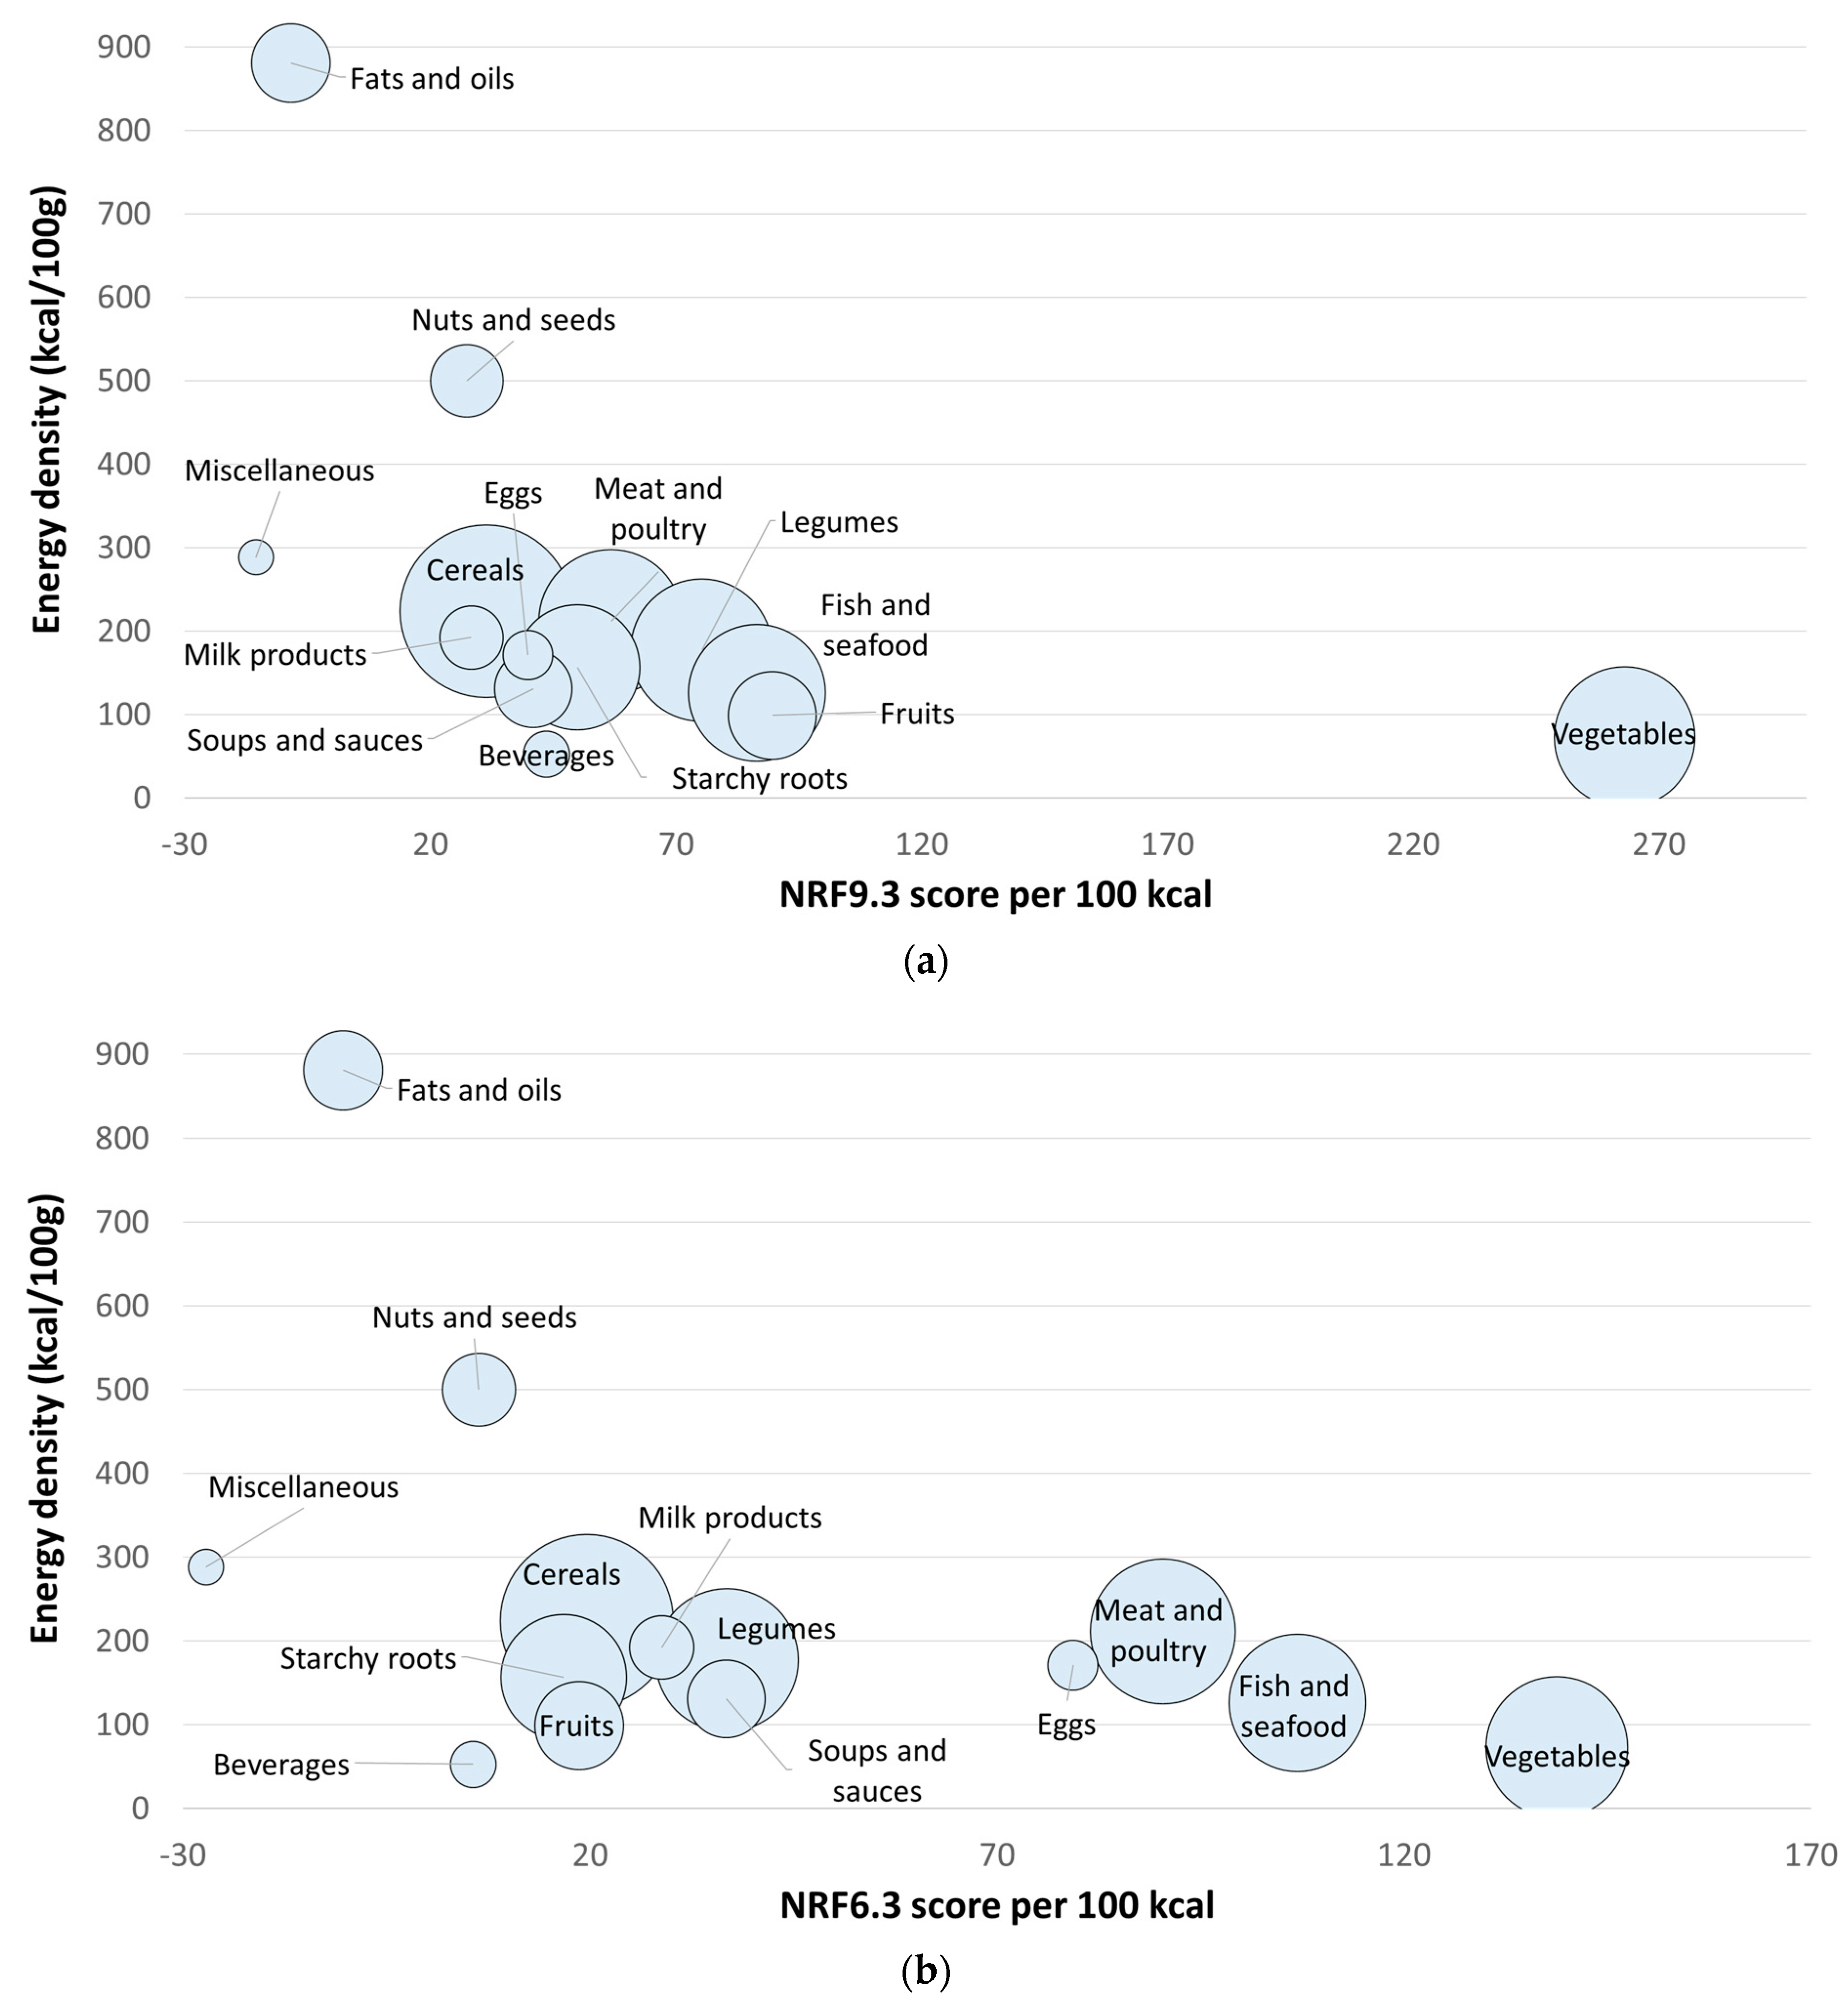
| WAFCT Food Groups | No. of Foods | Kcal/100 g | NRF9.3 Scores | ||
|---|---|---|---|---|---|
| Mean 1 | SD | Median | |||
| Vegetables | 113 | 73 | 263 a | 123 | 234 |
| Dark green leafy vegetables | 59 | 62 | 344 | 105 | 360 |
| Other vit. A-rich vegetables | 12 | 37 | 187 | 38 | 194 |
| Other vegetables | 42 | 97 | 171 | 72 | 162 |
| Fruits | 44 | 99 | 90 b | 58 | 88 |
| Vit. A-rich fruits | 8 | 59 | 119 | 47 | 126 |
| Other fruits | 36 | 108 | 83 | 59 | 65 |
| Fish and seafood | 106 | 126 | 86 b | 41 | 78 |
| Legumes | 115 | 177 | 75 c | 11 | 77 |
| Meat and poultry | 118 | 211 | 57 d | 57 | 41 |
| Starchy roots, and tubers | 89 | 157 | 50 d | 28 | 47 |
| Beverages | 12 | 53 | 44 d,e | 48 | 60 |
| Soups and sauces | 34 | 131 | 41 d | 30 | 35 |
| Eggs | 14 | 171 | 40 d | 8 | 40 |
| Cereals | 169 | 224 | 31 e | 24 | 33 |
| Milk and its products | 23 | 192 | 28 e | 25 | 29 |
| Nuts and seeds | 30 | 500 | 27 e | 20 | 28 |
| Fats and oils | 35 | 881 | −8 f | 21 | −8 |
| Miscellaneous | 7 | 288 | −15 f | 27 | −15 |
| p | <0.001 | ||||
| WAFCT Food Groups | No. of Foods | Kcal/100 g | Mean NRF6.3 Scores 1 | ||
|---|---|---|---|---|---|
| Mean 1 | SD | Median | |||
| Vegetables | 113 | 73 | 139 a | 92 | 121 |
| Dark green leafy vegetables | 59 | 62 | 202 | 76 | 206 |
| Other vit. A-rich vegetables | 12 | 37 | 80 | 33 | 65 |
| Other vegetables | 42 | 97 | 67 | 52 | 52 |
| Fish and seafood | 106 | 126 | 107 b | 56 | 111 |
| Meat and poultry | 118 | 211 | 90 c | 100 | 61 |
| Eggs | 14 | 171 | 79 c | 35 | 67 |
| Legumes | 115 | 177 | 37 d | 13 | 36 |
| Soups and sauces | 34 | 131 | 37 d,e | 37 | 34 |
| Milk and its products | 23 | 192 | 29 e,f,j | 27 | 26 |
| Cereals | 169 | 224 | 20 f,j | 22 | 16 |
| Fruits | 44 | 99 | 19 f | 24 | 20 |
| Vit. A-rich fruits | 8 | 59 | 45 | 16 | 43 |
| Other fruits | 36 | 108 | 13 | 22 | 12 |
| Starchy roots, and tubers | 89 | 157 | 17 f,j | 22 | 14 |
| Nuts and seeds | 30 | 500 | 6 g | 17 | 7 |
| Beverages | 12 | 53 | 6 g,j | 50 | −4 |
| Fats and oils | 35 | 881 | −10 h | 18 | −8 |
| Miscellaneous | 7 | 288 | −27 i | 27 | −28 |
| p | <0.001 | ||||
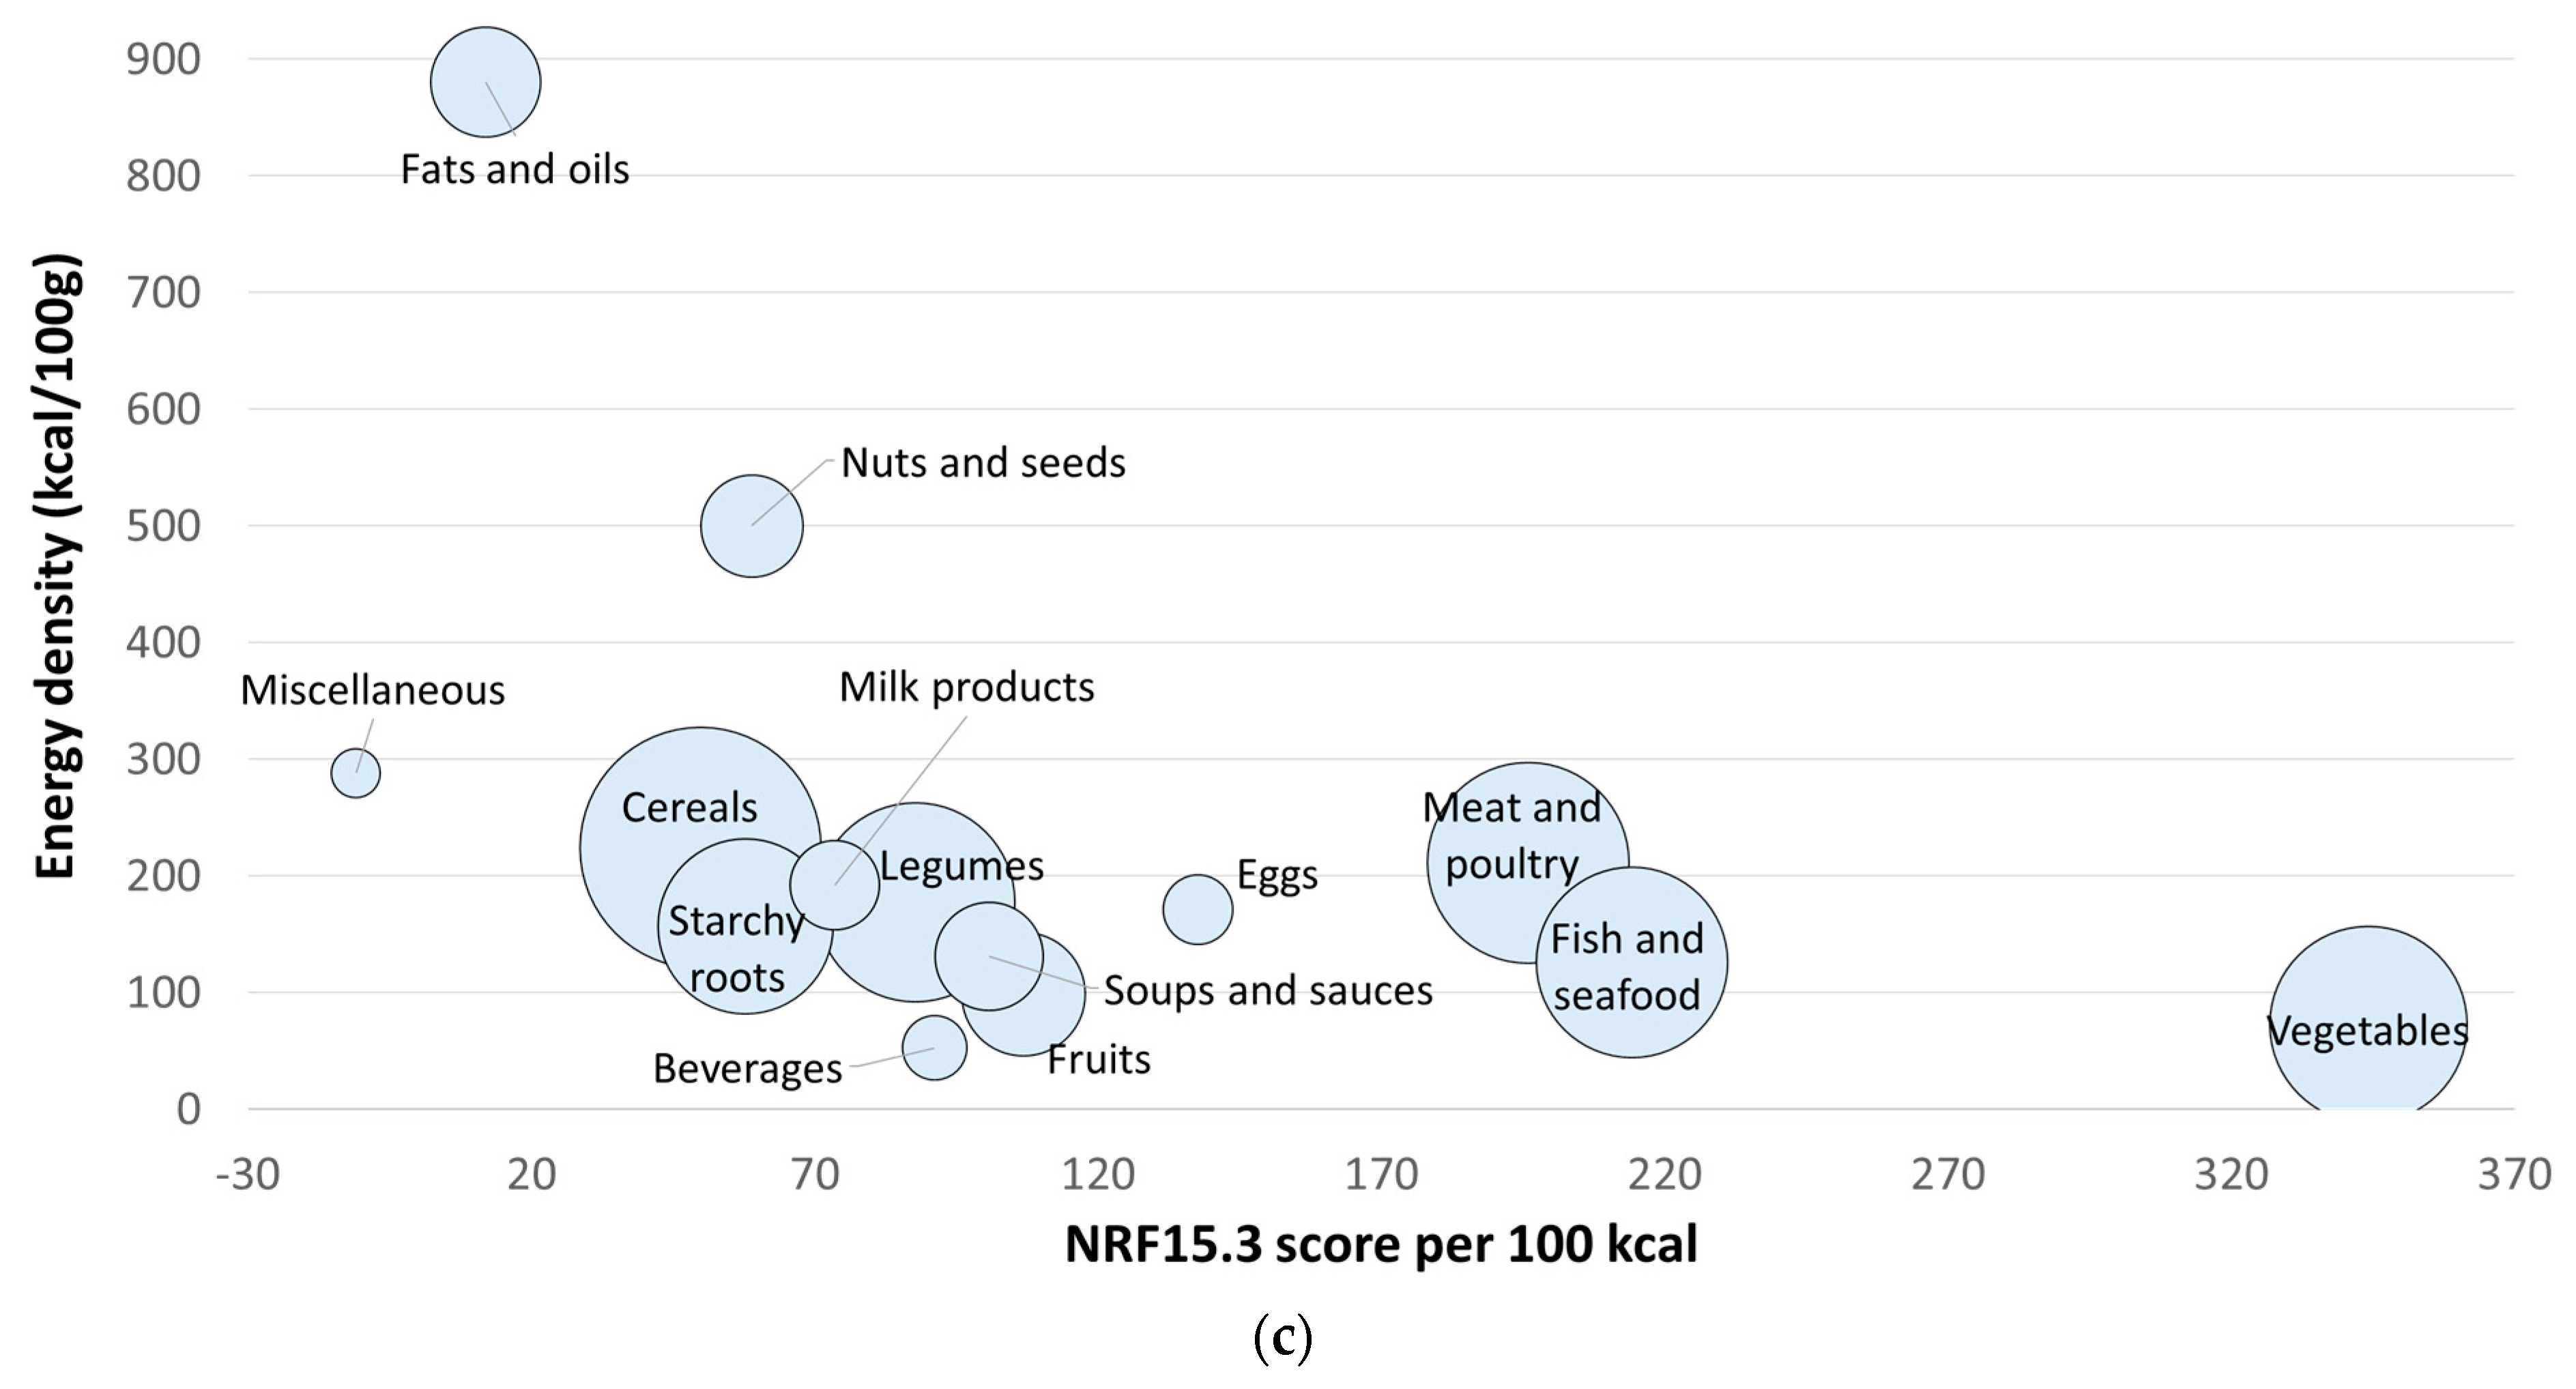
| WAFCT Food Groups | No. of Foods | Kcal/100 g | Mean NRF15.3 Scores | ||
|---|---|---|---|---|---|
| Mean 1 | SD | NRF15.3 | |||
| Vegetables | 113 | 73 | 344 a | 179 | 296 |
| Dark green leafy vegetables | 59 | 62 | 452 | 163 | 446 |
| Other vit. A-rich vegetables | 12 | 37 | 251 | 55 | 266 |
| Other vegetables | 42 | 97 | 220 | 116 | 219 |
| Fish and seafood | 106 | 126 | 214 b | 73 | 211 |
| Meat and poultry | 118 | 211 | 196 b,c | 160 | 151 |
| Eggs | 14 | 171 | 138 c,d,j | 32 | 126 |
| Fruits | 44 | 99 | 107 d,e,j | 74 | 98 |
| Vit. A-rich fruits | 8 | 59 | 148 | 42 | 154 |
| Other fruits | 36 | 108 | 98 | 76 | 83 |
| Soups and sauces | 34 | 131 | 101 e,j | 47 | 94 |
| Beverages | 12 | 53 | 91 j | 90 | 88 |
| Legumes | 115 | 177 | 88 f,j | 21 | 88 |
| Milk and its products | 23 | 192 | 73 g,j | 47 | 66 |
| Nuts and seeds | 30 | 500 | 59 g,h,j | 33 | 69 |
| Starchy roots, and tubers | 89 | 157 | 58 g,h | 30 | 52 |
| Cereals | 169 | 224 | 50 h | 34 | 47 |
| Fats and oils | 35 | 881 | 12 i | 33 | 12 |
| Miscellaneous | 7 | 288 | −11 i | 32 | −14 |
| p | <0.001 | ||||
| Ranking | Highest NRF9.3 Scores | Highest NRF6.3 Scores | Highest NRF15.3 Scores |
|---|---|---|---|
| 1 | Amaranth, leaves, raw | Chicken liver, raw | Spinach, leaves, raw |
| 2 | Amaranth, leaves, boiled | Chicken liver, stewed | Cowpea, leaves, raw |
| 3 | Spinach, leaves, raw | Chicken liver, boiled | Spinach, leaves, boiled |
| 4 | Spider plant, leaves, raw | Chicken liver, grilled (without salt or fat) | Cowpea, leaves, boiled |
| 5 | Spinach, leaves, boiled | Spider plant, leaves, raw | Spider plant, leaves, raw |
| 6 | Cowpea, leaves, raw | Spider plant, leaves, boiled | Spider plant, leaves, boiled |
| 7 | Spider plant, leaves, boiled | Amaranth, leaves, raw | Chicken liver, raw |
| 8 | Jute mallow (bush-okra), leaves, raw | Chicken giblets, grilled (without salt or fat) | Amaranth, leaves, fresh, raw |
| 9 | Mint, leaves, raw | Beef liver, raw | Jute mallow (bush-okra), leaves, raw |
| 10 | Cowpea, leaves, boiled | Mint, leaves, raw | Chicken liver, stewed |
| 11 | Moringa (drumstick), leaves, boiled | Chicken giblets, raw | Amaranth, leaves, boiled |
| 12 | Moringa (drumstick), leaves, raw | Amaranth, leaves, fresh, boiled | Chicken liver, grilled (without salt or fat) |
| 13 | Jute mallow (bush-okra), leaves, boiled | Eggplant, leaves, raw | Moringa (drumstick), leaves, raw |
| 14 | Eggplant, leaves, raw | Spider plant, leaves, boiled | Moringa (drumstick), leaves, boiled |
| 15 | Eggplant, leaves, boiled | Cowpea, leaves, raw | Beef liver, raw |
| 16 | Green leafy vegetable, average, raw | Beef liver, grilled (without salt or fat) | Chicken liver, boiled (without salt) |
| 17 | Pumpkin, leaves, raw | Beef liver, stewed | Spinach, leaves, boiled |
| 18 | Moringa (drumstick), leaves, boiled (without salt) | Chicken giblets, boiled | Eggplant, leaves, raw |
| 19 | Parsley, raw | Spinach, leaves, raw | Cowpea, leaves, fresh, boiled |
| 20 | Pumpkin, leaves, boiled | Mola carplet, small whole fish, raw | Beef liver, stewed |
| African Indigenous Food Groups | No. of Foods | Kcal/100 g | Mean (SD) NRF Score | Protein g/100 g Mean (SD) | ||
|---|---|---|---|---|---|---|
| NRF9.3 | NRF6.3 | NRF15.3 | ||||
| African indigenous vegetables (AIV) | 25 | 46 | 339 (111) | 198 (85) | 451 (168) | 3.8 (1.8) |
| Preparations with AIVs | 18 | 73 | 228 (187) | 133 (108) | 324 (234) | 4.2 (1.8) |
| Non-indigenous vegetables | 68 | 54 | 227 (110) | 111 (83) | 292 (158) | 2.9 (2.1) |
| p-value | <0.001 * | <0.001 * | 0.001 * | <0.001 * | ||
| African indigenous grains (AIGs) | 55 | 260 | 43 (19) | 29 (11) | 62 (20) | — |
| Non-indigenous grains | 55 | 278 | 30 (21) | 23 (25) | 56 (43) | — |
| p-value | 0.60 | 0.001 * | 0.33 | 0.42 | — | |
| Non-indigenous grains (without fortified flours) | 45 | 261 | 30 (23) | 13 (8) | 44 (32) | — |
| p-value ** | 0.97 | 0.002 * | <0.001 * | 0.001 * | — | |
Disclaimer/Publisher’s Note: The statements, opinions and data contained in all publications are solely those of the individual author(s) and contributor(s) and not of MDPI and/or the editor(s). MDPI and/or the editor(s) disclaim responsibility for any injury to people or property resulting from any ideas, methods, instructions or products referred to in the content. |
© 2024 by the authors. Licensee MDPI, Basel, Switzerland. This article is an open access article distributed under the terms and conditions of the Creative Commons Attribution (CC BY) license (https://creativecommons.org/licenses/by/4.0/).
Share and Cite
Lara-Arevalo, J.; Laar, A.; Chaparro, M.P.; Drewnowski, A. Nutrient-Dense African Indigenous Vegetables and Grains in the FAO Food Composition Table for Western Africa (WAFCT) Identified Using Nutrient-Rich Food (NRF) Scores. Nutrients 2024, 16, 2985. https://doi.org/10.3390/nu16172985
Lara-Arevalo J, Laar A, Chaparro MP, Drewnowski A. Nutrient-Dense African Indigenous Vegetables and Grains in the FAO Food Composition Table for Western Africa (WAFCT) Identified Using Nutrient-Rich Food (NRF) Scores. Nutrients. 2024; 16(17):2985. https://doi.org/10.3390/nu16172985
Chicago/Turabian StyleLara-Arevalo, Jonathan, Amos Laar, M. Pia Chaparro, and Adam Drewnowski. 2024. "Nutrient-Dense African Indigenous Vegetables and Grains in the FAO Food Composition Table for Western Africa (WAFCT) Identified Using Nutrient-Rich Food (NRF) Scores" Nutrients 16, no. 17: 2985. https://doi.org/10.3390/nu16172985